Communication

Quantitative Correlation between Adsorbed and Condensed Water Mass with Response Galvanic Current Detected at the Micron Gap of Galvanic-Coupled Arrays

Electric and Electronic Materials Fields, Electrochemical Sensors Group, Research Center for Functional Materials, 1-1 Namiki, Tsukuba 305-0044, Japan
*
Author to whom correspondence should be addressed.
Chemosensors 2022, 10(8), 300; https://doi.org/10.3390/chemosensors10080300
Submission received: 12 July 2022 / Revised: 27 July 2022 / Accepted: 29 July 2022 / Published: 30 July 2022
(This article belongs to the Section Applied Chemical Sensors)

Abstract

:
Sensor surfaces with micron- and nano-gap scales possess high surface-to-volume ratio which greatly affects their contribution towards water adsorption and condensation. However, the quantitative relationship between adsorbed water molecules and condensed water droplets remains unclear. In this study, we used the humidity-based detected galvanic current within the micron gaps of our newly developed moisture sensor chip (MSC) to emphasize the quantitative relationship between adsorbed water molecules and condensed water droplets. The mass of adsorbed water molecules was detected using a quartz-crystal-microbalance electrode (QCM) whereas the mass of condensed water droplets was estimated microscopically based on their occupying volumes at MSC surface. Experimental results demonstrated that the minimum detection limit of MSC under these experimental conditions was ~150 ng/cm2 for adsorbed water molecules and ~700 ng/ cm2 for condensed water droplets. The detected-response galvanic current arises when a water bridges between two adjacent arrays is found to be linearly correlated to the adsorbed and/or the condensed water’s mass. Such correlation is believed to provide a feasible long-range sensor that can distinguish the status of its surface-existing water either in adsorbed molecular or condensed droplet-wise regimes.

1. Introduction

Detection and control of environmental-relative humidity are unquestionably mandatory for numerous vital fields such as agriculture [1], nutrition [2], pharmaceutics [3], and many other industries [4,5]. In these fields, the dynamic equilibrium between the environmental water layer and water vapor plays a key role emphasizing the chemistry at the surfaces of solid detection fields [6,7]. On the one hand, adsorbed environmental water is employed mainly in the surface catalytic reactions [8,9]. On the other hand, condensation of environmental water vapor is employed in water harvesting [10,11], dehumidification [12], distillation/desalination [13], and building heating and cooling technological systems [14]. Both can be detected by numerous techniques or sensors. However, sensors that can distinguish between adsorbed and condensed water are rarely reported [15,16,17]. Nevertheless, no quantitative detection was reported and it is quite rare to find a humidity sensor possessing the long detection range of both adsorbed and condensed water regimes and being able to distinguish between them.
Recently, we developed micron-gap galvanic-coupled Al and Au arrays in a well-ordered comb-like structure deposited on a silicon-based substrate. It is named briefly as a moisture sensor chip (MSC) [18]. The nature of MSC material was discussed extensively in our previous works [19]. This nature enhances the quick response (~40 ms) and stability of MSC [18] since it does not rely on the existence of any hygroscopic materials which may show an affected stability after being subjected to an extended period of detection cycles [20]. However, research continues to resolve the remaining challenges facing these hygroscopic materials to enhance their long-term stability and their beneficial integration within the circuits of sensor devices [5,21,22].
Whenever a water bridges between two adjacent arrays, a flow of response-galvanic current is detected and accurately evaluated. Our previous research demonstrated that at relative humidity levels <100%, the detected response-galvanic current at MSC surface that possesses a 0.5 μm gap between its adjacent arrays was proportional not only to the surface-existing water droplets but also to the surface-adsorbed water molecules [23]. Therefore, it is suggested that the response-galvanic current depends on the amount of adsorbed water molecules on the sensor surface. In this regard, we could detect and estimate the tiny-mass change of water molecules in the order of nano-grams employing simultaneous detection-using gravimetric quartz crystal microbalance (QCM). As a result, the weight of adsorbed water molecules could be evaluated and correlated with the response-galvanic current under the same examined conditions [24]. However, sequential quantitative detection of water droplets and/or molecules at MSC surface is yet to be achieved.
Herein, we use our developed MSC together with a QCM electrode and optical microscopy to detect the adsorbed and condensed water for the first time correlating the detected galvanic current with the water mass in both cases. Such a study could provide a long detection range of MSC to distinguish between surface-existing water statuses.

2. Materials and Methods

2.1. Fabrication of MSC

Fabrication of MSC was carried out as previously described [18,25]. Briefly, a silica layer was formed by thermal oxidation treatment on a Si wafer substrate. An opposed comb-like structure was formed on the substrate using Au and Al arrays. The length, width and height of each array were 1300 µm, 2.0 µm and 0.2 µm, respectively. The setup gap size between two adjacent arrays was adjusted to 0.5 µm. The number of Au and Al pairs of arrays was 92. Two Pt resistors (10 µm width, 1000 µm length, and 100 nm thickness) were mounted at the edge of MSC to monitor its surface temperature during the experimental time. The fabricated wafer surface was cut into 5 mm2 each and the MSC was glued on an aluminum lead frame. Except for the array part, the remaining surface including the Pt resistance, and wiring was covered with a polymeric resin to make a sensor package. Figure 1 shows a schematic illustration of the MSC that was used in this study.
The sensor package is attached to an electric circuit board by a connecting adapter and the electric current between two Al and Au arrays was measured using a tailored device with a 20-bit, octal channel, current-input analogue-to-digital (A/D) converter (DDC118, Texas Instruments, Tokyo, Japan) installed on the electric circuit board. The temperature of MSC surface was estimated from the calibrated straight line of the electrical resistance generated from the Pt wires located on its surface as a function of changing temperature [23]. Whenever a water droplet bridged between two arrays as a function of dew point condensation, the response galvanic current could be detected on the MSC surface with excellent sensitivity, reproducibility and minimum response time of 20 ms.

2.2. Detection of Adsorbed Water Molecules

An experimental setup to detect adsorbed water molecules was established as elucidated in Figure 2. In a typical experimental scheme, the MSC/module set or QCM electrode sensor was mounted in a sealed measurement chamber. A metal thermal conductor functioned as a heat sink was attached to a Peltier device and connected to the back side of MSC or connected in a non-contact mode with the back side of QCM to control and regulate their surface temperatures. A precise humidity control generator (Micro Equipment Inc., me-40DPRT-2FM-MFC, Tokyo, Japan) was used to feed the measurement chamber with humid air at 200 NCCM. Therefore, the exact temperature (Td), vapor pressure and % RH at which dew condensation occurs on MSC or QCM could be accurately determined. Thus, the same procedures were repeated at the same determined Td when lowering the water vapor pressure inside the chamber to achieve the desired % RH level below dew condensation conditions (<100% RH). In other words, the water vapor pressure from the humidity controller was lowered allowing the adjustment of the vapor pressure inside the chamber and consequently adjusting the chamber’s relative humidity to its desired levels below dew condensation. Accordingly, several levels of % RH could be adjusted. In each case, adsorbed water molecules were detected on MSC or QCM surfaces via response-galvanic current or frequency changes, respectively.
The mass of adsorbed water molecules was estimated from the frequency changes recorded by QCM electrode. Meanwhile, a high speed optical microscope (VW-600C, KEYENCE Ltd., Osaka, Japan) located above the measurement chamber was used to monitor the dew condensation incidence on MSC or QCM surfaces. The temperature and relative humidity inside the measurement chamber were measured using a thermo-hygrometer (EE23; E+E Elektronik, Engerwitzdorf) with ±1.3% RH accuracy for relative humidity and ±0.25 °C accuracy for temperature. The response current arising from the water droplets’ condensation on the MSC surface was recorded at 0.1 s intervals. At each relative humidity value, the response current and frequency change arising from the adsorbed water molecules on the MSC and QCM surfaces were recorded, respectively. Finally, a correlating relationship between the mass of adsorbed water molecules estimated from the QCM response and MSC response current under controlled relative humidity was established.

2.3. Detection of Condensed Water Droplets

Under the same experimental setup shown in Figure 2, the condensation of water droplets on MSC surface was examined. In this scheme, the MSC surface was cooled to 18 °C using the Peltier device. Dry air (15.9% RH, 25.6 °C) was introduced inside the chamber at 200 NCCM. When the temperature and % RH reached their steady state, further feed with supersaturated water vapor (64.1% RH, 25.6 °C) was carried out allowing water droplets to condense on the MSC surface. Unsaturated water vapor was then introduced to the measurement chamber, allowing the evaporation of water droplets to take place. The condensation and evaporation incidents were monitored by optical microscope together with simultaneous detection of the response-galvanic current from the MSC surface. Estimation of the condensed water droplets’ mass on the MSC surface was carried out, assuming hemispherical and rectangular prism models of water droplets. Each model was correlated with the response-galvanic current. Finally, a correlation between the mass of condensed water droplets and/or adsorbed water molecules was established with their response-galvanic current.

3. Results and Discussion

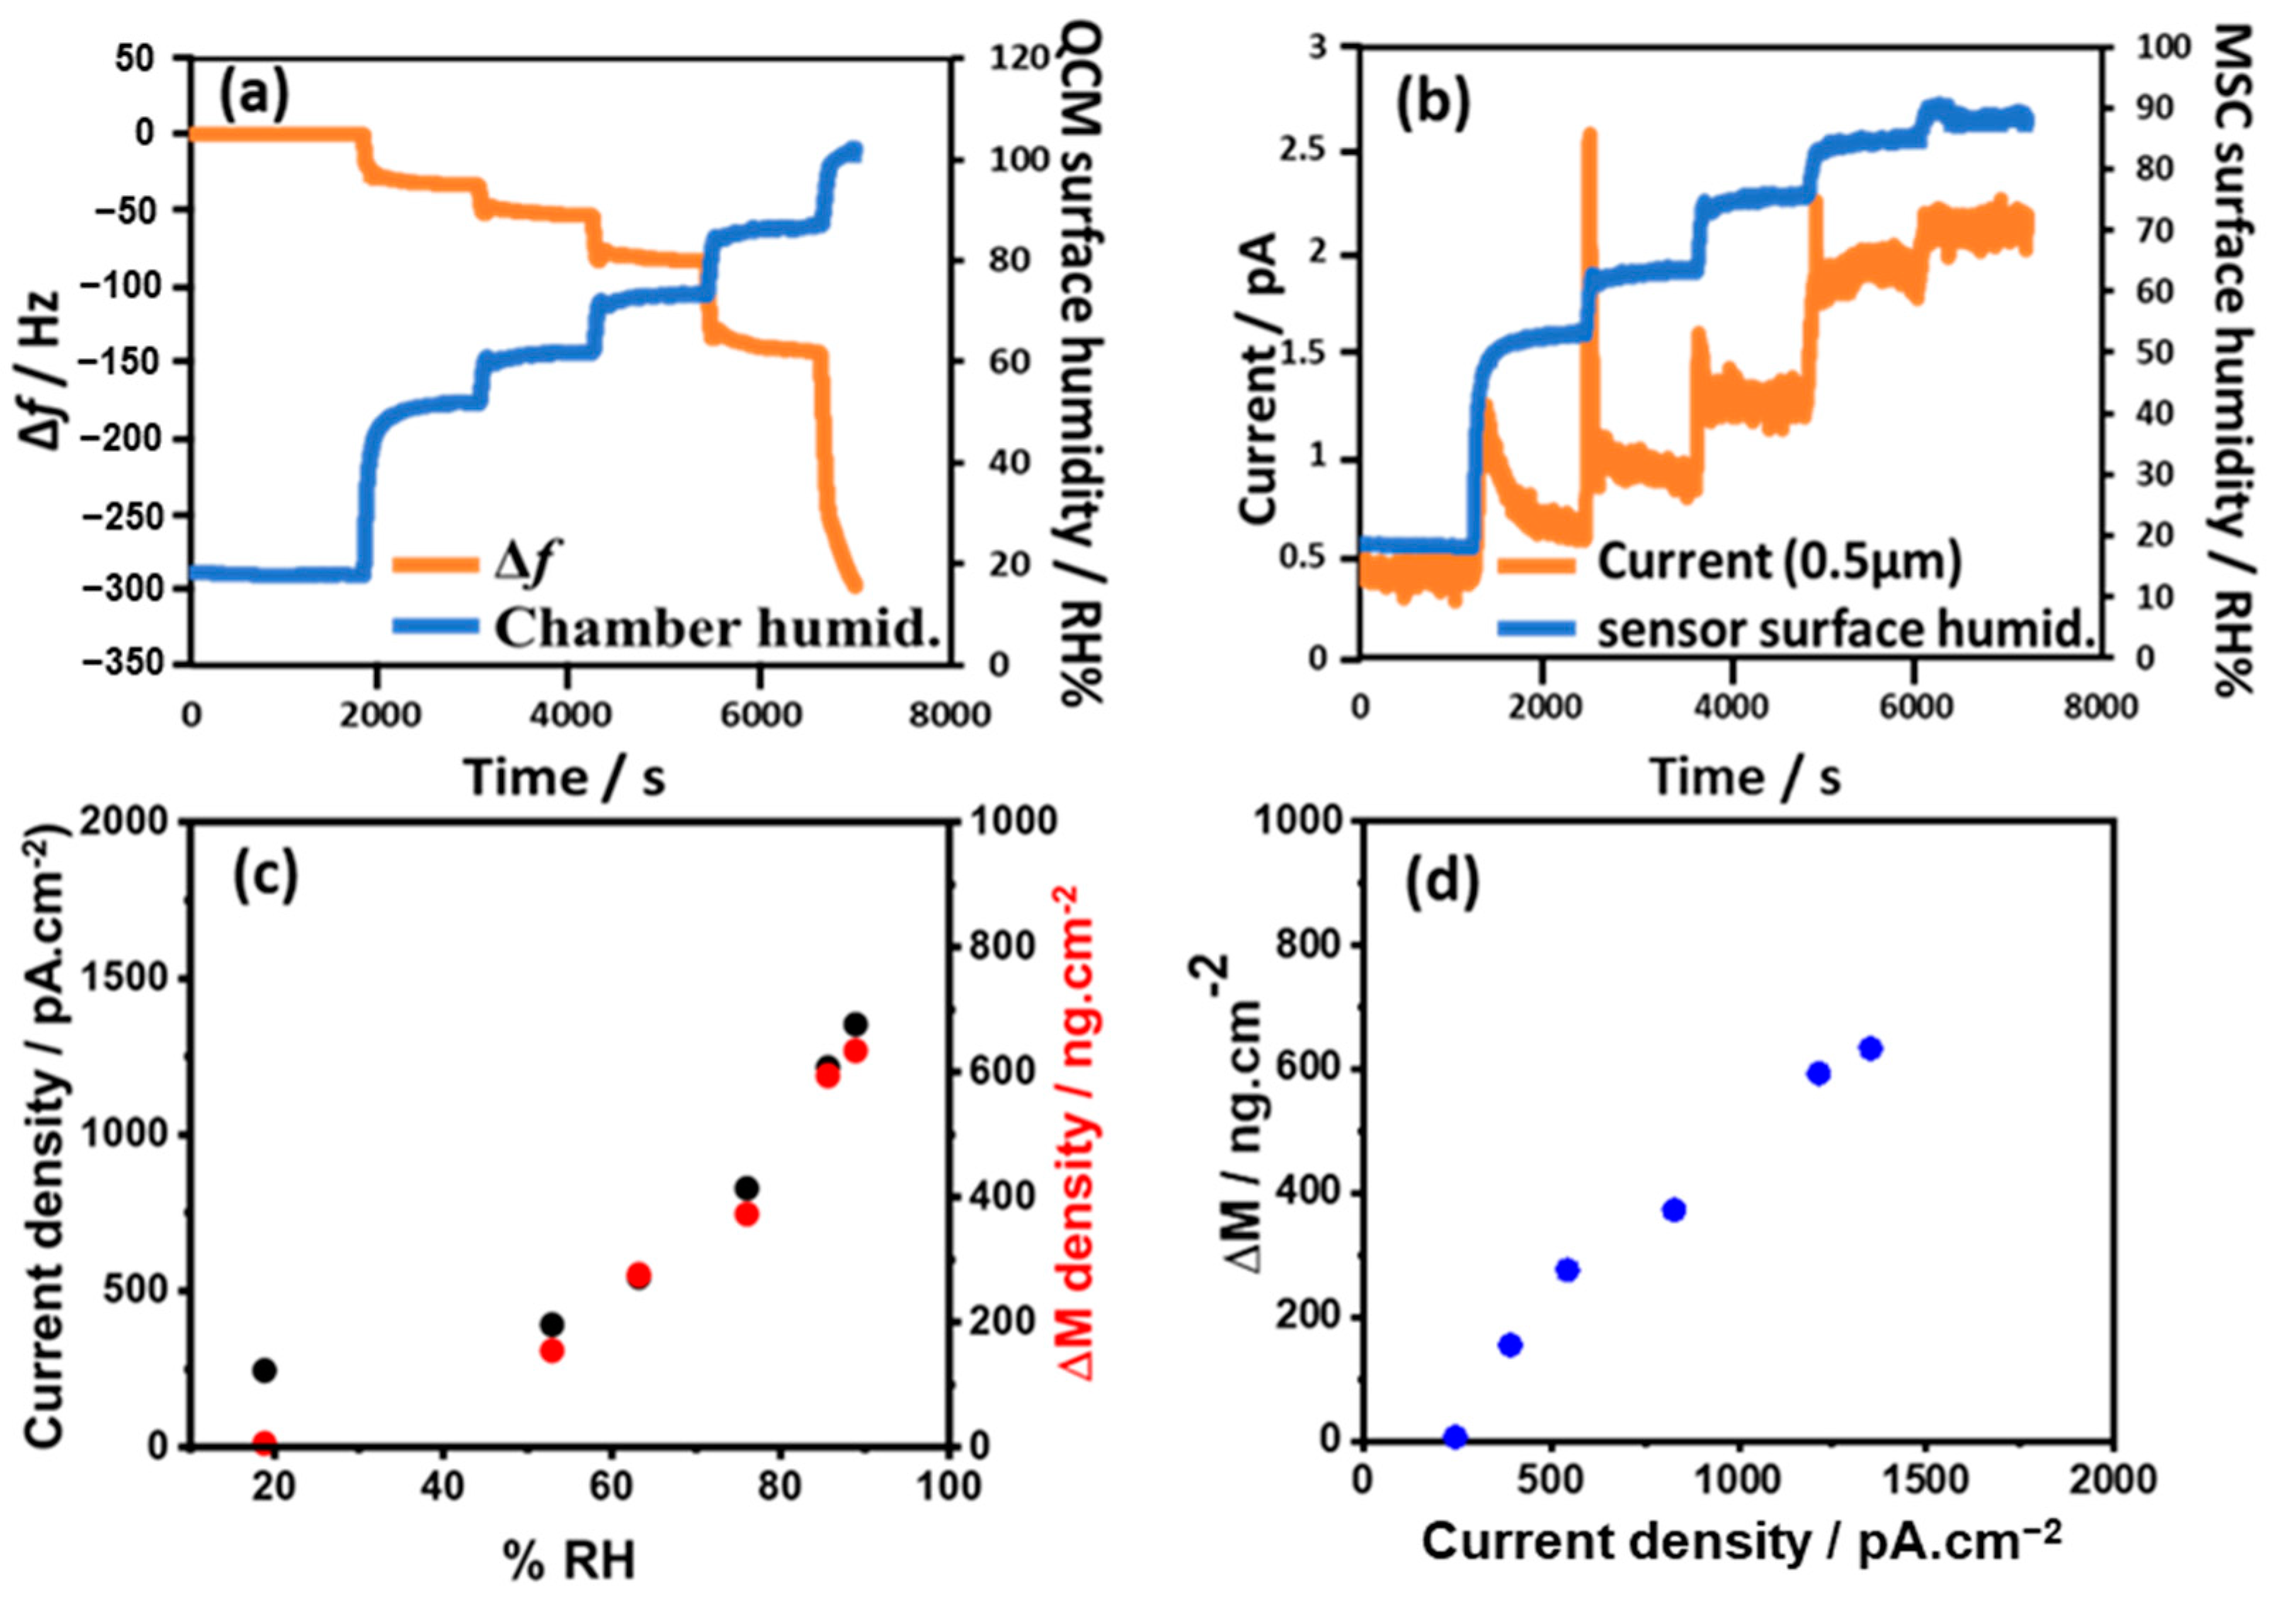
3.1. Detection of Adsorbed Water Molecules

Detection of adsorbed water molecules was carried out under controlled humidity and partial pressure when using MSC or QCM electrodes. Experimental results shown in Figure 3a,b demonstrated that once the RH level increases, the response galvanic current detected through the MSC surface also shows an increase and the frequency detected through QCM surface shows a decrease. This could be ascribed to the mass change of adsorbed water molecules at each examined RH level.
Using Sauerbrey’s equation
ΔF = 2Fo.·Δm/A·√ρ·μ
where: Fo is the initial frequency, Δm is the mass change, ΔF is the frequency change, A is the actual surface area of QCM electrode (0.14 cm−2), ρ is the density of quartz (2.648 g/cm3), and μ is the shear modulus of the quartz (2.947 × 10¹¹ g/cm s2). Rearranging the equation, one can estimate m which is correlated to each examined % RH. In a similar way, considering that our developed MS has a rectangular prism shape with length = 0.13 cm, height = 1.5 × 10⁻⁵ cm and width = 5.0 × 10⁻⁵ cm, this width represents the gap size between the two dissimilar electrodes. Therefore, the estimated total surface area is ~1.55 × 10⁻³ cm2. Figure 3c shows Δm values that were estimated for the QCM surface which reveals the increase in the mass of adsorbed water molecules at each % RH level. Quantitative estimation of the mass of adsorbed water molecules could be achieved as shown in Figure 3d from the linear correlation between the detected response-galvanic current by MSC and the estimated mass by QCM at the same examined % RH.

3.2. Detection of Condensed Water Droplets

Condensed water droplets on MSC surface were monitored at ~64% RH by a high-speed optical microscope. As a result, water droplets that bridged between Al and Au arrays were selected for further volume/area estimation. These bridging droplets were those exclusively responsible for the passage of electrons between arrays-generating response-galvanic current [19,26]. Figure 4a shows the optical images captured as a function of time. Together with the detected response galvanic current shown in Figure 4b, these images demonstrated the early formation of one water droplet that was followed by a consecutive formation of other droplets. Some of the droplets started to show bigger sizes on the MSC surface, reaching their maximum critical volumes. The droplets then exhibited evaporation behavior which was monitored via an optical microscope and through the reduction in response-galvanic current.
The mass of a water droplet was calculated from the total volume obtained by assuming a hemispherical shape of a water droplet on the MSC surface. Taking into account that the density of water = 1 g/cm−1, one can therefore estimate the mass of the specifically bridging condensed-water droplets assuming their occupying volume as a hemisphere. This mass was found to be linearly correlated with the detected response-galvanic current represented as the current density as shown in Figure 4c. However, linear correlation with the mass of adsorbed water molecules was not clearly achieved as shown in Figure 5 (blue and red dots). This could be ascribed to the droplet’s hemispherical volume contribution in the calculated mass which is limited to its inner-occupying rectangular volume that matches with the upper limit of the height dimensions of the Au and Al arrays located on the MSC surface. This limit stops at 0.15 mm which represents the contributing height to keep bridging between both arrays, leading to the passage of response-galvanic current. As a result, the volume involved in mass calculation was modified to the one arising from a rectangular prism taking into account the height of MSC. Consequently, the gained results demonstrated that a clear linear correlation between the adsorbed and condensed water mass could be achieved with their response-galvanic current as shown in Figure 5 (red and green dots) [19]. Moreover, these results revealed that the minimum detection limits of adsorbed water molecules and condensed water droplets under the examined experimental conditions are 150 and 700 ng/cm−2, respectively.

4. Conclusions

In this study, we examined the correlation between adsorbed and condensed water mass with the current density detected on our newly developed MSC surface. For the first time, we could establish a linear relationship between adsorbed water molecules and condensed water droplets. Our newly developed MSC showed a minimum detection limit of ~150 ng/cm2 for adsorbed water molecules and ~700 ng/ cm2 for condensed water droplets under the examined experimental conditions. These results can be feasibly used to distinguish between both adsorption and condensation regimes once they coexist on the MSC surface. Such findings revealed that our developed MSC possesses a long-range detection based on its surface-existing water status. The present study is believed to open the door to further future examinations of other sensor platforms for the same objective.

Author Contributions

Conceptualization, M.M., E.T. and J.K.; methodology, E.T.; formal analysis, M.M., E.T.; resources, J.K.; writing—original draft preparation, M.M.; writing—review and editing, M.M. and J.K.; supervision, J.K.; project administration, J.K.; funding acquisition, J.K. All authors have read and agreed to the published version of the manuscript.

Funding

This research is supported by M-CUBE project in NIMS (National Institute for Materials Science), Japan.

Institutional Review Board Statement

Not applicable.

Informed Consent Statement

Not applicable.

Data Availability Statement

Not applicable.

Conflicts of Interest

The authors declare no conflict of interest.

References

  1. Eden, M.A.; Hill, R.A.; Beresford, R.; Stewart, A. The influence of inoculum concentration, relative humidity, and temperature on infection of greenhouse tomatoes by Botrytis Cinerea. Plant Pathol. 1996, 45, 795. [Google Scholar] [CrossRef]
  2. Lang, C.; Hübert, T.; Quaas, H.; Linke, M.; Herppich, W.B. On line measurement of humidity in the agri food-chain. Acta Hortic. 2010, 858, 413. [Google Scholar] [CrossRef]
  3. Tételin, A.; Pellet, C.; Laville, C.; N’Kaoua, G. Fast response humidity sensors for a medical microsystem. Sens. Actuators B Chem. 2003, 91, 211–218. [Google Scholar] [CrossRef]
  4. Peng, Y.; Zhao, Y.; Chen, M.-Q.; Xia, F. Research Advances in Microfiber Humidity Sensors. Small 2018, 14, 1800524. [Google Scholar] [CrossRef]
  5. Ali, S.; Jameel, M.A.; Harrison, C.J.; Gupta, A.; Shafiei, M.; Langford, S.J. Nanoporous naphthalene diimide surface enhances humidity and ammonia sensing at room temperature. Sens. Actuators B Chem. 2022, 351, 130972. [Google Scholar] [CrossRef]
  6. Grassian, V.L. Surface science of complex environmental interfaces: Oxide and carbonate surfaces in dynamic equilibrium with water vapor. Surf. Sci. 2008, 602, 2955–2962. [Google Scholar] [CrossRef]
  7. Baltrusaitis, J.; Grassian, V.L. Calcite (101¯4) surface in humid environments. Surf. Sci. 2009, 603, L99–L104. [Google Scholar] [CrossRef]
  8. Rother, G.; Gautam, S.; Liu, T.; Cole, R.D.; Busch, A.; Stack, A.G. Molecular Structure of Adsorbed Water Phases in Silica Nanopores. J. Phys. Chem. C 2022, 126, 2885−2895. [Google Scholar] [CrossRef]
  9. Wang, H.W.; Wesolowski, D.J.; Proffen, T.E.; Vlcek, L.; Wang, W.; Allard, L.F.; Kolesnikov, A.I.; Feygenson, M.; Anovitz, L.M.; Paul, R.L. Structure and Stability of SnO2 Nanocrystals and Surface Bound Water Species. J. Am. Chem. Soc. 2013, 135, 6885−6895. [Google Scholar] [CrossRef]
  10. Wahlgren, R.V. Atmospheric water vapour processor designs for potable water production: A review. Water Res. 2001, 35, 1–22. [Google Scholar] [CrossRef]
  11. Milani, D.; Abbas, A.; Vassallo, A.; Chiesa, M.; Bakri, D.A. Evaluation of using thermoelectric coolers in a dehumidification system to generate freshwater from ambient air. Chem. Eng. Sci. 2011, 66, 2491–2501. [Google Scholar] [CrossRef]
  12. Hong, K.; Webb, R.L. Performance of dehumidifying heat exchangers with and without wetting coatings. J. Heat Transf. 1999, 121, 1018–1026. [Google Scholar] [CrossRef]
  13. Parekh, S.; Farid, M.M.; Selman, J.R.; Al-hallaj, S. Solar desalination with a humidification-dehumidification technique: A comprehensive technical review. Desalination 2004, 160, 167–186. [Google Scholar] [CrossRef]
  14. Pérez-Lombard, L.; Ortiz, J.; Pout, C. A review on buildings energy consumption information. Energy Build. 2008, 40, 394–398. [Google Scholar] [CrossRef]
  15. Gast, T.; Talebi, R. Detection of adsorbed or condensed water films with the aid of thermal oscillations. Thermochim. Acta 1987, 119, 37–45. [Google Scholar] [CrossRef]
  16. Pandey, N.K.; Shakya, V.; Mishra, S. Characterization and Humidity Sensing Application of WO3-SnO2 Nanocomposite. IOSR J. Appl. Phys. 2013, 4, 10–17. [Google Scholar] [CrossRef]
  17. Crochemorea, G.B.; Itoa, A.R.P.; Goularta, C.A.; De Souza, D.P.F. Identification of Humidity Sensing Mechanism in MgAl2 O4 by Impedance Spectroscopy as Function of Relative Humidity. Mater. Res. 2018, 21, e20170729. [Google Scholar]
  18. Kawakita, J.; Chikyow, T. Detection of Micro/Nano Droplet by Galvanic-Coupled Arrays. ECS Trans. 2017, 75, 51–59. [Google Scholar] [CrossRef]
  19. Mekawy, M.; Terada, E.; Inoue, S.; Sakamoto, Y.; Kawakita, J. Quantitative Correlation of Droplet on Galvanic-Coupled Arrays with Response Current by Image Processing. ACS Omega 2021, 6, 30818–30825. [Google Scholar] [CrossRef]
  20. Mekawy, M.; Kawakita, J. Recent Sensing Technologies of Imperceptible Water in Atmosphere. Chemosensors 2022, 10, 112. [Google Scholar] [CrossRef]
  21. Nowak-Król, A.; Shoyama, K.; Stolte, M.; Wurthner, F. Naphthalene and perylene diimides—Better alternatives to fullerenes for organic electronics? Chem. Commun. 2018, 54, 13763. [Google Scholar] [CrossRef] [PubMed]
  22. Guo, L.; Li, X.; Li, W.; Gou, C.; Zheng, M.; Zhang, Y.; Chen, Z.; Hong, Y. High-sensitive humidity sensor based on MoS2/graphene oxide quantum dot nanocomposite. Mater. Chem. Phys. 2022, 287, 126146. [Google Scholar] [CrossRef]
  23. Kubota, Y.; Mishra, V.L.; Sakamoto, Y.; Kawakita, J. Micro/nano galvanic-coupled arrays for early and initial detection and prediction of dew condensation. Sens. Actuators A 2020, 303, 111838. [Google Scholar] [CrossRef]
  24. Mekawy, M.; Noguchi, H.; Kawakita, J. Quantitative and Qualitative Studies for Real Monitoring of Interfacial Molecular Water. J. Colloid Interface Sci. 2022, 613, 311–319. [Google Scholar] [CrossRef]
  25. Kubota, Y.; Satoh, N.; Mekawy, M.; Sakamoto, Y.; Kawakita, J. Control of Heat Capacity of Moisture Sensor by Galvanic Arrays with Micro/Nano Gap toward Accurate Detection of Dew Condensation on Target. J. Electrochem. Soc. 2021, 168, 067522. [Google Scholar] [CrossRef]
  26. Terada, E.; Mekawy, M.; Sakamoto, Y.; Kawakita, J. Relation between Water Status on Micro/Nano Gap between Galvanic Arrays and Flowing Current Around 100% in Relative Humidity. J. Electrochem. Soc. 2021, 168, 047512. [Google Scholar] [CrossRef]
Figure 1. A schematic illustration for the MSC surface and its measurement module.
Chemosensors 10 00300 g001
Figure 2. A schematic illustration for the experimental setup used for water adsorption/condensation detection using MSC (a) and QCM surfaces (b), respectively.
Chemosensors 10 00300 g002
Figure 3. Detected frequency changes by QCM electrode (a) and detected response galvanic current by MSC (b) as a function of % RH. Linear correlation between mass per unit area and current density as a function of % RH (c). Linear correlation between current density and mass per unit area detected by QCM and MSC surfaces, respectively (d).
Chemosensors 10 00300 g003
Figure 4. Microscopic images (a) and response-galvanic current (b) that were detected with time for the condensed water droplets on MSC surface. Linear correlation relationship obtained between the current density and the calculated condensed water mass at MSC surface (c).
Chemosensors 10 00300 g004
Figure 5. Correlation between the mass of adsorbed water molecules (red color) or the mass of condensed water droplets based on hemispherical model (blue color) or rectangular model (green color) that were detected on the MSC surface with their detected current density.
Chemosensors 10 00300 g005
Publisher’s Note: MDPI stays neutral with regard to jurisdictional claims in published maps and institutional affiliations.

