Article

Polyethylenimine-Based Electrochemical Sensor for the Determination of Caffeic Acid in Aromatic Herbs

by
Felipe Zamarchi
,
Tânia Regina Silva
,
João Paulo Winiarski
,
Edson Roberto Santana
* and
Iolanda Cruz Vieira
Laboratório de Biossensores, Universidade Federal de Santa Catarina, Florianópolis 88040-900, SC, Brazil
*
Author to whom correspondence should be addressed.
Chemosensors 2022, 10(9), 357; https://doi.org/10.3390/chemosensors10090357
Submission received: 17 August 2022 / Revised: 29 August 2022 / Accepted: 30 August 2022 / Published: 2 September 2022
(This article belongs to the Special Issue Voltammperometric Sensors)

Abstract

:
An electrochemical sensor based on carbon paste modified with polyethyleneimine was developed and employed for the determination of caffeic acid in aromatic herbs. The sensor was prepared by mixing polyethylenimine (1.5% v/v), graphite powder, and mineral oil. The polyethylenimine-based electrode showed an enhancement of charge transfer at the electrode–solution interface and a higher current intensity for the electrochemical reaction of caffeic acid, in comparison to the unmodified electrode. The calibration plot of caffeic acid constructed in 0.1 mol L−1 acetate buffer (pH 5.0) by square wave voltammetry was linear in the range of 1.25 to 19.9 μmol L−1 with a limit of detection of 0.13 μmol L−1, respectively. Finally, the proposed sensor was employed to monitor the caffeic acid with accuracy in dried Thymus vulgaris and Salvia officinalis samples, with recovery results from 93 to 105%.

1. Introduction

Aromatic herbs are among some of the oldest ingredients used in cooking. They are used in recipes as spices and seasonings because of their organoleptic properties, which give food and drink special aromas, colours, and flavours [1]. Drying technology can conserve the bioactive compounds of herbs by removing moisture via inactivating enzymatic reactions [2]. Most herbs have health benefits, which vary according to the herb in question, but very frequently they include antioxidant, antimicrobial, and antiviral effects, among others [3]. Considering the potential functional food/nutraceutical and medicinal benefits of aromatic herbs, it is important to develop analytical tools which are capable of monitoring bioactive compounds, such as caffeic acid, in the composition of these herbs.
Caffeic acid (3,4-dihydroxycinnamic acid) is a hydroxycinnamic acid-derived phenolic compound commonly found in green tea, coffee, fruits, vegetables, and aromatic herbs [4]. Caffeic acid contributes to colour stability and has antioxidant effects in food and beverages, and acts as an antioxidant and free radical scavenger, as well as a carcinogenic inhibitor in the body [5]. It is also used as an anti-bacterial, anti-inflammatory, antiviral, and immune-modulatory agent [6]. Due to its attractive properties, it has been used in a variety of biomedical applications such as HIV replication, cardiovascular disease, diabetes, anticancer activity, and neurodegeneration [6]. In addition, a possible antiviral effect of caffeic acid and its derivatives against COVID-19 was mentioned recently in silico reports, although there is no experimental evidence [7]. For example, Adem et al. [8] reported some caffeic acid derivatives as potential anti-COVID-19 agents based on the in silico approach toward some of the SARS-CoV-2 target proteins, such as the spike protein, fusion protein, and endoribonuclease. Therefore, accurate and sensitive determination of caffeic acid is crucial in the pharmaceutical and food industries.
Several analytical techniques have been developed for the determination of caffeic acid, including chromatography coupled with a photodiode array detector [9], electrophoresis [10], and electrochemical methods [5]. In that respect, electrochemical methods offer the benefits of elevated sensitivity, accuracy, a low cost, they are facile to use, and their instruments are relatively portable [11,12]. A carbon paste electrode (CPE) is an interesting electrochemical device with the advantages of a wide potential range, low cost, ease of fabrication, stability, and surface reproducibility. [13,14]. To increase the sensitivity of the CPE, various compounds (organic and inorganic) can be mixed with the carbon paste [15]. In that regard, carbon pastes containing metal oxides [14], magnetic nanoparticles [15], nickel ditelluride [16], and polymers [13] were reported for electroanalysis.
Polyethylenimine (PEI) is a kind of cationic polymer rich in amino groups, synthesized in different forms including a linear or branched chain and a high or low molecular weight species [17]. PEI has good conductivity, chelating, and adsorption properties [18,19]. These properties are useful for a variety of industrial and biomedical applications. Due to its good transfection properties, PEI is considered to be the gold standard as a cationic non-viral vector for gene delivery therapy [20]. Its chelating and adsorption properties are exploited in wastewater treatment to remove metal ions [18] and anionic dyes [21], respectively. In addition, PEI is able to confer conductive properties to the material in which it is inserted, which makes PEI an excellent choice of chemical modifier for electrochemical sensors. In that regard, PEI-based sensors are reported for the detection of gallic acid [22], peroxide-based explosives [23], nitroaromatic explosives [24], bisphenol A [25], hydrogen peroxide [25], and kanamycin [26].
Thus, this work reports the development of a carbon paste electrode modified with PEI (PEI/CPE) for the determination of caffeic acid in aromatic herbs. The influence of different experimental parameters, including the contribution of the amount of PEI in the carbon paste, which supports the electrolyte and solution pH, were investigated in order to optimize the performance of the proposed sensor. The electrochemical characteristics of the sensor were explored by cyclic voltammetry and electrochemical impedance spectroscopy.

2. Materials and Methods

2.1. Reagents and Solutions

Polyethylenimine (PEI, branched, Mw~800), paracetamol, rutin, methyldopa, caffeic acid, p-coumaric acid, ferulic acid, potassium ferricyanide (K3[Fe(CN)6]) and potassium ferrocyanide (K4[Fe(CN)6]) were obtained from Sigma-Aldrich/Merck, Germany. All chemicals were of analytical grade and used without further purification. The solutions were prepared with water purified using a Milli-Q system (Millipore, Burlington, MA, USA) with a resistivity of 18.2 MΩ cm. The standard solution of caffeic acid (1.0 mmol L−1) was prepared in 95:5% ultrapure water:ethanol. The PEI solutions were prepared by dilution in ultrapure water in the concentration range of 0.25 to 2.0% (v/v). Britton–Robinson (B-R) buffer (H3BO3, CH3COOH, H3PO4), acetate buffer (CH3COOH/CH3COONa), and phosphate buffer (NaH2PO4/Na2HPO4) (0.1 mol L−1) were used in pH studies. The pH adjustment of these solutions was carried out, when necessary, through the addition of sodium hydroxide, phosphoric acid, or acetic acid.
To build the carbon paste electrode, graphite powder (Acheson 38, Fisher Scientific, Pittsburgh, PA, USA) was used as the conductor, nujol mineral oil (Sigma-Aldrich/Merck, Darmstadt, Germany) was used as a binding agent, and PEI was used as a modifier.

2.2. Preparation of the PEI/CPE Sensor

The PEI/CPE sensor was made by modifying the inner material of a carbon paste electrode (CPE). Initially, 150 mg of graphite powder and 250 µL of 1.5% (v/v) PEI solution were mixed for 10 min. Then, this mixture was dried in a desiccator coupled to a vacuum pump for 1 h. After drying, the material was transferred to a mortar, where 200 µL of mineral oil (nujol) was added and macerated for 10 min to obtain the carbon paste. The obtained paste was transferred to a plastic syringe (capacity: 1.0 mL; internal diameter: 1.0 mm), and a copper wire was inserted to establish the electrical contact. The PEI/CPE was used as the working electrode and applied in the development of an electroanalytical method for the determination of the caffeic acid.

2.3. Preparation of Samples

The dried herbal samples (thyme and sage) were purchased from stores in Florianópolis, Brazil. For sample preparation, 1.0456 g of thyme (Thymus vulgaris) and 1.0500 g of sage (Salvia officinalis) were transferred separately to a beaker containing 10.0 mL of ultrapure water. The system was placed on a heating plate at 40 °C for 10 min with constant magnetic stirring for the production of an extract. The obtained extracts were collected and centrifuged at 13,000 rpm for 3 min. Aliquots of 150 µL of supernatants were used in the quantification of the caffeic acid.

2.4. Instrumentation

The measurements of cyclic voltammetry (CV) and square-wave voltammetry (SWV) were performed in a PGSTAT101 potentiostat (Metrohm Autolab B.V., Utrecht, The Netherlands) connected to NOVA software (version 1.10) for data acquisition. The electrochemical impedance spectroscopy (EIS) measurements were performed on a PGSTAT128N (Metrohm Autolab B.V., Utrecht, the Netherlands) with an FRA impedance module in open circuit mode, with 10 mV amplitude and a frequency range of 0.1–100,000 Hz. A cell with three electrodes was used in the experiments: the PEI/CPE as the working electrode, a platinum wire as the counter electrode, and Ag/AgCl (3.0 mol L−1 KCl) as the reference electrode.

3. Results and Discussion

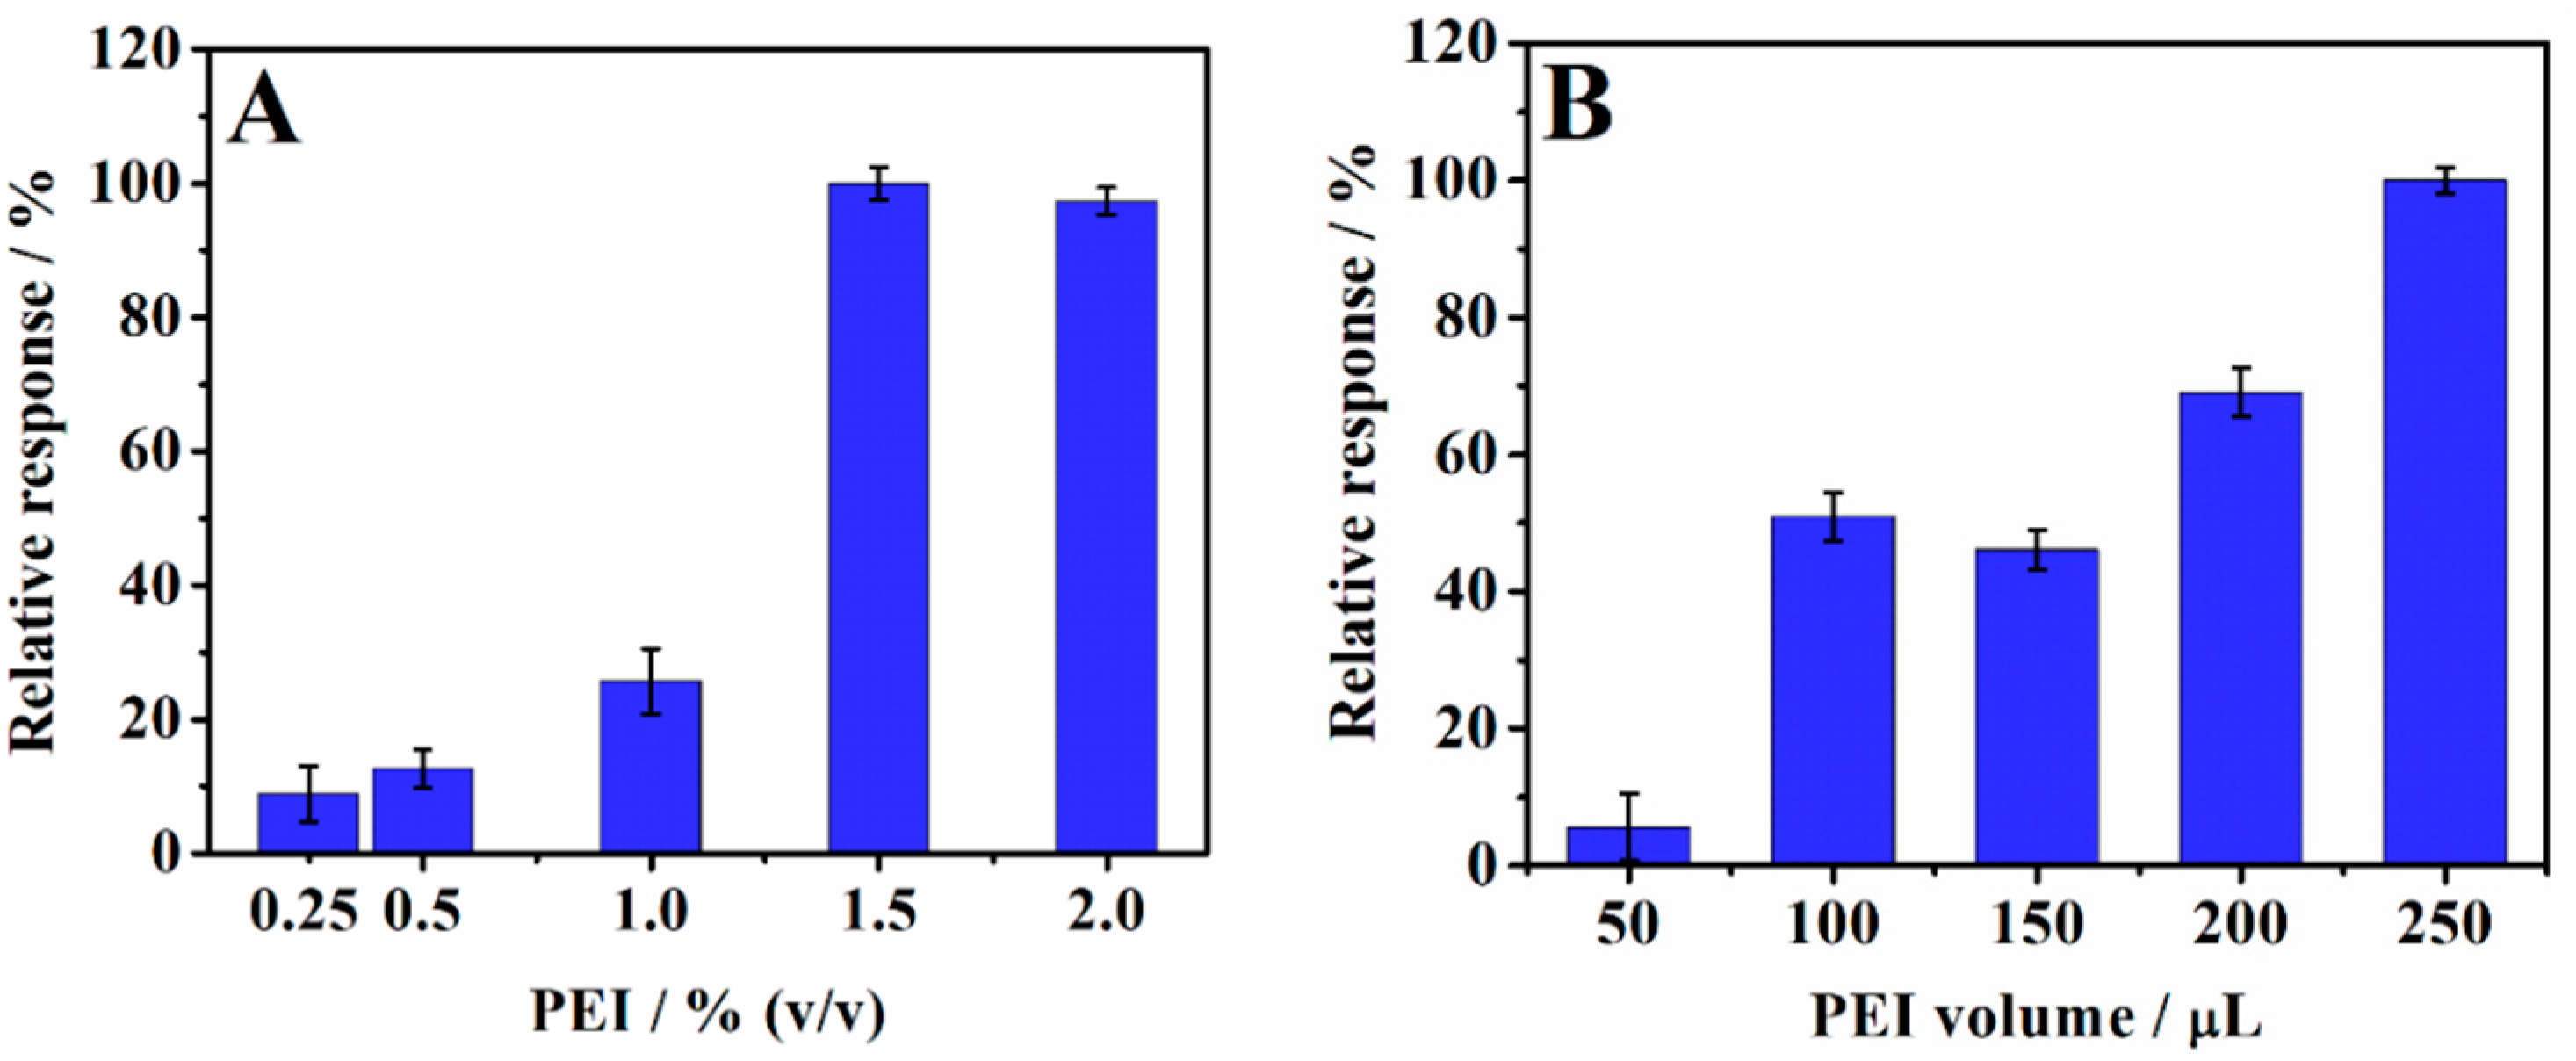
3.1. Optimization of the Preparation of PEI/CPE

The optimization of the PEI/CPE preparation was performed based on the current responses of caffeic acid, as this is the analyte of the work, using SWV as it is a highly sensitive technique. The influence of different amounts of PEI in the carbon paste composition was evaluated, based on the current response of 3.85 µmol L−1 caffeic acid, by SWV. Different concentrations of the PEI solution were evaluated in the range of 0.25 to 2.0% (v/v), keeping the volume of PEI addition to the electrode preparation fixed (100 µL) (Figure 1A). The current intensities of the caffeic acid increased with the increasing concentration of the PEI in the electrode until the value of 1.5% was reached (v/v) (100% relative response), after which it remained stable.
After evaluating the effect of the percentage of the PEI solution on the electrode performance, the influence of the volume of the PEI solution added to the carbon paste was studied. Electrodes were constructed with aliquots of 50, 100, 150, 200, and 250 µL of the 1.5% (v/v) PEI (Figure 1B). The highest responses were obtained with electrodes constructed containing 250 µL of the 1.5% PEI, and this volume was therefore selected. Electrodes with volumes greater than 250 µL were not evaluated, as they did not obtain a firm consistency of carbon paste. Thus, the electrodes were constructed with 250 µL of the 1.5% (v/v) PEI and electrochemically characterized and applied in the development of a sensitive method for the determination of the caffeic acid.

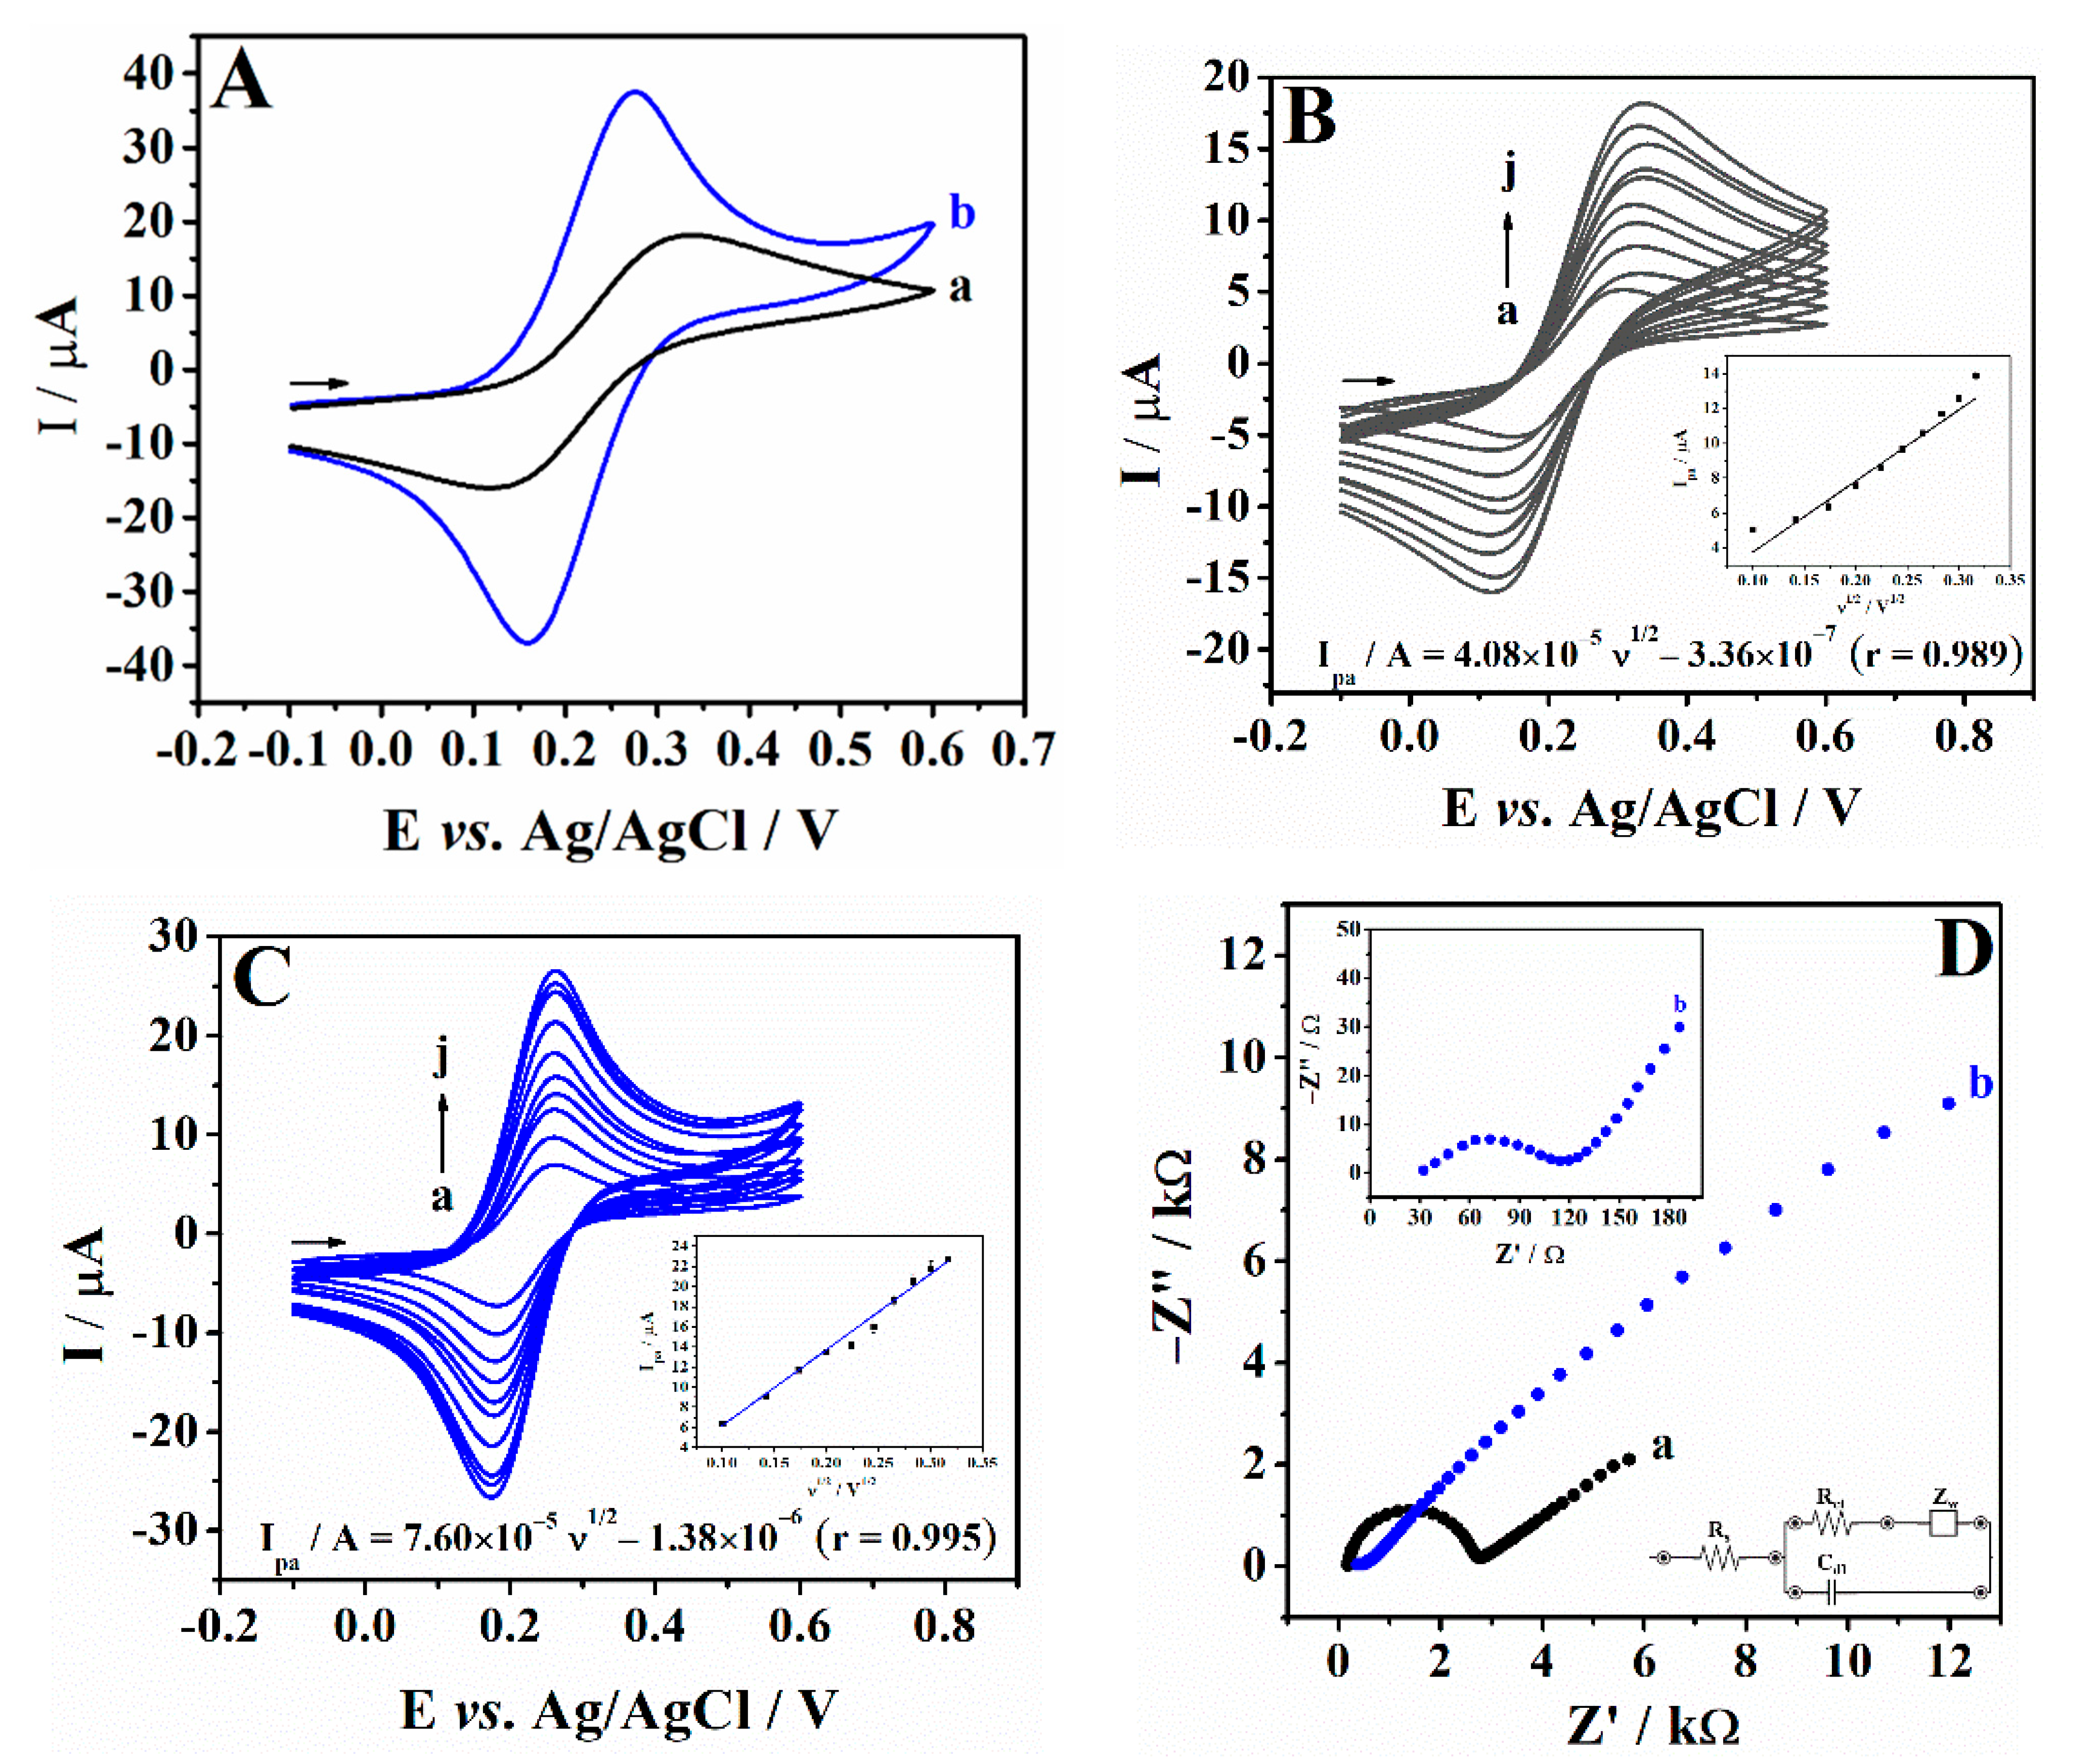
3.2. Electrochemical Characterization of PEI/CPE

Electrochemical characterizations of the PEI/CPE surface were executed by CV and EIS. Figure 2A shows the cyclic voltammograms for 5.0 mmol L−1 K4[Fe(CN)6] on the CPE (curve a) and PEI/CPE (curve b) in 0.1 mol L−1 KCl. The voltammograms present well-defined oxidation and reduction peaks, characteristic of the [Fe(CN)6]3−/4− redox processes. However, the current responses obtained with the PEI/CPE (curve b) were about three times greater than that presented by the bare CPE (curve a). The PEI/CPE also provided a lower peak-to-peak separation value (ΔEp = 0.110 V) compared to the bare CPE (ΔEp = 0.212 V). The ΔEp values were higher than the theoretical value of 59.2/z mV (where z = 1 electron), which indicates quasi-reversible behaviour of [Fe(CN)6]3−/4− on both electrodes [27]. The heterogeneous electron transfer rate (k0) can be calculated using the method developed by Klingler and Kochi in Equation (1) [28].
k 0 = 2.18 α z F ν R T 1 / 2 e x p α 2 F R T z E p c E p a
where α is the transfer coefficient (α = 0.5), z refers to the number of electrons transferred in the redox reaction (z = 1), F is the Faraday constant (96,485 C mol−1), D refers to the diffusion coefficient of the K4[Fe(CN)6] species in aqueous solution (6.7 × 10⁻⁶ cm2 s−1 [29]), ν to the potential scan rate (V s−1), R to the universal gas constant (8.314 J K−1 mol−1), and T to the absolute temperature (298 K).
The PEI/CPE presented faster transfer kinetics (k0 = 3.86 × 10⁻³ cm s−1) in comparison to the bare CPE (k0 = 2.21 × 10⁻⁵ cm s−1). These results demonstrate that the presence of PEI in the structure of the carbon paste enhanced the current intensities and favored the transfer of charge between the electrode and the solution, which may be attributed to the conductive properties of PEI [30]. In addition, the electroactive areas of the bare CPE and PEI/CPE were estimated by CV using 5.0 mmol L−1 K4[Fe(CN)6] as a probe in 0.1 mol L−1 KCl at different scan rates (Figure 2B,C), according to the Randles–Ševćik Equation (2) for quasi-reversible reactions [31].
I p a = ± 0.436 z F A C z F D v R T
where Ipa refers to the anodic peak current (A), A to the electroactive area (cm2), and C to the K4[Fe(CN)6] concentration (mol cm−3). The other parameters have the same value used for Equation (1). Thus, from the slope of the plots Ipa vs. ν½ (inserted in Figure 2B,C), the A values were estimated to be 1.2 × 10⁻² and 2.2 × 10⁻² cm2 for the CPE and PEI/CPE, respectively. This result indicates that PEI also contributed to the increase in the electroactive area of the modified electrode, which also causes an enhancement in sensitivity in electrochemical measurements.
The EIS can be applied with the K3[Fe(CN)6]/K4[Fe(CN)6] redox probe to evaluate the electrochemical performance of the sensor. In that regard, the Nyquist plots (Figure 2D) show a clear difference in the charge transfer resistance (Rct) for the bare CPE and PEI/CPE. The smaller semicircle for the PEI/CPE represents a significant diminution in the Rct of the CPE with PEI incorporated in the carbon paste. The calculated Rct values for the CPE and PEI/CPE were 2700 and 93.5 Ω, respectively. The decrease in the Rct value of the PEI/CPE can be related to the conductivity properties of PEI incorporated in the CPE, which would facilitate the charge transfer between the surface of the PEI/CPE and the solution.

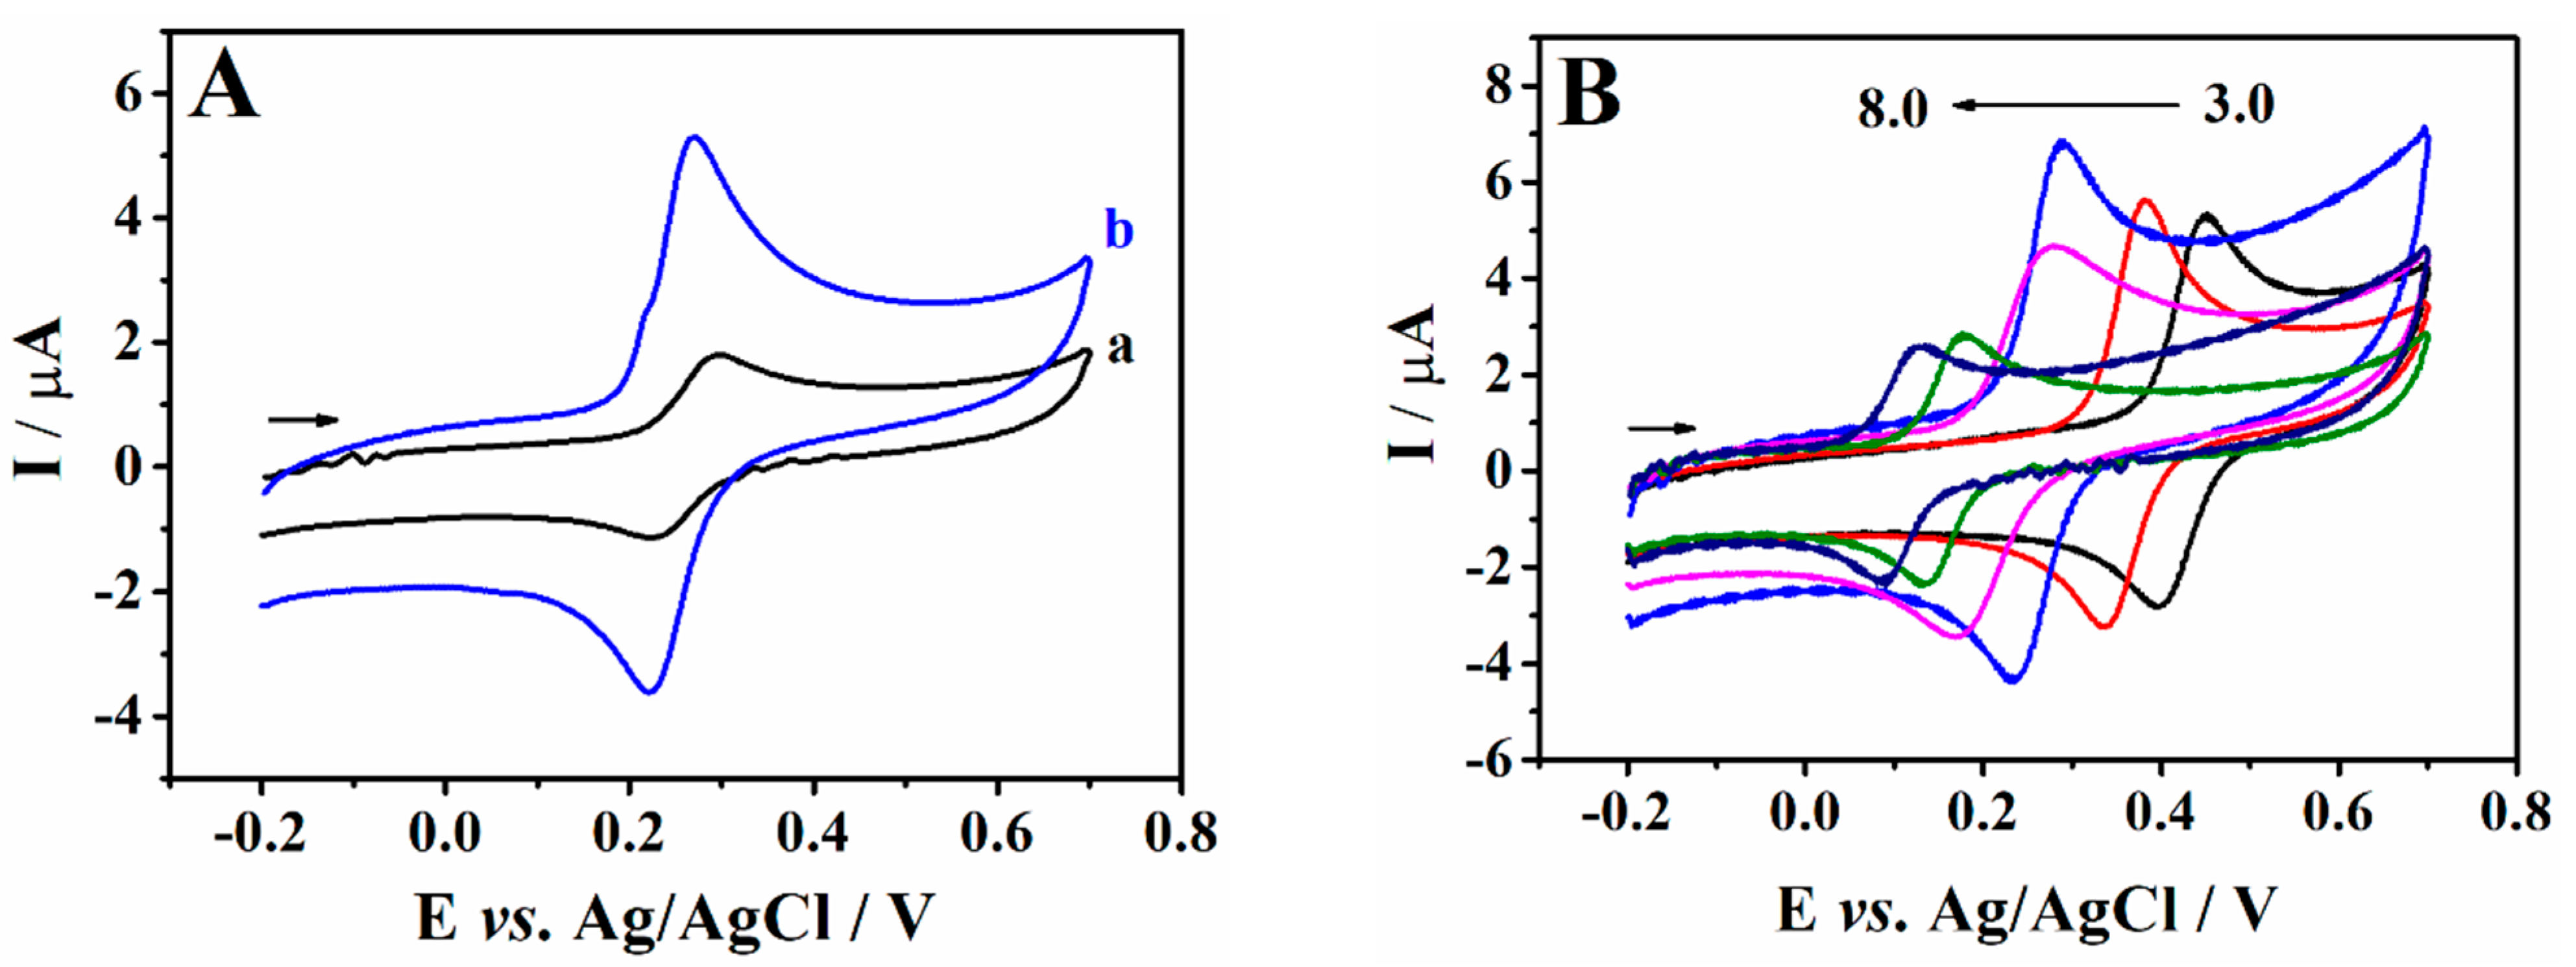
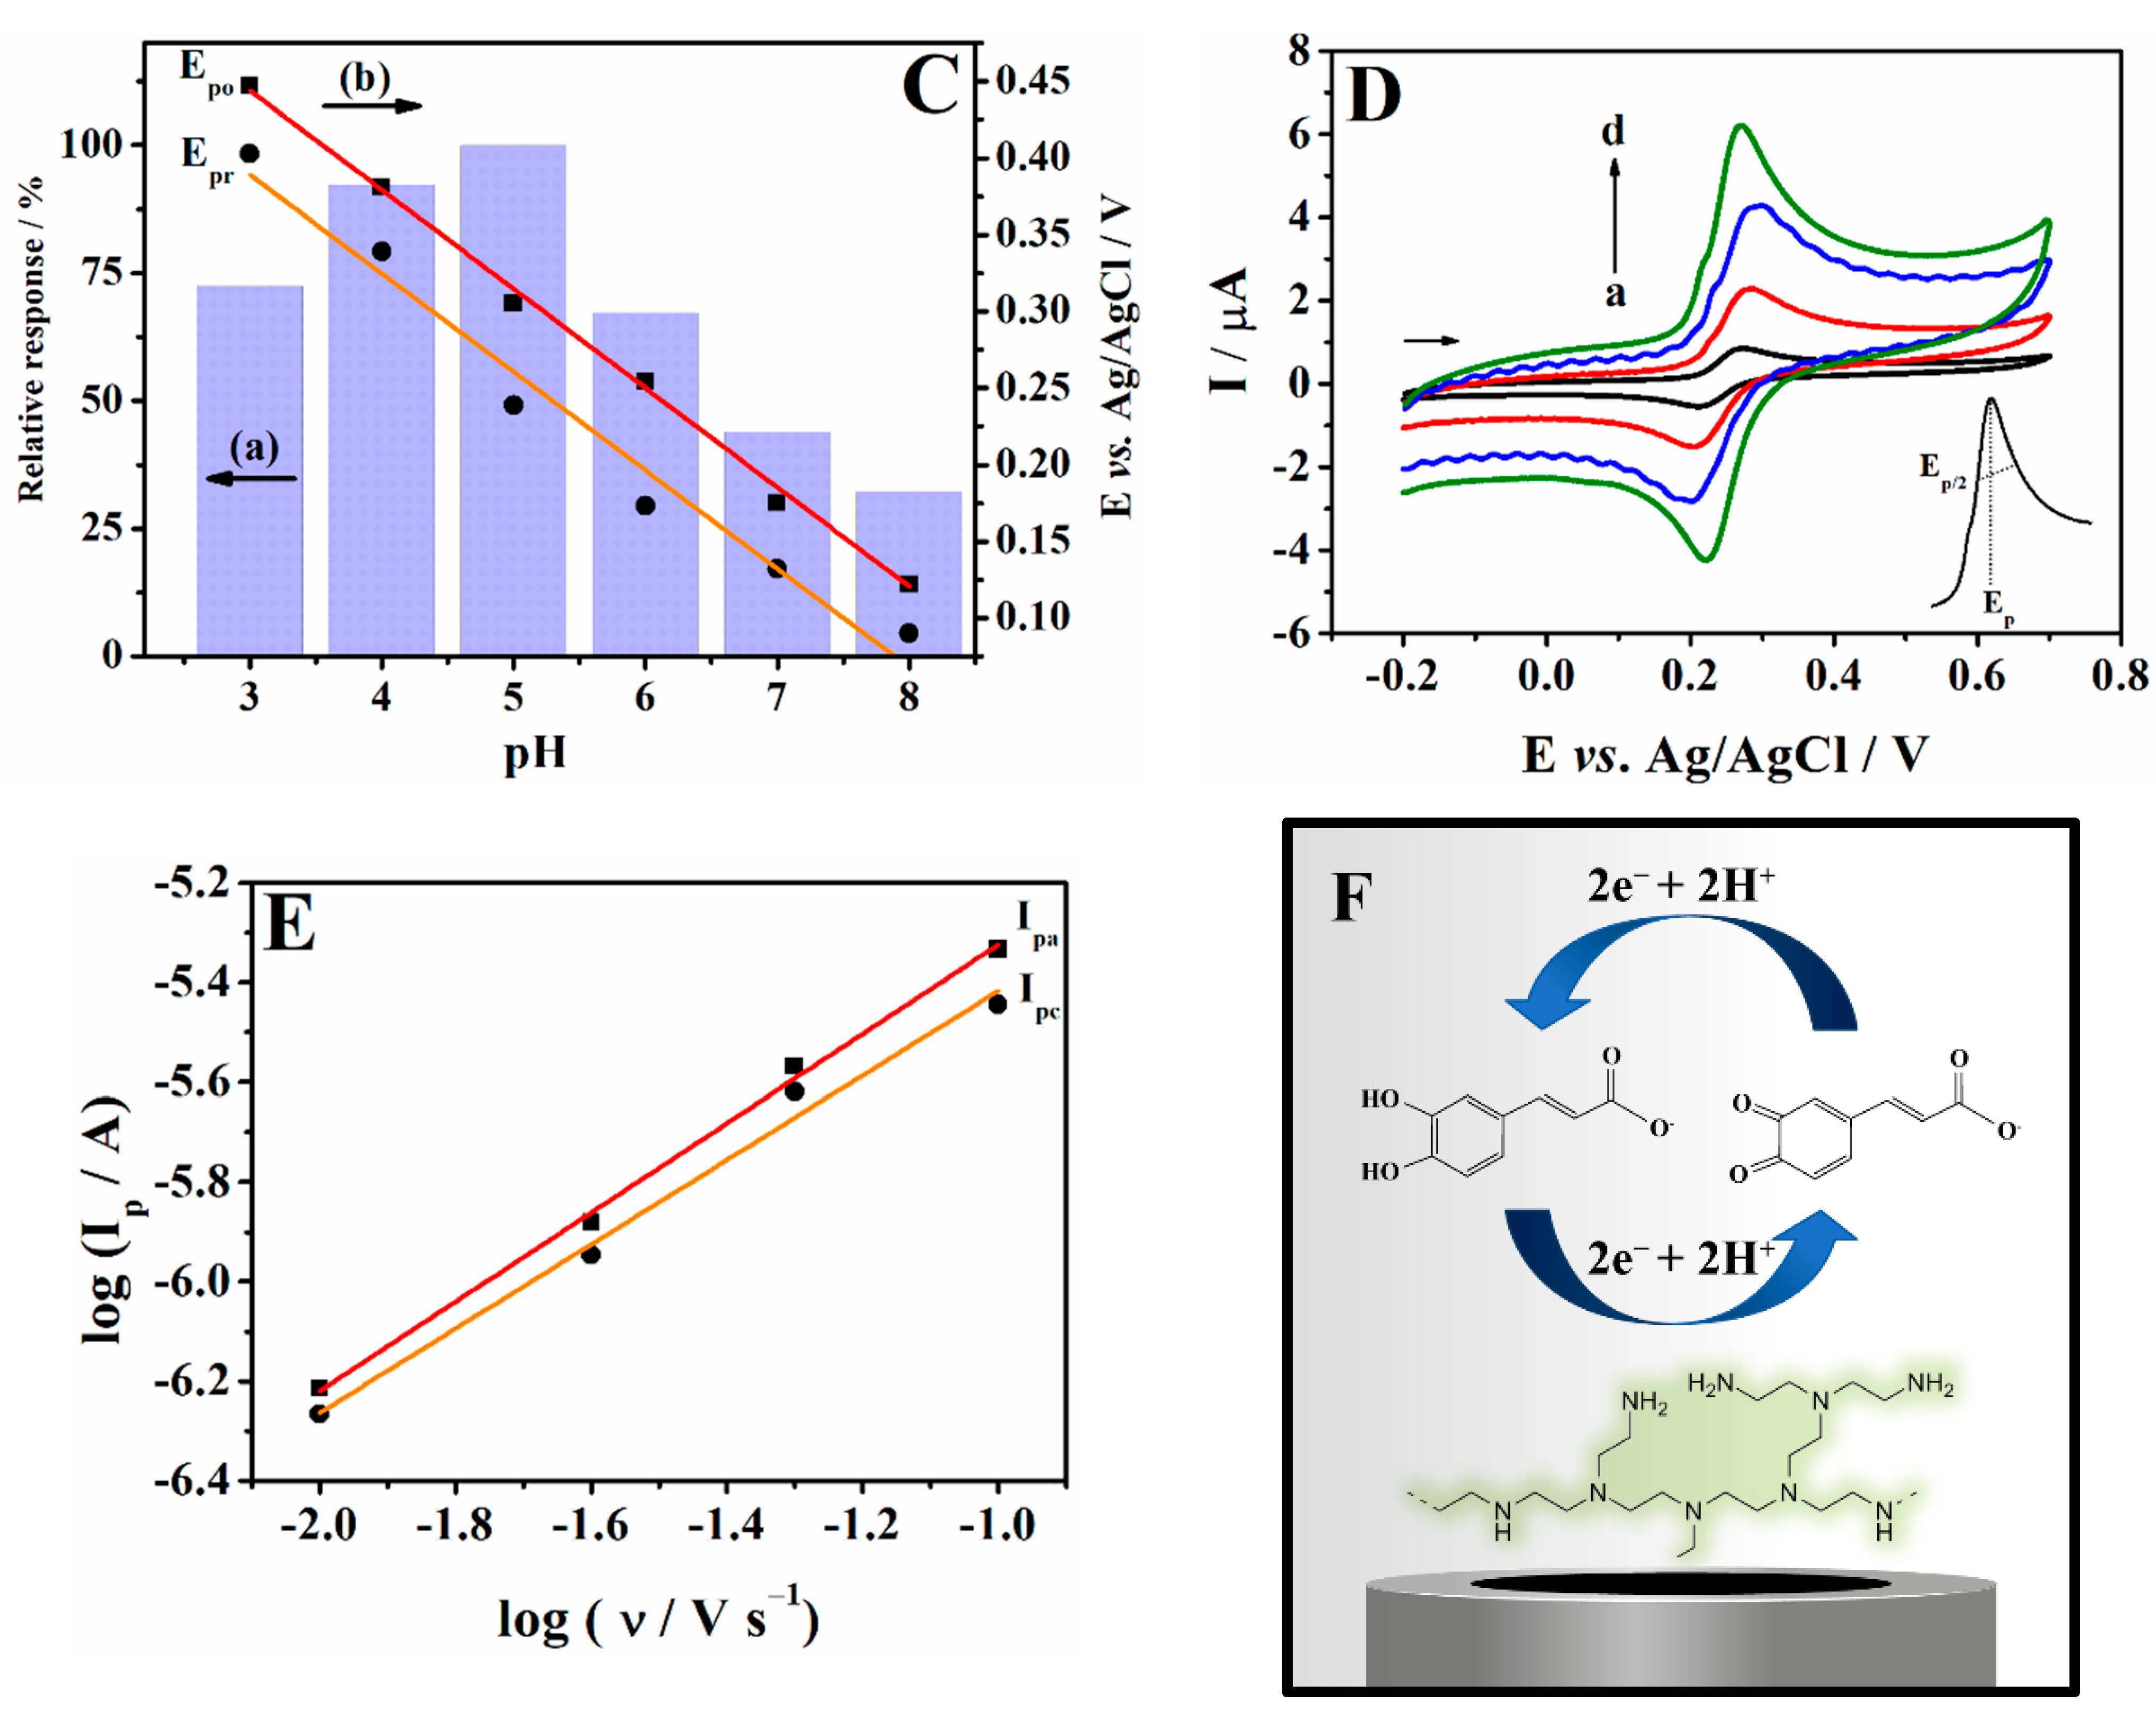
3.3. Electrochemical Behaviour of Caffeic Acid at the PEI/CPE

The cyclic voltammograms for caffeic acid on the CPE (curve a) and PEI/CPE (curve b) show two reversible electrochemical processes (Figure 3A). The first process is the oxidation of caffeic acid into o-quinone derivative (~280 mV), and the second is the reduction of o-quinone derivative into caffeic acid (~260 mV) [32]. The peak-to-peak separation (ΔEp) was close to the theoretical value of 59.2/z mV (where z = 2 electrons), which indicates reversible behaviour of the caffeic acid on both electrodes [27]. The remarkable enhancement of the anodic and cathodic peak currents of caffeic acid at the modified electrode was found to be over three times higher than the bare CPE, with a decrease in the overpotential by 30 mV. This phenomenon can be attributed to the better conductivity and the increase in the electroactive area of the modified electrode provided by the presence of PEI in the carbon paste. At different pH values (pH 3.0 to 8.0), the peak potentials of the caffeic acid were shifted to more negative potential values as the pH of the medium increased (Figure 3B). The peak potentials shifted linearly with slope values of −61.2 mV pH−1 for oxidation peak potential (Epo) and −60.5 mV pH−1 for reduction peak potential (Epr) (Figure 2C–axis b). These values are close to the value of −59.2 mV pH−1 (Nernst equation theoretical coefficient), indicating that an equal number of mols of electrons and protons are transferred in each reaction.
The current intensity increased as the pH value increased from 3.0 to 5.0 (Figure 3C–axis a), and the maximum current response was observed at pH 5.0. This result can be associated with better electrostatic interaction between the caffeic acid and the PEI chain. The pKa of the caffeic acid is 4.62 for the carboxylic acid proton [33]. The chain of branched PEI contains significant fractions of primary, secondary, and tertiary amine groups in an approximate ratio of 1:2:1, respectively [34]. The pKa values of PEI are 10.5, 7.5–8.5, and 5.0 for the primary, secondary, and tertiary amines, respectively [34]. Thus, at pH 5.0, there is a satisfactory electrostatic interaction between the caffeic acid and the PEI, which leads to a better current response. Under conditions above pH 5.0, PEI undergoes deprotonation of its amine groups, becoming neutral. Thus, the pH value of 5.0 was selected for further studies.
Subsequently, the influence of different compositions of supporting electrolytes at pH 5.0 was evaluated in the electrochemical response to caffeic acid. The solutions tested were B-R, phosphate, and acetate, all at a concentration of 0.1 mol L−1. The highest current values were obtained in acetate buffer at pH 5.0. Therefore, this buffer solution was used for subsequent analytical experiments.
The electrochemical behaviour of the caffeic acid was monitored at different scan rates using the PEI/CPE (Figure 3D). With data obtained from the scan rate analysis, the plot of the logarithm of the peak current versus the logarithm of the scan rate (Figure 3E) yielded slope values of 0.89 and 0.84, using the values of the anodic peak current (Ipa) and cathodic peak current (Ipc), respectively. According to the literature, a log–log plot slope of (or close to) 0.5 indicates a diffusion-controlled reaction rate, while a value equal to (or close to) 1.0 represents an adsorption-controlled reaction rate [27]. Thus, with the values obtained, it is concluded that the electrochemical process is adsorption-limited. In addition, it was possible to calculate the number of electrons involved in the redox reaction of the caffeic acid. For reversible electrochemical systems, cyclic voltammetry can be carried out to obtain the relationship between Ep and Ep/2 and the number of electrons transferred (3) [27]:
E p E p 2 = 2.20 R T z F = 56.5 z   m V   at   25   C  
where Ep/2 is the half-peak potential, which means the potential where the current is at half of the peak value (inset Figure 3D), and Ep is independent of scan rate [27]. Thus, the electron transfer number (z) for the redox process of the caffeic acid was assumed to be two. This result corroborates the data reported by the literature and represents the oxidation of caffeic acid into o-quinone derivative by two mols of protons and two mols of electrons, and the reduction of o-quinone derivative into caffeic acid by two mols of protons and two mols of electrons, in a reversible system [32]. Therefore, the possible electrode reaction principle is shown in Figure 3F.

3.4. Optimization of SWV Parameters

Since the caffeic acid redox reaction is a reversible system, the appropriate use of pulse techniques can develop a sensitive electroanalytical method for caffeic acid. In this regard, the current is measured twice in the SWV: at the end of the forward pulse (I1) and at the end of the reverse pulse (−I2). The signal obtained from the current intensity is the result of reading these two currents ISW = I1 − (−I2). This approach furnishes higher currents for reversible systems such as the caffeic acid monitored in this study. Thus, SWV was used in subsequent studies, and the influence of the parameters step potential (ΔEs), amplitude (a), and frequency (f) on the sensitivity of the analysis of caffeic acid was evaluated. The following parameters provided the best response for caffeic acid: f = 30 Hz, a = 70 mV, and ΔEs = 3 mV.

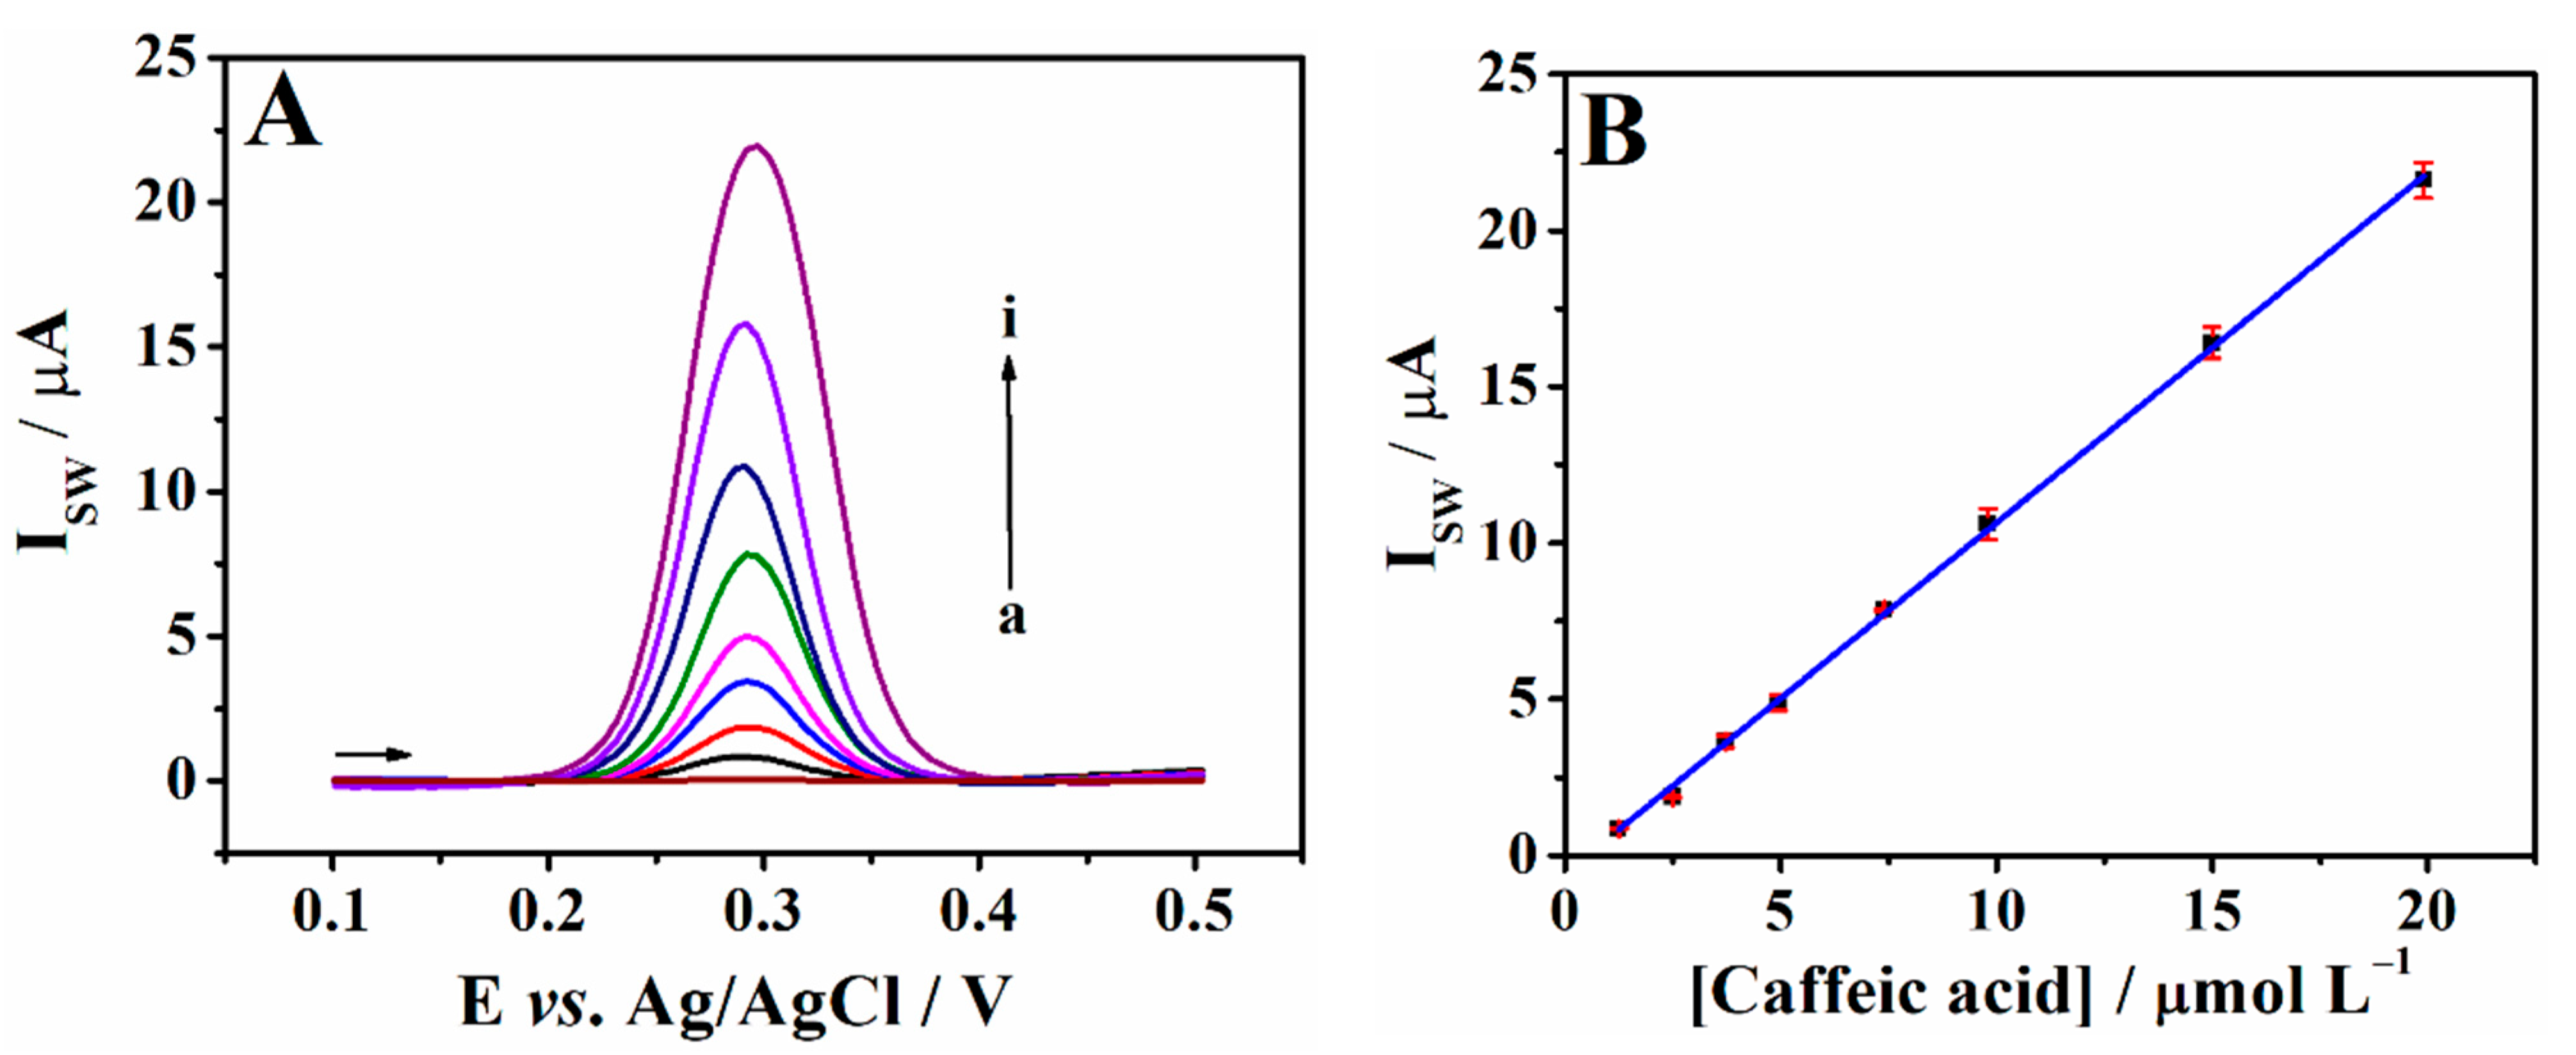
3.5. Calibration Plot for Caffeic Acid

Under optimal conditions, the calibration plot for the caffeic acid was generated by SWV over a concentration range of 1.25 to 19.9 µmol L−1 using the PEI/CPE (Figure 4A). A defined peak around +0.29 (±0.03) V associated with caffeic acid oxidation can be observed. The calibration plot for the caffeic acid is shown in Figure 4B. The linear regression equation is given by: ISW/µA = 1.12(±0.04)[caffeic acid]/µmol L−1 − 0.58(±0.05) (r = 0.997), where ISW is the resulting square wave peak current in µA and [caffeic acid] is the concentration of the caffeic acid in µmol L−1. The method used to calculate the limit of detection (LOD) and the limit of quantification (LOQ) was based on the standard deviation (SD) of the intercept and the slope of the calibration plot (s), using the formulas LOD  =  3 × (SD/s) and LOQ  =  10 × (SD/s) [35]. The LOD and LOQ values calculated for the caffeic acid were 0.13 and 0.44 µmol L−1, respectively.
Table 1 lists other sensors, including unmodified electrodes [5] and modified electrodes [5,6,32,36,37,38], applied in the electroanalysis of caffeic acid. It can be noted that the LOD obtained with the PEI/CPE is between the values obtained by other researchers. In addition, the advantages of using a CPE are highlighted, such as the easy preparation and modification, in which low-cost materials can be used, and the ease of cleaning the surface by manual sanding on a sheet of paper. Thus, the PEI/CPE is an excellent analytical tool for the determination of caffeic acid.

3.6. Repeatability and Selectivity

The precision of the results furnished by the PEI/CPE for the determination of caffeic acid was evaluated by means of repeatability measures. The repeatability of the current response was estimated under optimized conditions in 0.1 mol L−1 acetate buffer (pH 5.0) containing 3.85 µmol L−1 caffeic acid. The relative standard deviation (RSD) of the current values measured on the same day with the same electrode (intra-day repeatability) (n = 7) was 4.85%, indicating that the precision of the peak currents provided by the device was satisfactory. The inter-day repeatability of the responses of three different electrodes was evaluated based on three current measurements taken on three consecutive days. The RSD value obtained was 5.38%, indicating that a satisfactory precision of measurement could be maintained even with different electrodes.
To evaluate the selectivity provided by the PEI/CPE with respect to possible interference, assays were performed for caffeic acid by SWV in the presence of potential interferent organic molecules. The tests were carried out in 0.1 mol L−1 acetate buffer (pH 5.0) containing 3.85 μmol L−1 caffeic acid (+0.32 V vs. Ag/AgCl) in the presence of ferulic acid (+0.45 V), p-coumaric acid (+0.62 V), methyldopa (+0.27 V), paracetamol (+0.53 V), and rutin (+0.41 V), which were added at a concentration 20 times higher than that of the caffeic acid. The oxidation peaks of the interfering potentials were far from the caffeic acid oxidation potential, with a lower current response. In addition, the decrease in the oxidation currents for caffeic acid was lower than 5% in the presence of potential interference. These data demonstrate that the proposed PEI/CPE exhibited good selectivity for caffeic acid in the presence of potentially interfering compounds.

3.7. Analytical Application

In order to evaluate the efficiency of the developed method, the quantification of caffeic acid in dried thyme and sage samples was performed using the PEI/CPE sensor (Table 2). The quantification of the caffeic acid was performed by SWV, in triplicate, using the standard addition method. For the thyme sample, an average content of 0.37 mg g−1 of caffeic acid was calculated. This result is similar to the data from Mahrye et al. [39], determined using reversed-phase HPLC (0.31 mg g−1), and from Gavarić et al. [40], in a study which determined 0.35 mg g−1 by HPLC/DAD. Regarding the sage samples, an average content of 0.45 mg g−1 of caffeic acid was calculated, which was close to the results of Alharbi et al. [41] (0.39 mg g−1 with HPLC/DAD) and Milevskaya et al. [42] (0.41 mg g−1 with HPLC/DAD). Recovery values in experiments were obtained between 93 and 105%. These results confirm the accuracy of the data provided by the analytical method.

4. Conclusions

A novel PEI/CPE electrochemical sensor was constructed, characterized, and employed in the quantification of caffeic acid in dried aromatic herb samples. The improved sensor was obtained by modifying carbon paste with polyethyleneimine. The simple preparation, curt analysis time, lack of a requirement for a purification step or pre-treatment of the samples, the low cost, and good precision of results were advantages of the suggested sensor. When applied in the determination of caffeic acid in dried aromatic herb samples, the PEI/CPE sensor provided satisfactorily accurate responses and adequate sensitivity throughout the assays. All of these capacities indicate the viability of the application of the PEI/CPE in the determination of caffeic acid.

Author Contributions

Conceptualization, F.Z. and T.R.S.; methodology, F.Z. and T.R.S.; validation, F.Z. and T.R.S.; investigation, F.Z. and T.R.S.; formal analysis, F.Z. and E.R.S.; writing—original draft preparation, E.R.S. and J.P.W.; writing—review and editing, E.R.S., J.P.W. and I.C.V.; supervision, I.C.V.; project administration, I.C.V. All authors have read and agreed to the published version of the manuscript.

Funding

This research was funded by Conselho Nacional de Desenvolvimento Científico e Tecnológico (CNPq) and Coordenação de Aperfeiçoamento de Pessoal de Nível Superior (Capes), finance code 001.

Data Availability Statement

Data are available from the authors on reasonable request.

Acknowledgments

The authors are thankful to the Brazilian government agencies: CNPq (Conselho Nacional de Desenvolvimento Científico e Tecnológico) and CAPES (Coordenação de Aperfeiçoamento de Pessoal de Nível Superior).

Conflicts of Interest

The authors declare no conflict of interest.

References

  1. Ares, A.M.; Bernal, J.L.; Nozal, M.J.; Bernal, J. Analysis of Herbal Bioactives. In Aromatic Herbs in Food: Bioactive Compounds, Processing, and Applications; Elsevier Inc.: New York, NY, USA, 2021; pp. 201–232. ISBN 9780128227169. [Google Scholar]
  2. Chong, C.H.; Figiel, A.; Szummy, A.; Wojdyło, A.; Chua, B.L.; Khek, C.H.; Yuan, M.C. Herbs Drying. In Aromatic Herbs in Food: Bioactive Compounds, Processing, and Applications; Elsevier Inc.: New York, NY, USA, 2021; pp. 167–200. ISBN 978-0-12-822716-9. [Google Scholar]
  3. Guiné, R.P.F.; Gonçalves, F.J. Bioactive Compounds in Some Culinary Aromatic Herbs and Their Effects on Human Health. Mini-Rev. Med. Chem. 2016, 16, 855–866. [Google Scholar] [CrossRef] [PubMed]
  4. Bounegru, A.V.; Apetrei, C. Voltamperometric Sensors and Biosensors Based on Carbon Nanomaterials Used for Detecting Caffeic Acid—A Review. Int. J. Mol. Sci. 2020, 21, 9275. [Google Scholar] [CrossRef] [PubMed]
  5. Bounegru, A.V.; Apetrei, C. Voltammetric Sensors Based on Nanomaterials for Detection of Caffeic Acid in Food Supplements. Chemosensors 2020, 8, 41. [Google Scholar] [CrossRef]
  6. Venkadesh, A.; Mathiyarasu, J.; Radhakrishnan, S. MOF Mediated Synthesis of Porous Copper Oxide and Their Electrochemical Sensing of Caffeic Acid in Caffeinated Drinks. Inorg. Chem. Commun. 2021, 128, 108573. [Google Scholar] [CrossRef]
  7. Khan, F.; Bamunuarachchi, N.I.; Tabassum, N.; Kim, Y.M. Caffeic Acid and Its Derivatives: Antimicrobial Drugs toward Microbial Pathogens. J. Agric. Food Chem. 2021, 69, 2979–3004. [Google Scholar] [CrossRef]
  8. Adem, Ş.; Eyupoglu, V.; Sarfraz, I.; Rasul, A.; Zahoor, A.F.; Ali, M.; Abdalla, M.; Ibrahim, I.M.; Elfiky, A.A. Caffeic Acid Derivatives (CAFDs) as Inhibitors of SARS-CoV-2: CAFDs-Based Functional Foods as a Potential Alternative Approach to Combat COVID-19. Phytomedicine 2021, 85, 153310. [Google Scholar] [CrossRef]
  9. Tartaglia, A.; Romasco, T.; D’Ovidio, C.; Rosato, E.; Ulusoy, H.I.; Furton, K.G.; Kabir, A.; Locatelli, M. Determination of Phenolic Compounds in Human Saliva after Oral Administration of Red Wine by High Performance Liquid Chromatography. J. Pharm. Biomed. Anal. 2022, 209, 114486. [Google Scholar] [CrossRef]
  10. Mao, H.; Zhang, Y.; Chen, G. Determination of Three Phenolic Acids in Cimicifugae Rhizoma by Capillary Electrophoresis with a Graphene-Phenolic Resin Composite Electrode. Anal. Methods 2019, 11, 303–308. [Google Scholar] [CrossRef]
  11. Santana, E.R.; Martins, E.C.; Spinelli, A. Electrode Modified with Nitrogen-Doped Graphene Quantum Dots Supported in Chitosan for Triclocarban Monitoring. Microchem. J. 2021, 167, 106297. [Google Scholar] [CrossRef]
  12. Winiarski, J.P.; Rampanelli, R.; Bassani, J.C.; Mezalira, D.Z.; Jost, C.L. Multi-Walled Carbon Nanotubes/Nickel Hydroxide Composite Applied as Electrochemical Sensor for Folic Acid (Vitamin B9) in Food Samples. J. Food Compos. Anal. 2020, 92, 103511. [Google Scholar] [CrossRef]
  13. Piovesan, J.V.; Santana, E.R.; Spinelli, A. A Carbon Paste Electrode Improved with Poly(Ethylene Glycol) for Tannic Acid Surveillance in Beer Samples. Food Chem. 2020, 326, 127055. [Google Scholar] [CrossRef] [PubMed]
  14. Antoniazzi, C.; Lima, C.A.; Marangoni, R.; Castro, E.G.; Santana, E.R.; Spinelli, A. Molybdenum Trioxide Incorporated in a Carbon Paste as a Sensitive Device for Bisphenol A Monitoring. Microchem. J. 2020, 159, 105528. [Google Scholar] [CrossRef]
  15. Moreira, F.; Santana, E.R.; Spinelli, A. Ionic Liquid-Supported Magnetite Nanoparticles as Electrode Modifier Materials for Estrogens Sensing. Sci. Rep. 2020, 10, 1955. [Google Scholar] [CrossRef]
  16. Ulbrich, K.F.; Winiarski, J.P.; Jost, C.L.; de Campos, C.E.M. Green and Facile Solvent-Free Synthesis of NiTe2 Nanocrystalline Material Applied to Voltammetric Determination of Antioxidant Morin. Mater. Today Commun. 2020, 25, 101251. [Google Scholar] [CrossRef]
  17. Wegmann, F.; Gartlan, K.H.; Harandi, A.M.; Brinckmann, S.A.; Coccia, M.; Hillson, W.R.; Kok, W.L.; Cole, S.; Ho, L.P.; Lambe, T.; et al. Polyethyleneimine Is a Potent Mucosal Adjuvant for Viral Glycoprotein Antigens. Nat. Biotechnol. 2012, 30, 883–888. [Google Scholar] [CrossRef] [PubMed]
  18. Chen, Z.; Zeng, J.; Zhang, Z.B.; Zhang, Z.J.; Ma, S.; Tang, C.M.; Xu, J.Q. Preparation and Application of Polyethyleneimine-Modified Corncob Magnetic Gel for Removal of Pb(II) and Cu(II) Ions from Aqueous Solution. RSC Adv. 2022, 12, 1950–1960. [Google Scholar] [CrossRef] [PubMed]
  19. Li, X.; Lin, L.Y.; Wang, K.Y.; Li, J.; Feng, L.; Song, L.; Liu, X.; He, J.H.; Sakthivel, R.; Chung, R.J. Streptavidin-Functionalized-Polyethyleneimine/Chitosan/HfO2-Pr6O11 Nanocomposite Using Label-Free Electrochemical Immunosensor for Detecting the Hunger Hormone Ghrelin. Compos. Part B Eng. 2021, 224, 109231. [Google Scholar] [CrossRef]
  20. Riva, L.; Fiorati, A.; Punta, C. Synthesis and Application of Cellulose-Polyethyleneimine Composites and Nanocomposites: A Concise Review. Materials 2021, 14, 473. [Google Scholar] [CrossRef]
  21. Usman, M.A.; Khan, A.Y. Selective Adsorption of Anionic Dye from Wastewater Using Polyethyleneimine Based Macroporous Sponge: Batch and Continuous Studies. J. Hazard. Mater. 2022, 428, 128238. [Google Scholar] [CrossRef]
  22. Luo, J.H.; Li, B.L.; Li, N.B.; Luo, H.Q. Sensitive Detection of Gallic Acid Based on Polyethyleneimine- Functionalized Graphene Modified Glassy Carbon Electrode. Sens. Actuators B Chem. 2013, 186, 84–89. [Google Scholar] [CrossRef]
  23. Arman, A.; Saǧlam, Ş.; Üzer, A.; Apak, R. Direct Electrochemical Determination of Peroxide-Type Explosives Using Well-Dispersed Multi-Walled Carbon Nanotubes/Polyethyleneimine-Modified Glassy Carbon Electrodes. Anal. Chem. 2021, 93, 11451–11460. [Google Scholar] [CrossRef] [PubMed]
  24. Arman, A.; Sağlam, Ş.; Üzer, A.; Apak, R. Electrochemical Determination of Nitroaromatic Explosives Using Glassy Carbon/Multi Walled Carbon Nanotube/Polyethyleneimine Electrode Coated with Gold Nanoparticles. Talanta 2022, 238, 122990. [Google Scholar] [CrossRef] [PubMed]
  25. Kim, M.Y.; Park, H.; Lee, J.Y.; Park, D.J.; Lee, J.Y.; Myung, N.V.; Lee, K.H. Hierarchically Palladium Nanoparticles Embedded Polyethyleneimine-Reduced Graphene Oxide Aerogel (RGA-PEI-Pd) Porous Electrodes for Electrochemical Detection of Bisphenol A and H2O2. Chem. Eng. J. 2022, 431, 134250. [Google Scholar] [CrossRef]
  26. Duan, Y.; Yang, Y.; Wang, J.; Li, H.; Liu, K. A Facile One-Pot Synthesis of Polyethyleneimine Functionalized Graphene for the Highly-Sensitive and Selective Electrochemical Impedance Aptasensing of Kanamycin in Serum. Anal. Methods 2020, 12, 132–140. [Google Scholar] [CrossRef]
  27. Zanello, P. Inorganic Electrochemistry: Theory, Practice and Application; Royal Society of Chemistry Publishing: Cambridge, UK, 2003; ISBN 0854046615. [Google Scholar]
  28. Klingler, R.J.; Kochi, J.K. Electron-Transfer Kinetics from Cyclic Voltammetry. Quantitative Description of Electrochemical Reversibility. J. Phys. Chem. 1981, 85, 1731–1741. [Google Scholar] [CrossRef]
  29. Konopka, S.J.; McDuffie, B. Diffusion Coefficients of Ferri- and Ferrocyanide Ions in Aqueous Media Using Twin-Electrode Thin-Layer Electrochemistry. Anal. Chem. 1970, 42, 1741–1746. [Google Scholar] [CrossRef]
  30. Luo, Y.; Li, Z. A Sensitive Electrochemical Sensor Manufactured from Multi-Wall Carbon Nanotubes-Polyethylenimine Nanocomposite for Malachite Green Detection. J. Alloys Compd. 2022, 897, 163216. [Google Scholar] [CrossRef]
  31. Ferrari, A.G.M.; Foster, C.W.; Kelly, P.J.; Brownson, D.A.C.; Banks, C.E. Determination of the Electrochemical Area of Screen-Printed Electrochemical Sensing Platforms. Biosensors 2018, 8, 53. [Google Scholar] [CrossRef]
  32. Xie, A.; Wang, H.; Zhu, J.; Chang, J.; Gu, L.; Liu, C.; Yang, Y.; Ren, Y.; Luo, S. A Caffeic Acid Sensor Based on CuZnOx/MWCNTs Composite Modified Electrode. Microchem. J. 2021, 161, 105786. [Google Scholar] [CrossRef]
  33. İlyasoğlu, H.; Nadzieja, M.; Guo, Z. Caffeic Acid Grafted Chitosan as a Novel Dual-Functional Stabilizer for Food-Grade Emulsions and Additive Antioxidant Property. Food Hydrocoll. 2019, 95, 168–176. [Google Scholar] [CrossRef]
  34. Mintis, D.G.; Alexiou, T.S.; Mavrantzas, V.G. Effect of PH and Molecular Length on the Structure and Dynamics of Linear and Short-Chain Branched Poly(Ethylene Imine) in Dilute Solution: Scaling Laws from Detailed Molecular Dynamics Simulations. J. Phys. Chem. B 2020, 124, 6154–6169. [Google Scholar] [CrossRef] [PubMed]
  35. Gumustas, M.; Ozkan, S.A. The Role of and the Place of Method Validation in Drug Analysis Using Electroanalytical Techniques. Open Anal. Chem. J. 2011, 5, 1–21. [Google Scholar] [CrossRef]
  36. Araújo, D.A.G.; Camargo, J.R.; Pradela-Filho, L.A.; Lima, A.P.; Muñoz, R.A.A.; Takeuchi, R.M.; Janegitz, B.C.; Santos, A.L. A Lab-Made Screen-Printed Electrode as a Platform to Study the Effect of the Size and Functionalization of Carbon Nanotubes on the Voltammetric Determination of Caffeic Acid. Microchem. J. 2020, 158, 105297. [Google Scholar] [CrossRef]
  37. Shi, Y.; Xu, H.; Gu, Z.; Wang, C.; Du, Y. Sensitive Detection of Caffeic Acid with Trifurcate PtCu Nanocrystals Modified Glassy Carbon Electrode. Colloids Surf. A Physicochem. Eng. Asp. 2019, 567, 27–31. [Google Scholar] [CrossRef]
  38. Wang, J.; Yang, B.; Gao, F.; Song, P.; Li, L.; Zhang, Y.; Lu, C.; Goh, M.C.; Du, Y. Ultra-Stable Electrochemical Sensor for Detection of Caffeic Acid Based on Platinum and Nickel Jagged-like Nanowires. Nanoscale Res. Lett. 2019, 14, 11. [Google Scholar] [CrossRef]
  39. Mahrye; Anwar, F.; Mehmood, T.; Qadir, R.; Riaz, M. Phenolics Profiling and Biological Activities of Different Solvent Extracts from Aerial Parts of Wild Thyme (Thymus vulgaris L.). J. Food Meas. Charact. 2022, 16, 610–618. [Google Scholar] [CrossRef]
  40. Gavarić, N.; Kladar, N.; Mišan, A.; Nikolić, A.; Samojlik, I.; Mimica-Dukić, N.; Božin, B. Postdistillation Waste Material of Thyme (Thymus vulgaris L., Lamiaceae) as a Potential Source of Biologically Active Compounds. Ind. Crops Prod. 2015, 74, 457–464. [Google Scholar] [CrossRef]
  41. Alharbi, Y.M.; Sakr, S.S.; Albarrak, S.M.; Almundarij, T.I.; Barakat, H.; Hassan, M.F.Y. Antioxidative, Antidiabetic, and Hypolipidemic Properties of Probiotic-Enriched Fermented Camel Milk Combined with Salvia Officinalis Leaves Hydroalcoholic Extract in Streptozotocin-Induced Diabetes in Rats. Antioxidants 2022, 11, 668. [Google Scholar] [CrossRef]
  42. Milevskaya, V.V.; Temerdashev, Z.A.; Butyl’skaya, T.S.; Kiseleva, N.V. Determination of Phenolic Compounds in Medicinal Plants from the Lamiaceae Family. J. Anal. Chem. 2017, 72, 342–348. [Google Scholar] [CrossRef]
Figure 1. (A) Study of the effect of the percentage of PEI solution and (B) PEI solution volume on the relative response of the PEI/CPE to caffeic acid (n = 3).
Chemosensors 10 00357 g001
Figure 2. (A) Cyclic voltammograms of 5.0 mmol L−1 K4[Fe(CN6)] in 0.1 mol L−1 KCl at (a) the CPE and (b) PEI/CPE (ν = 100 mV s−1). Cyclic voltammograms for 5.0 mmol L−1 K4[Fe(CN6)] in 0.1 mol L−1 KCl at (B) the CPE and (C) PEI/CPE with different scan rate values: (a) 10, (b) 20, (c) 30, (d) 40, (e) 50, (f) 60, (g) 70, (h) 80, (i) 90, and (j) 100 mV s−1. Inserted: plot of Ipa vs. ν½. (D) Nyquist plots for 5.0 mmol L−1 equimolar mixture of K3[Fe(CN)6]/K4[Fe(CN)6] in 0.1 mol L−1 KCl at (a) the CPE and (b) PEI/CPE. Inserted: amplification of diagram obtained in the PEI/CPE and the Randles circuit. Rs: solution resistance; Rct: charge transfer resistance; Zw: Warburg impedance; Cdl: double-layer capacitance.
Chemosensors 10 00357 g002
Figure 3. (A) Cyclic voltammograms of 9.09 × 10⁻⁵ mol L−1 caffeic acid in 0.1 mol L−1 B-R buffer (pH 5.0) at (a) the CPE and (b) PEI/CPE. (B) Cyclic voltammograms of 9.09 × 10⁻⁵ mol L−1 caffeic acid obtained by the PEI/CPE in 0.1 mol L−1 B-R buffer at pH values of 3.0 to 8.0 (ν = 100 mV s−1). (C) Relative response of current vs. pH (axis a) and peak potential vs. pH (axis b). (D) Cyclic voltammograms of 9.09 × 10⁻⁵ mol L−1 caffeic acid in 0.1 mol L−1 acetate buffer (pH 5.0) using the PEI/CPE at different scan rates: (a) 10.0, (b) 25.0, (c) 50.0, and (d) 100 mV s−1. (E) Logarithm of peak current vs. logarithm of scan rate. (F) Proposed reaction for caffeic acid at the PEI/CPE.
Chemosensors 10 00357 g003aChemosensors 10 00357 g003b
Figure 4. (A) Square wave voltammograms for different concentrations of caffeic acid in 0.1 mol L−1 acetate buffer (pH 5.0) at the PEI/CPE: (a) blank, (b) 1.25, (c) 2.49, (d) 3.72, (e) 4.95, (f) 7.39, (g) 9.80, (h) 15.0, and (i) 19.9 µmol L−1. (B) Calibration plot for caffeic acid (n = 3). SWV parameters: a = 70 mV, f = 30 Hz and ΔEs = 3 mV.
Chemosensors 10 00357 g004
Table 1. Comparison of analytical performance of PEI/CPE with other electrodes in the determination of caffeic acid.
ElectrodesTechniquepHLinear range /µmol L−1LOD/µmol L−1Reference
Porous CuO/GCEAMP aPhosphate buffer (pH 7.0)0.05–229.50.04[6]
MWCNTs b/SPCE cCVPhosphate buffer (pH 3.6)0.1–40.00.06[5]
SPCECVPhosphate buffer (pH 3.6)0.1–40.00.13[5]
CuZnOx/MWCNTs/GCEAMPPhosphate buffer (pH 7.0)1.0–1000.15[32]
MWCNTs/SPCEDPVPerchloric acid solution2.0–50.00.20[36]
PtCu nanocrystals/GCEDPVPhosphate buffer (pH 2.0)1.2–357.90.30[37]
PtNi-C d/GCEDPVB-R buffer (pH 2.0)0.75–5910.50[38]
PEI/CPESWVAcetate buffer (pH 5.0)1.25 to 19.90.13This study
a AMP: amperometry; b MWCNTs: multi-walled carbon nanotubes; c SCPE: screen-printed carbon electrode, d PtNi-C: platinum and nickel nanowires supported in carbon.
Table 2. Determination of the content of caffeic acid in thyme and sage samples using the sensor.
SampleDetermined aAdded/µmol L−1Found a/µmol L−1Recovery/%
mg g−1µmol L−1
Thyme (Thymus vulgaris)0.37 ± 0.053.17 ± 0.431.004.2095–102
Sage (Salvia officinalis)0.45 ± 0.183.87 ± 0.771.004.9093–105
an = 3.
Publisher’s Note: MDPI stays neutral with regard to jurisdictional claims in published maps and institutional affiliations.

