
Model Development for Alcohol Concentration in Exhaled Air at Low Temperature Using Electronic Nose
 ,
,
Abstract
: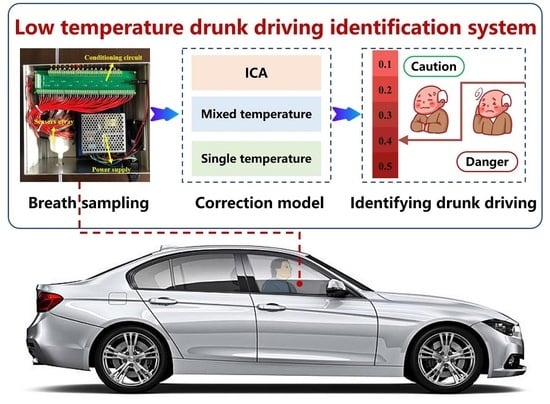
1. Introduction
2. Materials and Methods
2.1. Samples
2.2. Electronic Nose Detection System
2.3. Data Collection and Pretreatment
2.4. Single Temperature Model
2.5. Mixed Temperature Correction Model
2.6. ICA Correction Model
3. Results and Discussion
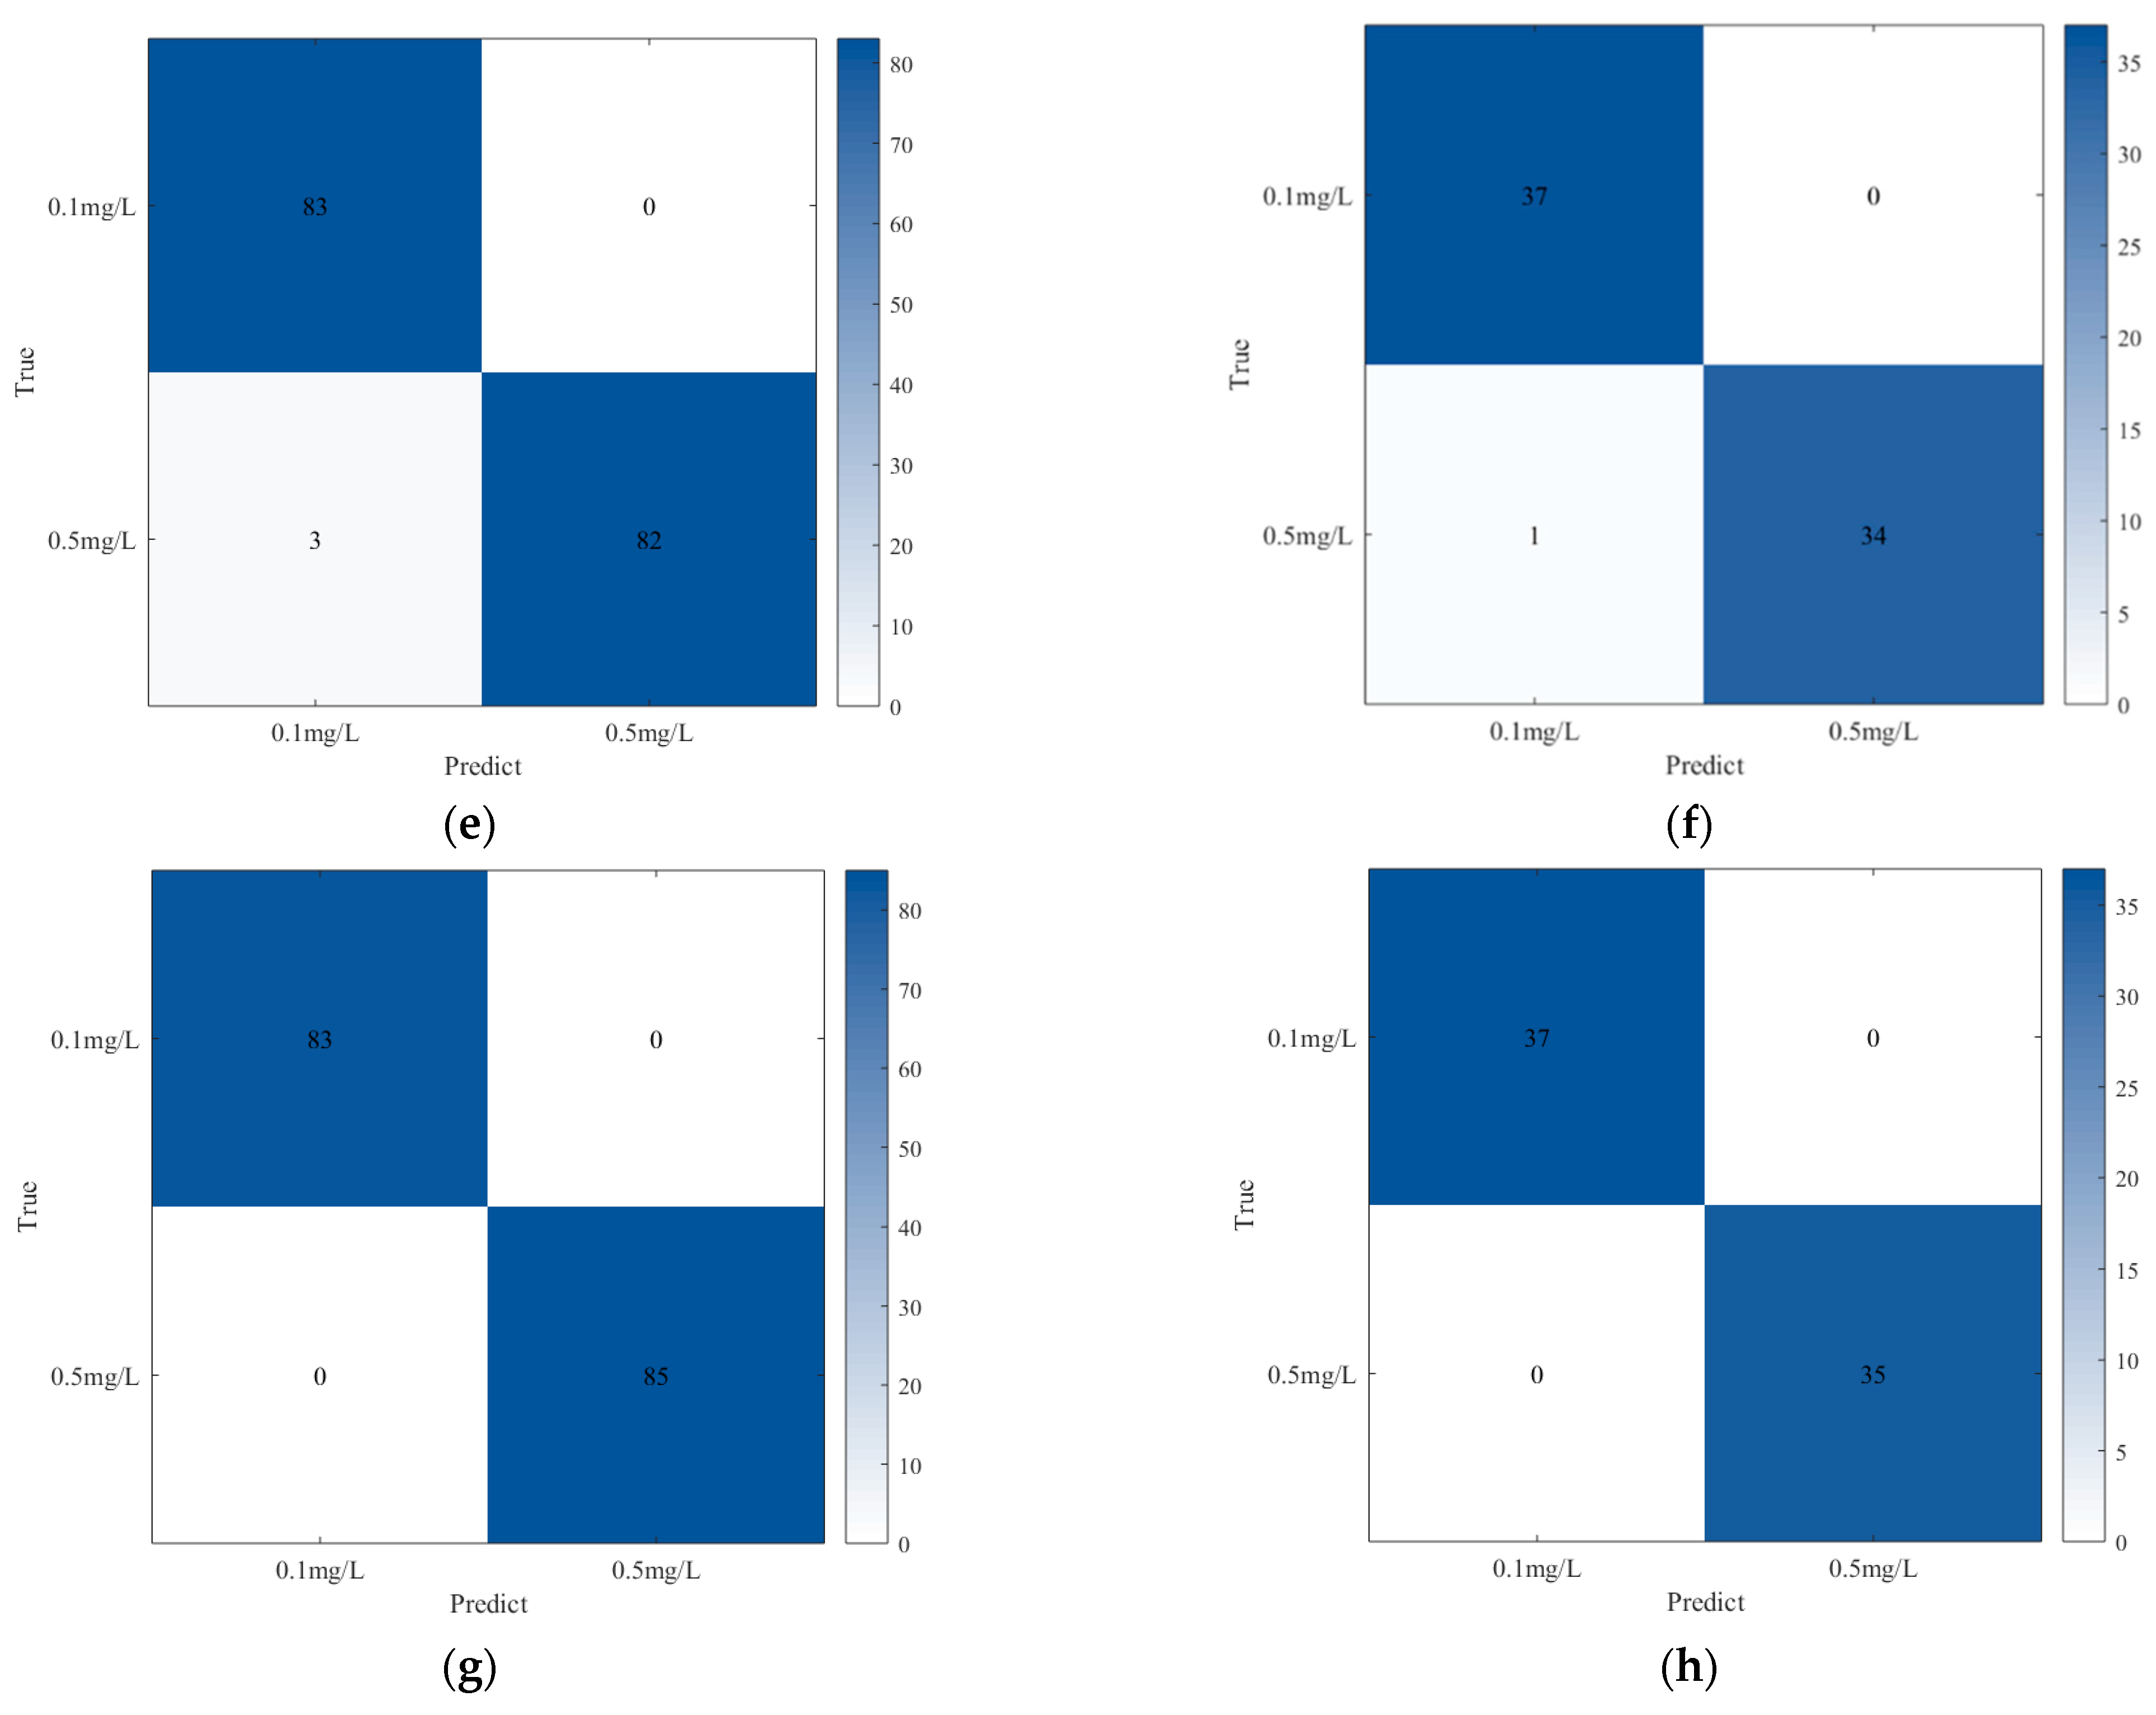
3.1. Results of the Single Temperature Model
3.2. Results of Mixed Temperature Correction Model
3.3. Results of the ICA Correction Model
3.4. Comparison of Model Prediction Results
4. Conclusions
Author Contributions
Funding
Institutional Review Board Statement
Informed Consent Statement
Data Availability Statement
Conflicts of Interest
References
- Rosero-Montalvo, P.D.; López-Batista, V.F.; Peluffo-Ordóñez, D.H. Hybrid embedded-systems-based approach to in-driver drunk status detection using image processing and sensor networks. IEEE Sens. J. 2020, 21, 15729–15740. [Google Scholar] [CrossRef]
- Zuba, D. Accuracy and reliability of breath alcohol testing by handheld electrochemical analysers. Forensic Sci. Int. 2008, 178, e29–e33. [Google Scholar] [CrossRef] [PubMed]
- Delgado, M.K.; Shofer, F.; Wetherill, R.; Curtis, B.; Hemmons, J.; Spencer, E.; Branas, C.; Wiebe, D.J.; Kranzler, H.R. Accuracy of consumer-marketed smartphone-paired alcohol breath testing devices: A laboratory validation study. Alcohol. Clin. Exp. Res. 2021, 45, 1091–1099. [Google Scholar] [CrossRef]
- Peris, M.; Escuder-Gilabert, L. A 21st century technique for food control: Electronic noses. Anal. Chim. Acta 2009, 638, 1–15. [Google Scholar] [CrossRef]
- Jia, W.; Liang, G.; Wang, Y.; Wang, J. Electronic noses as a powerful tool for assessing meat quality: A mini review. Food Anal. Methods 2018, 11, 2916–2924. [Google Scholar] [CrossRef]
- Winquist, F.; Lundström, I.; Wide, P. The combination of an electronic tongue and an electronic nose. Sens. Actuators B Chem. 1999, 58, 512–517. [Google Scholar] [CrossRef]
- Young, R.C.; Buttner, W.J.; Linnell, B.R.; Ramesham, R. Electronic nose for space program applications. Sens. Actuators B Chem. 2003, 93, 7–16. [Google Scholar] [CrossRef]
- Fonollosa, J.; Rodriguez-Lujan, I.; Shevade, A.V.; Homer, M.L.; Ryan, M.A.; Huerta, R. Human activity monitoring using gas sensor arrays. Sens. Actuators B Chem. 2014, 199, 398–402. [Google Scholar] [CrossRef]
- Ryan, M.; Homer, M.; Zhou, H.; Mannatt, K.; Ryan, V.; Jackson, S. Operation of an Electronic Nose Aboard the Space Shuttle and Directions for Research for a Second Generation Device; SAE Technical Paper 2000-01-2512; SAE International: Warrendale, PA, USA, 2000. [Google Scholar]
- De Vito, S.; Miglietta, M.L.; Massera, E.; Fattoruso, G.; Formisano, F.; Polichetti, T.; Salvato, M.; Alfano, B.; Esposito, E.; Di Francia, G. Electronic noses for composites surface contamination detection in aerospace industry. Sensors 2017, 17, 754. [Google Scholar] [CrossRef] [PubMed]
- Sun, Z.H.; Liu, K.X.; Xu, X.H.; Meng, Q.H. In Odor Evaluation of Vehicle Interior Materials Based on Portable E-Nose. In Proceedings of the 2020 39th Chinese Control Conference (CCC), Shenyang, China, 27–29 July 2020; IEEE: Piscataway, NJ, USA, 2020; pp. 2998–3003. [Google Scholar]
- Wasilewski, T.; Migon, D.; Gebicki, J.; Kamysz, W. Critical review of electronic nose and tongue instruments prospects in pharmaceutical analysis. Anal. Chim. Acta 2019, 1077, 14–29. [Google Scholar] [CrossRef]
- Xu, J.; Liu, K.; Zhang, C. Electronic nose for volatile organic compounds analysis in rice aging. Trends Food Sci. Technol. 2021, 109, 83–93. [Google Scholar] [CrossRef]
- Gong, J.W.; Chen, Q.F.; Lian, M.R.; Liu, N.C.; Daoust, C. Temperature feedback control for improving the stability of a semiconductor-metal-oxide (SMO) gas sensor. IEEE Sens. J. 2006, 6, 139–145. [Google Scholar]
- Akhter, F.; Alahi, M.E.E.; Siddiquei, H.R.; Gooneratne, C.P.; Mukhopadhyay, S.C. Graphene oxide (GO) coated impedimetric gas sensor for selective detection of carbon dioxide (CO2) with temperature and humidity compensation. IEEE Sens. J. 2020, 21, 4241–4249. [Google Scholar] [CrossRef]
- Wang, C.; Yin, L.; Zhang, L.; Xiang, D.; Gao, R. Metal oxide gas sensors: Sensitivity and influencing factors. Sensors 2010, 10, 2088–2106. [Google Scholar] [CrossRef]
- Mahdavi, H.; Rahbarpour, S.; Hosseini-Golgoo, S.M.; Jamaati, H. Reducing the destructive effect of ambient humidity variations on gas detection capability of a temperature modulated gas sensor by calcium chloride. Sens. Actuators B Chem. 2021, 331, 129091. [Google Scholar] [CrossRef]
- Liang, Z.; Tian, F.; Yang, S.X.; Zhang, C.; Sun, H.; Liu, T. Study on interference suppression algorithms for electronic noses: A review. Sensors 2018, 18, 1179. [Google Scholar] [CrossRef]
- Nebhen, J.; Meillère, S.; Masmoudi, M.; Seguin, J.L.; Barthelemy, H.; Aguir, K. Temperature compensated CMOS ring VCO for MEMS gas sensor. Analog Integr. Circuits Signal Process. 2013, 76, 225–232. [Google Scholar] [CrossRef]
- Jiang, Y.; Zhao, Y. Design of temperature compensation system for MEMS gyroscopes based on STM32. In Proceedings of the IOP Conference Series: Materials Science and Engineering—4th Annual International Workshop on Materials Science and Engineering (IWMSE2018), Xi’an, China, 18–20 May 2018; IOP Publishing: Bristol, UK, 2018; p. 012139. [Google Scholar]
- Zhou, G.; Zhao, Y.; Guo, F.; Xu, W. A smart high accuracy silicon piezoresistive pressure sensor temperature compensation system. Sensors 2014, 14, 12174–12190. [Google Scholar] [CrossRef]
- Yu, X.; Lv, R.H.; Song, F.; Zheng, C.T.; Wang, Y.D. Pocket-sized nondispersive infrared methane detection device using two-parameter temperature compensation. Spectrosc. Lett. 2014, 47, 30–37. [Google Scholar] [CrossRef]
- Xun, L. In Development of ultra-low power natural gas metering device based on pressure sensor temperature compensation method. In Proceedings of the 2015 12th IEEE International Conference on Electronic Measurement & Instruments (ICEMI), Qingdao, China, 16–18 July 2015; IEEE: Piscataway, NJ, USA, 2015; pp. 1567–1571. [Google Scholar]
- Piao, H.; Cheng, D.; Chen, C.; Wang, Y.; Wang, P.; Pan, X. A Temperature Gradient Field Compensation Method to Improve the Accuracy of the CO2 Carbon Isotope Sensor. IEEE Trans. Instrum. Meas. 2022, 71, 1–12. [Google Scholar] [CrossRef]
- Zhang, C.; Wang, W.; Pan, Y.; Cheng, L.; Zhai, S.; Gao, X. A two-stage method for real-time baseline drift compensation in gas sensors. Meas. Sci. Technol. 2022, 33, 045108. [Google Scholar] [CrossRef]
- Liu, Y.; Ma, T. Parasitic resistance-based high precision capacitive MEMS accelerometer phase shift and its usage for temperature compensation. IEEE Sens. J. 2017, 18, 629–634. [Google Scholar] [CrossRef]
- Wang, Y.; Sun, X.; Huang, T.; Ye, L.; Song, K. Cold Starting Temperature Drift Modeling and Compensation of Micro-Accelerometer Based on High-Order Fourier Transform. Micromachines 2022, 13, 413. [Google Scholar] [CrossRef] [PubMed]
- Xu, P.; Song, K.; Xia, X.; Chen, Y.; Wang, Q.; Wei, G. Temperature and Humidity Compensation for MOS Gas Sensor Based on Random Forests. In Proceedings of the International Conference on Intelligent Computing for Sustainable Energy and Environment (ICSEE 2017), Nanjing, China, 22–24 September 2017; pp. 135–145. [Google Scholar]
- Hossein-Babaei, F.; Ghafarinia, V. Compensation for the drift-like terms caused by environmental fluctuations in the responses of chemoresistive gas sensors. Sens. Actuators B Chem. 2010, 143, 641–648. [Google Scholar] [CrossRef]
- Cheng, J.; Qi, B.; Chen, D.; René, L., Jr. Modification of an RBF ANN-Based Temperature Compensation Model of Interferometric Fiber Optical Gyroscopes. Sensors 2015, 15, 11189–11207. [Google Scholar] [CrossRef] [PubMed]
- Wang, H.; Zhang, W.; You, L.; Yuan, G.; Zhao, Y.; Jiang, Z. BACK PROPAGATION NEURAL NETWORK MODEL FOR TEMPERATURE AND HUMIDITY COMPENSATION OF A NON DISPERSIVE INFRARED METHANE SENSOR. Instrum. Sci. Technol. 2013, 41, 608–618. [Google Scholar] [CrossRef]
- Liang, H.; Chen, H.; Lu, Y. Research on sensor error compensation of comprehensive logging unit based on machine learning. J. Intell. Fuzzy Syst. 2019, 37, 3113–3123. [Google Scholar] [CrossRef]
- Zhu, X.; Liu, T.; Chen, J.; Cao, J.; Wang, H. One-Class Drift Compensation for an Electronic Nose. Chemosensors 2021, 9, 208. [Google Scholar] [CrossRef]
- Dobrzyniewski, D.; Szulczynski, B.; Gebicki, J. Determination of Odor Air Quality Index (OAQII) Using Gas Sensor Matrix. Molecules 2022, 27, 4180. [Google Scholar] [CrossRef]
- Shuba, A.; Kuchmenko, T.; Menzhulina, D. Drift Compensation of the Electronic Nose in the Development of Instruments for Out-of-Laboratory Analysis. In Proceedings of the 1st International Electronic Conference on Chemical Sensors and Analytical Chemistry (CSAC 2021), Online Conference, 1–15 July 2021. [Google Scholar]
- Ferguson, S.A.; Zaouk, A.; Dalal, N.; Strohl, C.; Traube, E.; Strassburger, R. Driver Alcohol Detection System for Safety (DADSS)—Phase I Prototype Testing and Findings. In Proceedings of the 22nd International Technical Conference on the Enhanced Safety of Vehicles (ESV), Washington, DC, USA, 13–16 June 2011; pp. 11–0230. [Google Scholar]
- Weng, X.H.; Luan, X.Y.; Kong, C.; Chang, Z.Y.; Li, Y.W.; Zhang, S.J.; Al-Majeed, S.; Xiao, Y.K. A Comprehensive Method for Assessing Meat Freshness Using Fusing Electronic Nose, Computer Vision, and Artificial Tactile Technologies. J. Sens. 2020, 2020, 1–14. [Google Scholar] [CrossRef]
- Weng, X.; Sun, Y.; Xie, J.; Deng, S.; Chang, Z. Bionic Layout Optimization of Sensor Array in Electronic Nose for Oil Shale Pyrolysis Process Detection. J. Bionic Eng. 2021, 18, 441–452. [Google Scholar] [CrossRef]
- Yan, J.; Guo, X.; Duan, S.; Jia, P.; Wang, L.; Peng, C.; Zhang, S. Electronic Nose Feature Extraction Methods: A Review. Sensors 2015, 15, 27804–27831. [Google Scholar] [CrossRef] [PubMed]
- Zhao, X.; Li, P.; Xiao, K.; Meng, X.; Han, L.; Yu, C. Sensor Drift Compensation Based on the Improved LSTM and SVM Multi-Class Ensemble Learning Models. Sensors 2019, 19, 3844. [Google Scholar] [CrossRef] [PubMed]
- Tian, F.; Zhang, J.; Yang, S.; Zhao, Z.; Liang, Z.; Liu, Y.; Wang, D. Suppression of Strong Background Interference on E-Nose Sensors in an Open Country Environment. Sensors 2016, 16, 233. [Google Scholar] [CrossRef] [PubMed]
- Kalman, E.L.; LöFvendahl, A.; Winquist, F.; LundströM, I. Classification of complex gas mixtures from automotive leather using an electronic nose. Anal. Chim. Acta 2009, 403, 31–38. [Google Scholar] [CrossRef]


| Behavior Category | Blood Alcohol Content (BAC) mg/100 mL | Breath Alcohol Content (BrAC) mg/L |
|---|---|---|
| Driving after drinking | >20 and <80 | >0.09 and <0.36 |
| Drunk driving | >80 | >0.36 |
| Sensor | Target Gases | Maker |
|---|---|---|
| TGS2612 | methane, propane, butane | Figaro |
| TGS2611 | methane | Figaro |
| TGS2620 | alcohol | Figaro |
| TGS2603 | VOC | Figaro |
| TGS2602 | VOC | Figaro |
| TGS2610 | propane, butane | Figaro |
| TGS2600 | cigarette smoke | Figaro |
| GSBT11 | VOC | Ogam |
| MS1100 | formaldehyde, VOC | Ogam |
| MP135 | hydrogen, alcohol, carbon monoxide | Winson |
| MP901 | alcohol, smoke, formaldehyde, toluene, benzene, acetone | Winson |
| MP-9 | carbon monoxide, methane | Winson |
| MP-3B | alcohol | Winson |
| MP-4 | methane, natural gas, biogas | Winson |
| MP-5 | propane | Winson |
| MP-2 | propane, smoke | Winson |
| MP503 | alcohol, smoke, isobutane, formaldehyde | Winson |
| MP801 | benzene, toluene, formaldehyde, alcohol, smoke | Winson |
| MP905 | benzene, toluene, formaldehyde, alcohol, smoke | Winson |
| MP402 | methane, propane | Winson |
| WSP1110 | nitrogen dioxide | Winson |
| WSP2110 | toluene, formaldehyde, benzene, alcohol, acetone | Winson |
| WSP7110 | hydrogen sulfide | Winson |
| MP-7 | carbon monoxide | Winson |
| TGS2612 | methane, propane, butane | Figaro |
| TGS2611 | methane | Figaro |
| TGS2620 | alcohol | Figaro |
| MP-3B | alcohol | Winson |
| MP702 | ammonia | Winson |
| TGS2610 | propane, butane | Figaro |
| TGS2600 | cigarette smoke | Figaro |
| TGS2618-COO | butane, liquified petroleum (gas) | Figaro |
| Model | Type | Accuracy | Precision | Recall | Specificity |
|---|---|---|---|---|---|
| Single temperature model | training set | 1 | 1 | 1 | 1 |
| test set | 0.8438 | 0.7619 | 1 | 0.6875 | |
| Mixed temperature correction model ((−20 ± 2) °C and (20 ± 2) °C) | training set | 0.9911 | 0.9818 | 1 | 0.9828 |
| test set | 0.9375 | 0.8919 | 1 | 0.8710 | |
| Mixed temperature correction model ((−20 ± 2) °C, (−10 ± 2) °C, and (20 ± 2) °C) | training set | 0.9821 | 0.9651 | 1 | 0.9647 |
| test set | 0.9861 | 0.9737 | 1 | 0.9714 | |
| ICA correction model | training set | 1 | 1 | 1 | 1 |
| test set | 1 | 1 | 1 | 1 |
Publisher’s Note: MDPI stays neutral with regard to jurisdictional claims in published maps and institutional affiliations. |
© 2022 by the authors. Licensee MDPI, Basel, Switzerland. This article is an open access article distributed under the terms and conditions of the Creative Commons Attribution (CC BY) license (https://creativecommons.org/licenses/by/4.0/).
Share and Cite
Tan, L.; Wang, J.; Liang, G.; Yao, Z.; Weng, X.; Wang, F.; Chang, Z. Model Development for Alcohol Concentration in Exhaled Air at Low Temperature Using Electronic Nose. Chemosensors 2022, 10, 375. https://doi.org/10.3390/chemosensors10090375
Tan L, Wang J, Liang G, Yao Z, Weng X, Wang F, Chang Z. Model Development for Alcohol Concentration in Exhaled Air at Low Temperature Using Electronic Nose. Chemosensors. 2022; 10(9):375. https://doi.org/10.3390/chemosensors10090375
Chicago/Turabian StyleTan, Lidong, Jiexi Wang, Guiyou Liang, Zongwei Yao, Xiaohui Weng, Fangrong Wang, and Zhiyong Chang. 2022. "Model Development for Alcohol Concentration in Exhaled Air at Low Temperature Using Electronic Nose" Chemosensors 10, no. 9: 375. https://doi.org/10.3390/chemosensors10090375
APA StyleTan, L., Wang, J., Liang, G., Yao, Z., Weng, X., Wang, F., & Chang, Z. (2022). Model Development for Alcohol Concentration in Exhaled Air at Low Temperature Using Electronic Nose. Chemosensors, 10(9), 375. https://doi.org/10.3390/chemosensors10090375