Article

Design of Christmas-Tree-like Microfluidic Gradient Generators for Cell-Based Studies

Department of Physics, Fu-Jen Catholic University, New Taipei City 24205, Taiwan
*
Author to whom correspondence should be addressed.
Chemosensors 2023, 11(1), 2; https://doi.org/10.3390/chemosensors11010002
Submission received: 25 November 2022 / Revised: 16 December 2022 / Accepted: 18 December 2022 / Published: 20 December 2022
(This article belongs to the Special Issue Microfluidic Devices for Biological Quantitative Analysis)

Abstract

:
Microfluidic gradient generators (MGGs) provide a platform for investigating how cells respond to a concentration gradient or different concentrations of a specific chemical. Among these MGGs, those based on Christmas-tree-like structures possess advantages of precise control over the concentration gradient profile. However, in designing these devices, the lengths of channels are often not well considered so that flow rates across downstream outlets may not be uniform. If these outlets are used to culture cells, such non-uniformity will lead to different fluidic shear stresses in these culture chambers. As a result, cells subject to various fluidic stresses may respond differently in aspects of morphology, attachment, alignment and so on. This study reports the rationale for designing Christmas-tree-like MGGs to attain uniform flow rates across all outlets. The simulation results suggest that, to achieve uniform flow rates, the lengths of vertical channels should be as long as possible compared to those of horizontal channels, and modifying the partition of horizontal channels is more effective than elongating the lengths of vertical channels. In addition, PMMA-based microfluidic chips are fabricated to experimentally verify these results. In terms of chemical concentrations, perfect linear gradients are observed in devices with modified horizontal channels. This design rationale will definitely help in constructing optimal MGGs for cell-based applications including chemotherapy, drug resistance and drug screening.

1. Introduction

Human body cells grow in a complex micro-environment with the presence of extracellular matrix (ECM), carbohydrates, lipids and other cells. They function properly via in vivo interacting with their neighbors and responding to a variety of environmental stimuli. These extracellular clues can be either physical, such as light, electric field (EF) and shear stress, or chemical, such as chemical gradients of biomolecules. For example, chemotaxis and electrotaxis refer to directional cell migration in response to certain chemicals and EF, respectively [1,2]. Traditionally, petri dishes and microplates are commonly used for in vitro cell-based studies due to their easy operation in cell culture/observation and high-throughput. A 96- or 384-well microplate can perform multiple experiments in parallel. However, these macro-scaled devices possess drawbacks such as evaporation of culture medium, large consumption of reagents and cells and static (non-circulating) environment. To overcome these shortcomings, micro-fabricated devices integrated with fluidic components such as pumps and valves have recently been developed as an alternative platform for cell studies [3]. In the 1980s and early 1990s, microfluidic chips were mainly prepared on silicon and glass substrates, where a high-class clean room with expansive equipment was required. In the late 1990s, polydimethylsiloxane (PDMS)-based devices, fabricated by using the standard soft lithography technique, have become popular because of their biocompatibility, transparency, elasticity and gas permeability. Such devices have been used in a variety of cell-based studies including chemotaxis [4], electrotaxis [5], cell sorting/separation [6], single-cell analysis [7] and even on-chip polymerase chain reaction (PCR) [8]. More recently, laser ablation and writing on compact materials such as polymethylmethacrylate (PMMA) and polyethyleneterephthalate (PET) have made constructing microfluidic chips even cheaper and more feasible. Applications of these devices include, but are not limited to, electrotaxis [9], phototaxis [10], electrophoretic separation [11], wound-healing assay [10] and analysis of biomolecules [12,13].
For targeted therapies, various gradient generators have been proposed for investigating how tumor cells react to concentration gradients of anti-cancer drugs [14]. These studies provide useful insight into cancerous processes such as metastasis, differentiation and apoptosis [15]. For example, Dai et al. reported a prototypic microfluidic platform capable of generating stepwise concentration gradients for real-time study of cell apoptosis [16]. The PDMS-based chip integrated with a sensitive apoptotic analysis method was used for monitoring the apoptosis of HeLa cells in response to the anti-cancer drug etoposide, of various concentrations [16]. Another microfluidic device for generating both an oxygen gradient in a chamber and a chemical concentration gradient between adjacent chambers was fabricated to investigate tumor cell-drug interactions with two tumor cell lines (human lung adenocarcinoma A549 cells and human cervical carcinoma HeLa cells) and two anti-tumor drugs (tirapazamine and bleomycin) [17]. A concentration gradient generator can be either diffusion-based or flow-based. The former relies on the passive diffusion across a large area from the source to the sink flows. By leveraging the inherent pressure balance at the cross section of a microchannel, a diffusion-based gradient generator simply made of plastic films and double-sided tapes was developed for monitoring cellular response to an intermittent chemical gradient of cycloheximide (CHX), an inhibitor of protein synthesis [18]. Another PDMS diffusion-based gradient generator was reported to maintain concentration gradients of soluble molecules for up to 96 h with 24 h replenishment of the source and sink reservoirs [19]. Although these diffusion-based systems can be easily constructed, it is usually difficult to precisely control the distribution of concentrations within such devices.
As a result, a variety of flow-based, microfluidic gradient generators (MGGs) have been developed due to their effective controllability over generated concentrations. These MGGs can have different designs such as straight, Y-shaped, T-shaped and Christmas-tree-like channels. A microfluidic device, combining a chamber for cell culturing, an oxygen gradient generator and an integrated optical sensor, was reported for studying bacterial growth under different oxygen concentrations [20]. This device consisted of PMMA-made straight channels, an oxygen-permeable PDMS layer and a glass slide-sealed culture chamber made of ethylene tetrafluoroethylene (ETFE) foil [20]. To quantify bacterial chemotaxis, a Y-shaped MGG was proposed to generate a linear concentration gradient of chemoattractant simply, by convective and molecular diffusion, and the hydrodynamic focusing technique was used to introduce bacteria into the main channel of the chip [21]. Mao et al. presented a T-shaped MGG for bacterial chemotaxis, in which a gradient of chemoeffectors was established via diffusion between parallel streams of liquids in laminar flow [22]. There were a total of 22 outlet ports, with each having its own distinct chemical concentration [22].
Although Christmas-tree-like MGGs are more complicated than others, they possess advantages of precise control over the concentration gradient profile. In addition, with separate culture chambers, these devices enable high-throughput cell-based screening [23,24]. The first such device was reported in 2000 by Jeon et al. [25] This system was based on controlled diffusive mixing of species in solutions flowing laminarly at low Reynolds numbers [25]. It could generate gradients of different size and resolution and, by varying the relative flow velocities of the input fluids, the shape of the gradients could be continuously changed [25]. A Christmas-tree-like MGG consisting of eight separate chambers served as a platform for analyzing chemotherapy resistance of lung cancer [26]. Human squamous carcinoma cells were incubated inside these chambers, containing anti-cancer drug VP-16 of different concentrations, for studying the correlation between the expression of glucose regulated protein-78 (GRP78) and drug resistance [26]. Ye et al. described a microfluidic device containing eight identical Christmas-tree-like structures for multi-parametric measurements of cellular responses in human liver carcinoma (HepG2) cells [27]. A total of 64 culture chambers enabled parallel analysis of how tumor cells responded to several drugs of various concentrations [27]. In these Christmas-tree-like MGGs, mixing areas with turning channels, either rectangular or rounded, are required to ensure linear concentration gradients [24,25]. However, in designing such chips, the lengths of these turning channels are often not well considered. Since the flow rate is affected by the resistance of the channel, and this resistance is directly proportional to the channel length, inappropriate designs will result in non-uniform flow rates across downstream culture chambers. Given that the fluidic shear stress is directly proportional to the flow rate, cells in various chambers will be subject to different shear stresses. Fluidic shear stresses were shown to affect cells in various respects including morphology, attachment, alignment, living cycle and damage [28,29,30,31]. Additionally, in the molecular level, these external stimuli might change gene expression and signaling cascades [32,33]. For example, Lo et al. found that more reactive oxygen species (ROS) were generated in lung cancer cells under larger shear stress [24]. It was reported that shear stress accelerated the wound-healing process in human umbilical vein endothelial cells (HUVECs), human coronary artery endothelial cells (HCAECs) and mouse embryonic fibroblast NIH/3T3 cells [10,34]. Therefore, to attain uniform flow rates (shear stresses) in all culture chambers of a Christmas-tree-like MGG, it is important to properly design the device.
This study presents the rationale for designing a Christmas-tree-like MGG to achieve uniform flow rates in all downstream outlets. In this way, cells are not affected by the variation in shear stresses and respond only to applied chemical gradients. By using the commercial COMSOL Multiphysics software, the distributions of fluid velocities (which are linearly proportional to flow rates) and chemical concentrations inside microfluidic devices of various designs were simulated. The lengths of both horizontal channels (the splitting channels) and vertical channels (the mixing channels) were adjusted to attain the optimal distribution, i.e., uniform fluid velocities and a linear concentration gradient. This was achieved by changing the ratio of the vertical length to the horizontal length as well as the partition of the horizontal channels. Moreover, corresponding PMMA-based Christmas-tree-like microfluidic chips were fabricated to verify simulation results. We believe that this rationale will serve as a useful template in designing MGGs for applications in cell-based studies, especially in chemotherapy, drug resistance and drug screening.

2. Materials and Methods

2.1. Design Rationale

Figure 1a shows a five-layered, Christmas-tree-like MGG having two inlets and five outlets. When two chemical solutions with different concentrations are injected from inlet 1 and inlet 2, respectively, they will be repeatedly split (for example, see Point 1 (P1) in the figure), combined (for example, see P2 in the figure) and mixed (for example, see P3 in the figure). After three repeats, a linear chemical gradient is supposed to be established across five outlets. For convenience, the layer with n vertical (mixing) channels is labeled as Ln (which stands for Layer n). As indicated in the figure, this chip consists of L2~L5. From left to right, the vertical channels are labeled as V1~Vn. For example, L4 contains V1~V4. The Hagen–Poiseuille equation is used to describe the pressure drop of an incompressible and Newtonian fluid in laminar flow as it flows through a long cylindrical pipe of constant cross section. This equation is in the form Δ P = 8 μ L Q π R 4 , where ΔP, μ, L, Q and R are the pressure difference between two ends, the dynamic viscosity of the fluid, the length of the pipe, the volumetric flow rate of the fluid and the radius of the pipe, respectively. This relationship among pressure, fluidic resistance and flow rate is analogous to Ohm’s law, V = IR, concerning voltage (V), resistance (R) and current (I). Both the fluidic and electrical resistances are proportional to the length of the device, but in the Hagen–Poiseuille equation, the resistance is inversely proportional to πR4 instead of the cross-sectional area πR2 in Ohm’s law. Therefore, to analyze the splitting and combining of fluidic flows, the structure of the MGG can be analogized to an equivalent electric circuit. As mentioned previously, the goal of the design is to attain uniform flow rates in all downstream outlets. Theoretically, this can be fulfilled by simply assuming that, in the circuit, the resistance of the horizontal (splitting) channels (RH) is negligible compared to that of the vertical channels (RV), i.e., RH << RV. With this assumption held in all branches, the normalized splitting ratios in each branching point (for example, see Branching Point 1 (BP1)~BP4 in the figure) can be derived as (L + 1 − V)/(L + 1) to the left and V/(L + 1) to the right, where L and V are the numbers of the layer and vertical channel at that point, respectively [25]. For example, in BP1, L = 4 and V = 1 lead to 4/5 to the left and 1/5 to the right. In BP2, L = 4 and V = 2 give 3/5 to the left and 2/5 to the right. With the left–right symmetry of the device, 2/5 to the left and 3/5 to the right is achieved in BP3, and 1/5 to the left and 4/5 to the right is obtained in BP4. As shown in the figure, a uniform relative volumetric flow rate of 4/5 is attained in outlet 1 (4/5), outlet 2 (1/5 + 3/5), outlet 3 (2/5 + 2/5), outlet 4 (3/5 + 1/5), and outlet 5 (4/5). To test this assumption, four different ratios of RV/RH, RV = RH, RV = 5RH, RV = 10RH and RV = 20RH, will be used to simulate the flow rates in all outlets.
Next, the resistance in the horizontal channels should be further taken into account. Again, since the fluidic resistance is directly proportional to the channel length, the flow rate is inversely proportional to the length. By applying mass conservation in each branching point, the ratio of the partition in the horizontal channel should be modified from simple 1:1 to desired values as indicated in Figure 1b. In this three-outlet design, the unmodified ratio of 1:1:1:1 leads to flow rates of 1:2:1 in three outlets. With a modified ratio of 1:2:2:1, flow rates of 1:1:1 can be achieved in three outlets. This design can be further extended to, for example, a five-outlet device, as shown in Figure 1c. Therefore, this length ratio in the horizontal channels will also be modified to see how it affects the flow rates in all outlets. Since the fluidic resistance is directly proportional to the channel length, RV/RH is the total length of vertical channels to that of horizontal channels.

2.2. COMSOL Simulation

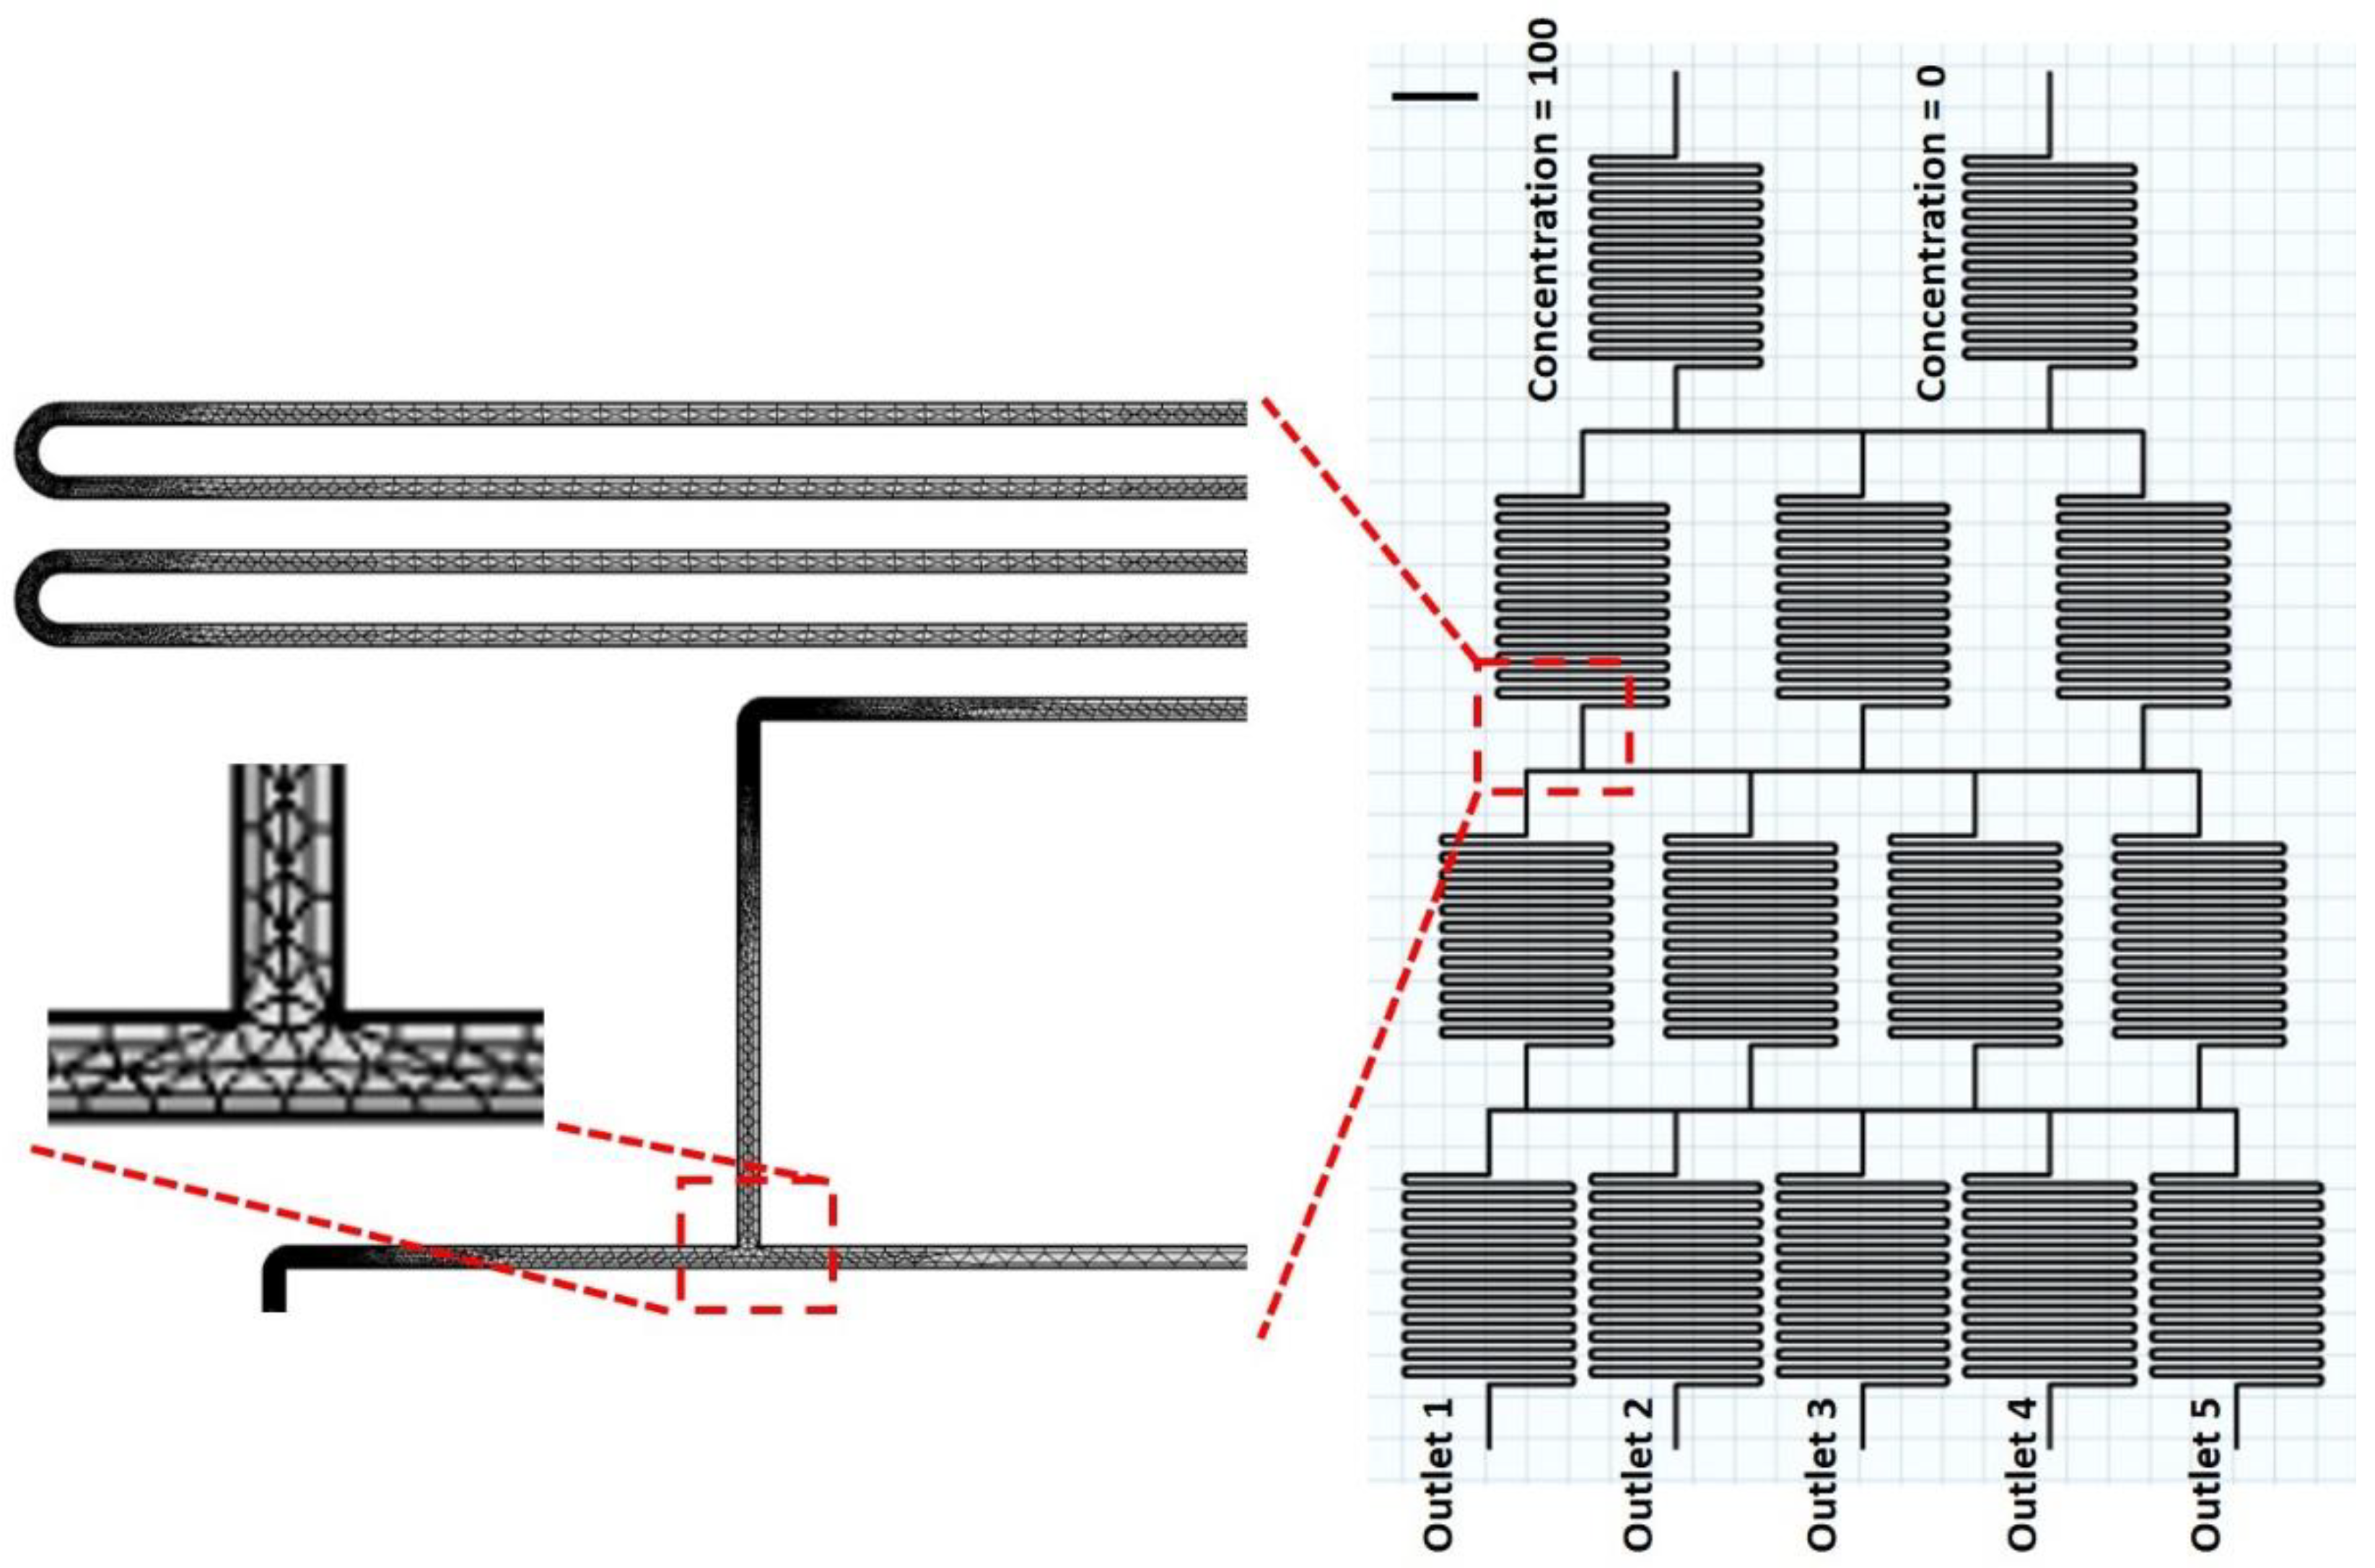
The commercial software COMSOL Multiphysics (ver. 5.2a, COMSOL, Burlington, MA, USA) was used to numerically simulate the distribution of fluid velocities and chemical concentrations inside the microfluidic chip. After designing the device in AutoCAD (Autodesk, San Rafael, CA, USA), the pattern was loaded into COMSOL. For simplicity, the two-dimensional (2D) geometry with extremely fine mesh was applied, and stationary (time-independent) studies were conducted. Figure 2 shows an example of the modified, five-outlet design with a part of the mesh. The width of the microfluidic channels is 60 μm. The “creeping flow” and “transport of dilute species” modules were selected to simulate the flow and concentration distributions, respectively, with the following parameters and settings: the boundary condition for inlets is “velocity”: normal inflow velocity; the boundary condition for outlets is “pressure”: 101,300 Pa with normal flow and suppress backflow; diffusion coefficient = 5 × 10⁻¹⁰ m2/s for fluorescein isothiocyanate (FITC) [25]; inlet fluid velocity = 0.001 m/s; concentration = 0 and 100 mole/m3 for FITC in two inlets (see Figure 2). Here, FITC, a derivative of fluorescein with a molecular weight of about 400 Da, is used for mimicking small molecules. Since water is an incompressible fluid, the following Navier–Stokes equations were applied: 0 = · [ ρ I + μ ( u + ( u ) T ) ] + F   and   ρ · u = 0 , where ρ is the fluidic density in kg/m3, u is the velocity vector in m/s, I is the unit matrix, μ is the fluidic viscosity in Cp and F is the force density vector in N/m3. This “creeping flow” interface is suitable for simulating systems with small geometrical length scales such as microfluidic devices and microelectromechanical systems (MEMS). In this study, distributions of fluid velocities and chemical concentrations inside five-outlet microfluidic chips with different RV/RH ratios, both unmodified and modified, were simulated and investigated.

2.3. Chip Fabrication and Experimental Procedure

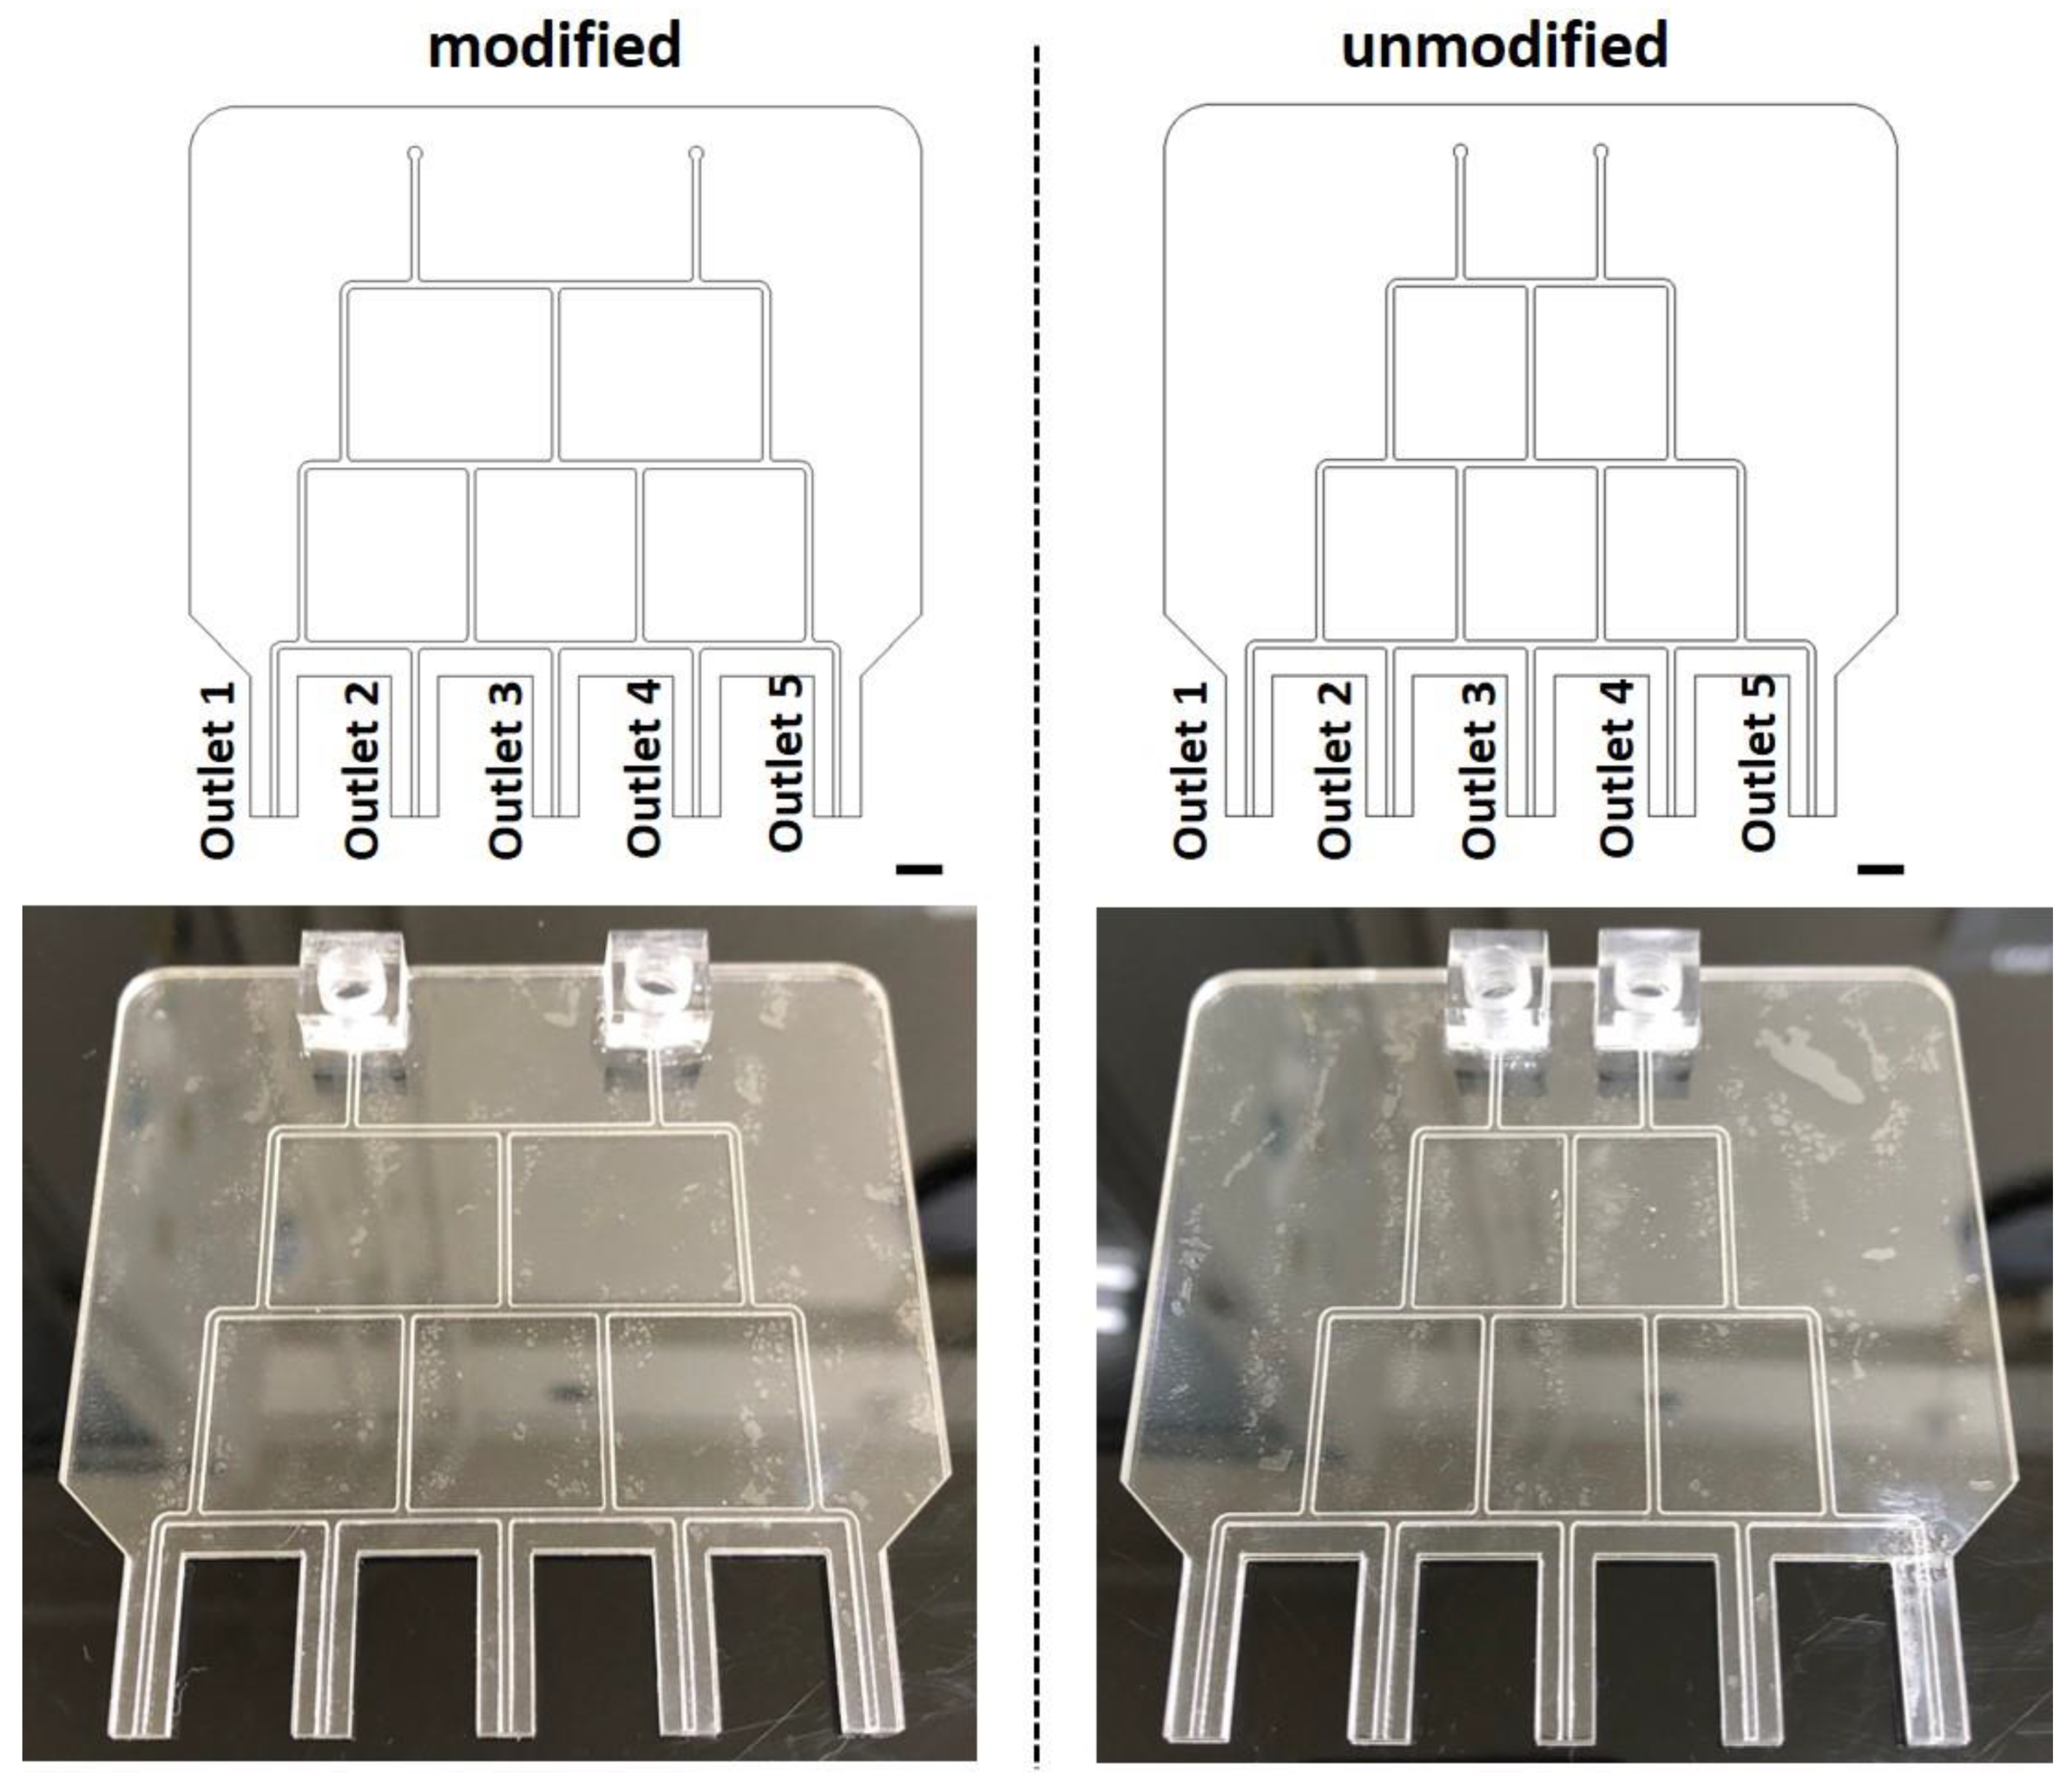
Microfluidic chips were designed in AutoCAD and the patterns were loaded into a CO2 laser scriber (MS640D, Ming-Cheng Technics Corp., Changhua County, Taiwan) to ablate desired patterns on PMMA substrates and double-sided tapes (8018, 3M). Figure 3 shows both unmodified (right) and modified (left) microfluidic chips with RV = RH. The microfluidic chip consisted of a 1-mm-thick PMMA substrate as the bottom, a 0.33-mm-thick double-sided tape with the pattern as fluidic channels, and another 1-mm-thick PMMA substrate as the top. The top layer had two holes serving as fluidic inlets. The height and width of the microfluidic channels were 0.33 and 0.8 mm, respectively. To perform experiments, FC-40 (3M, Maplewood, MN, USA), a fluorinated oil for minimize interfacial friction, is continuously flowed into the two inlets of the microfluidic chip. Driven by syringe pumps (NE-300, NewEra, Farmingdale, NY, USA), the flow rate of both inlets was set to be 30 mL/h. The gravimetry method was used to get the weights of outflow liquids. In brief, the outlets were connected to separate tubes for collecting outflow liquids. These tubes were weighted and calibrated to obtain the volumetric flow rates in all outlets. In addition, both unmodified and modified microfluidic chips with RV = 5RH were also fabricated and tested.

3. Results and Discussion

3.1. Simulation of Fluid Velocities

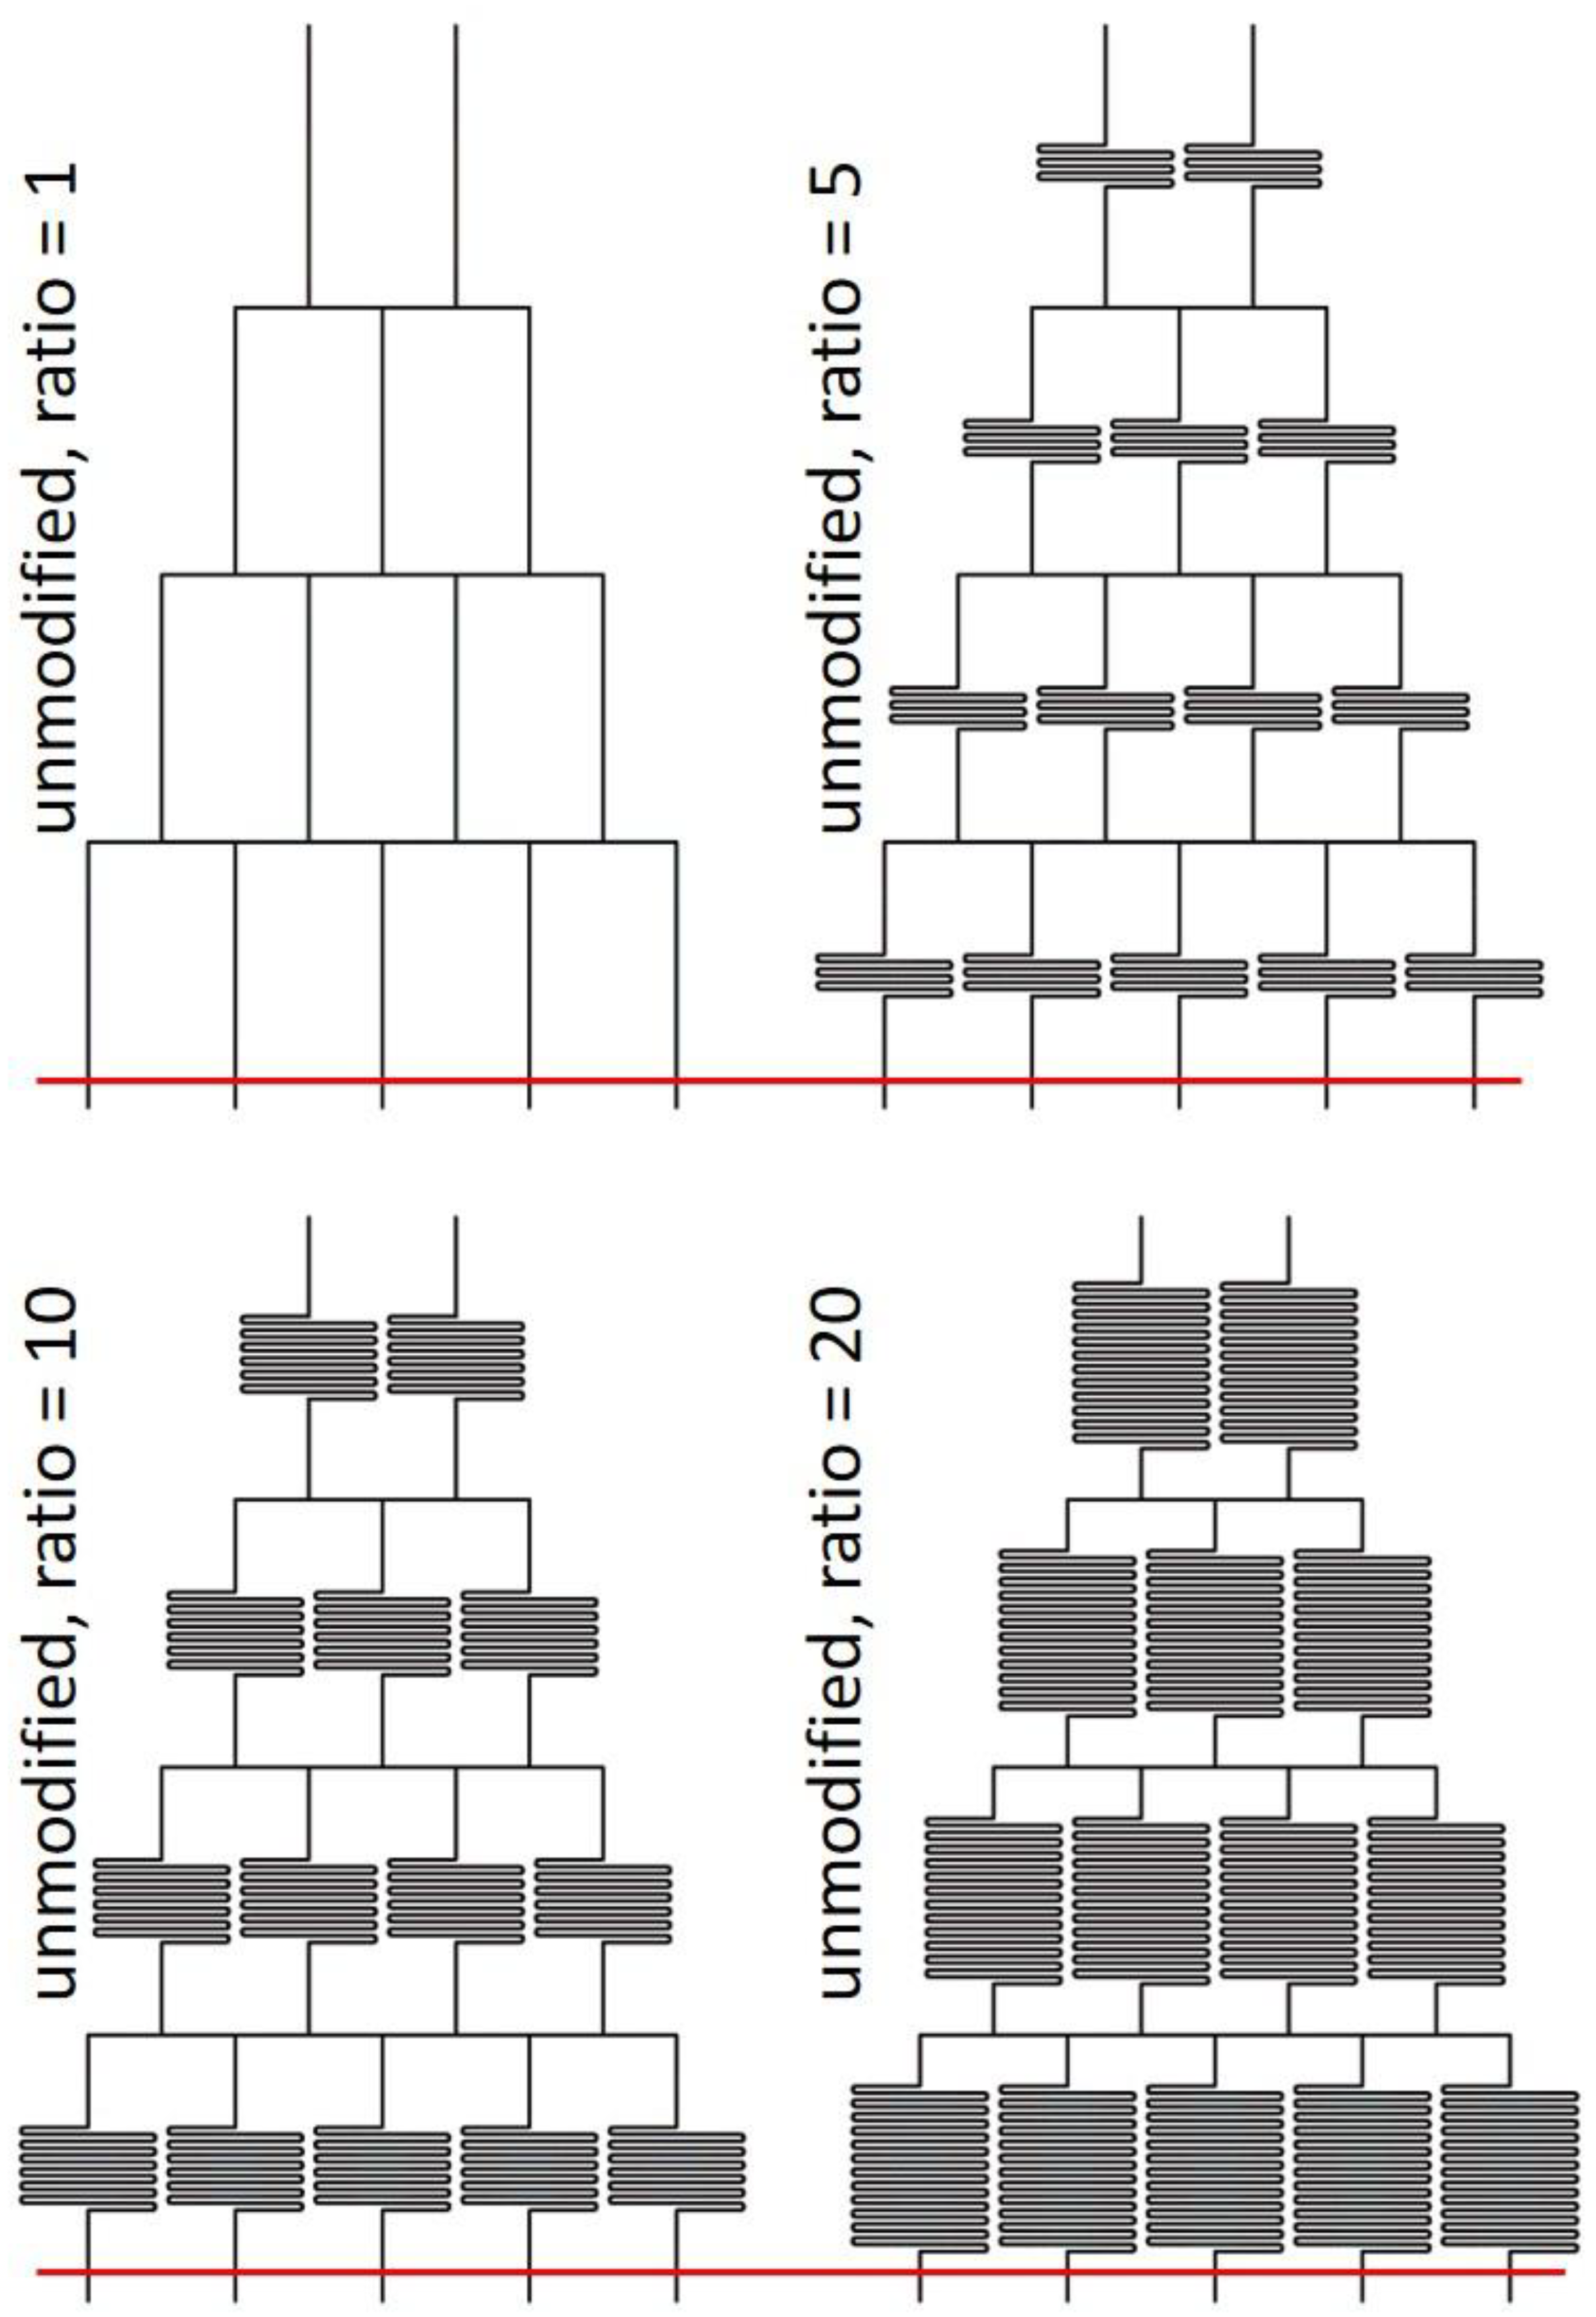
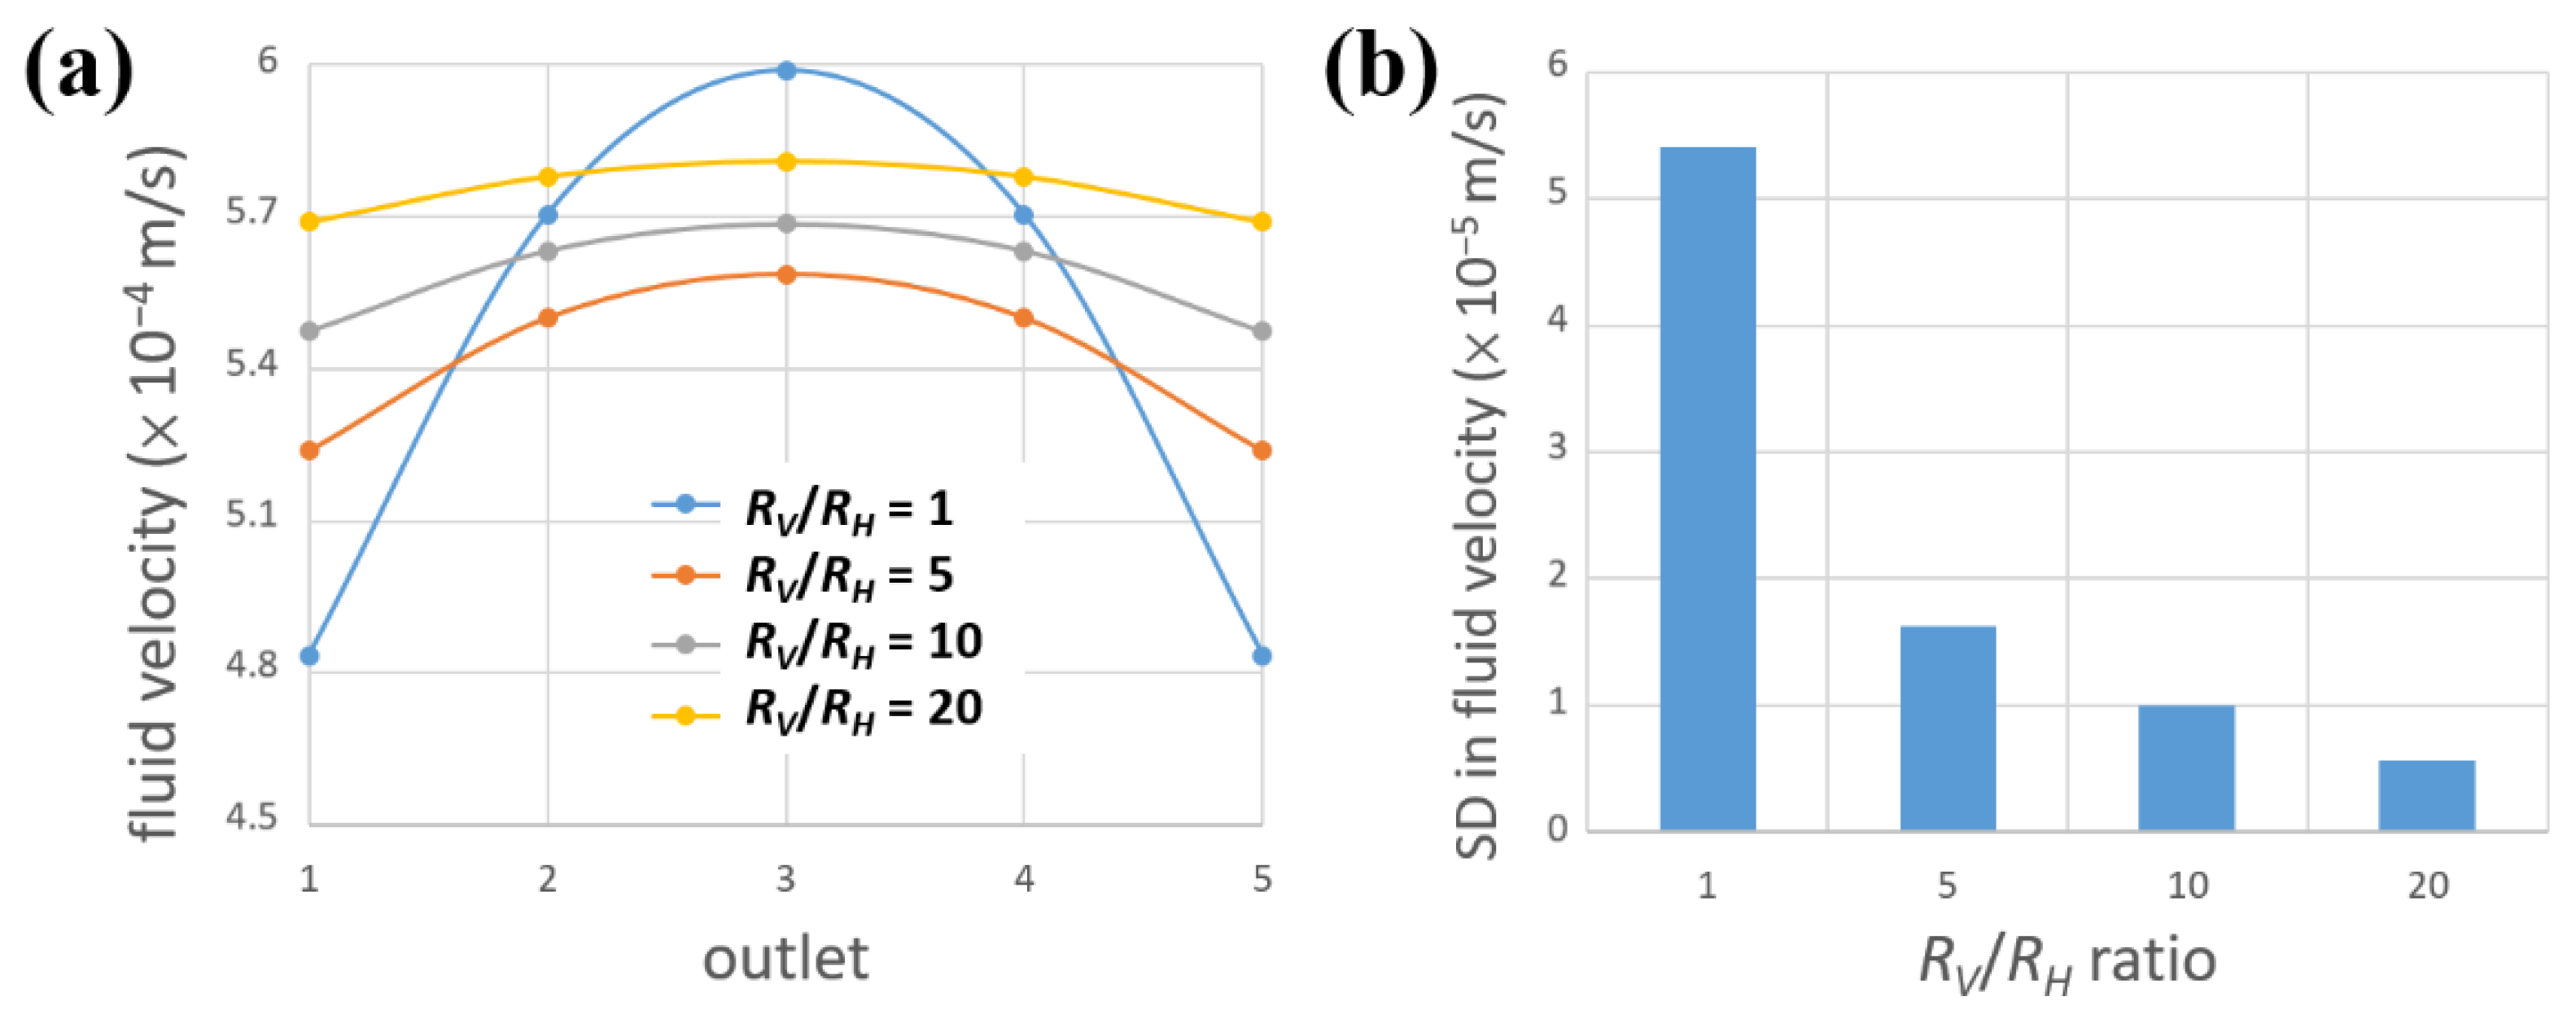
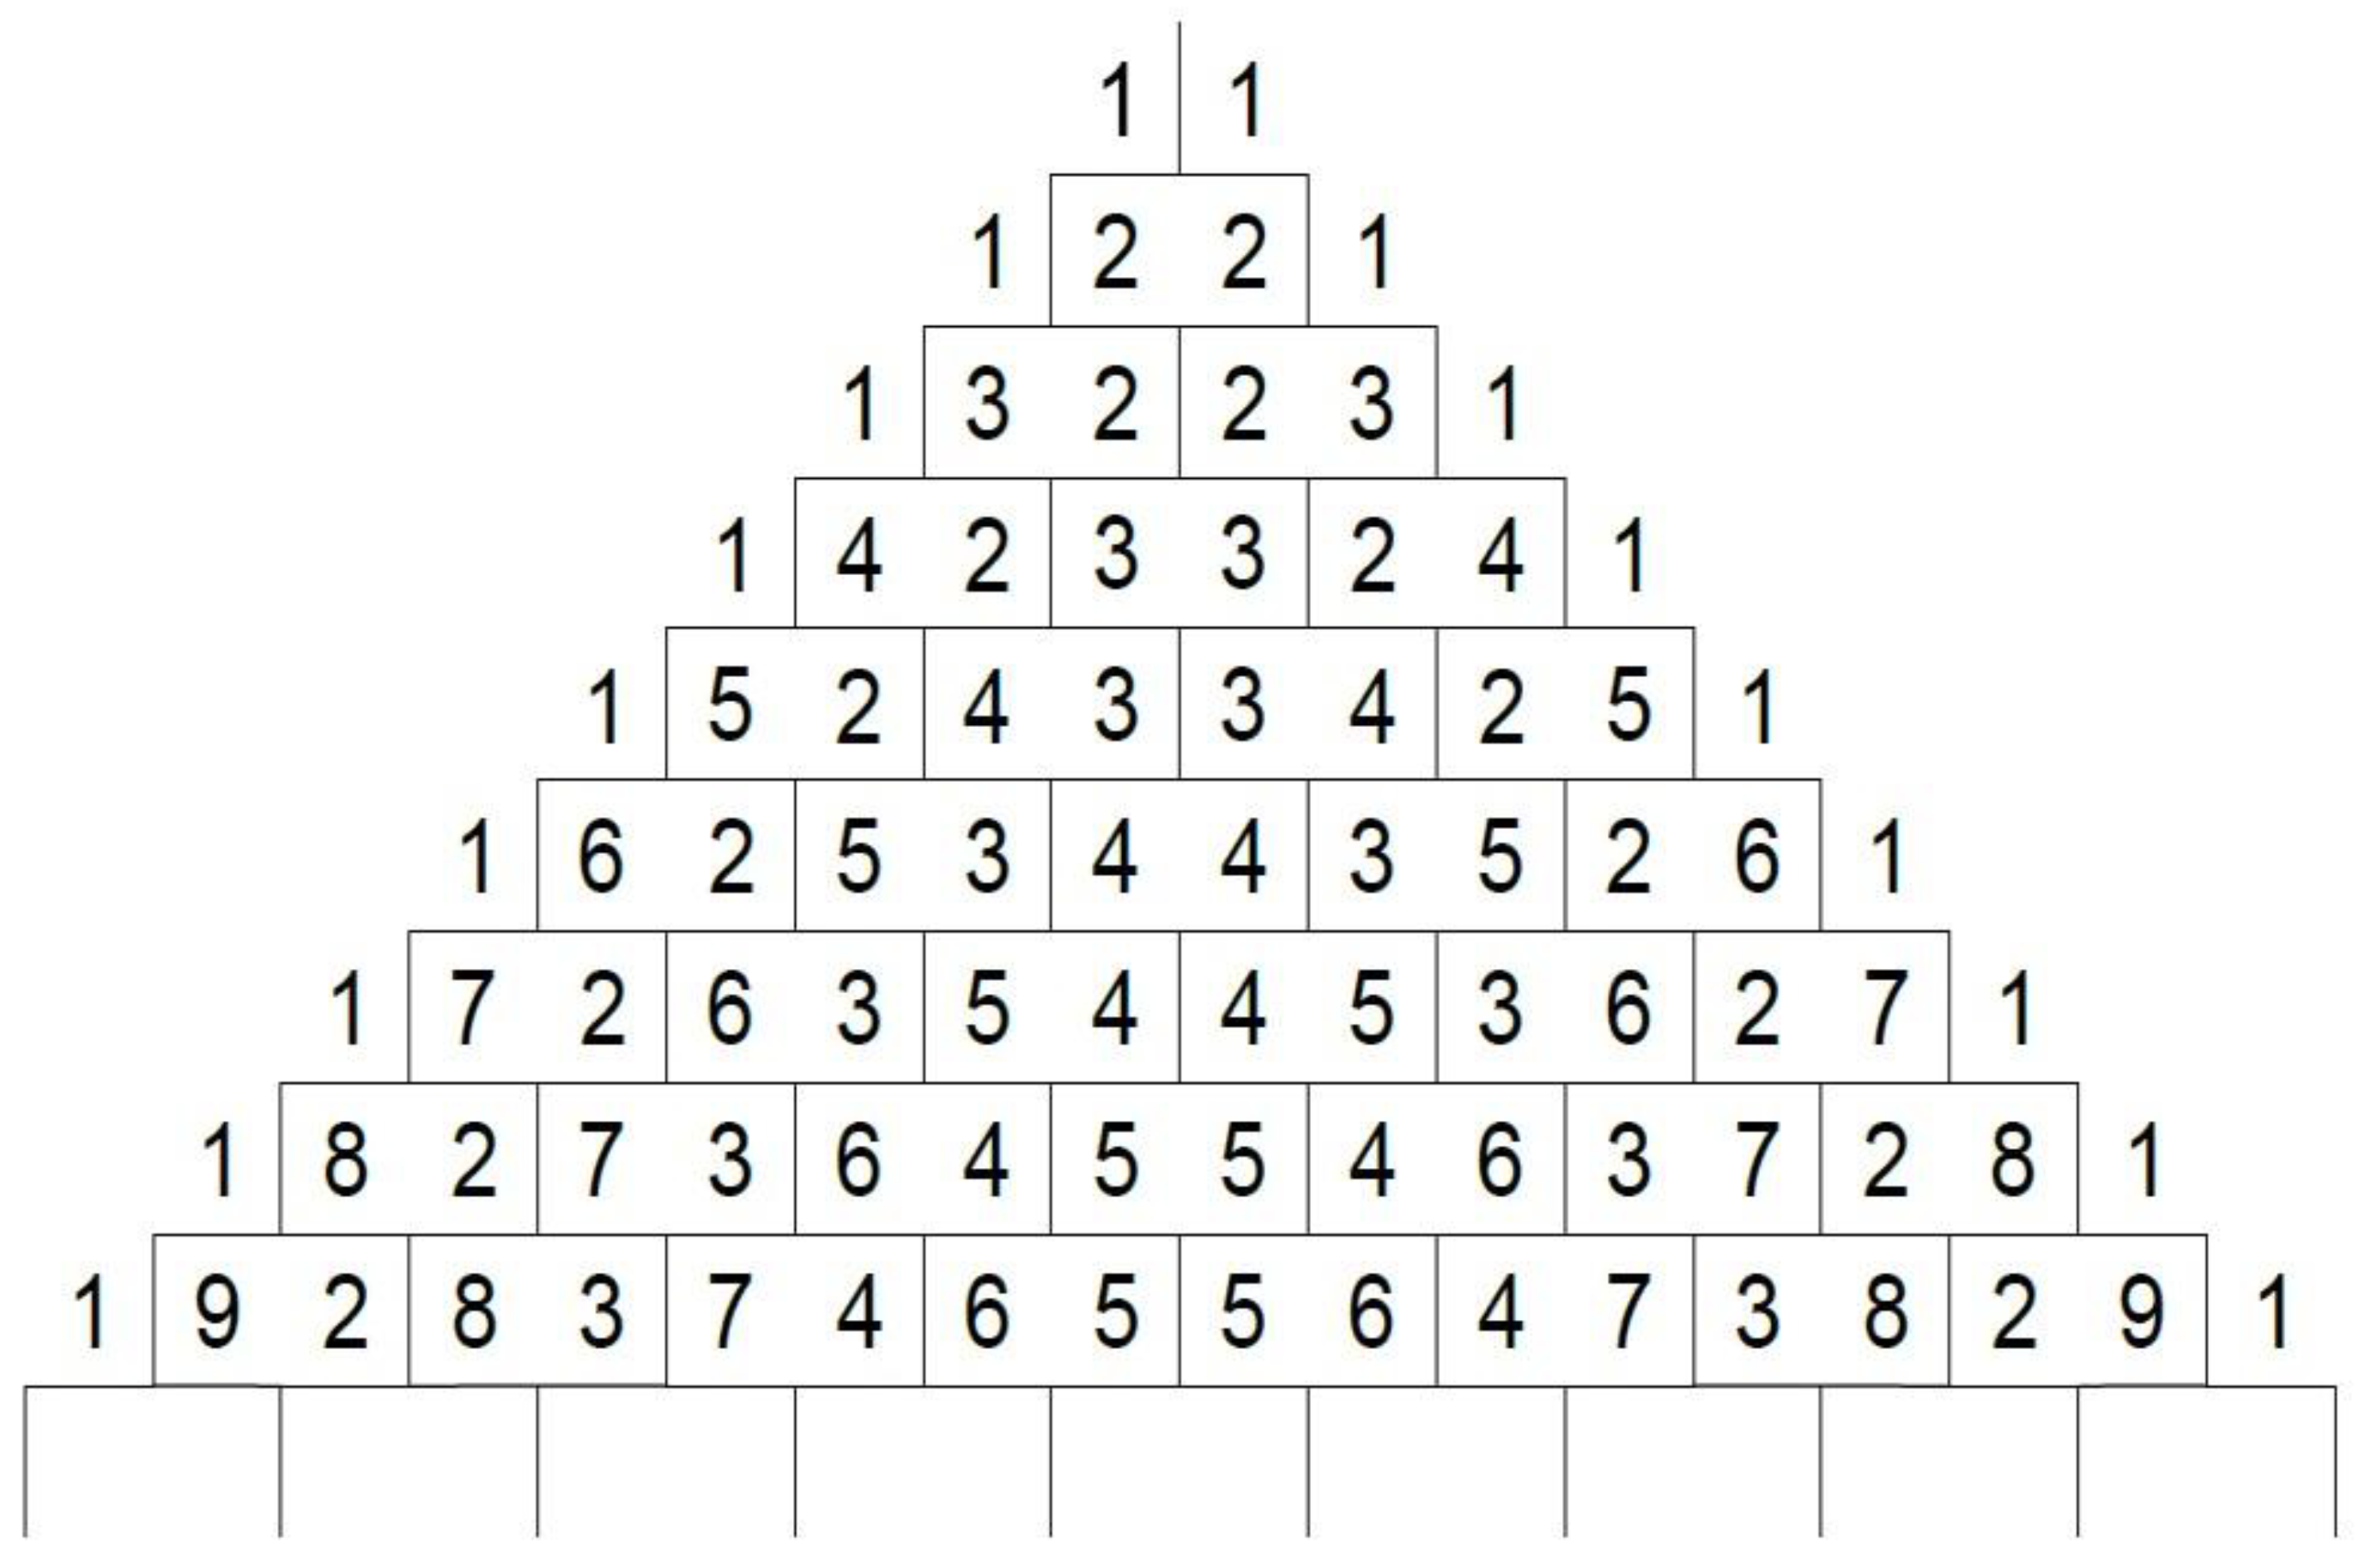
Figure 4 shows designs of unmodified microfluidic chips with four different ratios of RV/RH from 1 to 20. The simulated fluid velocities in all outlets along red lines in Figure 4 are recorded and plotted in Figure 5a. As explained in Section 2.3 (see Figure 1b), for an unmodified microfluidic chip, an equipartition in all horizontal channels leads to a binominal distribution in fluid velocities across all outlets. For example, in the unmodified five-outlet device, a fluid velocity ratio of 1:1 in layer 2 will give ratios of 1:2:1, 1:3:3:1 and 1:4:6:4:1 in layers 3, 4 and 5, respectively. For a device with even more outlets (e.g., n outlets), these ratios can be expressed as an array of Pascal’s triangle (e.g., C 0 n 1   :   C 1 n 1   :   :   C n 2 n 1   :   C n 1 n 1 ). This discrete binominal distribution can be approximated by the continuous normal distribution, as indicated in all curves of Figure 5a. To quantitatively analyze the uniformity in fluid velocities across all outlets, the standard deviations (SDs) for four different ratios of RV/RH were calculated and plotted in Figure 5b. A lower SD indicates better uniformity, and vice versa. For unmodified Christmas-tree-like MGGs with five outlets, the SD in outlet fluid velocities decreased from 5.4 × 10⁻⁵ m/s for RV = RH to 1.6 × 10⁻⁵, 9.9 × 10⁻⁶ and 5.6 × 10⁻⁶ m/s for RV = 5RH, RV = 10RH and RV = 20RH, respectively. The SD was reduced by an order of magnitude (about 90%) when the length of vertical channels was elongated to 20 times that of horizontal channels. Therefore, to attain uniform fluid velocities in all downstream outlets, the assumption that the resistance (and accordingly the length) of horizontal channels (RH) is negligible compared to that of vertical channels (RV), i.e., RH << RV, should be fulfilled.
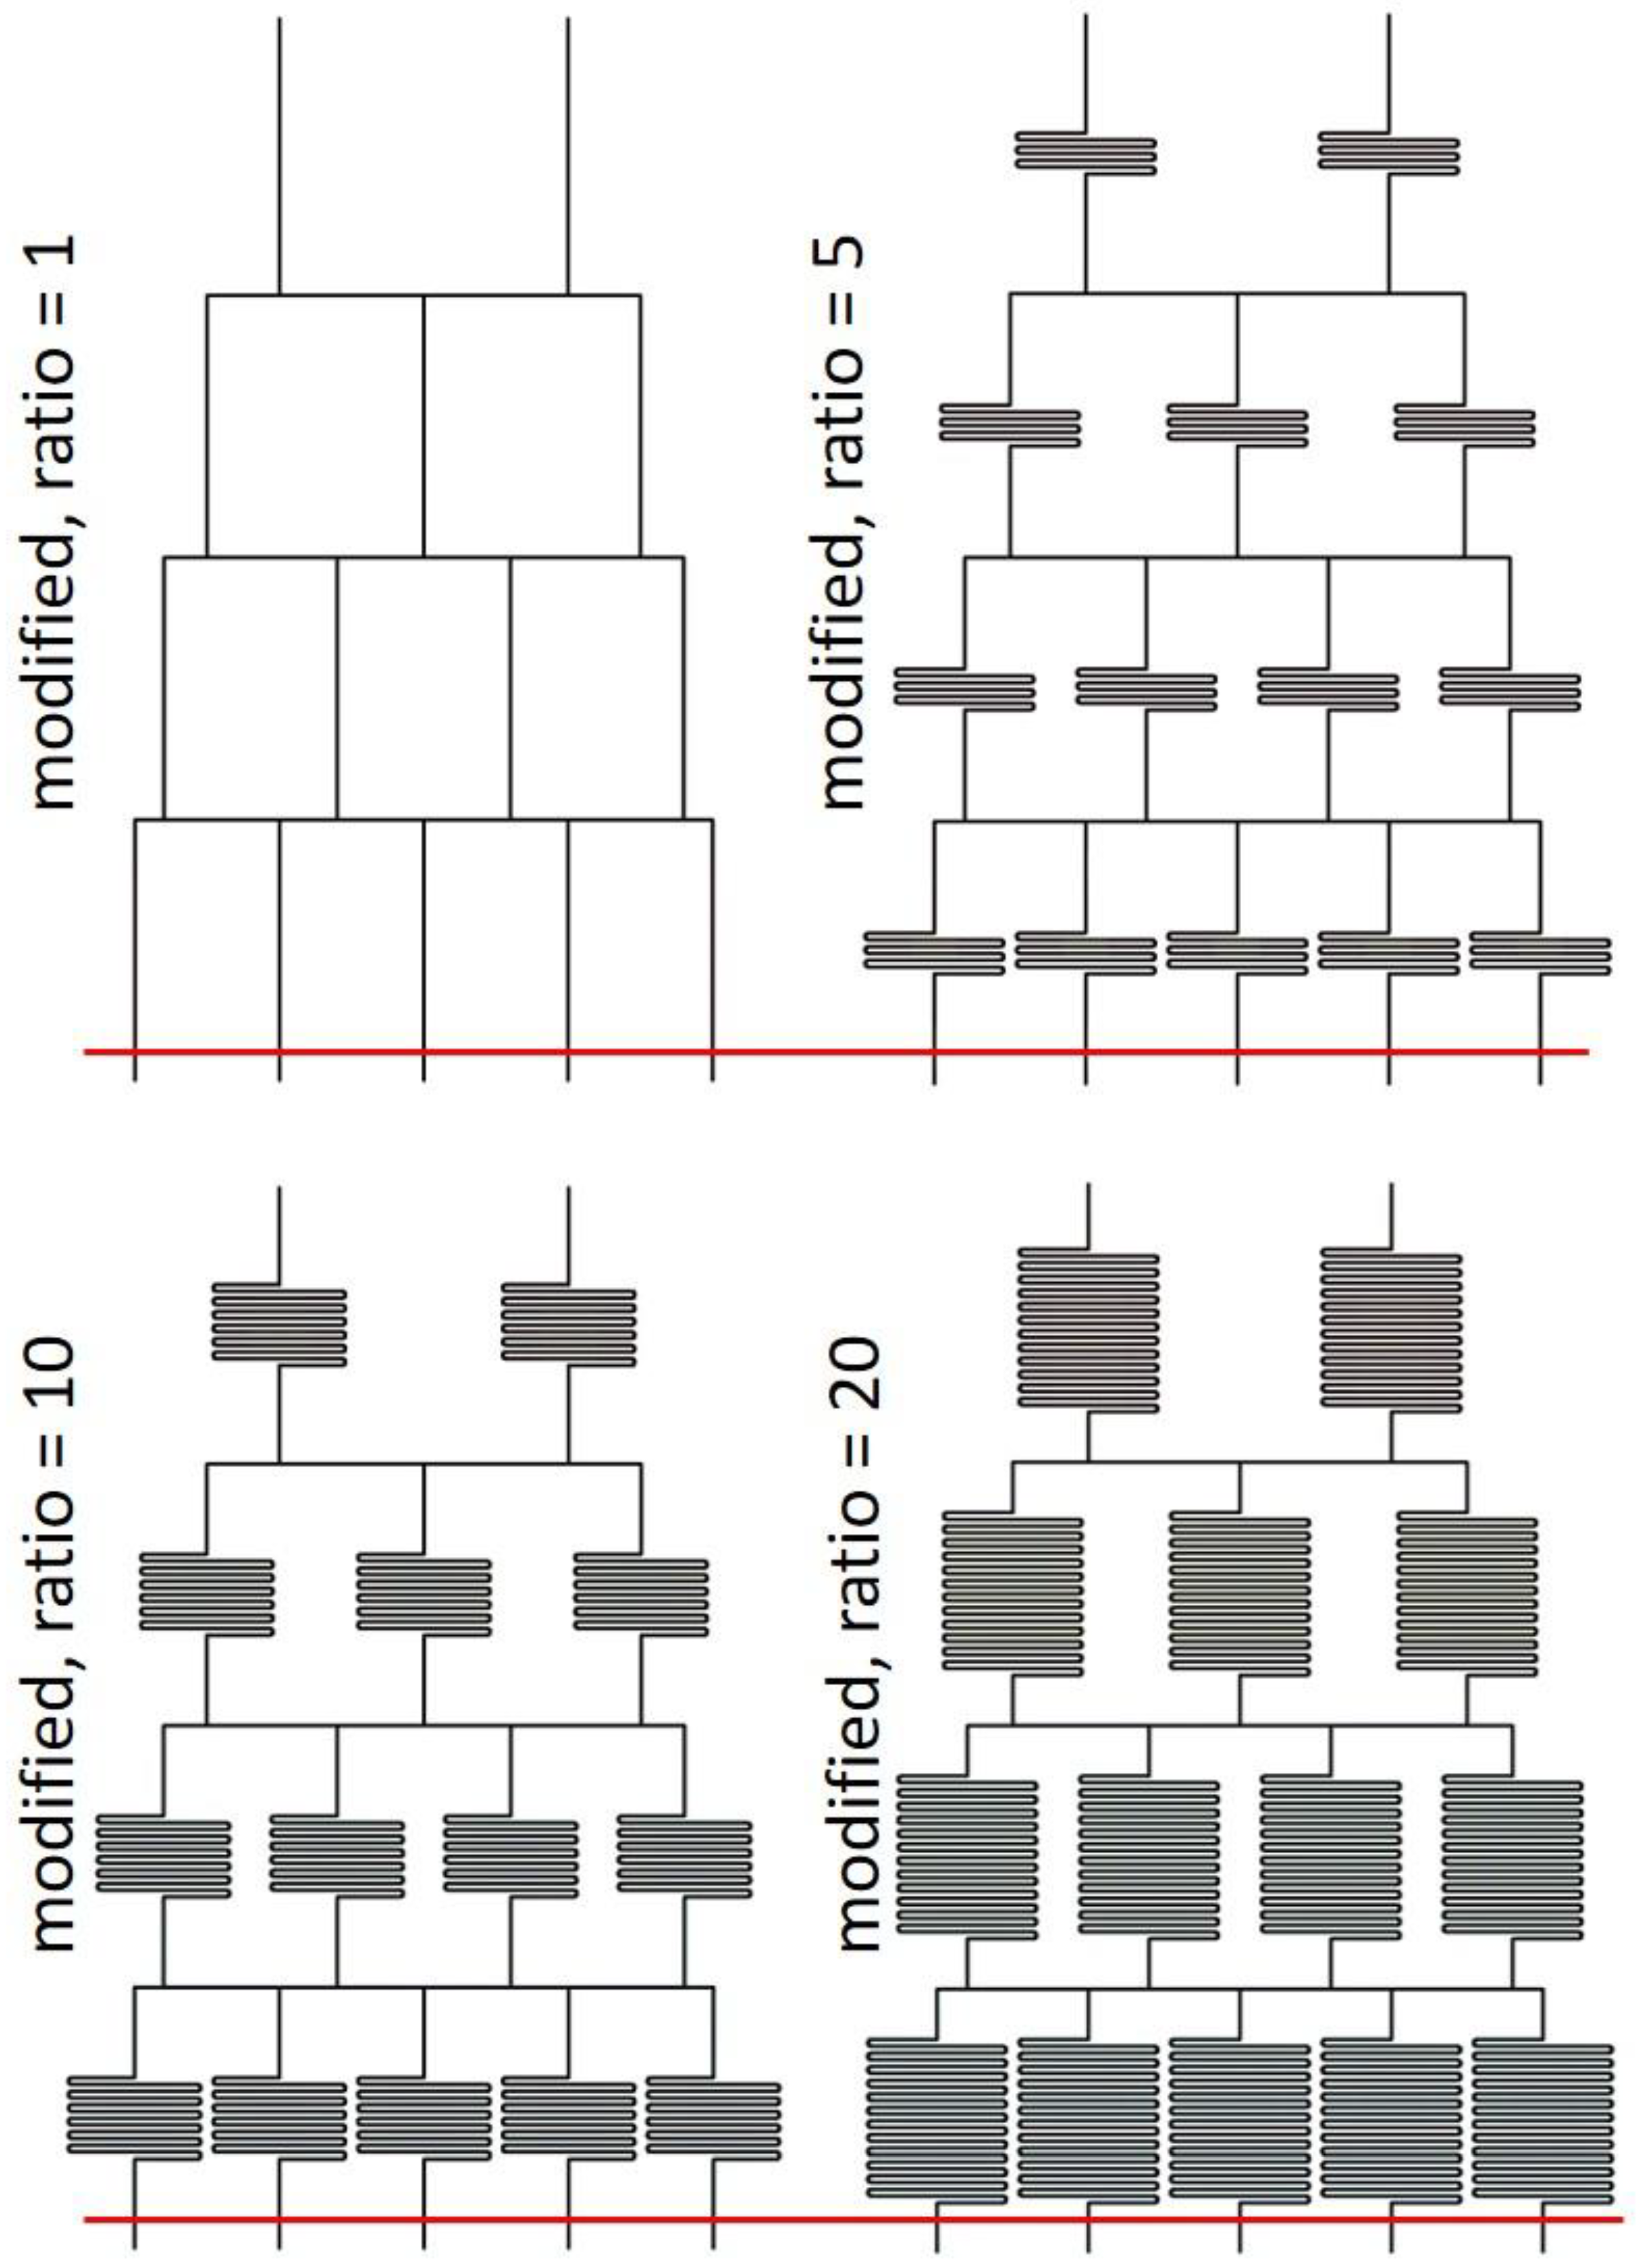
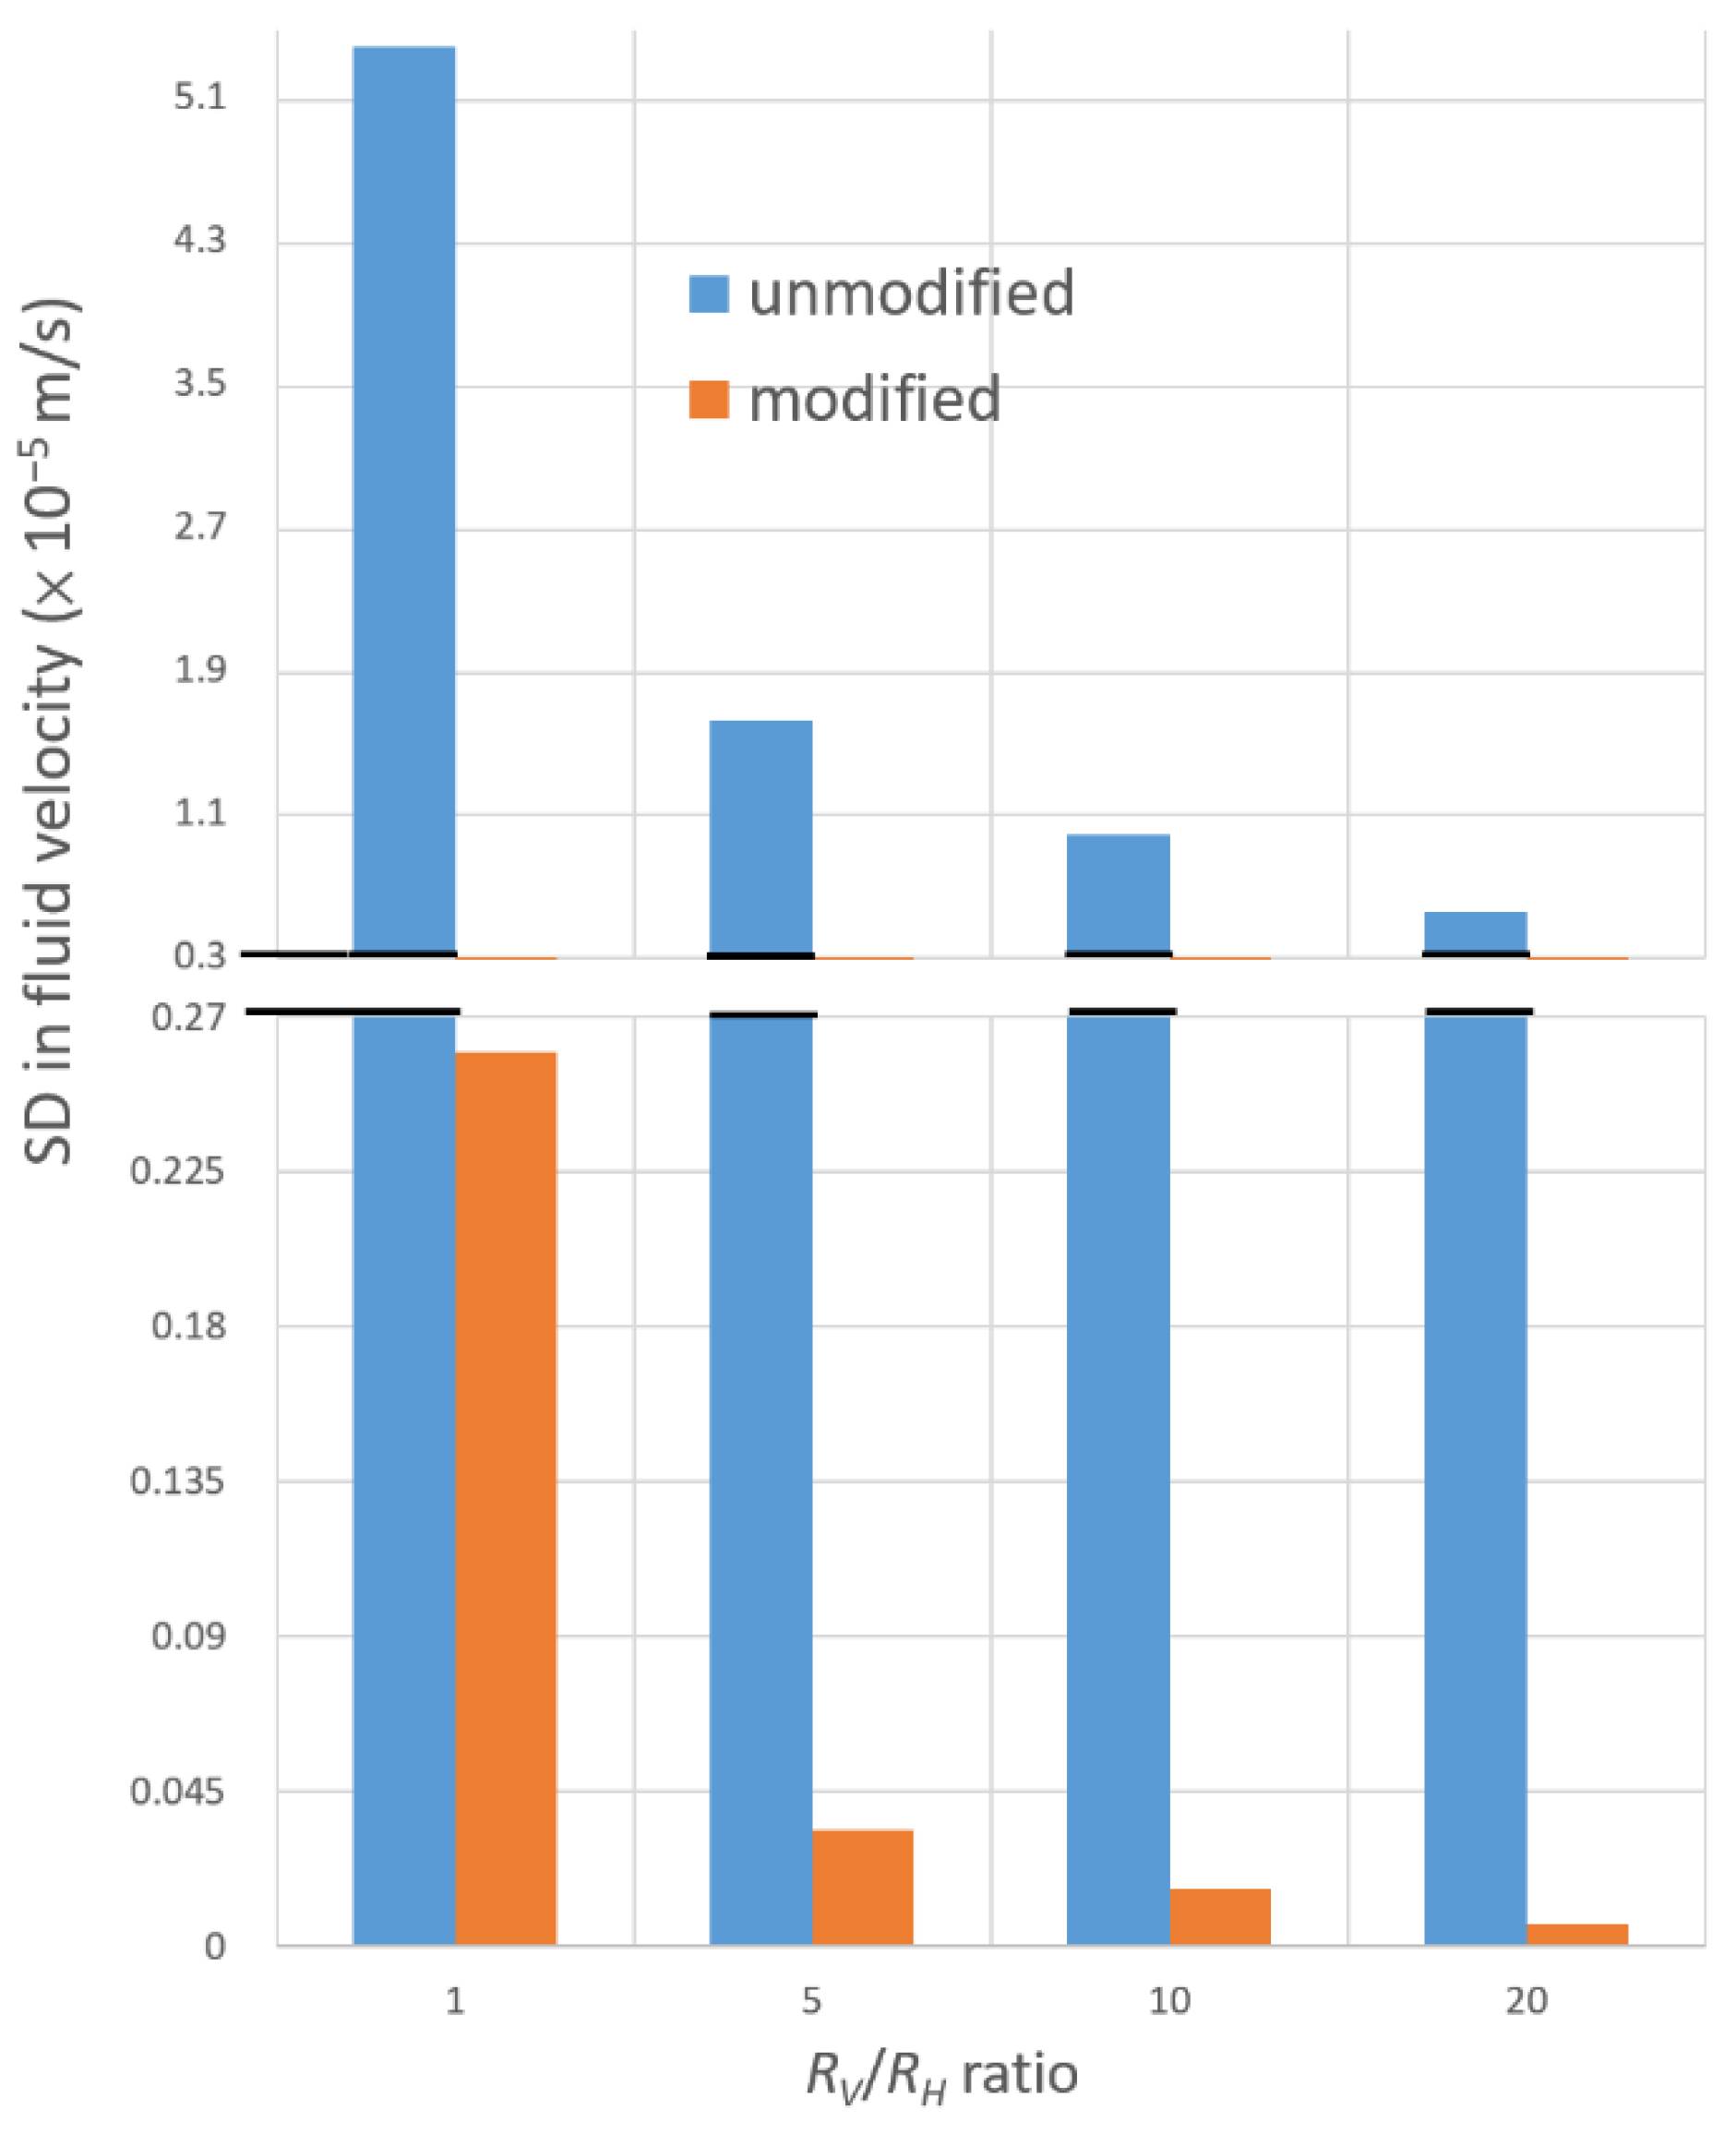
Next, the effects of modifying the partition in horizontal channels on the uniformity of outlet fluid velocities were investigated. Such partition is illustrated in Figure 1c. Designs of modified microfluidic chips with four different ratios of RV/RH are shown in Figure 6. Figure 7a shows simulated fluid velocities recorded in all outlets along red lines in Figure 6. Plotted with the same scale as in Figure 5a, these curves, except the RV = RH one, are flat without showing the bell-shaped normal distribution. Again, the SDs for four different ratios of RV/RH were calculated and plotted in Figure 7b. The data suggested the SD in outlet fluid velocities decreased from 2.6 × 10⁻⁶ m/s for RV = RH to 3.4 × 10⁻⁷, 1.7 × 10⁻⁷ and 6.2 × 10⁻⁸ m/s for RV = 5RH, RV = 10RH and RV = 20RH, respectively. When the length of vertical channels was elongated to 20 times of that of horizontal channels, the SD was reduced by about 98%. This once again verifies that elongating the length of vertical channels to achieve RV >> RH helps in attainment of uniform outlet fluid velocities. To further compare unmodified and modified devices, the SDs for these two types of chips with different ratios of RV/RH are shown in Figure 8. After the horizontal modification, the SDs were reduced by 95%, 98%, 98% and 99% for RV = RH, RV = 5RH, RV = 10RH and RV = 20RH, respectively. In addition, it was found that the SD for the modified chip with RV = RH (2.6 × 10⁻⁶ m/s) was lower than that for the unmodified chip with RV = 20RH (5.6 × 10⁻⁶ m/s). Modifying the partition of horizontal channels is more effective than elongating the length of vertical channels in achieve uniform outlet fluid velocities. However, the length of vertical channels should still remain long enough to ensure enough mixing. From the data in Figure 8, modified MGGs with RV ≧ 5RH are considered optimal in attaining uniform fluid velocities (and accordingly shear stresses) across all outlets. Moreover, representative mesh independence studies were conducted, indicating that these results were in general mesh independent (see Figure S1 in Supplementary Materials).

3.2. Experiments

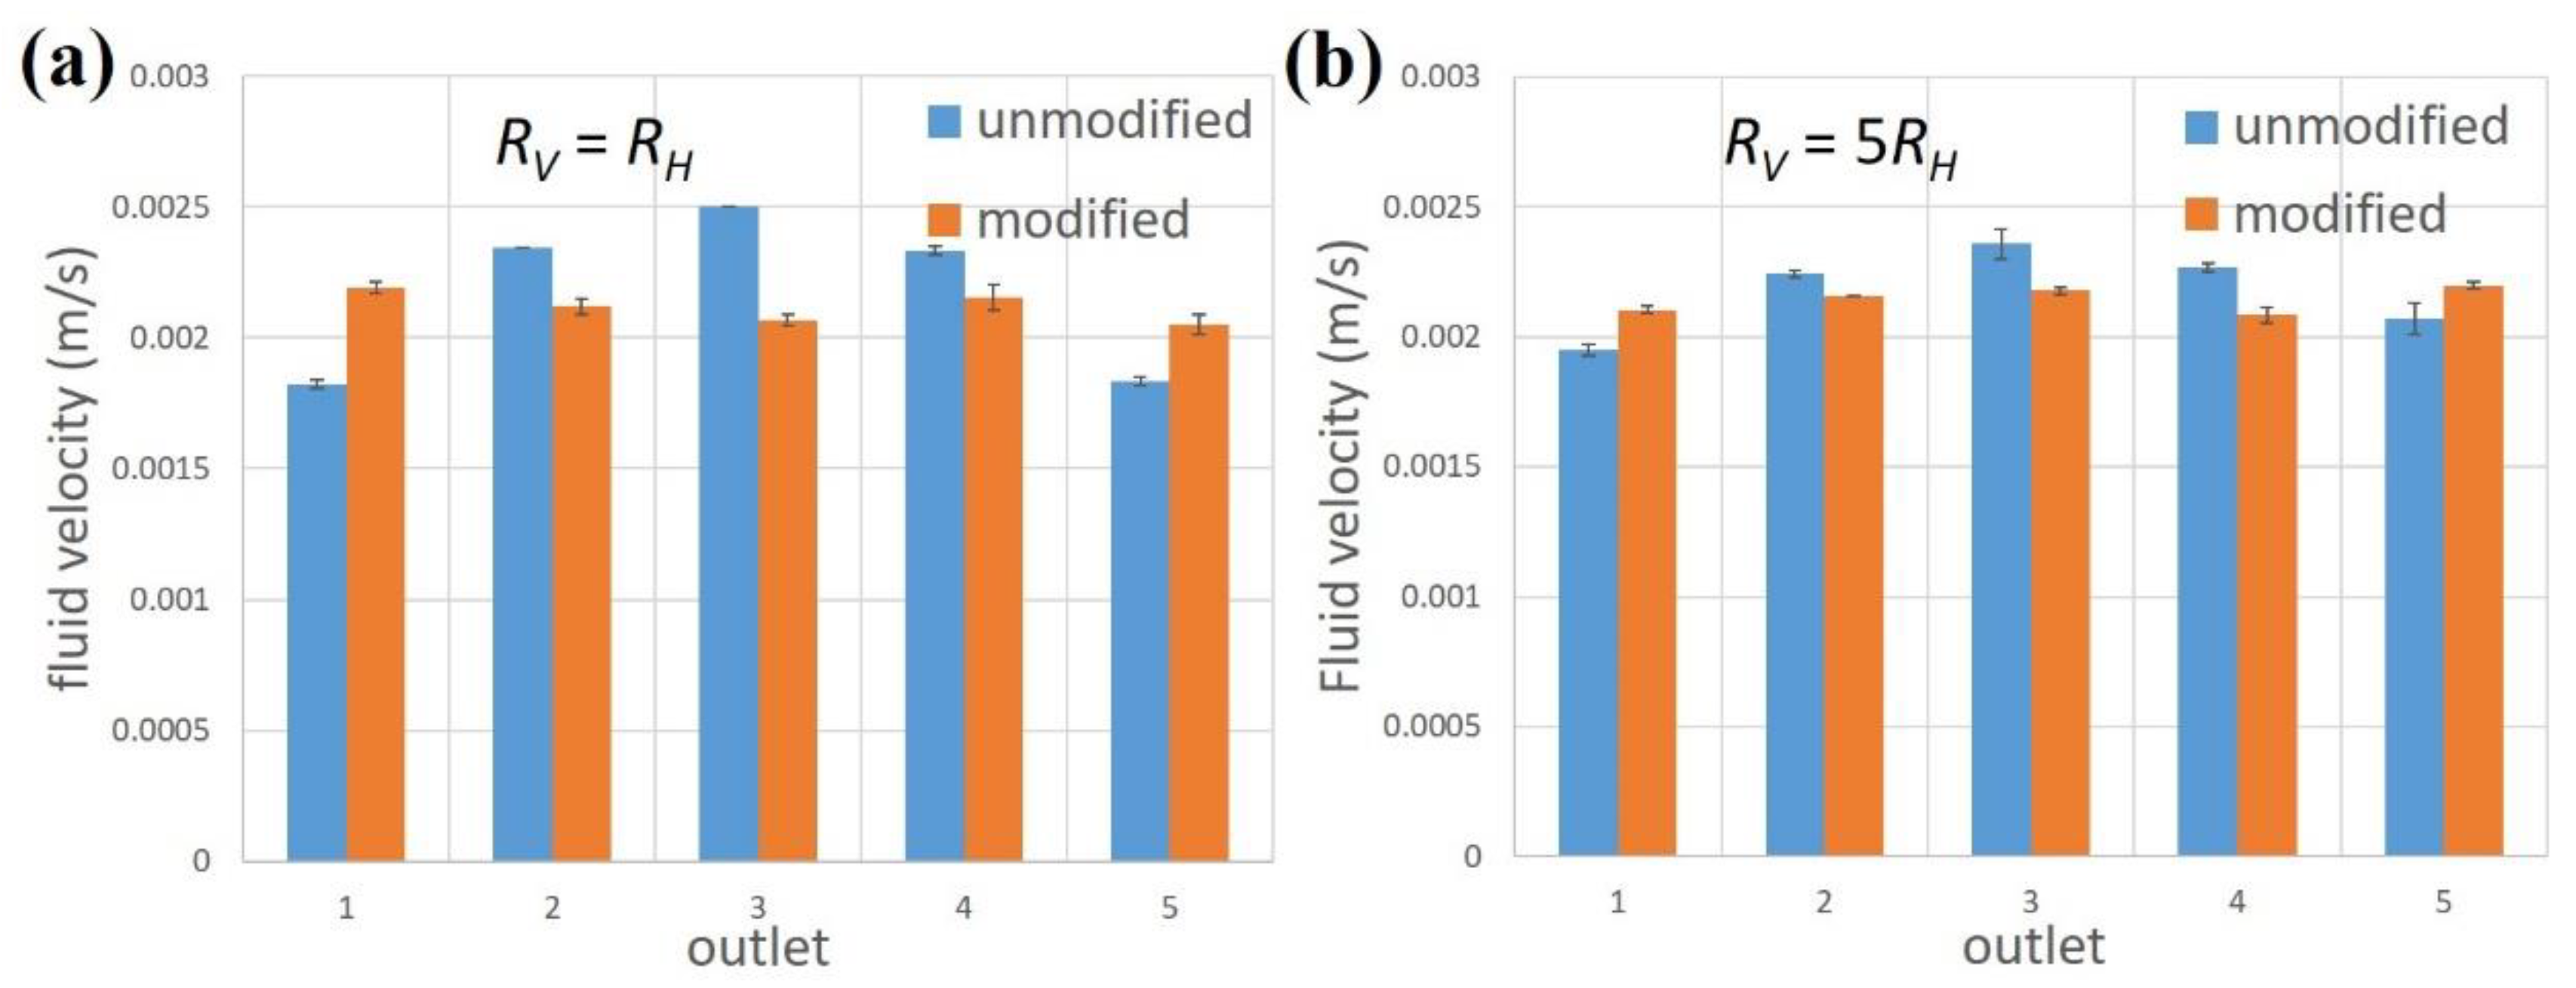
Fluid velocities of unmodified and modified microfluidic chips with RV = RH and RV = 5RH were verified experimentally with PMMA-based Christmas-tree-like devices, as shown in Figure 3. These two sets of data show the most significant differences in fluid velocities, as indicated in Figure 8. As the fluorinated oil FC-40 was continuously flowed into the two inlets of the chip, outflow liquids from five outlets were collected and then weighted to get the volumetric flow rates. These flow rates were converted to fluid velocities after dividing them by the cross-sectional area of the channel. Figure 9a shows these values for both unmodified and modified devices with RV = RH. For the unmodified one, a clear normal distribution-like curve was observed, verifying the simulated results. The fluid velocity in outlet 3 was about 1.36 times greater than that in outlets 1 and 5 (this value was around 1.25 in simulation). The SD in fluid velocities was calculated to be around 2.8 × 10⁻⁴ m/s. This non-uniformity in fluid velocities across all outlets will lead to different shear stress-induced responses of cells as they are incubated in the downstream of the device. After the partition in horizontal channels was modified, fluid velocities seemed to be much more uniform across all outlets, as shown in Figure 9a. In this case, an SD of only about 5.2 × 10⁻⁵ m/s in fluid velocities was derived, corresponding to an 81% reduction compared to the unmodified one (this reduction value was about 95% in simulation). For devices with RV = 5RH, the fluid velocities were indicated in Figure 9b, and the SD was reduced from 1.5 × 10⁻⁴ m/s to 4.3 × 10⁻⁵ m/s after horizontal modification. In addition, for unmodified devices, changing from RV = RH to RV = 5RH reduced the SD in fluid velocities by about 46%. These experimental results verified simulation predictions that the horizontal modification greatly reduced the variation in flow velocities across all outlets.

3.3. Simulation of Chemical Concentrations

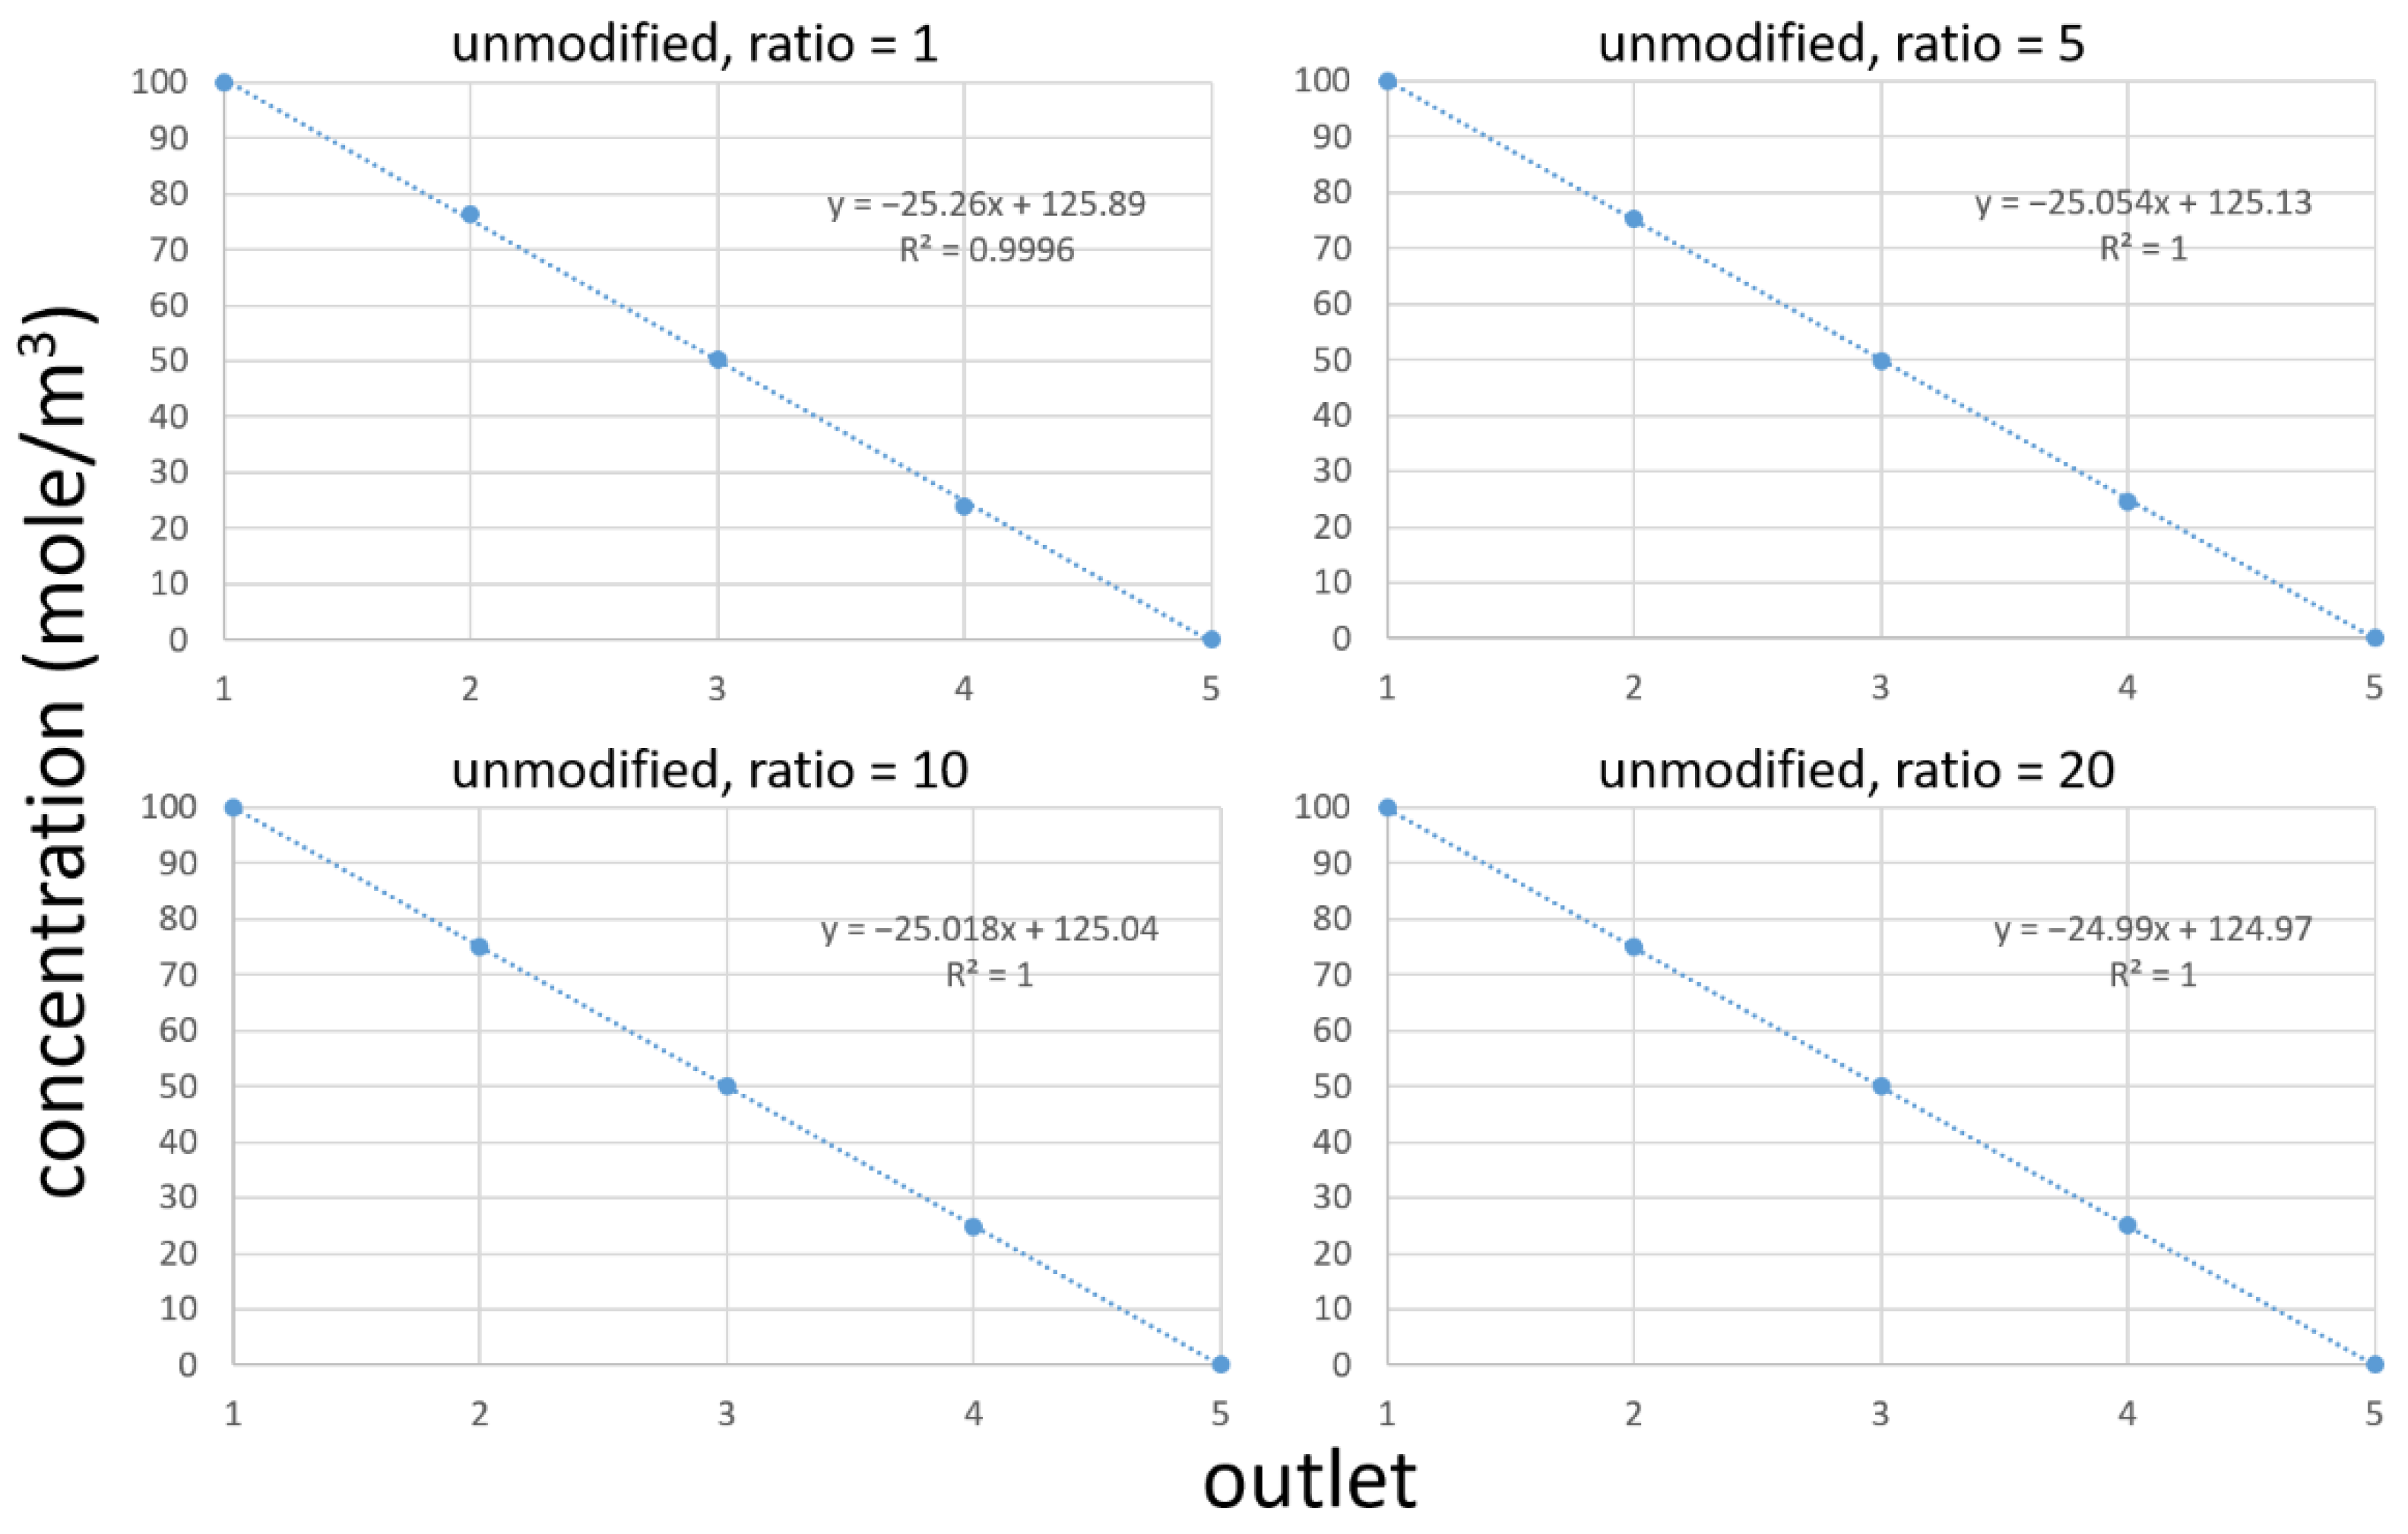
The present microfluidic device is aimed to generate a concentration gradient to investigate how cells respond to a specific chemical of different concentrations. For unmodified devices, the simulated chemical concentrations of FITC in all outlets along red lines in Figure 4 are recorded and plotted in Figure 10. As shown, for all ratios of RV/RH, a nearly perfect gradient was observed. For example, in the case of RV = RH, chemical concentrations of 100, 76.4, 50.3, 23.8 and 0 mole/m3 were attained from outlets 1 to 5, respectively. A linear regression gave an R2 of 0.9996, indicating a very good linearity between the concentration and position. When the ratio was increased to RV = 20RH, chemical concentrations of 100, 74.9, 50, 25 and 0 mole/m3 were achieved from outlets 1 to 5, respectively. A perfect R2 of 1 was derived from linear regression. For horizontally modified chips, simulated FITC concentrations in all outlets along red lines in Figure 6 are recorded and plotted in Figure 11. Again, good linearity in all ratios was clearly observed. When RV = RH, chemical concentrations of 100, 75.5, 49.9, 24.4 and 0 mole/m3 were attained from outlets 1 to 5, respectively, resulting in a R2 of 0.9999 after linear regression. A linearity of R2 = 1 was achieved in horizontally modified devices with RV/RH = 5, 10 and 20. These results suggested that, to serve as a perfect MGG capable of generating a linear concentration gradient across all outlets, an unmodified device with at least RV = 5RH or a modified device with RVRH was considered necessary. Again, representative mesh independence studies showed that these results were, in general, mesh-independent (see Figure S2 in Supplementary Materials).

3.4. Extension to MGGs with Multiple Outlets

Although the present study focuses on five-outlet MGGs, the design rationale in modifying the partition of horizontal channels can be further extended to those with multiple outlets. The principle is that the fluidic resistance is directly proportional to the channel length, so the flow rate is inversely proportional to this length. By applying mass conservation in each branching point, Figure 12 shows the design of a ten-outlet MGG as an example. Numbers in each horizontal layer indicated relative ratios of partitions, and lengths are not to scale. For even more layers, the design rationale is as follows. From the (n − 1)th layer to the nth layer, ratios of 1:(n − 1), 2:(n − 2), 3:(n − 3),……, (n − 3):3, (n − 2):2, and (n − 1):1 are set in the first, second, third,……, (n − 3)th, (n − 2)th, and (n − 1)th branches, respectively. The ratio is “the length of the left partition”:“the length of the right partition”, and the branches are counted from left to right.

4. Conclusions

In this study, the design rationale for constructing Christmas-tree-like MGGs to attain uniform flow rates across all outlets was presented. By adjusting the lengths of both horizontal channels (RH) and vertical channels (RV), simulation results indicated that, to achieve consistent in outlet fluid velocities, RH << RV should be fulfilled to the greatest extent possible, and the partition of horizontal channels should be modified. PMMA-based microfluidic chips with RV = RH were fabricated to experimentally verify the fluid velocities, and it was found that the modification in the partition of horizontal channels greatly reduced the variation in fluid velocities. With respect to chemical concentrations, an unmodified chip with at least RV = 5RH or a modified one with RVRH was shown to attain a perfect linear gradient. We believe that this design rationale will enable the fabrication of optimal Christmas-tree-like MGGs for applications in a variety of cell-based studies.

Supplementary Materials

The following supporting information can be downloaded at: https://www.mdpi.com/article/10.3390/chemosensors11010002/s1, Figure S1: Mesh independence studies on fluid velocity; Figure S2: Mesh independence studies on concentration. Mesh independence studies for unmodified and modified, both with RV/RH = 5, devices were conducted under three different mesh settings (extremely fine, normal and extremely coarse). Figure S1 shows the simulated fluid velocities recorded in all outlets under three different mesh settings. Although the values among different mesh settings were not the same, the overall profiles were almost identical. Quantitatively, for unmodified device, the calculated SDs were 1.53 × 10⁻⁵, 1.23 × 10⁻⁵ and 1.46 × 10⁻⁵ m/s for extremely fine, normal and extremely coarse mesh settings, respectively. For the modified one, the calculated SDs were 3.84 × 10⁻⁷, 2.77 × 10⁻⁷ and 3.01 × 10⁻⁷ m/s for extremely fine, normal and extremely coarse mesh settings, respectively. Even under different mesh settings, these values all correspond to a 98% reduction in SD after horizontal modification. Figure S2 shows the simulated concentrations recorded in all outlets under three different mesh settings. These values were almost the same for all three mesh settings. These results suggest that the conclusion drawn in the manuscript was, in general, mesh-independent. In other words, we can come to the same conclusion even with the extremely coarse mesh setting.

Author Contributions

Conceptualization, Y.-H.W. and Y.-S.S.; methodology, Y.-H.W. and Y.-S.S.; validation, Y.-H.W. and C.-H.P.; investigation, Y.-H.W. and C.-H.P.; data curation, Y.-H.W. and C.-H.P.; writing—original draft preparation, Y.-S.S.; writing—review and editing, Y.-S.S. All authors have read and agreed to the published version of the manuscript.

Funding

This work was financially supported by the National Science and Technology Council of Taiwan under Contract No. MOST 110-2112-M-030-002-MY2 and MOST 111-2112-M-030-004-.

Institutional Review Board Statement

Not applicable.

Informed Consent Statement

Not applicable.

Data Availability Statement

The data are included in the article.

Conflicts of Interest

The authors declare no conflict of interest.

References

  1. Wadhams, G.H.; Armitage, J.P. Making sense of it all: Bacterial chemotaxis. Nat. Rev. Mol. Cell Bio. 2004, 5, 1024–1037. [Google Scholar] [CrossRef] [PubMed]
  2. Cortese, B.; Palama, I.E.; D’Amone, S.; Gigli, G. Influence of electrotaxis on cell behaviour. Integr. Biol.-UK 2014, 6, 817–830. [Google Scholar] [CrossRef] [PubMed]
  3. Niculescu, A.G.; Chircov, C.; Birca, A.C.; Grumezescu, A.M. Fabrication and applications of microfluidic devices: A review. Int. J. Mol. Sci. 2021, 22, 2011. [Google Scholar] [CrossRef] [PubMed]
  4. Lin, F.; Butcher, E.C. T cell chemotaxis in a simple microfluidic device. Lab. Chip. 2006, 6, 1462–1469. [Google Scholar] [CrossRef]
  5. Li, J.; Nandagopal, S.; Wu, D.; Romanuik, S.F.; Paul, K.; Thomson, D.J.; Lin, F. Activated t lymphocytes migrate toward the cathode of dc electric fields in microfluidic devices. Lab. Chip. 2011, 11, 1298–1304. [Google Scholar] [CrossRef]
  6. Sia, S.K.; Whitesides, G.M. Microfluidic devices fabricated in poly(dimethylsiloxane) for biological studies. Electrophoresis 2003, 24, 3563–3576. [Google Scholar] [CrossRef]
  7. Wheeler, A.R.; Throndset, W.R.; Whelan, R.J.; Leach, A.M.; Zare, R.N.; Liao, Y.H.; Farrell, K.; Manger, I.D.; Daridon, A. Microfluidic device for single-cell analysis. Anal. Chem. 2003, 75, 3581–3586. [Google Scholar] [CrossRef]
  8. Shin, Y.S.; Cho, K.; Lim, S.H.; Chung, S.; Park, S.J.; Chung, C.; Han, D.C.; Chang, J.K. Pdms-based micro pcr chip with parylene coating. J. Micromech. Microeng. 2003, 13, 768–774. [Google Scholar] [CrossRef]
  9. Sun, Y.S. Studying electrotaxis in microfluidic devices. Sensors 2017, 17, 2048. [Google Scholar] [CrossRef] [Green Version]
  10. Lin, J.Y.; Lo, K.Y.; Sun, Y.S. A microfluidics-based wound-healing assay for studying the effects of shear stresses, wound widths, and chemicals on the wound-healing process. Sci. Rep.-UK 2019, 9, 20016. [Google Scholar] [CrossRef]
  11. Sun, Y.; Kwok, Y.C.; Nguyen, N.T. Low-pressure, high-temperature thermal bonding of polymeric microfluidic devices and their applications for electrophoretic separation. J. Micromech. Microeng. 2006, 16, 1681–1688. [Google Scholar] [CrossRef]
  12. Hashimoto, M.; Barany, F.; Soper, S.A. Polymerase chain reaction/ligase detection reaction/hybridization assays using flow-through microfluidic devices for the detection of low-abundant DNA point mutations. Biosens. Bioelectron. 2006, 21, 1915–1923. [Google Scholar] [CrossRef] [PubMed]
  13. Chen, Y.; Zhang, L.Y.; Chen, G. Fabrication, modification, and application of department of analytical poly(methyl methacrylate) microfluidic chips. Electrophoresis 2008, 29, 1801–1814. [Google Scholar] [CrossRef] [PubMed]
  14. Gurdon, J.B.; Dyson, S.; St Johnston, D. Cells’ perception of position in a concentration gradient. Cell 1998, 95, 159–162. [Google Scholar] [CrossRef] [PubMed] [Green Version]
  15. Shen, S.; Zhang, X.; Zhang, F.; Wang, D.; Long, D.; Niu, Y. Three-gradient constructions in a flow-rate insensitive microfluidic system for drug screening towards personalized treatment. Talanta 2020, 208, 120477. [Google Scholar] [CrossRef]
  16. Dai, W.; Zheng, Y.Z.; Luo, K.Q.; Wu, H.K. A prototypic microfluidic platform generating stepwise concentration gradients for real-time study of cell apoptosis. Biomicrofluidics 2010, 4, 024101. [Google Scholar] [CrossRef] [Green Version]
  17. Wang, L.; Liu, W.M.; Wang, Y.L.; Wang, J.C.; Tu, Q.; Liu, R.; Wang, J.Y. Construction of oxygen and chemical concentration gradients in a single microfluidic device for studying tumor cell-drug interactions in a dynamic hypoxia microenvironment. Lab. Chip. 2013, 13, 695–705. [Google Scholar] [CrossRef]
  18. Atencia, J.; Cooksey, G.A.; Locascio, L.E. A robust diffusion-based gradient generator for dynamic cell assays. Lab. Chip. 2012, 12, 309–316. [Google Scholar] [CrossRef]
  19. Dravid, A.; Raos, B.; Aqrawe, Z.; Parittotokkaporn, S.; O’Carroll, S.J.; Svirskis, D. A macroscopic diffusion-based gradient generator to establish concentration gradients of soluble molecules within hydrogel scaffolds for cell culture. Front. Chem. 2019, 7, 638. [Google Scholar] [CrossRef]
  20. Skolimowski, M.; Nielsen, M.W.; Emneus, J.; Molin, S.; Taboryski, R.; Sternberg, C.; Dufva, M.; Geschke, O. Microfluidic dissolved oxygen gradient generator biochip as a useful tool in bacterial biofilm studies. Lab. Chip. 2010, 10, 2162–2169. [Google Scholar] [CrossRef]
  21. Jeon, H.; Lee, Y.; Jin, S.; Koo, S.; Lee, C.S.; Yoo, J.Y. Quantitative analysis of single bacterial chemotaxis using a linear concentration gradient microchannel. Biomed Microdevices 2009, 11, 1135–1143. [Google Scholar] [CrossRef] [PubMed] [Green Version]
  22. Mao, H.B.; Cremer, P.S.; Manson, M.D. A sensitive, versatile microfluidic assay for bacterial chemotaxis. Proc. Natl. Acad. Sci. USA 2003, 100, 5449–5454. [Google Scholar] [CrossRef] [PubMed] [Green Version]
  23. Lo, K.Y.; Wu, S.Y.; Sun, Y.S. A microfluidic device for studying the production of reactive oxygen species and the migration in lung cancer cells under single or coexisting chemical/electrical stimulation. Microfluid Nanofluid 2016, 20, 15. [Google Scholar] [CrossRef]
  24. Lo, K.Y.; Zhu, Y.; Tsai, H.F.; Sun, Y.S. Effects of shear stresses and antioxidant concentrations on the production of reactive oxygen species in lung cancer cells. Biomicrofluidics 2013, 7, 064108. [Google Scholar] [CrossRef] [Green Version]
  25. Jeon, N.L.; Dertinger, S.K.W.; Chiu, D.T.; Choi, I.S.; Stroock, A.D.; Whitesides, G.M. Generation of solution and surface gradients using microfluidic systems. Langmuir 2000, 16, 8311–8316. [Google Scholar] [CrossRef]
  26. Wang, S.Y.; Yue, F.; Zhang, L.C.; Wang, J.R.; Wang, Y.Y.; Jiang, L.; Lin, B.C.; Wang, Q. Application of microfluidic gradient chip in the analysis of lung cancer chemotherapy resistance. J. Pharmaceut. Biomed. 2009, 49, 806–810. [Google Scholar]
  27. Ye, N.N.; Qin, J.H.; Shi, W.W.; Liu, X.; Lin, B.C. Cell-based high content screening using an integrated microfluidic device. Lab Chip 2007, 7, 1696–1704. [Google Scholar] [CrossRef]
  28. Cucina, A.; Sterpetti, A.V.; Pupelis, G.; Fragale, A.; Lepidi, S.; Cavallaro, A.; Giustiniani, Q.; Santoro D’Angelo, L. Shear stress induces changes in the morphology and cytoskeleton organisation of arterial endothelial cells. Eur. J. Vasc. Endovasc. Surg. 1995, 9, 86–92. [Google Scholar] [CrossRef] [Green Version]
  29. Feugier, P.; Black, R.A.; Hunt, J.A.; How, T.V. Attachment, morphology and adherence of human endothelial cells to vascular prosthesis materials under the action of shear stress. Biomaterials 2005, 26, 1457–1466. [Google Scholar] [CrossRef]
  30. Chang, S.F.; Chang, C.A.; Lee, D.Y.; Leet, P.L.; Yeh, Y.M.; Yeh, C.R.; Cheng, C.K.; Chien, S.; Chiu, J.J. Tumor cell cycle arrest induced by shear stress: Roles of integrins and smad. Proc. Natl. Acad. Sci. USA 2008, 105, 3927–3932. [Google Scholar] [CrossRef] [Green Version]
  31. Sakota, D.; Sakamoto, R.; Yokoyama, N.; Kobayashi, M.; Takatani, S. Glucose depletion enhances sensitivity to shear stress-induced mechanical damage in red blood cells by rotary blood pumps. Artif. Organs 2009, 33, 733–739. [Google Scholar] [CrossRef] [PubMed]
  32. Braddock, M.; Schwachtgen, J.L.; Houston, P.; Dickson, M.C.; Lee, M.J.; Campbell, C.J. Fluid shear stress modulation of gene expression in endothelial cells. News Physiol. Sci. 1998, 13, 241–246. [Google Scholar] [CrossRef] [PubMed]
  33. Stolberg, S.; McCloskey, K.E. Can shear stress direct stem cell fate? Biotechnol Progr 2009, 25, 10–19. [Google Scholar] [CrossRef] [PubMed]
  34. Albuquerque, M.L.C.; Waters, C.M.; Savla, U.; Schnaper, H.W.; Flozak, A.S. Shear stress enhances human endothelial cell wound closure in vitro. Am. J. Physiol.-Heart C 2000, 279, H293–H302. [Google Scholar] [CrossRef]
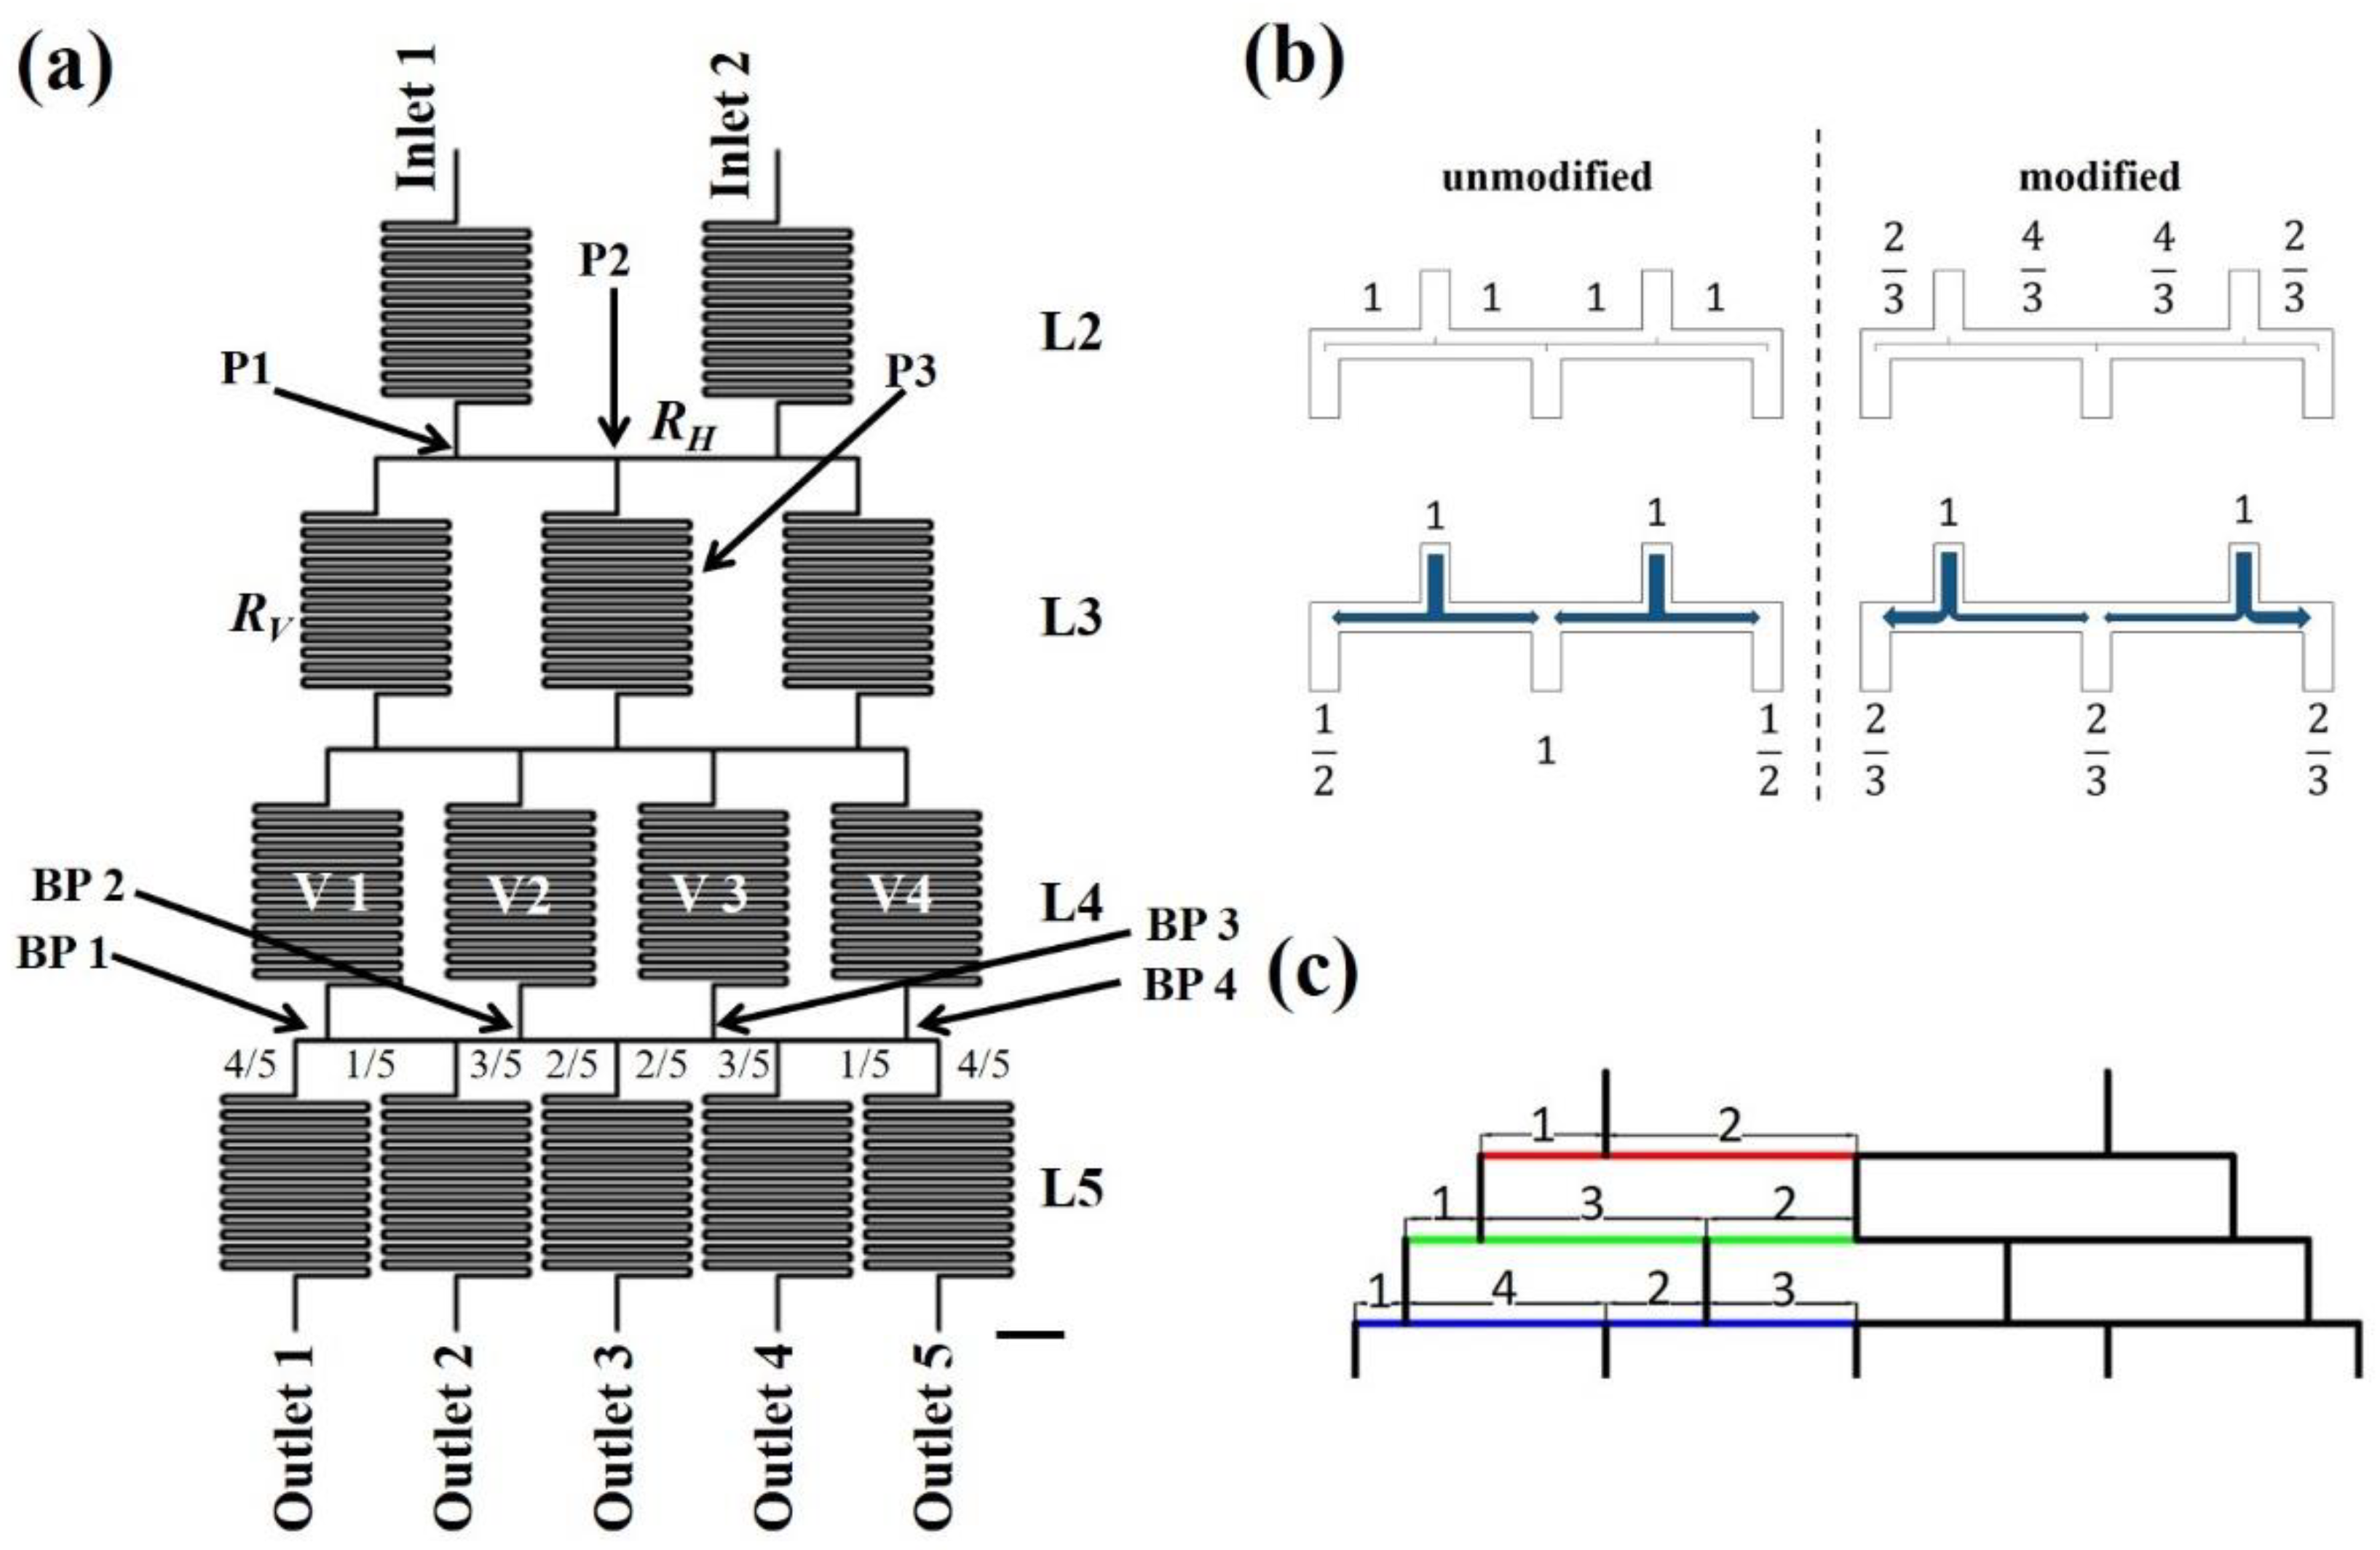
Figure 1. (a) Five-layered, Christmas-tree-like MGG with two inlets and five outlets. Scale bar = 2 mm. (b) Top: Unmodified and modified three-outlet designs. Bottom: flow of liquids upon branching points. (c) Modification ratios of a five-outlet design. P1~P3: Point 1~Point 3; L2~L5: Layer 2~Layer 5; BP1~BP4: Branching Point 1~Branching Point 4; V1~V4: Vertical channels; RH: resistance of the horizontal (splitting) channels; RV: resistance of the vertical (mixing) channels.
Chemosensors 11 00002 g001
Figure 2. Modified, five-outlet design with a part of the mesh in COMSOL simulation. The extremely fine mesh was applied. Scale bar = 2 mm.
Chemosensors 11 00002 g002
Figure 3. Unmodified (right) and modified (left) microfluidic chips with RV = RH. Scale bar = 5 mm.
Chemosensors 11 00002 g003
Figure 4. Designs of unmodified microfluidic chips with four different ratios of RV/RH.
Chemosensors 11 00002 g004
Figure 5. Simulation of fluid velocities for unmodified devices. (a) Fluid velocities in all outlets along red lines in Figure 4. (b) SDs in fluid velocities for four curves in (a).
Chemosensors 11 00002 g005
Figure 6. Designs of modified microfluidic chips with four different ratios of RV/RH.
Chemosensors 11 00002 g006
Figure 7. Simulation of fluid velocities for modified devices. (a) Fluid velocities in all outlets along red lines in Figure 6. (b) SDs in fluid velocities for four curves in (a).
Chemosensors 11 00002 g007
Figure 8. Comparison of SDs for unmodified and modified chips with four different ratios of RV/RH. y-axis scales are different in the top and bottom panels.
Chemosensors 11 00002 g008
Figure 9. Experimentally measured fluid velocities for unmodified and modified microfluidic chips with (a) RV = RH and (b) RV = 5RH.
Chemosensors 11 00002 g009
Figure 10. Simulation of chemical concentrations for unmodified devices with different ratios of RV/RH.
Chemosensors 11 00002 g010
Figure 11. Simulation of chemical concentrations for modified devices with different ratios of RV/RH.
Chemosensors 11 00002 g011
Figure 12. Design of a ten-outlet MGG. Numbers in each horizontal layer indicated relative ratios, and lengths are not to scale.
Chemosensors 11 00002 g012
Disclaimer/Publisher’s Note: The statements, opinions and data contained in all publications are solely those of the individual author(s) and contributor(s) and not of MDPI and/or the editor(s). MDPI and/or the editor(s) disclaim responsibility for any injury to people or property resulting from any ideas, methods, instructions or products referred to in the content.