Review

Nanostructures for In Situ SERS Analysis of High-Temperature Processes

1
School of Chemical and Environmental Engineering, Shenzhen University, Shenzhen 518061, China
2
School of Science, Harbin Institute of Technology, Shenzhen 518055, China
*
Authors to whom correspondence should be addressed.
These authors contributed equally to this work.
Chemosensors 2023, 11(1), 21; https://doi.org/10.3390/chemosensors11010021
Submission received: 25 November 2022 / Revised: 21 December 2022 / Accepted: 21 December 2022 / Published: 26 December 2022
(This article belongs to the Special Issue Nanocomposites for SERS Sensing)

Abstract

:
Surface-enhanced Raman spectroscopy (SERS) is a highly sensitive analytical technique based on Raman scatter and utilizes the nanostructures of active metals, such as gold and silver, with roughened surfaces as a signal amplifier. With its enhancement effect and “fingerprint” ability, in situ SERS is able to capture the dynamics of microstructure evolution and trace surface species in real time, which provides direct information for the analysis of a reaction mechanism in various surface processes, including heterogeneous catalysis, electrochemical reactions, etc. To date, SERS has been widely used in operando analysis of surface processes under ordinary temperatures. For application in high-temperature processes, the harsh environment puts forward additional requirements in addition to high sensitivity for the SERS nanostructures, especially concerning thermal stability, chemical inertness, and surface universality. Therefore, it is necessary to develop specialized SERS nanostructures for in situ analysis of high-temperature processes. This paper reviews the research progress of the design and application of nanostructures for in situ SERS analysis of high-temperature processes, with special focus on how to solve the stability and sensitivity contradiction of the SERS nanostructures in the high-temperature complex environment through the design and regulation of the nanostructures. For the structure design, the strategies, preparation, and performance of the reported nanoarchitectures are compared. For the high-temperature application, the utilization of SERS nanostructures in in situ studies are summarized, including thermal crystallization, lattice dynamics, heterogeneous catalysis, and high-temperature electrode reactions.

1. Introduction

SERS has drawn huge interest in trace analysis and chemical reaction mechanism analysis due to its high detection sensitivity, low demanding conditions, and abundant surface information, among others [1,2,3,4,5,6]. Despite unique advantages of SERS, materials exhibiting high SERS activity is only limited to a few nano-rough coinage metals, typically Au, Ag, and Cu, because of their unique plasmonic properties [7]. As a result, studies on SERS-active material substrates progressed easily early on, but major challenges arose when scientists tried to extend SERS to other substrates. Therefore, numerous research efforts were devoted to improving enhancement capabilities of other substrates, generally by introducing SERS-active nanostructures, or Raman amplifiers, to the desired substrates, which is also referred to as the “borrowing strategy” [8,9]. In 1983, researchers had managed to deposit discrete Ag nanoparticles on the surface of n-GaAs, a SERS-inert material, and successfully observed Raman signals of probe molecules absorbing on the SERS-inert material [10,11,12]. However, the shortcoming of the method relates to the miscellaneous peaks that stem from the interaction of Ag and the probe molecules, since Ag is a highly chemically active material. Secondly, charge transfers between the electrode materials and Raman amplifiers would also bring interferences to the Raman spectra if the coinage metal is directly deposited on the surface of the materials to be characterized.
In 1987, researchers had managed to deposit some ultrathin SERS-inert material layers on the surface of Au and Ag, which enables researchers to safely borrow the SERS effect of Au and Ag and to study the Raman signal of probe molecules absorbing on the SERS-inert material because the thin layer blocked the interaction of Raman amplifiers with the probe molecules [13,14,15,16,17]. A great improvement as it may be, the shortcoming is the limited generality of the method. Firstly, the deposition method of different materials on the surface of Au or Ag needs a case-by-case study. Second, the SERS effect of Au and Ag decays exponentially as the distance of the probe molecules from the surface increases, while depositing ultrathin materials on the nano-rough surface of Au and Ag is demanding for the preparation method [18,19]. Tip-enhanced Raman spectroscopy (TERS) is one of the typical methods to solve the problem of substrate generality, in which the Au tip could approach any substrate and function as the Raman signal amplifier [20,21,22,23]. However, the shortcoming comes from its weak enhancement capabilities since the overall signal comes from a single Au tip, which limits the TERS approach to species with large Raman cross-sections.
Li et al. first designed shell-isolated nanoparticle-enhanced Raman spectroscopy (SHINERS) [24]. Au tip is typically replaced by a monolayer of 55 nm Au nanoparticles coated with a 2 nm SiO2 shell, and each Au nanoparticle in the monolayer functions as one Au tip in TERS, which leads to two to three orders of magnitude higher detection sensitivity than the TERS technique. Moreover, SHINERS solved the problem of substrate universality because the coating of chemically inert shell blocks off chemical interactions between Raman amplifiers and either probe molecules or substrates, which allow shell-isolated nanoparticles (SHINs) to navigate a broad range of substrates [24,25,26]. High SERS activity and substrate universality are well balanced through proper structural design [25,27,28].
So far, SERS has been widely used in ordinary temperature conditions, such as trace molecular detection, electrochemical adsorption, catalysis, etc. SERS technology can detect molecules in ultralow concentration, and even a single molecule [29,30,31,32]. In the field of electrochemical reactions, SERS technology can be used to study the adsorption and desorption behavior of molecules and detect the chemical reaction on the electrode surface in real time [33,34]. In the field of catalysis, SERS can be used to obtain direct information on the evolution of catalyst surface species and local structure during the reaction processes [35,36].
Compared to the extensive studies in ordinary temperature processes, the application of SERS under high temperature is relatively rare. The SERS activity of the dedicated nanostructure that shows excellent sensitivity under ordinary temperature usually suffers from serious degradation due to the poor thermal stability at elevated temperature. The contradiction of achieving high sensitivity and high stability simultaneously brings a challenge for the application of SERS for in situ analysis of high-temperature processes. High-temperature processes, including thermal crystallization, solid state reaction, heterogeneous catalysis, etc., constitute the fundamental steps of most modern chemical, material, and energy industries [37]. The adoption of in situ SERS on high-temperature processes can provide direct information for the structural and compositional dynamics in operando, which are vital for the fundamental understanding of high-temperature processes [38,39]. It is of high demand to develop thermally robust SERS nanostructures for in situ analysis of high-temperature processes, especially with the properties of structural stability, chemical inertness, and substrate universality. This paper reviews the research progress in structural design and application of SERS for in situ analysis of high-temperature processes. In the structural design section, we compare the state-of-art strategies and approaches to solve the stability and sensitivity contradiction of the SERS nanostructure under high-temperature conditions. In the application section, we summarize the utilization of SERS nanostructures in in situ analysis of thermal crystallization, lattice dynamics, heterogeneous catalysis, and high-temperature electrode reactions. Lastly, we discuss the future outlook for the development of high-temperature SERS nanostructures and their applications.

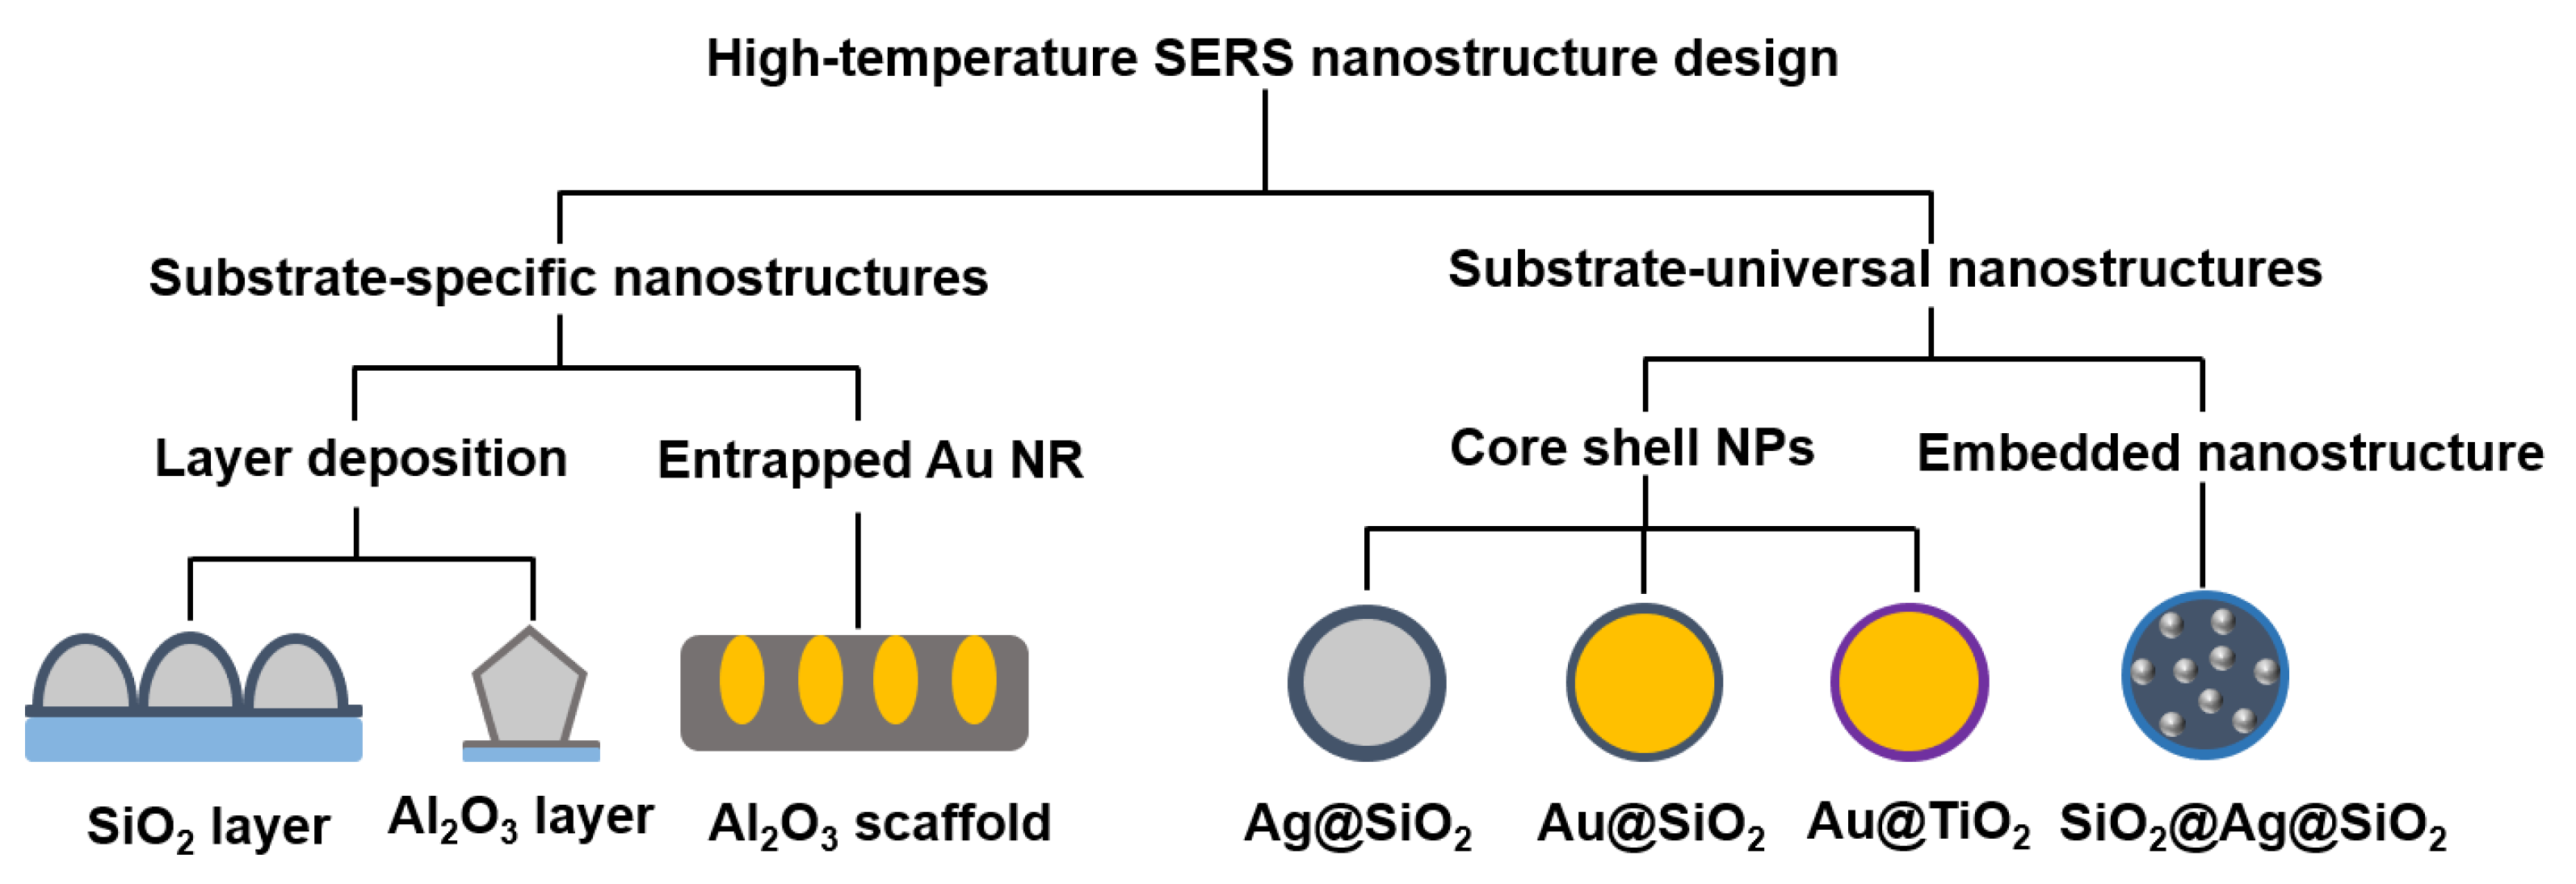
2. Design of Nanostructures for High-Temperature SERS

Owing to the harsh conditions, high-temperature Raman amplifiers face exclusive challenges other than those of ordinary temperature Raman amplifiers. One of the exclusive challenges originates from the aggregation of the metal nanostructures due to their generally lower melting point compared to their macrocosm counterpart [40,41]. Additionally, high temperature is likely to trigger chemical reactions of Raman amplifiers with the analytes, which causes problems such as decreasing SERS activity and miscellaneous peaks [42,43,44]. To address these problems, specialized SERS nanostructures have been designed and developed for high-temperature application. Figure 1 summarizes various types of the high-temperature SERS nanostructures reported in the literature. To facilitate the understanding of high-temperature SERS nanostructure design generally, we classify all high-temperature SERS nanostructures into substrate-specific nanostructures and substrate-universal nanostructures according to their substrate generality. Secondly, they are further sorted according to their preparation methods. Substrate-specific nanostructures are sorted according to layer deposition and entrapped Au NR, while substrate-universal nanostructures are sorted based on core shell NPs and embedded nanostructure. Finally, they are classified according to their specific architectures and compositions. There are SiO2 and Al2O3 layers in the layer deposition, and Al2O3 scaffold in entrapped Au NR to finalize substrate-specific nanostructures. There are Ag@SiO2, Au@SiO2, Au@TiO2 in core–shell NPs, and SiO2@Au@SiO2 in embedded nanostructure to finalize substrate-universal nanostructures. These nanostructures, designed for high-temperature SERS, are discussed in detail in the following subsections.

2.1. Substrate-Specific Nanostructures

2.1.1. Layer Deposition

By using ALD, Dai et al. have managed to deposit an Al2O3 layer, which possesses an ultrahigh melting point and fine and close texture, on films with deposited Ag nanostructures [45]. Typically, Ag nanowires, 90 nm in diameter, coated with a 1.2 nm Al2O3 layer could exhibit EF of 1.07 × 10⁴ for Rhodamine 6G after 400 °C treatment for 26 h, which is more than one third of its retained EF, while the uncoated Ag nanowires plummeted to a single digit after heating treatment, which is significantly less than the coated one. Ag nanoparticle conglomerates coated with 2.5 and 5 nm could exhibit EF of around 2 × 10⁵ and 1 × 10⁵ for Rhodamine 6G after 400 °C treatment for 35 days, respectively, which is almost no visible change in EF compared to their unheated counterparts. In comparison, the EF of uncoated Ag nanoparticle conglomerates decreased to 1 × 10⁵ from 5 × 10⁵ for Rhodamine 6G after the same heating treatment [46,47].
On Ag nanoparticles through sputtering, Liu et al. first formed Ag nanoparticles on a Si substrate, followed by a second deposit, a 10–15 nm SiO2 outer layer, which is another material with a high melting point and fine and close texture. Benefitting from the relatively thick protective layer, they successfully raised the temperature up to 900 °C during thermal annealing process without destructing the nanostructure. However, the enhancement factor is calculated to be 2~6 for Rhodamine B [48].
Summarizing, the layer deposition technique suggests that the thicker the protective layer (generally SiO2 or Al2O3), the lower the SERS activity exhibited when compared to bare metal nanostructures, which means that thermal robustness is improved at the cost of SERS activity. On the other hand, the coating of protective layer on the SERS-active nanostructures and the substrate limits the studies to SiO2- and Al2O3-related systems [45,47]. Nevertheless, it is still a milestone improvement since more SERS activity is retained for the protected SERS-active nanostructures compared to their unprotected counterparts after the heating treatment.

2.1.2. Entrapped Nanorods

To stabilize Raman amplifiers without the presence of protective capping layer, Du et al. have managed to entrap Au nanorods (Au NRs) in anodized aluminum oxide (AAO) scaffolds, which make full use of the substrate to offer thermal protection and can be seen as a partial but ultrathick protective layer. The EF of the nanostructure is two to three orders of magnitude for Rhodamine 6G, which shows no significant change after 800 °C treatment for 1 h [49]. It is also worth noting that Au exhibits great chemical-inertness even at high temperature, while Ag exhibits very limited resistance to oxidation [50]. As a result, partial exposure of Au under high temperature could cause far less interference to the reaction system. The strength of the method is that it is capable of exhibiting relatively high SERS activity at ultrahigh temperature, compared to previously described layer deposition methods. However, for as-prepared samples that exhibit excellent performance, scaffold preparations cover or even deconstruct the interface of the samples so as to entrap Au NR, which unavoidably interferes with the analysis and limits the adoption of this approach to create the scaffold-related materials. Moreover, partial exposure of Au NR is likely to introduce a miscellaneous peak to the Raman spectra. Both of these could hinder the extension of the method to broad material systems.

2.2. Substrate-Universal Nanostructures

2.2.1. Core–Shell Nanostructures

To extend the substrate universality, researchers have managed to coat Raman amplifiers with a protective layer before it is deposited on the substrate. Weckhuysen et al. synthesized Au@SiO2 and Au@TiO2 shell-isolated nanoparticles, respectively, typically with the diameter of Au spheres being 76 nm and thickness of protective shell being 1–3 nm [51]. Both Au@SiO2 and Au@TiO2 nanoparticles with a 2.2–2.7 nm protective layer exhibited an enhancement factor of four orders of magnitude for Rhodamine 6G after 400 °C treatment for 3 h, which was less than one order lower compared to their unheated counterparts. The stability of Au@SiO2 and Au@TiO2 nanoparticles with a 1.2–1.3 nm protective layer were found insufficient above 300 °C. When the temperature was raised to 500 °C, all the structures collapsed.
To extend SERS to even higher temperature, Liu et al. [43] developed Ag@SiO2 core–shell nanoparticles, with 60 nm Ag spheres being the core to offer SERS activity and SiO2 shell being 10 nm thick to offer thermal stability, which maintained more than one third of its original enhanced capabilities after heating treatment at 500 °C for 30 min. However, the EF of the as-prepared Ag@SiO2 nanoparticles was calculated to be around 150 for Rhodamine 6G due to the exponential decay of SERS activity with the increased contact distance from Ag core to probe molecules [43].
It is also worth noting that core–shell nanostructures exhibit less thermal stability compared with substrate-specific nanostructures, when the thickness of protective layer is held constant. This is reasonable because the size of core–shell nanoparticles is relatively smaller than the substrate-specific nanostructures. As a result, the higher surface energy of core–shell nanoparticles would prompt the morphological change in the structure as temperatures are raised, which leads to the deterioration of SERS activity [50,52,53,54].

2.2.2. Embedded Core–Shell Nanostructure

Recently, our group developed a novel hybrid nanostructure of embedded Ag nanoparticles confined by core–shell silica nanospheres, denoted as ESCNs [55]. Our approach is to plant ~30 nm Ag nanoparticles on the surface of the ~500 nm SiO2 core first, and then deposit 3~5 nm SiO2 shell afterward. The SiO2 core–shell architecture functions as a thermally robust framework for embedded Ag nanoparticles due to the nanoconfinement effect. With introduction of SiO2 as thermally robust core and decreased thickness of outermost SiO2 shell, the EF of ESCNs for Rhodamine 6G reaches 4.45 × 10⁴, 1 × 10⁴, 69 after 400 °C, 450 °C, 500 °C heat treatment for 2 h, respectively. In addition, it is revealed by 3D-FDTD (three-dimensional finite-difference time-domain) calculation that the self-assembled Ag nanoparticles that embedded in the SiO2 core–shell consist of plasmonic “hot spots”, which contribute a strong enhancement on individual ECSNs. The theoretical calculation is found to be in good agreement with the experimental observation of ESCNs with different Ag embedding (Figure 2). Therefore, the SERS activity of the ECSNs does not depend on assembling dimers or trimers, as required in previously reported approaches. The ECSNs have been used for the measurements on the trace analysis of carbon species and dynamic tracking of ceria lattice, which results further demonstrate the potential of this hybrid nanostructure for in situ analysis of high-temperature processes, especially for sensitive detection of trace surface species or local structure evolution.
It is worth noting that the advantages of ESCN include the introduction of a thermally robust inner core (~500 nm SiO2 core), significantly enhancing the thermal stability of ESCN, which enables the nanostructure to withstand high temperature even when the SiO2 outer shell is less than 5 nm. On the other hand, several Ag nanoparticles embedded on one ESCN multiply the number of “hot spots”, which reasonably enhances the SERS activity compared with ordinary core–shell nanostructures.

3. Application of SERS Nanostructure in High-Temperature Processes

3.1. Structure Evolution

3.1.1. Thermal Crystallization

The in situ analysis of lattice structure evolution could provide direct information for understanding thermal crystallization. The capability of high-temperature Raman spectra to monitor microstructural changes in melt makes it an effective tool to study the structure of melt at high temperature and provide information to expand the understanding of crystal growth. Sobol et al. studied the microstructure of Li2O-B2O3-MoO3 using high-temperature in situ Raman spectroscopy [56]. Qiu et al. investigated the structural changes in BSO crystals in the range 293~1123 K using high-temperature Raman spectroscopy and time-resolved monitoring technique. They found that Bi-O(1) vibration mode (542 cm−1) red-shifted as temperature was raised to 1123 K. Furthermore, the Raman band characterized by Bi atomic vibration mode decreased in intensity, which indicates the destruction of lattice structure at high temperature [57].
In situ high-temperature SERS can monitor the phase development of crystals during heat treatment with enhanced sensitivity, which could provide abundant information for the study of the thermal crystallization. Tri (8-hydroxyquinoline) aluminum (Alq3) film is one of the most widely used electron transfer and emission materials for organic photodiodes (OLEDs) [58]. However, the crystallization of Alq3 film and the increase in surface roughness leads to the degradation of OLED [59]. Muraki et al. employed SERS to monitor the crystallization behavior of Alq3 film with various thicknesses by depositing 5 nm Au on the Alq3 films [60]. The crystallization temperatures of Alq3 films were determined by analyzing the dependence of the SERS band for quinoline stretching mode on the temperature. SERS data showed an obvious movement in the characteristic peak of the quinoline ring to a higher frequency in 60 nm thick Alq3 film as the temperature was raised to 520 K, which indicated a change in the Alq3 from the amorphous to the crystalline phase. The higher frequency shift of quinoline stretching mode for 3 and 10 nm Alq3 films appeared at approximately 450 and 480 K, respectively. By using the Au nanolayer as the SERS amplifier, the crystallization temperatures were successfully identified for the Alq3 films with various thicknesses.

3.1.2. Interfacial Interaction

The ability for high-temperature SERS to observe interfacial interactions is of general significance for catalysis, as interfacial bonds play a key role in catalytic reactions. Dai et al. utilized robust SERS nanostructures to study in situ the effects of heating a solid acid, phosphotungstic acid (PTA), on an alumina surface while operating at elevated temperatures in various atmospheres [61]. The robust SERS nanostructures were generated by depositing an ultrathin protective coating (1.2 nm) of alumina on top of silver NWs via ALD. A thin layer of PTA was subsequently decorated on top of the nanostructures. The PTA powder on the silicon chip was tested to initialize the in situ Raman analysis. Raman bands at 1015 and 992 cm−1 were observed, which were attributed to the νs (W=O) and νas (W=O), respectively, while bands at 935 and 890 cm−1 were attributed to bridging νas (W-O-W) modes (Figure 3a). When PTA was loaded onto SERS substrates covered with an Al2O3 protective layer, differences arose (Figure 3b). Band intensities of νs (W-O) and νas (W-O) reversed, which corresponded to the analysis results of PTA adsorbed onto bare Ag colloids, which suggested that the orientation of PTA on the Al2O3 surface was likely similar to that on the Ag surface. When the analysis was performed in H2 atmosphere at 400 °C, the intensity of the 890 cm−1 band increased (Figure 3b). In comparison, the band at 923 cm−1 blue-shifted slightly in O2 atmosphere at 100 °C, which was stated to be attributed to the resemblance of W=O stretching mode due to the dehydration of PTA. When the temperature was increased to 200 and 300 °C, the bands red-shifted gradually, which was presumably caused by the loss in electron density of PTA. When the temperature was further raised to 400 °C, major changes were observed, in which spectrum went from Raman bands at 906 and 986 cm−1 at 300 °C to one predominant band at 893 cm−1 at 400 °C, with a mild shoulder band at around 986 cm−1 (Figure 3c,d). The characteristic band shift was reasonably attributed by the authors to the interaction between PTA and Al2O3. By employing in situ high-temperature SERS, they were therefore able to monitor the interfacial interactions between the PTA and the alumina surface in real time, which occurred during the heating treatment in either oxidative or reductive environments.

3.1.3. Lattice Dynamics

High-temperature SERS has been applied to monitor the lattice evolution of CeO2 in reducing and oxidizing atmospheres. CeO2 is an important functional material for various applications, such as heterogeneous catalysis, solid oxide fuel cells, and functional ceramics [62]. The functionality of CeO2 depends greatly on the oxygen storage and release capability, which is endowed by the generation and consumption of a key lattice defect, oxygen vacancies. The in situ observation of the lattice dynamics related with oxygen vacancies is critical to reveal the mechanism of CeO2 functionality as either a structure stabilizer or electronic promotor in wide applications. Liu et al. employed Ag@SiO2 nanoparticles as SERS amplifier to investigate the oxygen vacancies and adsorbed oxygen molecules on the CeO2 powders at 450 °C under reducing and oxidizing atmospheres [43]. The EF factor of Ag@SiO2 (~60 nm Ag core and ~10 nm SiO2 shell) for Rhodamine 6G was approximately 159. A Raman band at around 560 cm−1 related to oxygen vacancies of CeO2 has been observed in reducing atmosphere, while this band was absent in the oxidative atmosphere. Additionally, our group employed the ECSN-enhanced Raman spectroscopy to track the lattice dynamics of CeO2 under high temperature (450 °C) at various gas atmospheres, as illustrated in Figure 4a [55]. The non-SERS Raman spectrum exhibited only the F2g peak of CeO2 (458 cm−1). The ECSN-enhanced Raman spectrum clearly revealed the appearance and disappearance of a new band at 530 cm−1, which was ascribed to oxygen vacancies in the ceria lattice, induced by the switch of the gas flow (Figure 4b). The strong enhancement ability and thermal robustness of the ECSNs enabled sensitive tracking of the lattice evolution for CeO2 under operando conditions, which was undetectable under ordinary Raman spectroscopy.

3.2. Heterogeneous Catalytic Reaction

3.2.1. Ethylene Epoxidation

Raising temperatures can significantly improve reaction kinetics. Although the reaction energy barrier can be lowered by using catalysts, high temperature is still necessary for a large number of catalytic reactions to proceed effectively. SERS can be used to study the heterogeneous reaction in catalytic systems, which can provide valuable insights for understanding the active sites and reaction mechanisms. Kondarides et al. utilized in situ SERS to follow the changes in adsorption state of oxygen and ethylene epoxidation on Ag catalyst surfaces at 1 atmosphere and temperature between 25 and 400 °C [63]. Interactions and reaction mechanisms were carefully examined in three types of silver catalysts: (I) Ag supported on α-Al2O3, (II) Ag films deposited on SiO2, and (III) Ag films deposited on the oxygen ion conducting solid electrolyte material, Y2O3-stabilized ZrO2 (YSZ). For the Ag/YSZ catalyst, Raman spectra were obtained after the catalyst was heated to 300 °C and then cooled to room temperature in oxygen gas flow. Raman bands at 240, 345, 815, 870, and 980 cm−1 were observed, for which 815, 870, and 980 cm−1 were ascribed to the ν (O-O) vibrations of adsorbed molecular oxygen, while 240 and 345 cm−1 were ascribed to Ag-O vibrations of Ag-O2 interactions. Moreover, the band intensity gradually decreased as temperature was raised to 220 °C, and the 815 cm−1 band was the only band left to be observed. On the other hand, the intensity and the frequency region of the 815 cm−1 band changed with the C2H4/O2 ratio at a fixed temperature of 300 °C. The 815 cm−1 band decreased in intensity and red-shifted as the C2H4/O2 ratio was raised, which indicated the weakening of the O-O bond. Similar changes were observed when the catalyst was replaced by Ag/SiO2, for which the 815 cm−1 band was observed when it was exposed to the mixed gas of O2 and C2H4/N2, and increased in intensity when the C2H4 flow was stopped. The Raman band intensity of Ag/α-Al2O3 was the lowest among all catalysts. The 815 cm−1 band, which could also be observed for O2-C2H4 atmospheres, was the characteristic band of all three catalysts. The gradual change for the 815 cm−1 band through time with various gaseous mixtures indicated that molecular oxygen was not the catalytically active species.

3.2.2. NO Reduction

Williams et al. utilized in situ SERS to monitor the exact reactive nature of surface species during reduction of NO by CO on Pt and Pd [3]. The SERS architecture was prepared by electrodepositing ultrathin transition-metal films onto electrochemically roughened gold. When the Pt surface was exposed to an equivalent mixture of NO and CO at room temperature, SERS spectra showed bands at 240, 325, 470, 640, 2080, 2160, and 2230 cm−1, for which the 240 and 470 cm−1 bands were attributed to Pt-NO stretching and Pt-N-O bending modes, respectively; the 325 cm−1 band was attributed to the Pt-NO stretch of NO adsorbed on bridge sites; the 470 and 2080 cm−1 bands were assigned to the Pt-CO and C-O stretches of terminally adsorbed CO, and the 2160 and 2230 cm−1 bands were attributed to reaction products of CO and NO. These bands were considered to be the characteristic signals that indicated the adsorption of CO and NO on the surface of Pt (Figure 5a). The 325, 470, and 2080 cm−1 bands decreased in intensity when the temperature was raised to 200 °C (Figure 5b), which indicated desorption of CO. The adsorption status of the CO and NO mixture on the Pd surface was also investigated and indicated the absence of characteristic bands of adsorbed CO and the presence of characteristic bands of adsorbed NO, which suggested that NO displaced CO from the palladium surface. The in situ SERS results revealed that molecular NO dominated on both Pt and Pd surfaces at relatively low temperature. Although NO and dissociated atomic N species blocked the adsorption of CO onto Pd, the presence of adsorbed CO on the surface of Pt was observable under similar conditions.

3.2.3. CO Oxidation

Li et al. proposed Au-core silica-shell nanocatalyst-satellite composites to study the heterogeneous catalytic reaction of CO oxidation. The composites were assembled by Au@SiO2 (120 nm Au cores with 2 nm SiO2 shells) supporting 1~3 nm nanocatalysts [64,65]. Owing to the enhanced electromagnetic field of the gold core, Raman signals of the surface species on nanocatalysts could be amplified by eight orders of magnitude. The oxidation of CO on Pd nanocatalyst was studied by employing the core–shell nanocatalyst-satellite composites. As shown in Figure 6a, the peaks related to CO were observed at 360, 1930, and 2061 cm−1 at low temperature. As the temperature was raised, the signal intensity related to CO adsorption decreased, and Raman signals of peroxides and superoxide (860, 955, and 1165 cm−1) was observed accompanied with that of Pd-O at 433 and 645 cm−1, indicating that active oxygen species and Pd-O replaced a portion of CO on Pd. In addition, it was observed that when the CO ratio increased, the catalytic reaction efficiency decreased, as shown in Figure 6c. At high CO/O2 gas ratio, high temperature was required to form active oxygen and Pd-O surface oxygen. Combining the results of both SHINERS satellite strategy and DFT calculation, it was found that active oxygen species would not form until CO began to desorb, indicating that the oxidation reaction of CO followed the Eley–Ridhel mechanism (Figure 6d) [66].
The oxygen storage capacity of CeO2, which is the ability to accommodate a large number of oxygen vacancies in reducing atmospheres (becoming CeO2−x) without structural destruction of the fluorite ceria lattice and could be oxidized back to CeO2 in oxidizing atmospheres, is widely acknowledged as one of the reasons for improving metal/CeO2 catalyst activity. Catalytic tests showed that the reaction rate of CO oxidation on Pt/CeO2 was enhanced by about two orders of magnitude compared to Pt/SiO2. Li et al. designed Au@Pt-CeO2 satellite nanostructure to achieve in situ SERS investigations of oxygen activation and reaction at Pt-CeO2 interfaces [67]. The in situ SERS spectra of CO oxidation on Au@Pt-CeO2 showed a Raman band at ~2090 and ~2110 cm−1, which were ascribed to CO adsorbed on Pt surfaces and Pt-CeO2 interfaces, respectively, as presented in Figure 7a. As temperature was raised to 50 °C, two new bands at 450 and 550 cm−1 were observed, which were ascribed to Ce-O and Pt-O, respectively. Further CO/O2 switch experiments showed that the Pt-O and Ce-O species formed even at room temperature, and both Pt-O and Ce-O species could react with CO effectively and be reproduced under O2 atmospheres, which indicated they were active species in CO oxidation. These results indicated that the formation of the Pt-CeO2 interface facilitated oxygen activation in the reaction of CO oxidation, which led to the formation of chemisorbed O on Pt and the reproduction of lattice oxygen of CeO2. As a result, catalytic performance was significantly improved. The DFT calculation results indicated that chemisorbed Pt-O was more active than lattice Ce-O, which made Pt-O and CO interaction more effective for reaction.

3.3. High-Temperature Electrochemistry

The application of high-temperature SERS in electrochemistry benefits the analysis of the electrochemical reaction at microlevel, providing abundant information concerning the reaction species, intermediates, and local structure on the electrode surface. The application of SERS nanostructures for in situ analysis of high-temperature electrochemical reactions, including molten carbonate electrolysis and solid oxide fuel cells, are summarized as follows.

3.3.1. Molten Carbonate Electrolysis

Regarding CO2 capture for molten salt and electrochemical transformation processes, it is of great importance to understand the solubility of CO2 in the melts since it affects the electrical conductivity of the electrolyte, the current efficiency of the electrolysis, and the electrode processes. Hu et al. employed Raman spectroscopy to investigate the solubility of CO2 in the molten Li2O-LiCl system with 4–8 wt% Li2O at 873–973 K [68]. When CO2 was dissolved in LiCl-Li2O melts, CO2 interacted with O2− to produce CO32−, and the three species were at equilibrium when the temperature was held constant. For quantitative analysis of Raman spectroscopy, 13.33 wt% Li2SO4 was used as the external standard. Characteristic bands of SO42− and CO32− were obtained at 988 and 1074 cm−1, respectively (Figure 8a). After baseline subtraction and bandfitting to the Lorentzian equation, the area of the two bands for each spectrum could be attained, which was further utilized to study the relationship between the conversion rate of Li2O to Li2O3 and the concentration of Li2O in the Li2O-LiCl system, along with the relationship of CO2 solubility and temperature in the Li2O-LiCl system. Experimental results indicated that the solubility of CO2 increases with Li2O concentration in the Li2O-LiCl system, and it reached a maximum when the Li2O concentration was 8 wt% at 923 K (Figure 8c). Conversion rate of Li2O to Li2O3 increased with the concentration of Li2O, and it reached the maximum conversion rate (94.19%) when the Li2O concentration was raised to 8 wt% (Figure 8b). In this study, the normal Raman spectrum was recorded. It was reported that CO32− was the only species with evident Raman signals.
By employing SERS nanostructure, more information other than that of the CO32− species has been revealed. Ji et al. [69] employed Au SERS nanostructure to study the in situ electrochemical reduction of molten carbonate. Electrolysis of carbon dioxide in molten carbonate to produce carbon and oxygen is an effective way to realize rational utilization of carbon dioxide [70]. In order to understand the electrochemical mechanism of carbonate molten salt and expand the application of SERS in high-temperature molten salt, Ji et al. prepared Au SERS nanostructure with a rough surface by an electrochemical redox cycle (ORC) process. After high-temperature treatment at 873 K, the enhancement factor of Au SERS nanostructure was maintained at 8.76 × 10². Additionally, the intermediate species of Li2CO3-K2CO3 molten salt on the Au SERS electrode were studied by in situ Raman and electrochemistry measurement. With the rough Au SERS nanostructure as the working electrode, an evident Raman band at 802 cm−1 due to the vibration of the peroxide ions appeared at the potential of −1.7 V (Figure 9a,b), which confirmed the existence of intermediate peroxide ions in the electrochemical reduction of carbonate. The reduction process can be further described as:
2 CO 3 2 + 2 e = 2 C + 3 O 2 2
O 2 2 + 2 e = 2 O 2
Takashi et al. employed in situ high-temperature SERS combined with electrochemistry measurement to conduct oxygen analysis in eutectic (Li + K) carbonate and Li single carbonate melts, respectively [71]. The in situ differential Raman spectra under various cathodic potentials were recorded on gold electrode at 923 and 1123 K in order to study the mechanism of oxygen reduction in Li single-carbonate melts and (Li + K) carbonate melts. At 923 K, it was found that when a small cathodic potential of −10 mV was applied, no obvious change was observed on the spectrum in all the frequency regions. As the applied cathodic potential became more negative, a Raman band at 1047 cm−1 emerged and the intensity increased significantly at −100 mV. This band was stated to be attributed to the superoxide or peroxide ion oxygen species formed during the electrochemical reactions (Figure 10a). At 1123 K, the in situ SERS measurement showed a distinct difference in the results between the Li single carbonate melts and (Li + K) carbonate melts; one extraordinary band at 735 cm−1 is evident in the spectrum of Li single carbonate melts but absent in that of (Li + K) carbonate melts (Figure 10b). It was therefore proposed by the authors that only one oxygen-related species was involved in the single carbonate melts, as superoxide species were considered to be reasonably absent in oxygen reduction in carbonate melts.

3.3.2. Solid Oxide Fuel Cells

Solid oxide fuel cells (SOFCs) operating at around 600–1000 °C have the advantages of high energy conversion efficiency, low pollutant emission, and great fuel flexibility [72,73,74,75]. However, the practical application of SOFC has been limited by the degradation issue, in which the adoption of high-temperature SERS could provide important information by monitoring the evolution of the electrode surfaces related to the formation of undesirable phases and species. For example, nickel-based anodes are susceptible to carbon deposition when hydrocarbons are used as fuel. Liu et al. used Ag@SiO2 as Raman amplifiers to study the deposition and removal of carbon on nickel-based anodes through in situ SERS [76]. Ag@SiO2 nanoparticle effectively increased the sensitivity toward trace analysis of carbon species, therefore making the tracking of initial carbon deposition feasible. The initiation of coking was found at the exposure of the first 20 mL propane, and carbon deposition was accumulated gradually with continuous exposure. The in situ SERS analysis also revealed that the introduction of CeO2 increased the resistance of coking on Ni due to surface modification. The in situ SERS study of the kinetics of the initial carbon deposition provided insights into the intrinsic coking tolerance of the material surface. Additionally, fast degradation of cathodes for SOFC due to poisoning by contaminants usually existing in air, such as CO2, is one of the major challenges for the development of high-performing cathodes for SOFC. Liu et al. reported a novel PrBa0.8Ca0.2Co2O5 + d (PBCC) cathode, which could achieve excellent CO2 tolerance with a degradation rate more than 95% lower compared to La0.6Sr0.4Co0.2Fe0.8O3 (LSCF) under realistic operating conditions [77]. In situ high-temperature SERS has been used to investigate the CO2 tolerance of PBCC cathodes. SERS spectrum of LSCF and PBCC were recorded at 500 °C under pure O2 and 10% CO2 balanced with O2. The peaks of carbonates at ~1060 cm−1 was observed in Raman spectra of LSCF in 10% CO2 balanced with O2, but not in the Raman spectra of PBCC in the same atmospheres, which implied the inactivity of PBCC toward CO2 in atmospheres containing high CO2 (Figure 11).
In situ SERS has also been used to study the sulfur poisoning on Ni-YSZ anodes during steam methane reforming (SMR). Natural gas naturally contains a low concentration of sulfur-containing compounds, which could result in sulfur poisoning of Ni-based anodes [78,79]. Owing to the very low concentration of sulfur in the fuel gas, the low detection limit of traditional characterization methods makes it impossible to obtain accurate surface information. Liu et al. employed in situ SERS to study the effect of sulfur poisoning on the catalytic activity of Ni YSZ anode during SMR [80]. According to the experimental observation and calculation results (Figure 12a,b), the SMR reaction was as follows:
CH 4 + C * + 2 H 2
C * + H 2 O CO bridge * + H 2
CO bridge * CO atop *
CO atop * CO
In situ SERS spectra of the nickel-based anode indicated that the dissociation adsorption of H2S and the cracking of CH4 have the same reaction site (Figure 13c,d). The enhancement of SERS provided strong evidence of sulfur accumulation at the Ni YSZ interface in a gas containing trace sulfur, with an obvious Raman peak at 470 cm−1 that belongs to the S-S bond.
In addition to the catalytic activity degradation of electrode, electrolyte material degradation due to the change in intrinsic material properties in high temperature is also a critical issue for SOFC degradation. Yttria-stabilized zirconia (YSZ) is widely used as the electrolyte material due to its high ionic conductivity and mechanical strength. However, much research has suggested that a cubic–tetragonal (c–t) phase transformation of YSZ could occur during long-time operation, leading to the deterioration of ionic conductivity and mechanical strength. Da et al. utilized in situ micro-Raman spectroscopy to monitor the c–t phase transformation during long-time operation [81]. In micro-Raman spectra, the progress of phase transformation was approximately evaluated by peak area ratio, AT/AC, which denotes the integration area of peaks attributed to the tetragonal and cubic phases, respectively. Raman spectra showed that the peak area attributed to the tetragonal phase gradually increased and the area ratio AT/AC increased from 0 to 0.95 through time (Figure 13a,c,e), which indicated the c–t phase transformation of the YSZ phase in the anode and corresponded to previously reported research. However, there are no in situ SERS studies on YSZ phase transformation under high temperature. Through in situ SERS analysis, deeper understanding of phase stability and structural evolution of SOFC electrolyte might be obtained.

4. Summary and Outlook

This paper reviews research progress on the design and application of SERS nanostructures in high-temperature processes. For structure design of high-temperature SERS, two types of strategies have been reported and categorized, which are substrate-specific and substrate-universal nanostructures. The substrate-specific nanostructures, prepared by layer deposition or entrapped metal NR, generally exhibit great thermal robustness with considerable SERS activity. However, this type of nanostructure could only apply to a minority of substrates due to the interference on the sample surfaces. The substrate-universal nanostructures, including core–shell nanostructures and embedded core–shell nanostructure, could apply to a wide range of substrates due to their “first assemble, then deposit” strategy. It is noted that when the thickness of protective layer is held constant, the substrate-universal nanostructures do not exhibit as great a thermal robustness as substrate-specific ones due to the higher surface energy of the former. This challenge is largely resolved by the introduction of a thermal-robust core in embedded core–shell nanostructure. For high-temperature applications, the thermal crystallization properties and local structural changes in the materials during heating treatment have been studied by employing specialized SERS nanostructures. For high-temperature catalytic reactions, the strength of in situ SERS analysis has also been demonstrated to a great extent. For example, with the assembling of “satellite” nanocatalysts around the SERS nanostructure, the reaction mechanism of CO oxidation is investigated by in situ monitoring the characteristic peak during the reaction process. In the field of high-temperature electrochemical reactions, thermally robust SERS nanostructures have been employed to identify the key intermediates in molten carbonate electrolysis and solid oxide fuel cells.
For the future development of high-temperature SERS, nanostructures with high thermal-robustness (above 500 °C), substrate universality, and sufficient sensitivity concurrently are still missing. To face this challenge, exploration of new design strategies or preparation approaches are needed as to ulteriorly improve the thermal stability and the enhancement activity of the nanostructures. Based on the above successful application of high-temperature SERS technology, the authors believe that further improvement in high-temperature SERS nanostructures can be extended to a wide range of physical and chemical processes, especially for in situ monitoring of key reaction species and dynamic evolution of local crystal structure during high-temperature processes. The broad application of high-temperature SERS can provide deep understanding of the fundamental concepts, which may play a vital role in the rational design and development of materials in semiconductors, heterogeneous catalysis, energy conversion and storage, and modern industries.

Author Contributions

Conceptualization, J.S., J.H. and J.W.; funding acquisition, J.S. and Y.T.; supervision, J.S. and Y.T.; visualization, J.W.; writing—original draft, J.H.; writing—review and editing, J.S. and Y.T. All authors have read and agreed to the published version of the manuscript.

Funding

This work was supported by Shenzhen Government’s Plan of Science and Technology (No. 20220804193203001, No. GXWD20220811164046002, No. JCYJ20190808111607078), the National Natural Science Foundation of China (No. 52072247), Guangdong Basic and Applied Basic Research Foundation (No. 2021A1515010735), Featured Innovation Project of Colleges and Universities of Guangdong Province (No. 2021KTSCX365), and Innovation Team Project of Guangdong Colleges and Universities (No. 2021KCXTD006).

Institutional Review Board Statement

Not applicable.

Informed Consent Statement

Not applicable.

Data Availability Statement

Not applicable.

Conflicts of Interest

The authors declare no conflict of interest.

References

  1. Camden, J.P.; Dieringer, J.A.; Zhao, J.; Van Duyne, R.P. Controlled Plasmonic Nanostructures for Surface-Enhanced Spectroscopy and Sensing. Acc. Chem. Res. 2008, 41, 1653–1661. [Google Scholar] [CrossRef] [PubMed] [Green Version]
  2. Brus, L. Noble Metal Nanocrystals: Plasmon Electron Transfer Photochemistry and Single-Molecule Raman Spectroscopy. Acc. Chem. Res. 2008, 41, 1742–1749. [Google Scholar] [CrossRef] [PubMed]
  3. Williams, C.T.; Tolia, A.A.; Chan, H.Y.H.; Takoudis, C.G.; Weaver, M.J. Surface-enhanced Raman spectroscopy as an in situ real-time probe of catalytic mechanisms at high gas pressures: The CO-NO reaction on platinum and palladium. J. Catal. 1996, 163, 63–76. [Google Scholar] [CrossRef]
  4. Williams, C.T.; Takoudis, C.G.; Weaver, M.J. Raman spectral evidence of reactive oxide formation during methanol oxidation on polycrystalline rhodium at high gas pressures. J. Catal. 1997, 170, 207–210. [Google Scholar] [CrossRef]
  5. Ren, B.; Li, X.Q.; She, C.X.; Wu, D.Y.; Tian, Z.Q. Surface Raman spectroscopy as a versatile technique to study methanol oxidation on rough Pt electrodes. Electrochim. Acta 2000, 46, 193–205. [Google Scholar] [CrossRef]
  6. Kneipp, K.; Wang, Y.; Kneipp, H.; Perelman, L.T.; Itzkan, I.; Dasari, R.R.; Feld, M.S. Single molecule detection using surface-enhanced Raman scattering (SERS). Phys. Rev. Lett. 1997, 78, 1667. [Google Scholar] [CrossRef] [Green Version]
  7. Campion, A.; Kambhampati, P. Surface-enhanced Raman scattering. Chem. Soc. Rev. 1998, 27, 241–250. [Google Scholar] [CrossRef]
  8. Tian, Z.Q.; Ren, B.; Li, J.F.; Yang, Z.L. Expanding generality of surface-enhanced Raman spectroscopy with borrowing SERS activity strategy. Chem. Commun. 2007, 34, 3514–3534. [Google Scholar] [CrossRef] [Green Version]
  9. Wu, Q.; Luo, C.X.; Yu, H.M.; Kong, G.Z.; Hu, J.W. Surface sol-gel growth of ultrathin SiO2 films on roughened Au electrodes: Extending borrowed SERS to a SERS inactive material. Chem. Phys. Lett. 2014, 608, 35–39. [Google Scholar] [CrossRef]
  10. Van Duyne, R.P.; Haushalter, J.P. Surface-enhanced Raman spectroscopy of adsorbates on semiconductor electrode surfaces: Tris (bipyridine) ruthenium (II) adsorbed on silver-modified n-gallium arsenide (100). J. Phys. Chem. 1983, 87, 2999–3003. [Google Scholar] [CrossRef]
  11. Van Duyne, R.P.; Haushalter, J.P.; Janik-Czachor, M.; Levinger, N. Surface-enhanced resonance Raman spectroscopy of adsorbates on semiconductor electrode surfaces. 2. In situ studies of transition metal (iron and ruthenium) complexes on silver/gallium arsenide and silver/silicon. J. Phys. Chem. 1985, 89, 4055–4061. [Google Scholar] [CrossRef]
  12. Rubim, J.C.; Kannen, G.; Schumacher, D.; Dunnwald, J.; Otto, A. Raman-spectra of silver coated graphite and glassy-carbon electrodes. Appl. Surf. Sci. 1989, 37, 233–243. [Google Scholar] [CrossRef]
  13. Mengoli, G.; Musiani, M.; Fleischman, M.; Mao, B.; Tian, Z. Enhanced Raman scattering from iron electrodes. Electrochim. Acta 1987, 32, 1239–1245. [Google Scholar] [CrossRef]
  14. Fleischmann, M.; Tian, Z.Q.; Li, L.J. Raman-spectroscopy of adsorbates on thin-film electrodes deposited on silver substrates. J. Electroanal. Chem. 1987, 217, 397–410. [Google Scholar] [CrossRef]
  15. Aravind, P.K.; Nitzan, A.; Metiu, H. The interaction between electromagnetic resonances and its role in spectroscopic studies of molecules adsorbed on colloidal particles or metal spheres. Surf. Sci. 1981, 110, 189–204. [Google Scholar] [CrossRef]
  16. Leung, L.W.H.; Weaver, M.J. Adsorption and electrooxidation of carbon monoxide on rhodium-and ruthenium-coated gold electrodes as probed by surface-enhanced Raman spectroscopy. Langmuir ACS J. Surf. Colloids 1988, 4, 1076–1083. [Google Scholar] [CrossRef]
  17. Leung, L.W.H.; Weaver, M.J. Extending surface-enhanced Raman spectroscopy to transition-metal surfaces: Carbon monoxide adsorption and electrooxidation on platinum-and palladium-coated gold electrodes. J. Am. Chem. Soc. 1987, 109, 5113–5119. [Google Scholar] [CrossRef]
  18. Weaver, M.J.; Zou, S.; Chan, H.Y.H. Peer reviewed: The new interfacial ubiquity of surface-enhanced Raman spectroscopy. Anal. Chem. 2000, 72, 38A–47A. [Google Scholar] [CrossRef] [Green Version]
  19. Zou, S.Z.; Williams, C.T.; Chen, E.K.Y.; Weaver, M.J. Probing molecular vibrations at catalytically significant interfaces: A new ubiquity of surface-enhanced Raman scattering. J. Am. Chem. Soc. 1998, 120, 3811–3812. [Google Scholar] [CrossRef]
  20. Ren, B.; Picardi, G.; Pettinger, B.; Schuster, R.; Ertl, G. Tip-enhanced Raman spectroscopy of benzenethiol adsorbed on Au and Pt single-crystal surfaces. Angew. Chem.-Int. Edit. 2005, 44, 139–142. [Google Scholar] [CrossRef]
  21. Stöckle, R.M.; Suh, Y.D.; Deckert, V.; Zenobi, R. Nanoscale chemical analysis by tip-enhanced Raman spectroscopy. Chem. Phys. Lett. 2000, 318, 131–136. [Google Scholar] [CrossRef]
  22. Pettinger, B.; Ren, B.; Picardi, G.; Schuster, R.; Ertl, G. Nanoscale probing of adsorbed species by tip-enhanced Raman spectroscopy. Phys. Rev. Lett. 2004, 92, 096101. [Google Scholar] [CrossRef] [PubMed] [Green Version]
  23. Wang, X.; Liu, Z.; Zhuang, M.-D.; Zhang, H.-M.; Wang, X.; Xie, Z.-X.; Wu, D.-Y.; Ren, B.; Tian, Z.-Q. Tip-enhanced Raman spectroscopy for investigating adsorbed species on a single-crystal surface using electrochemically prepared Au tips. Appl. Phys. Lett. 2007, 91, 101105. [Google Scholar] [CrossRef] [Green Version]
  24. Li, J.F.; Huang, Y.F.; Ding, Y.; Yang, Z.L.; Li, S.B.; Zhou, X.S.; Fan, F.R.; Zhang, W.; Zhou, Z.Y.; Wu, D.Y.; et al. Shell-isolated nanoparticle-enhanced Raman spectroscopy. Nature 2010, 464, 392–395. [Google Scholar] [CrossRef] [PubMed]
  25. Wang, Y.H.; Zheng, S.S.; Yang, W.M.; Zhou, R.Y.; He, Q.F.; Radjenovic, P.; Dong, J.C.; Li, S.N.; Zheng, J.X.; Yang, Z.L.; et al. In situ Raman spectroscopy reveals the structure and dissociation of interfacial water. Nature 2021, 600, 81–85. [Google Scholar] [CrossRef] [PubMed]
  26. Zhang, J.; Zhang, X.-G.; Dong, J.-C.; Radjenovic, P.M.; Young, D.J.; Yao, J.-L.; Yuan, Y.-X.; Tian, Z.-Q.; Li, J.-F. Real-Time Monitoring of Surface Effects on the Oxygen Reduction Reaction Mechanism for Aprotic Na–O2 Batteries. J. Am. Chem. Soc. 2021, 143, 20049–20054. [Google Scholar] [CrossRef]
  27. Pettinger, B.; Schambach, P.; Villagomez, C.J.; Scott, N. Tip-Enhanced Raman Spectroscopy: Near-Fields Acting on a Few Molecules. Annu. Rev. Phys. Chem. 2012, 63, 379–399. [Google Scholar] [CrossRef] [Green Version]
  28. Langer, J.; Jimenez de Aberasturi, D.; Aizpurua, J.; Alvarez-Puebla, R.A.; Auguié, B.; Baumberg, J.J.; Bazan, G.C.; Bell, S.E.; Boisen, A.; Brolo, A.G. Present and future of surface-enhanced Raman scattering. ACS Nano 2019, 14, 28–117. [Google Scholar] [CrossRef] [Green Version]
  29. Nie, S.; Emory, S.R. Probing single molecules and single nanoparticles by surface-enhanced Raman scattering. Science 1997, 275, 1102–1106. [Google Scholar] [CrossRef]
  30. Wang, Y.Q.; Yan, B.; Chen, L.X. SERS Tags: Novel Optical Nanoprobes for Bioanalysis. Chem. Rev. 2013, 113, 1391–1428. [Google Scholar] [CrossRef]
  31. Hakonen, A.; Rindzevicius, T.; Schmidt, M.S.; Andersson, P.O.; Juhlin, L.; Svedendahl, M.; Boisen, A.; Kall, M. Detection of nerve gases using surface-enhanced Raman scattering substrates with high droplet adhesion. Nanoscale 2016, 8, 1305–1308. [Google Scholar] [CrossRef] [PubMed] [Green Version]
  32. Garg, P.; Dhara, S. Single molecule detection using SERS study in PVP functionalized Ag nanoparticles. In Proceedings of the 57th DAE Solid State Physics Symposium, Indian Institute of Technology, Bombay, India, 3–7 December 2012; pp. 206–207. [Google Scholar]
  33. Li, J.F.; Zhang, Y.J.; Rudnev, A.V.; Anema, J.R.; Li, S.B.; Hong, W.J.; Rajapandiyan, P.; Lipkowski, J.; Wandlowski, T.; Tian, Z.Q. Electrochemical Shell-Isolated Nanoparticle-Enhanced Raman Spectroscopy: Correlating Structural Information and Adsorption Processes of Pyridine at the Au(hkl) Single Crystal/Solution Interface. J. Am. Chem. Soc. 2015, 137, 2400–2408. [Google Scholar] [CrossRef] [PubMed]
  34. Wu, D.Y.; Ren, B.; Jiang, Y.X.; Xu, X.; Tian, Z.Q. Density functional study and normal-mode analysis of the bindings and vibrational frequency shifts of the pyridine-M (M = Cu, Ag, Au, Cu+, Ag+, Au+, and Pt) complexes. J. Phys. Chem. A 2002, 106, 9042–9052. [Google Scholar] [CrossRef]
  35. Song, C.Y.; Sun, Y.Z.; Li, J.X.; Dong, C.; Zhang, J.J.; Jiang, X.Y.; Wang, L.H. Silver-mediated temperature-controlled selective deposition of Pt on hexoctahedral Au nanoparticles and the high performance of Au@AgPt NPs in catalysis and SERS. Nanoscale 2019, 11, 18881–18893. [Google Scholar] [CrossRef]
  36. Liu, J.B.; Long, L.; Zhang, Y.S.; Wang, Y.P.; Liu, F.S.; Xu, W.Y.; Zong, M.J.; Ma, L.; Liu, W.Q.; Zhang, H.; et al. Optical properties of Au-core Pt-shell nanorods studied using FDTD simulations. Front. Phys. 2016, 11, 118501. [Google Scholar] [CrossRef]
  37. Li, X.X.; Blinn, K.; Chen, D.C.; Liu, M.L. In situ and surface-enhanced Raman spectroscopy study of electrode materials in solid oxide fuel cells. Electrochem. Energy Rev. 2018, 1, 433–459. [Google Scholar] [CrossRef]
  38. Alarcon, A.; Guilera, J.; Soto, R.; Andreu, T. Higher tolerance to sulfur poisoning in CO2 methanation by the presence of CeO2. Appl. Catal. B-Environ. 2020, 263, 118346. [Google Scholar] [CrossRef]
  39. Zhu, H.; Yang, C.; Li, Q.; Ren, Y.; Neuefeind, J.C.; Gu, L.; Liu, H.B.; Fan, L.L.; Chen, J.; Deng, J.X.; et al. Charge transfer drives anomalous phase transition in ceria. Nat. Commun. 2018, 9, 5063. [Google Scholar] [CrossRef] [PubMed] [Green Version]
  40. Alarifi, H.; Hu, A.M.; Yavuz, M.; Zhou, Y.N. Silver Nanoparticle Paste for Low-Temperature Bonding of Copper. J. Electron. Mater. 2011, 40, 1394–1402. [Google Scholar] [CrossRef]
  41. Jiang, Q.; Zhang, S.H.; Li, J.C. Grain size-dependent diffusion activation energy in nanomaterials. Solid State Commun. 2004, 130, 581–584. [Google Scholar] [CrossRef]
  42. Bao, L.L.; Mahurin, S.M.; Dai, S. Controlled layer-by-layer formation of ultrathin TiO2 on silver island films via a surface sol-gel method for surface-enhanced Raman scattering measurement. Anal. Chem. 2004, 76, 4531–4536. [Google Scholar] [CrossRef] [PubMed]
  43. Li, X.X.; Lee, J.P.; Blinn, K.S.; Chen, D.C.; Yoo, S.; Kang, B.; Bottomley, L.A.; El-Sayed, M.A.; Park, S.; Liu, M.L. High-temperature surface enhanced Raman spectroscopy for in situ study of solid oxide fuel cell materials. Energy Environ. Sci. 2014, 7, 306–310. [Google Scholar] [CrossRef] [Green Version]
  44. Pettinger, B.; Bao, X.H.; Wilcock, I.; Muhler, M.; Schlogl, R.; Ertl, G. Thermal-decomposition of silver-oxide monitored by raman-spectroscopy—From ago units to oxygen-atoms chemisorbed on the silver surface. Angew. Chem. Int. Ed. Engl. 1994, 33, 85–86. [Google Scholar] [CrossRef]
  45. Mahurin, S.M.; John, J.; Sepaniak, M.J.; Dai, S. A Reusable Surface-Enhanced Raman Scattering (SERS) Substrate Prepared by Atomic Layer Deposition of Alumina on a Multi-Layer Gold and Silver Film. Appl. Spectrosc. 2011, 65, 417–422. [Google Scholar] [CrossRef] [PubMed]
  46. John, J.F.; Mahurin, S.; Dai, S.; Sepaniak, M.J. Use of atomic layer deposition to improve the stability of silver substrates for in situ, high temperature SERS measurements. J. Raman Spectrosc. 2010, 41, 4–11. [Google Scholar] [CrossRef]
  47. Formo, E.V.; Mahurin, S.M.; Dai, S. Robust SERS Substrates Generated by Coupling a Bottom-Up Approach and Atomic Layer Deposition. Acs Appl. Mater. Interfaces 2010, 2, 1987–1991. [Google Scholar] [CrossRef]
  48. Liu, M.; Xiang, R.; Lee, Y.; Otsuka, K.; Ho, Y.L.; Inoue, T.; Chiashi, S.; Delaunay, J.J.; Maruyama, S. Fabrication, characterization, and high temperature surface enhanced Raman spectroscopic performance of SiO2 coated silver particles. Nanoscale 2018, 10, 5449–5456. [Google Scholar] [CrossRef]
  49. Liu, K.; Ohodnicki, P.R.; Kong, X.Q.; Lee, S.S.; Du, H. Plasmonic Au nanorods stabilized within anodic aluminum oxide pore channels against high-temperature treatment. Nanotechnology 2019, 30, 405704. [Google Scholar] [CrossRef]
  50. Petrova, H.; Juste, J.P.; Pastoriza-Santos, I.; Hartland, G.V.; Liz-Marzan, L.M.; Mulvaney, P. On the temperature stability of gold nanorods: Comparison between thermal and ultrafast laser-induced heating. Phys. Chem. Chem. Phys. 2006, 8, 814–821. [Google Scholar] [CrossRef]
  51. Hartman, T.; Weckhuysen, B.M. Thermally Stable TiO2- and SiO2-Shell-Isolated Au Nanoparticles for In Situ Plasmon-Enhanced Raman Spectroscopy of Hydrogenation Catalysts. Chem. -A Eur. J. 2018, 24, 3733–3741. [Google Scholar] [CrossRef]
  52. Allen, G.; Bayles, R.; Gile, W.; Jesser, W. Small particle melting of pure metals. Thin Solid Film. 1986, 144, 297–308. [Google Scholar] [CrossRef]
  53. Sun, C.Q.; Wang, Y.; Tay, B.K.; Li, S.; Huang, H.; Zhang, Y.B. Correlation between the melting point of a nanosolid and the cohesive energy of a surface atom. J. Phys. Chem. B 2002, 106, 10701–10705. [Google Scholar] [CrossRef]
  54. Kim, E.H.; Lee, B.J. Size dependency of melting point of crystalline nano particles and nano wires: A thermodynamic modeling. Met. Mater. Int. 2009, 15, 531–537. [Google Scholar] [CrossRef]
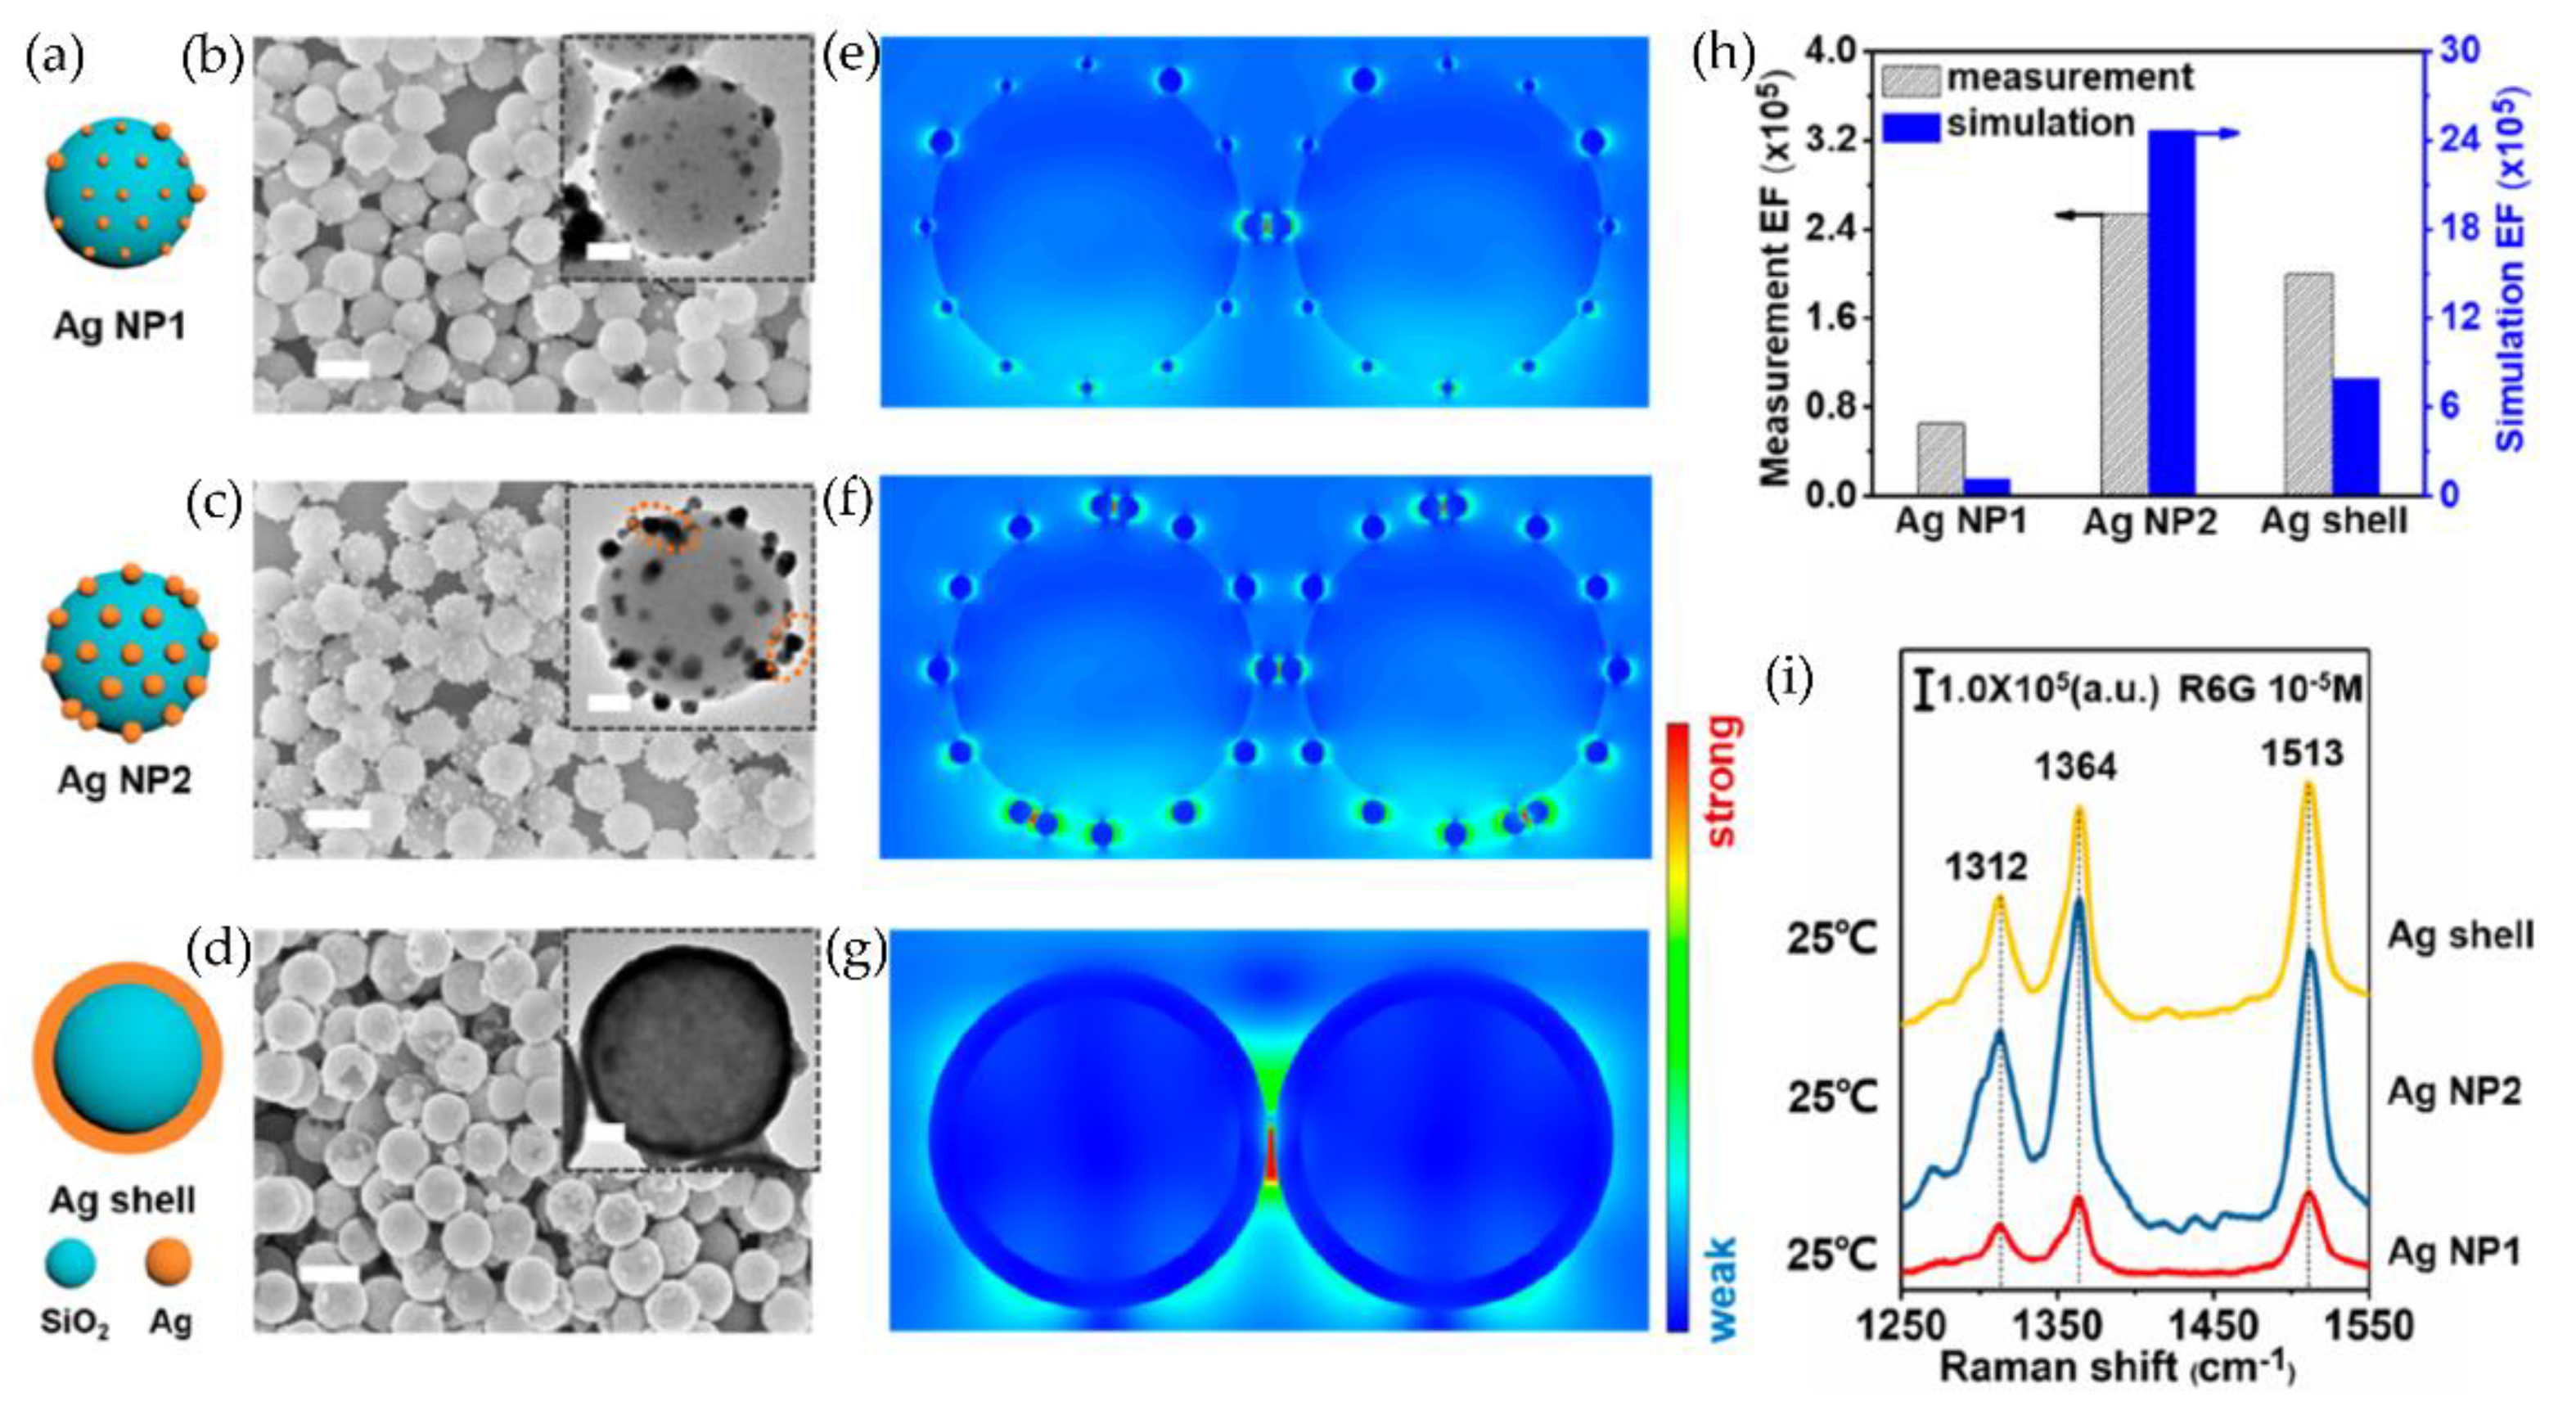
  55. Liu, Y.; Lu, J.M.; Tao, Y.K.; Li, N.; Yang, M.T.; Shao, J. Ag-Embedded Silica Core-Shell Nanospheres for Operando Surface Enhanced Raman Spectroscopy of High-Temperature Processes. Anal. Chem. 2020, 92, 9566–9573. [Google Scholar] [CrossRef] [PubMed]
  56. Sobol, A.; Shukshin, V.; Lukanin, V.; Moiseeva, L. High-temperature Raman scattering study of the Li2O–B2O3–MoO3 system: I. Detailed comparison of the structures of molten lithium and potassium molybdates. Inorg. Mater. 2018, 54, 984–989. [Google Scholar] [CrossRef]
  57. Qiu, H.; Wang, A.; You, J.; Liu, X.; Chen, H.; Yin, S. High temperature Raman spectra and structure character study of BSO crystal. Guang Pu Xue Yu Guang Pu Fen Xi= Guang Pu 2005, 25, 222–225. [Google Scholar] [PubMed]
  58. Wang, L.-Y.; Chen, L.-L.; Huang, X.-L.; Wang, M.; Zhu, X.-H.; Zou, J.-H. 24.4: A Linear High-Tg Arylphosphine Oxide-Triazine Conjugate as a Doped Electron-Transport Material for Stable Phosphorescent OLEDs. Proc. SID Symp. Dig. Tech. Pap. 2021, 52, 321–324. [Google Scholar] [CrossRef]
  59. Tang, C.W.; VanSlyke, S.A. Organic electroluminescent diodes. Appl. Phys. Lett. 1987, 51, 913–915. [Google Scholar] [CrossRef]
  60. Muraki, N. In Situ Monitoring of Thermal Crystallization of Ultrathin Tris(8-Hydroxyquinoline) Aluminum Films Using Surface-Enhanced Raman Scattering. Appl. Spectrosc. 2014, 68, 39–43. [Google Scholar] [CrossRef]
  61. Formo, E.V.; Wu, Z.L.; Mahurin, S.M.; Dai, S. In Situ High Temperature Surface Enhanced Raman Spectroscopy for the Study of Interface Phenomena: Probing a Solid Acid on Alumina. J. Phys. Chem. C 2011, 115, 9068–9073. [Google Scholar] [CrossRef]
  62. Schilling, C.; Hofmann, A.; Hess, C.; Ganduglia-Pirovano, M.V. Raman Spectra of Polycrystalline CeO2: A Density Functional Theory Study. J. Phys. Chem. C 2017, 121, 20834–20849. [Google Scholar] [CrossRef]
  63. Kondarides, D.I.; Papatheodorou, G.N.; Vayenas, C.G.; Verykios, X.E. In-situ high-temperature sers study of oxygen adsorbed on AG-support and electrochemical promotion effects. Ber. Der Bunsen-Ges. -Phys. Chem. Chem. Phys. 1993, 97, 709–720. [Google Scholar] [CrossRef]
  64. Zhang, H.; Wang, C.; Sun, H.L.; Fu, G.; Chen, S.; Zhang, Y.J.; Chen, B.H.; Anema, J.R.; Yang, Z.L.; Li, J.F.; et al. In situ dynamic tracking of heterogeneous nanocatalytic processes by shell-isolated nanoparticle-enhanced Raman spectroscopy. Nat. Commun. 2017, 8, 15447. [Google Scholar] [CrossRef] [PubMed] [Green Version]
  65. Li, J.F.; Tian, X.D.; Li, S.B.; Anema, J.R.; Yang, Z.L.; Ding, Y.; Wu, Y.F.; Zeng, Y.M.; Chen, Q.Z.; Ren, B. Surface analysis using shell-isolated nanoparticle-enhanced Raman spectroscopy. Nat. Protoc. 2013, 8, 52–65. [Google Scholar] [CrossRef] [PubMed]
  66. Saeed, M.; Adeel, S.; Ilyas, M.; Shahzad, M.A.; Usman, M.; Ehsan-ul, H.; Hamayun, M. Oxidative degradation of Methyl Orange catalyzed by lab prepared nickel hydroxide in aqueous medium. Desalination Water Treat. 2016, 57, 12804–12813. [Google Scholar] [CrossRef]
  67. Wei, D.-Y.; Yue, M.-F.; Qin, S.-N.; Zhang, S.; Wu, Y.-F.; Xu, G.-Y.; Zhang, H.; Tian, Z.-Q.; Li, J.-F. In situ Raman observation of oxygen activation and reaction at platinum–ceria interfaces during CO oxidation. J. Am. Chem. Soc. 2021, 143, 15635–15643. [Google Scholar] [CrossRef]
  68. Hu, X.W.; Deng, W.T.; Shi, Z.N.; Wang, Z.X.; Gao, B.L.; Wang, Z.W. Solubility of CO2 in Molten Li2O-LiCl System: A Raman Spectroscopy Study. J. Chem. Eng. Data 2019, 64, 202–210. [Google Scholar] [CrossRef]
  69. Yu, J.Y.; Liu, C.Y.; Hu, X.W.; Yuan, T.; Zhang, Y.F.; Wang, Z.W.; Ji, W.R. Preparation of a Au SERS substrate and its application in the in-situ Raman spectroelectrochemistry study of Li2CO3-K2CO3 molten salt. Int. J. Electrochem. Sci. 2021, 16, 211131. [Google Scholar] [CrossRef]
  70. Appleby, A.; Nicholson, S. Reduction of oxygen in alkali carbonate melts. J. Electroanal. Chem. Interfacial Electrochem. 1977, 83, 309–328. [Google Scholar] [CrossRef]
  71. Itoh, T.; Maeda, T.; Kasuya, A. In situ surface-enhanced Raman scattering spectroelectrochemistry of oxygen species. Faraday Discuss. 2006, 132, 95–109. [Google Scholar] [CrossRef]
  72. Abdalla, A.M.; Hossain, S.; Azad, A.T.; Petra, P.M.I.; Begum, F.; Eriksson, S.G.; Azad, A.K. Nanomaterials for solid oxide fuel cells: A review. Renew. Sustain. Energy Rev. 2018, 82, 353–368. [Google Scholar] [CrossRef]
  73. Fan, L.D.; Zhu, B.; Su, P.C.; He, C.X. Nanomaterials and technologies for low temperature solid oxide fuel cells: Recent advances, challenges and opportunities. Nano Energy 2018, 45, 148–176. [Google Scholar] [CrossRef]
  74. Hossain, S.; Abdalla, A.M.; Jamain, S.N.B.; Zaini, J.H.; Azad, A.K. A review on proton conducting electrolytes for clean energy and intermediate temperature-solid oxide fuel cells. Renew. Sustain. Energy Rev. 2017, 79, 750–764. [Google Scholar] [CrossRef]
  75. Bao, C.; Wang, Y.; Feng, D.L.; Jiang, Z.Y.; Zhang, X.X. Macroscopic modeling of solid oxide fuel cell (SOFC) and model-based control of SOFC and gas turbine hybrid system. Prog. Energy Combust. Sci. 2018, 66, 83–140. [Google Scholar] [CrossRef]
  76. Li, X.X.; Liu, M.F.; Lee, J.P.; Ding, D.; Bottomley, L.A.; Park, S.; Liu, M.L. An operando surface enhanced Raman spectroscopy (SERS) study of carbon deposition on SOFC anodes. Phys. Chem. Chem. Phys. 2015, 17, 21112–21119. [Google Scholar] [CrossRef]
  77. Chen, Y.; Yoo, S.; Choi, Y.; Kim, J.H.; Ding, Y.; Pei, K.; Murphy, R.; Zhang, Y.; Zhao, B.; Zhang, W. A highly active, CO2-tolerant electrode for the oxygen reduction reaction. Energy Environ. Sci. 2018, 11, 2458–2466. [Google Scholar] [CrossRef]
  78. Cheng, Z.; Wang, J.H.; Choi, Y.M.; Yang, L.; Lin, M.C.; Liu, M.L. From Ni-YSZ to sulfur-tolerant anode materials for SOFCs: Electrochemical behavior, in situ characterization, modeling, and future perspectives. Energy Environ. Sci. 2011, 4, 4380–4409. [Google Scholar] [CrossRef]
  79. Chen, H.L.; Wang, F.; Wang, W.; Chen, D.F.; Li, S.D.; Shao, Z.P. H2S poisoning effect and ways to improve sulfur tolerance of nickel cermet anodes operating on carbonaceous fuels. Appl. Energy 2016, 179, 765–777. [Google Scholar] [CrossRef]
  80. Kim, J.H.; Liu, M.F.; Chen, Y.; Murphy, R.; Choi, Y.; Liu, Y.; Liu, M.L. Understanding the Impact of Sulfur Poisoning on the Methane-Reforming Activity of a Solid Oxide Fuel Cell Anode. ACS Catal. 2021, 11, 13556–13566. [Google Scholar] [CrossRef]
  81. Da, Y.L.; Xiao, Y.; Zhong, Z.; Pan, Z.H.; Jiao, Z.J. Predictions on conductivity and mechanical property evolutions of yttria-stabilized zirconia in solid oxide fuel cells based on phase-field modeling of cubic-tetragonal phase transformation. J. Eur. Ceram. Soc. 2022, 42, 3489–3499. [Google Scholar] [CrossRef]
Figure 1. Classes of nanostructures designed for high-temperature SERS analysis.
Chemosensors 11 00021 g001
Figure 2. Microstructure and SERS effect of Ag embedding in ESCNs. (a) Illustration of three types of Ag embedding over the silica core: separated Ag nanoparticles (Ag NP1), self-assembled Ag nanoparticles (Ag NP2), and continuous Ag layer (Ag shell). (bd) SEM images of Ag embedding inserted with the TEM images. (eg) 3D-FDTD calculation of the Raman enhancement distribution around Ag embedding. (h) Comparison of the enhancement factor (EF) calculated from the measured Raman signal (gray) and the simulated electromagnetic field (blue). (i) Raman spectra of the 10−5 M R6G solution recorded on Ag embedding. Scale bars, 500 nm. Scale bars for the insets, 100 nm. Reproduced from reference [55]. Copyright 2020 American Chemical Society.
Chemosensors 11 00021 g002
Figure 3. In situ Raman/SERS study of the effect of heating PTA. (a) PTA powder on Si substrate; (b) thin layer of PTA on alumina-coated Ag NWs SERS substrate at room temperature (black) and heated to 400 °C in hydrogen (red) or oxygen (blue); in situ effect of heating PTA on Al2O3-coated Ag NWs substrate in an oxidative environment. (c) Heating in an oxygen atmosphere with the SERS spectra taken at room conditions (black), 100 °C (red), 200 °C (green), 300 °C (blue), and 400 °C (gray). (d) Close-up of SERS spectra taken at 400 °C (gray) and 300 °C (blue). Reproduced from reference [61]. Copyright 2011 American Chemical Society.
Chemosensors 11 00021 g003
Figure 4. High-temperature SERS analysis using ECSNs under operando conditions. (a) Illustration of the high-temperature Raman testing system with ECSNs. (b) In situ tracking of lattice dynamics on CeO2 with variation in gas atmospheres. Reproduced from reference [55]. Copyright 2020 American Chemical Society.
Chemosensors 11 00021 g004
Figure 5. Simultaneous SERS and mass spectrometric measurements obtained during reaction of 100 cm3 min−1 of 50% NO and 50% CO on Pt: (a) temperature-dependent SER spectra in the low-frequency region obtained with 20 s integration time; (b) temperature-dependent SER spectra in the high-frequency region obtained with 60 s integration time. Reproduced from reference [3]. Copyright 1996 Journal of Elsevier.
Chemosensors 11 00021 g005
Figure 6. A SHINERS-satellite study and DFT calculations for CO oxidation over Pd nanocatalysts. (a,b) SHINERS-satellite spectra for CO oxidation over Pd nanocatalysts with different gas ratios in the feed: (a) CO/O2 = 1/10, (b) CO/O2 = 1/1. (c) Catalytic performance for CO oxidation over Pd nanocatalysts under different feed conditions. (d) Mechanisms for CO oxidation over a PdO(100)-O surface. Reproduced from reference [64]. Copyright 2017 Springer Nature.
Chemosensors 11 00021 g006
Figure 7. (a) In situ SERS spectra of CO oxidation over Au@Pt-CeO2. (b) In situ SERS spectra of Au@Pt-CeO2 when the reaction gas is changed from CO + O2 to O2. (c) In situ SERS spectra of Au@Pt-CeO2 in CO/O2 switch experiments at 50 °C. (d) DFT-calculated Gibbs free energies of CO oxidation steps at Pt-CeO2 interfaces: I, Pt-CeOx surface with an oxygen defect; II, oxygen a-sorption at the defect; III, oxygen dissociation; IV, CO adsorption; V, CO + Pt-O reaction; VI, CO2 desorption; VII, CO adsorption; VIII, CO + Ce-O reaction. Red is O, blue is Pt, yellow is Ce, and gray is C. Reproduced from reference [67]. Copyright 2021 American Chemical Society.
Chemosensors 11 00021 g007
Figure 8. (a) Raman spectra of Li2O-LiCl melts with CO2 aeration at 923 K under 101.3 kPa with Li2SO4 of 13.33 wt% used as the external standard for different time lengths of aerating CO2; (b) Raman spectra of Li2O-LiCl melts with CO2 aeration at 873–973 K under 101.3 kPa with Li2SO4 of 13.33 wt% used as the external standard; (c) relationship between the conversion rate of Li2O to Li2CO3 and the composition of the melts; (d) relationship between solubility of CO2 in LiCl-Li2O and temperature. Reproduced from reference [68]. Copyright 2019 American Chemical Society.
Chemosensors 11 00021 g008
Figure 9. (a) Raman spectrum of the deposit obtained from Li2CO3-K2CO3 melt at −1.8 V (vs. Pt) and 873 K; (b) in situ SERS recorded on various electrodes in Li2CO3-K2CO3 molten salt during the constant potential electrolysis process at 873 K. Reproduced from reference [69]. Copyright 2021 ESG.
Chemosensors 11 00021 g009
Figure 10. (a) In situ differential Raman spectra for a gold electrode in (Li-K) CO3 at 923 K. (b) In situ differential Raman spectra for a gold electrode in Li2CO3 single melt at 1123 K. Reproduced from reference [71]. Copyright 2006 Faraday Division, Royal Society of Chemistry.
Chemosensors 11 00021 g010
Figure 11. In situ SERS spectra of LSCF and PBCC thin films at 500 °C in an atmosphere of pure O2 or O2 with 10% CO2. Reproduced from reference [77]. Copyright 2018 RSC Publishing.
Chemosensors 11 00021 g011
Figure 12. (a) Schematic illustration of the hypothesized steam methane-reforming mechanisms proceeding on the Ni-YSZ electrode when desulfurized natural gas is used as a fuel; (b) time-resolved in situ SERS analysis of a clean Ni-YSZ electrode upon exposure to wet CH4 at 500 °C; (c) schematic illustration of the sulfur poisoning mechanism proceeding on the Ni-YSZ electrode when sulfur-contaminated CH4 is used as a fuel; (d) Ni-YSZ electrode upon exposure to 100 ppm H2S in H2 followed by steam-reforming of CH4 at 500 °C. Reproduced from reference [80]. Copyright 2021 American Chemical Society.
Chemosensors 11 00021 g012
Figure 13. (a,c,e) Point micro-Raman spectra measured in the anode of three samples, and (b,d,f) the mapping of the AT/AC values calculated from the micro-Raman spectra measured at an array of 20 points in the electrolyte of three samples: (a,b) freshly reduced sample, samples (c,d) after 8 kh operation, and (e,f) after 17 kh operation. Reproduced from reference [81]. Copyright 2022 Elsevier.
Chemosensors 11 00021 g013
Disclaimer/Publisher’s Note: The statements, opinions and data contained in all publications are solely those of the individual author(s) and contributor(s) and not of MDPI and/or the editor(s). MDPI and/or the editor(s) disclaim responsibility for any injury to people or property resulting from any ideas, methods, instructions or products referred to in the content.

