Article

Ultrasensitive Electrochemical Sensor Based on SnO2 Anchored 3D Porous Reduced Graphene Oxide Nanostructure Produced via Sustainable Green Protocol for Subnanomolar Determination of Anti-Diabetic Drug, Repaglinide

by
Ayyapayya Mathad
1,
Karuna Korgaonkar
1,
Seetharamappa Jaldappagari
1,* and
Shankara Kalanur
2,*
1
Department of Chemistry, Karnatak University, Dharwad 580003, India
2
Hydrogen Research Institute (IRH), Université du Québec à Trois-Rivière, 3351 Boulevard des Forges, Trois-Rivières, QC G9A 5H7, Canada
*
Authors to whom correspondence should be addressed.
Chemosensors 2023, 11(1), 50; https://doi.org/10.3390/chemosensors11010050
Submission received: 5 December 2022 / Revised: 29 December 2022 / Accepted: 3 January 2023 / Published: 6 January 2023
(This article belongs to the Section Electrochemical Devices and Sensors)

Abstract

:
Herein, we have reported on a simple, environmentally friendly, and ultra-sensitive electrode material, SnO2@p-rGO, used in a clean sustainable manner for rapid electrochemical determination of an anti-diabetic agent, repaglinide (RPG). Three-dimensional porous reduced graphene oxide nanostructure (p-rGO) was prepared via a low-temperature solution combustion method employing glycine. The aqueous extract of agricultural waste “cotton boll peel” served as stabilizing and reducing agents for the synthesis of SnO2 nanoparticles. The structural and morphological characterization was carried out by XRD, Raman, SEM, EDX, FTIR, absorption, and TGA. The oxidation process of RPG was realized under adsorption controlled with the involvement of two protons and electrons. The sensor displayed a wider linearity between the concentration of RPG and oxidation peak current in the ranges of 1.99 × 10⁻⁸–1.45 × 10⁻⁵ M and 4.99 × 10⁻⁸–1.83 × 10⁻⁵ M for square-wave voltammetric and differential pulse voltammetric methods, respectively. The lower limit of detection value of 0.85 × 10⁻⁹ M was realized with the SWV method. The proposed sensor was applied for the quantification of RPG in fortified urine samples and pharmaceutical formulations. Furthermore, the sensor demonstrated reproducibility, long-term stability, and selectivity in the presence of metformin and other interferents, which made the proposed sensor promising and superior for monitoring RPG.

1. Introduction

Type 2 diabetes mellitus is the most prevalent metabolic ailment worldwide, affecting nearly 8% of young people and growing explosively over the last few years, with predictions that by 2030, there would be around 400 million cases [1]. The disorder results from increasing β cell malfunction in the presence of chronic insulin resistance that causes a progressive deterioration in plasma glucose homeostasis. Repaglinide (RPG) (Scheme 1), a novel rapid-acting meglitinide analog, is an oral hypoglycemic drug from the class of carbamoylmethylbenzoic acids. It is safe and efficacious. Therefore, it is widely prescribed to control postprandial glucose excursion in type 2 diabetic patients. It is particularly beneficial when metformin cannot be administered owing to side effects and fails to control blood glucose levels effectively or blood glucose levels cannot be managed by exercise or diet alone. Although the insulinotropic action of RPG is partly comparable to sulfonylureas, it displays distinct pharmacological properties in terms of structure, binding profile, mechanisms of excretion, and duration of action [2]. REP decreases hyperglycemia by stimulating the pancreas by depolarization of β cells [3] via ATP-sensitive potassium channel blockage at the plasma membrane, resulting in Ca2+ influx through voltage-dependent channels, which stimulates Ca2+ dependent exocytosis of insulin-containing granules and subsequent release of insulin [4]. It shows a fast onset of dose-dependent blood-glucose-lowering effect after rapid and complete absorption from the gastrointestinal tract [5], and subsequently, the drug is removed rapidly through biliary excretion without accumulation in the plasma after multiple doses. Hence, RPG is well tolerated in type 2 diabetic patients who are elderly patients and patients with renal or hepatic impairment. Given the biological importance of RPG, the monitoring of it in biological fluids is crucial. Hence, efforts have been made to develop low-cost sensors for clinical use.
For the determination of RPG in dosage forms, raw material, and plasma, a number of analytical methods have been reported. These include HPLC [6,7,8], HPLC integrated with electrochemical detection [9], ultra-violet [10], liquid chromatography–tandem mass spectrometric (LC-MS/MS) [11,12], reversed-phase thin-layer chromatographic (RPTLC) [13], spectrophotometric [14], and reversed-phase-HPLC [15] methods.
However, most of the reported methods involve complicated and costly instruments, lengthy pretreatment processes, and laborious sample preparations. In addition, they require trained technicians. The regular analysis of RPG thus demands a straightforward, sensitive, and inexpensive method. Therefore, electrochemical sensing methods are better alternatives. They have received more and more attention because they are simple, sensitive, economical, and rapid for the determination of traces of electroactive analytes [16,17,18,19,20]. However, the reported electrochemical methods [21,22] for the assay of RPG have low sensitivity or require more time for the fabrication of electrochemical sensors. In view of developing a simple, ultrasensitive, and eco-friendly sensor utilizing inexpensive environmentally friendly reagents, we have fabricated SnO2@p-rGO on GCE for the assay of RPG at trace level.
Graphene is a single sheet of an sp2 hybridized two-dimensional form of carbon allotrope. As a first created 2D material, it became a cornerstone in the field of materials science research. This was motivated by its exquisite and unique physical and chemical properties, leading to a wide spectrum of applications. It has been explored in the areas of photonics, electronics, sensors, catalysis, energy generation and storage, electrosensing, metrology, environment, and bioapplications [23,24]. It is a highly appealing electrode material for a wide range of applications due to its superior properties, including high thermal and electronic conductivity, larger surface area, promising mechanical strength, and ease of chemical functionalization. Conversion of 2D graphene sheets into three-dimensional (3D) graphene not only avoids undesirable aggregation phenomena but also introduces desirable features of fast electronic and ionic transportation, strong mechanical properties, and higher specific area [25]. Amongst the types of nanostructures, 3D reduced porous graphene has received substantial attention from scientists recently because of its advantages, such as larger accessible surface area, enhanced catalytic activity due to higher pore volume, stronger mechanical strength, and higher conductivity [26].
The unique properties of p-rGO have highly promising applications in electrochemical energy storage [27], supercapacitors [28], fuel cells [29], electrocatalysis [30], and electrochemical sensors [31,32]. In 3D porous graphene, graphene layers are self-assembled or have holes in structures. In comparison with GO, 3D porous graphene demonstrates excellent conductivity because of the partial loss of oxygen-based surface groups and defects present in the basal plane [33]. The 3D pore structure enables easy access and diffusion of molecules and ions throughout its structure [34]. Consequently, fast electron and mass transport kinetics occur in comparison to the original graphene, which enhances its electrochemical sensing performance. With these advantages, it has attracted growing attention as a sensing material for small drug molecules. The low-temperature solution combustion method is simple, is almost instantaneous, is inexpensive, does not require costly/toxic reagents, and is an environmentally benign method to produce huge porous surfaces in graphene-based material for electrochemical applications [35].
Additionally, reduced graphene oxide offers huge benefits in terms of capacity, activity, and electrical stability owing to its unique structure, lattice defects, and negative charge [36]. The better conductivity of rGO than that of graphene oxide is because of the loss of oxygen-based surface functional groups and the presence of defects in the basal plane [37], which restores the aromatic network of sp2-carbon with notable dielectric loss. An environment-friendly and inexpensive greener synthesis route for rGO is extremely important for safe application. In order to minimize the hazardous effects of certain reducing agents, a few environmentally benign reducing agents such as glucose [38], microorganisms [39], ascorbic acid, and certain amino acids [40] have been used in the recent past for the synthesis of rGO on a large scale. Amino acids and their derivatives offer specific merits due to their biocompatible and non-toxic nature. Given this, it was planned to synthesize the p-rGO material just by heating the homogeneous mixture of graphene oxide and glycine fuel suspension at 250 °C for 30 s. The present work explores glycine simultaneously as a greener reducing agent for the reduction of GO and as a fuel for combustion to produce porous microstructure in rGO.
Furthermore, the electrochemical properties of rGO can be effectively enhanced further by combining with other nanostructured functional materials such as metal oxide nanoparticles [26]. Metal-oxide-nanoparticles-decorated nanocomposites were reported to enhance electrochemical sensing performance [41]. Among different metal oxide nanoparticles, tin oxide (SnO2) nanoparticles have garnered much scientific interest as important n-type semiconductors with a vital band gap of 3.6 eV. They are broadly utilized in numerous applications such as photo electronics, microelectronics, super capacitors, solar cells, biosensors, gas sensing, lithium-ion batteries, and field emission studies [42]. There is increased use of SnO2 as an electrode modifier material, and SnO2 in combination with rGO has recently been employed successfully as a sensing material [43] due to its astonishing features such as high conductivity, biocompatibility, excellent band gap, economical nature, abundant availability, the existence of oxygen vacancy defects, and the most chemically and thermally stable oxidation state [43]. Furthermore, SnO2-based nanomaterials play a significant role in catalysis due to their intrinsic redox nature.
Green synthesis for the preparation of nanoparticles has attracted much interest on account of its merits such as a straightforward and fast reaction process, safe nature, environmentally benign status, ease in manufacturing, inexpensive nature, and low-temperature, short time, and mild reaction conditions [44]. The green synthesis of metal oxide nanomaterials using plant extracts provided promising and sustainable alternative approaches to conventional synthetic methods. The plant extracts contain phytochemicals (i.e., secondary metabolites) such as terpenoids, alkaloids, antioxidants, flavonoids, and amino acids. These exist in seeds, peels, fruits, and leaves that function as capping and reducing agents for the reduction of metal ions [22]. Given green chemistry, the preparation of SnO2 via a simple sustainable procedure is worthwhile for sensor applications. In view of this, the tetragonal structured SnO2 nanoparticles were synthesized via a green synthesis route using an aqueous extract of agricultural waste cotton boll peels. This extract with major constituents such as ascorbic acid, pyrogallol, gallic acid, and ellagic acid can act as both a reducing and capping mediator [45].
Consequently, rational integration of SnO2 on p-rGO can be a promising approach to significantly improve its sensing performance due to its individual merits and synergistic interactions between two components [46]. p-rGO sheets not only support anchoring SnO2 nanocrystals without aggregation but also can effectively improve the electron transfer rate at the electrode by forming p–n junctions at the interfaces of n-type SnO2 and p-type p-rGO [47], thereby promoting the electrode reaction. These nano-Schottky barriers can be controlled by the reduction or oxidation of electroactive analyte. Since the work function of p-rGO is lesser than that of SnO2, electrons released during the oxidation of RPG are moved to GCE via p-rGO due to their greater mobility. The concentration of electrons rises upon successive addition of RPG, which causes the barrier to become forward biased and raise the peak current at the SnO2@p-rGO composite modified GCE. Therefore, SnO2 anchored p-rGO might serve as an ultrasensitive sensing interface for the determination of RPG.
The current study describes the sustainable greener synthetic protocol for the efficient synthesis of SnO2 nanoparticles using cotton boll peel extract. For the production of porous architecture and reduction of GO, glycine was utilized as an eco-friendly reagent. Herein, we have proposed a sensitive electrochemical sensor based on an SnO2 anchored p-rGO modified electrode (Scheme 2). The enhanced sensing performance and lower limit of detection (8.50 × 10⁻¹⁰ mol L−1) in terms of electrochemical sensing of RPG and its quantification at a subnanomolar level was realized at SnO2@p-rGO/GCE, as the fabricated electrode material demonstrated excellent conductivity, larger surface area, and higher porosity. Further, the structure and morphology of electrode material were characterized by XRD, Raman, SEM-EDX, UV–Vis, TGA, FTIR, cyclic voltammetry, and electrochemical impedance. The performance of the fabricated sensor was evaluated for repeatability and reproducibility. The practical applications of the proposed methods were established by analyzing RPG in biological fluids and pharmaceutical formulations. The fabricated electrochemical sensor demonstrated greater selectivity, repeatability, and long-term stability.

2. Materials and Methods

2.1. Chemicals and Reagents

RPG and tin chloride dihydrate (SnCl2.2H2O) were obtained from Sigma Aldrich, St. Louis, MI, USA. A 500 μM stock solution of RPG was prepared by dissolving a calculated amount of RPG in methanol, diluted as needed with phosphate buffer solution and refrigerated at 4 °C. Agro-waste cotton peels were collected from the cotton field of Yarikoppa village, Dharwad district, Karnataka, India. The drug formulation (labeled 0.5 and 1 mg per tablet) used in the present study was obtained from the local market. The supporting electrolyte used in this study was phosphate buffer solution of pH 3.0.

2.2. Apparatus

A computer-controlled CHI6136E electrochemical workstation (CH Instruments Ltd. Co., Austin, TX, USA) operating on a three-electrode system was used to perform electrochemical experiments. Differential pulse voltammograms were recorded with a differential scan rate range of 0–1.5 with a pulse width of 50 ms and a pulse amplitude of 50 mV. To record square-wave voltammograms, a scan rate of 74.2 mVs−1, potential increment of 4.95 mV, and pulse amplitude of 25.0 mV were maintained.

2.3. Material Characterization

EIS spectra were obtained on the electrochemical interface (model CHI6136E, CH Instruments Ltd. Co., Austin, TX, USA) operating on a conventional three-electrode system. A SmartLab Se, Rigaku X-ray diffractometer with Cu Kα radiation (1.5406 A°) and Bragg’s diffraction angle (2θ) of 5–90° was employed to record the XRD patterns. FTIR spectra were obtained from a Nicolet Fourier transform infrared (FTIR) spectrophotometer (Nicolet 5700, Nicolet, Green Bay, WI, USA) in KBr medium in the mid-IR range of 4000–400 cm−1. The NXR-FT-Raman spectrophotometer, (Nicolet 5700, Nicolet, Green Bay, WI, USA) was employed to record Raman spectra. Both elemental composition and surface morphologies of SnO2@p-rGO were examined on a JEOL (Model JSM-IT1500LA, Akishima, Japan) scanning electron microscope (SEM) with an energy dispersive X-ray analysis (EDX) facility with a magnification of 100 KX. A UV-Vis double-beam spectrophotometer (model AU-2701, Bengaluru, India) was used to record absorption spectra of samples using a 1.0 cm quartz cell. Thermogravimetric analysis (TGA) in the temperature range of 25–700 °C was carried out on a SDT-Q600 (TA Instruments, New Castle, DE, USA).

2.4. Preparation of p-rGO

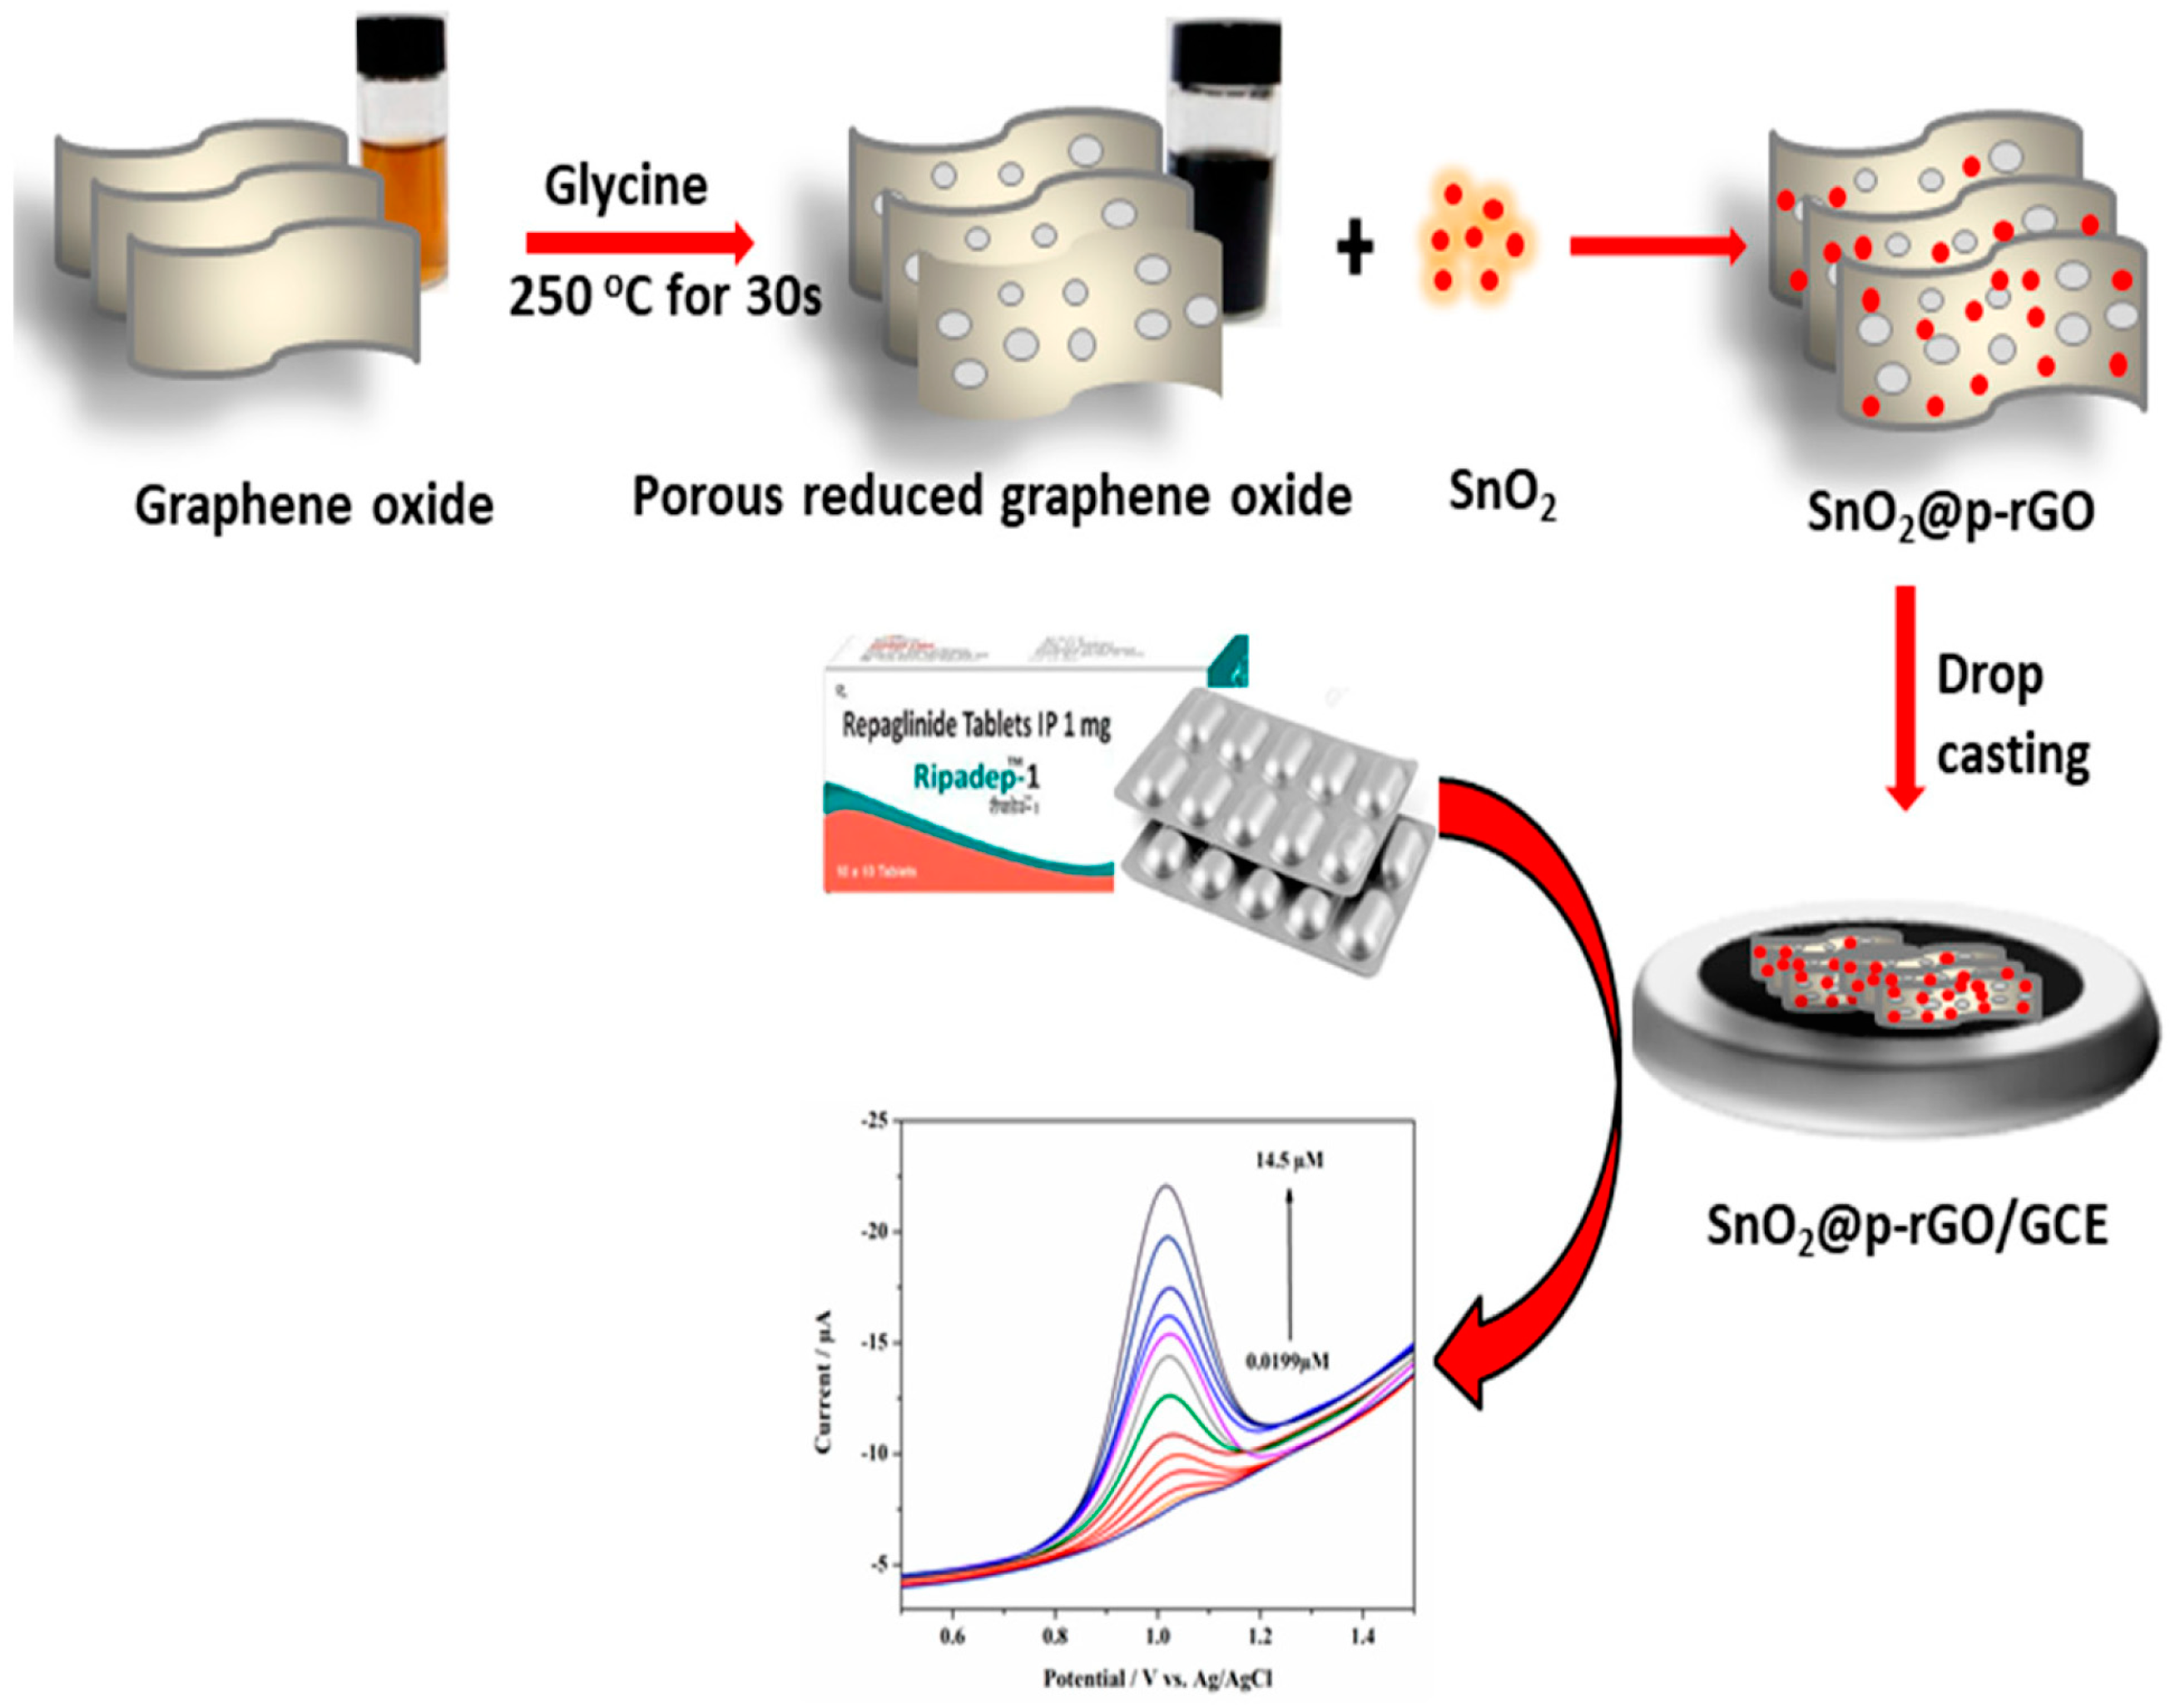
In a typical synthesis of porous reduced grapheme oxide, the modified Hummers method [48] was followed to prepare graphene oxide by the oxidation of graphite powder, and the low-temperature solution combustion method was then used to produce p-rGO [49]. Briefly, GO (6 mg/mL) was sonicated for 30 min in 15 mL double-distilled water to disperse it. Then, 2 g of glycine was added to the aqueous suspension of GO for the combustion process. This mixture was then heated on a hot plate (150 °C) until a thick colloidal suspension was obtained. It was maintained at 250 °C for 30 s in the oven. The fuel (glycine) was ignited, which resulted in the evolution of many gases from GO, leaving a black voluminous porous solid. The resulting product was washed with distilled water several times and then with ethanol. Finally, it was dried at 60 °C, and the final product was labeled as p-rGO. The fabrication procedure for the modification of electrode is represented pictorially in Scheme 2.

2.5. Preparation of Cotton Peel Extract

The aqueous agro-waste cotton peel extract was prepared according to the reported method with a slight modification [45]. Freshly collected cotton boll peels were washed 3–4 times with distilled water and dried in air. Peels were cut into small pieces and ground to powder using an electric mixer. The aqueous extract was prepared by dispersing 3 g of cotton boll peel powder in 100 mL distilled water and then heating it to 80 °C for 30 min in a water bath. Eventually, the aqueous extract was cooled to room temperature. Finally, it was filtered using Whatman filter paper No. 1 and then refrigerated at 4 °C. The pH of the extract was found to be 3.5.

2.6. Green Synthesis of Tin Oxide Nanoparticles Utilizing Cotton Boll Peel Extract

Tin chloride dihydrate (0.329 g) was dissolved in 20 mL distilled water, and then, 20 mL aqueous extract of cotton boll peel was introduced drop-wise into tin chloride solution with stirring at 80 °C. Following 30 min of heating, the light-yellow-colored solution turned to brown. The resulting mixture was then cooled to room temperature and subsequently centrifuged at 6000 rpm for 30 min. After washing with distilled water and ethanol several times, the residue was carefully collected. Eventually, the residue was dried at 60 °C and subjected to calcination at 200 °C for 4 h to obtain SnO2 nanoparticles.

2.7. Preparation of SnO2@p-rGO and Fabrication of SnO2@p-rGO/GCE

SnO2@p-rGO nanocomposite was prepared by sonication of the mixture containing a colloidal suspension of SnO2 (1 mg/ mL) and p-rGO (2 mg/mL) solution in 1:2 for 4 h at room temperature. The resulting homogeneous suspension was designated as SnO2@p-rGO. Prior to each electrochemical measurement, the glassy carbon electrode was pretreated by abrading its surface with slurry of alumina powder (0.05 μm) on a polishing pad. It was then rinsed thoroughly with distilled water to yield a clean and smooth electrode surface. Later, the electrode was subjected to ultrasonication in distilled water for 30 s and finally dried in the air. A simple drop-casting method was adopted to prepare modified electrode. To fabricate a modified GCE, 5 μL (1.0 mg/mL) of SnO2@p-rGO suspension was dropped on the clean surface of GCE and dried under the IR lamp to obtain the desired modified electrode, SnO2@p-rGO/GCE.

2.8. Assay of Tablets

RPG containing tablets equivalent to prepare a stock solution of 1 mM were weighed and powdered. The amount of homogenized powder was dissolved in 50 mL methanol. Then, it was sonicated for 20 min. By properly diluting with the supporting electrolyte, the desired working solutions were prepared. It was then analyzed by DPV and SWV methods. Utilizing the regression equation deduced from the calibration graph, the recovery of RPG was calculated.

2.9. Quantification of RPG in Human Urine Samples

A 1 mL urine sample (drug-free) collected from healthy volunteers was combined with 1 mL RPG solution (1 mM) to obtain the stock solution for the analyte. An appropriate aliquot of urine that had been fortified with analyte was diluted with a PBS of pH 3. Then, it was taken into the electrochemical cell, and voltammograms were recorded at SnO2@p-rGO/GCE using the DPV and SWV methods. Furthermore, the calibration plot was used to calculate the recovery of RPG.

3. Results and Discussion

3.1. Mechanism of Formation of p-rGO and SnO2 Nanoparticles

The 3D nanostructured porous graphene was prepared by a low-temperature solution combustion method. When a colloidal suspension of GO was heated at 250 °C in the presence of glycine as a fuel, the glycine was ignited and generated a huge amount of gas in the graphene oxide suspension. When the combustion process was finished within 30 s, the suspension was converted to black powder with enlarged volume. At 250 °C, the glycine was ignited, and it reacted with epoxy, hydroxyl, and carboxyl groups (oxidizers) on the GO surface, which resulted in the reduction of GO. The reduction reaction mainly took place due to the nucleophilic attack of a -COO group of glycine on hydroxyl/epoxy group(s) present on the GO surface, forming an intermediate that yielded rGO and other decarboxylation products [50]. As a result, large amounts of bubbles of CO2, N2, and H2O vapor were generated in between graphene oxide sheets of GO suspension, and pores were formed by the bubbles between layers of graphene sheets. The pores formed in the architecture have uneven sizes, since the bubbles formed during combustion have different sizes. The product, labeled as p-rGO, has a foam-like structure with several pores and enlarged volume compared to the GO suspension. The possible mechanism in the formation of SnO2 nanoparticles is presented in Scheme S1. The water-soluble phyto-constituents with hydroxyl groups present in the agro-waste cotton boll peels aqueous extract reduced Sn2+ in the precursor to form Sn nanoparticles and stabilized them. Subsequently, the calcination of the residue yielded SnO2 nanoparticles [51,52].

3.2. Structural and Morphological Characteristics

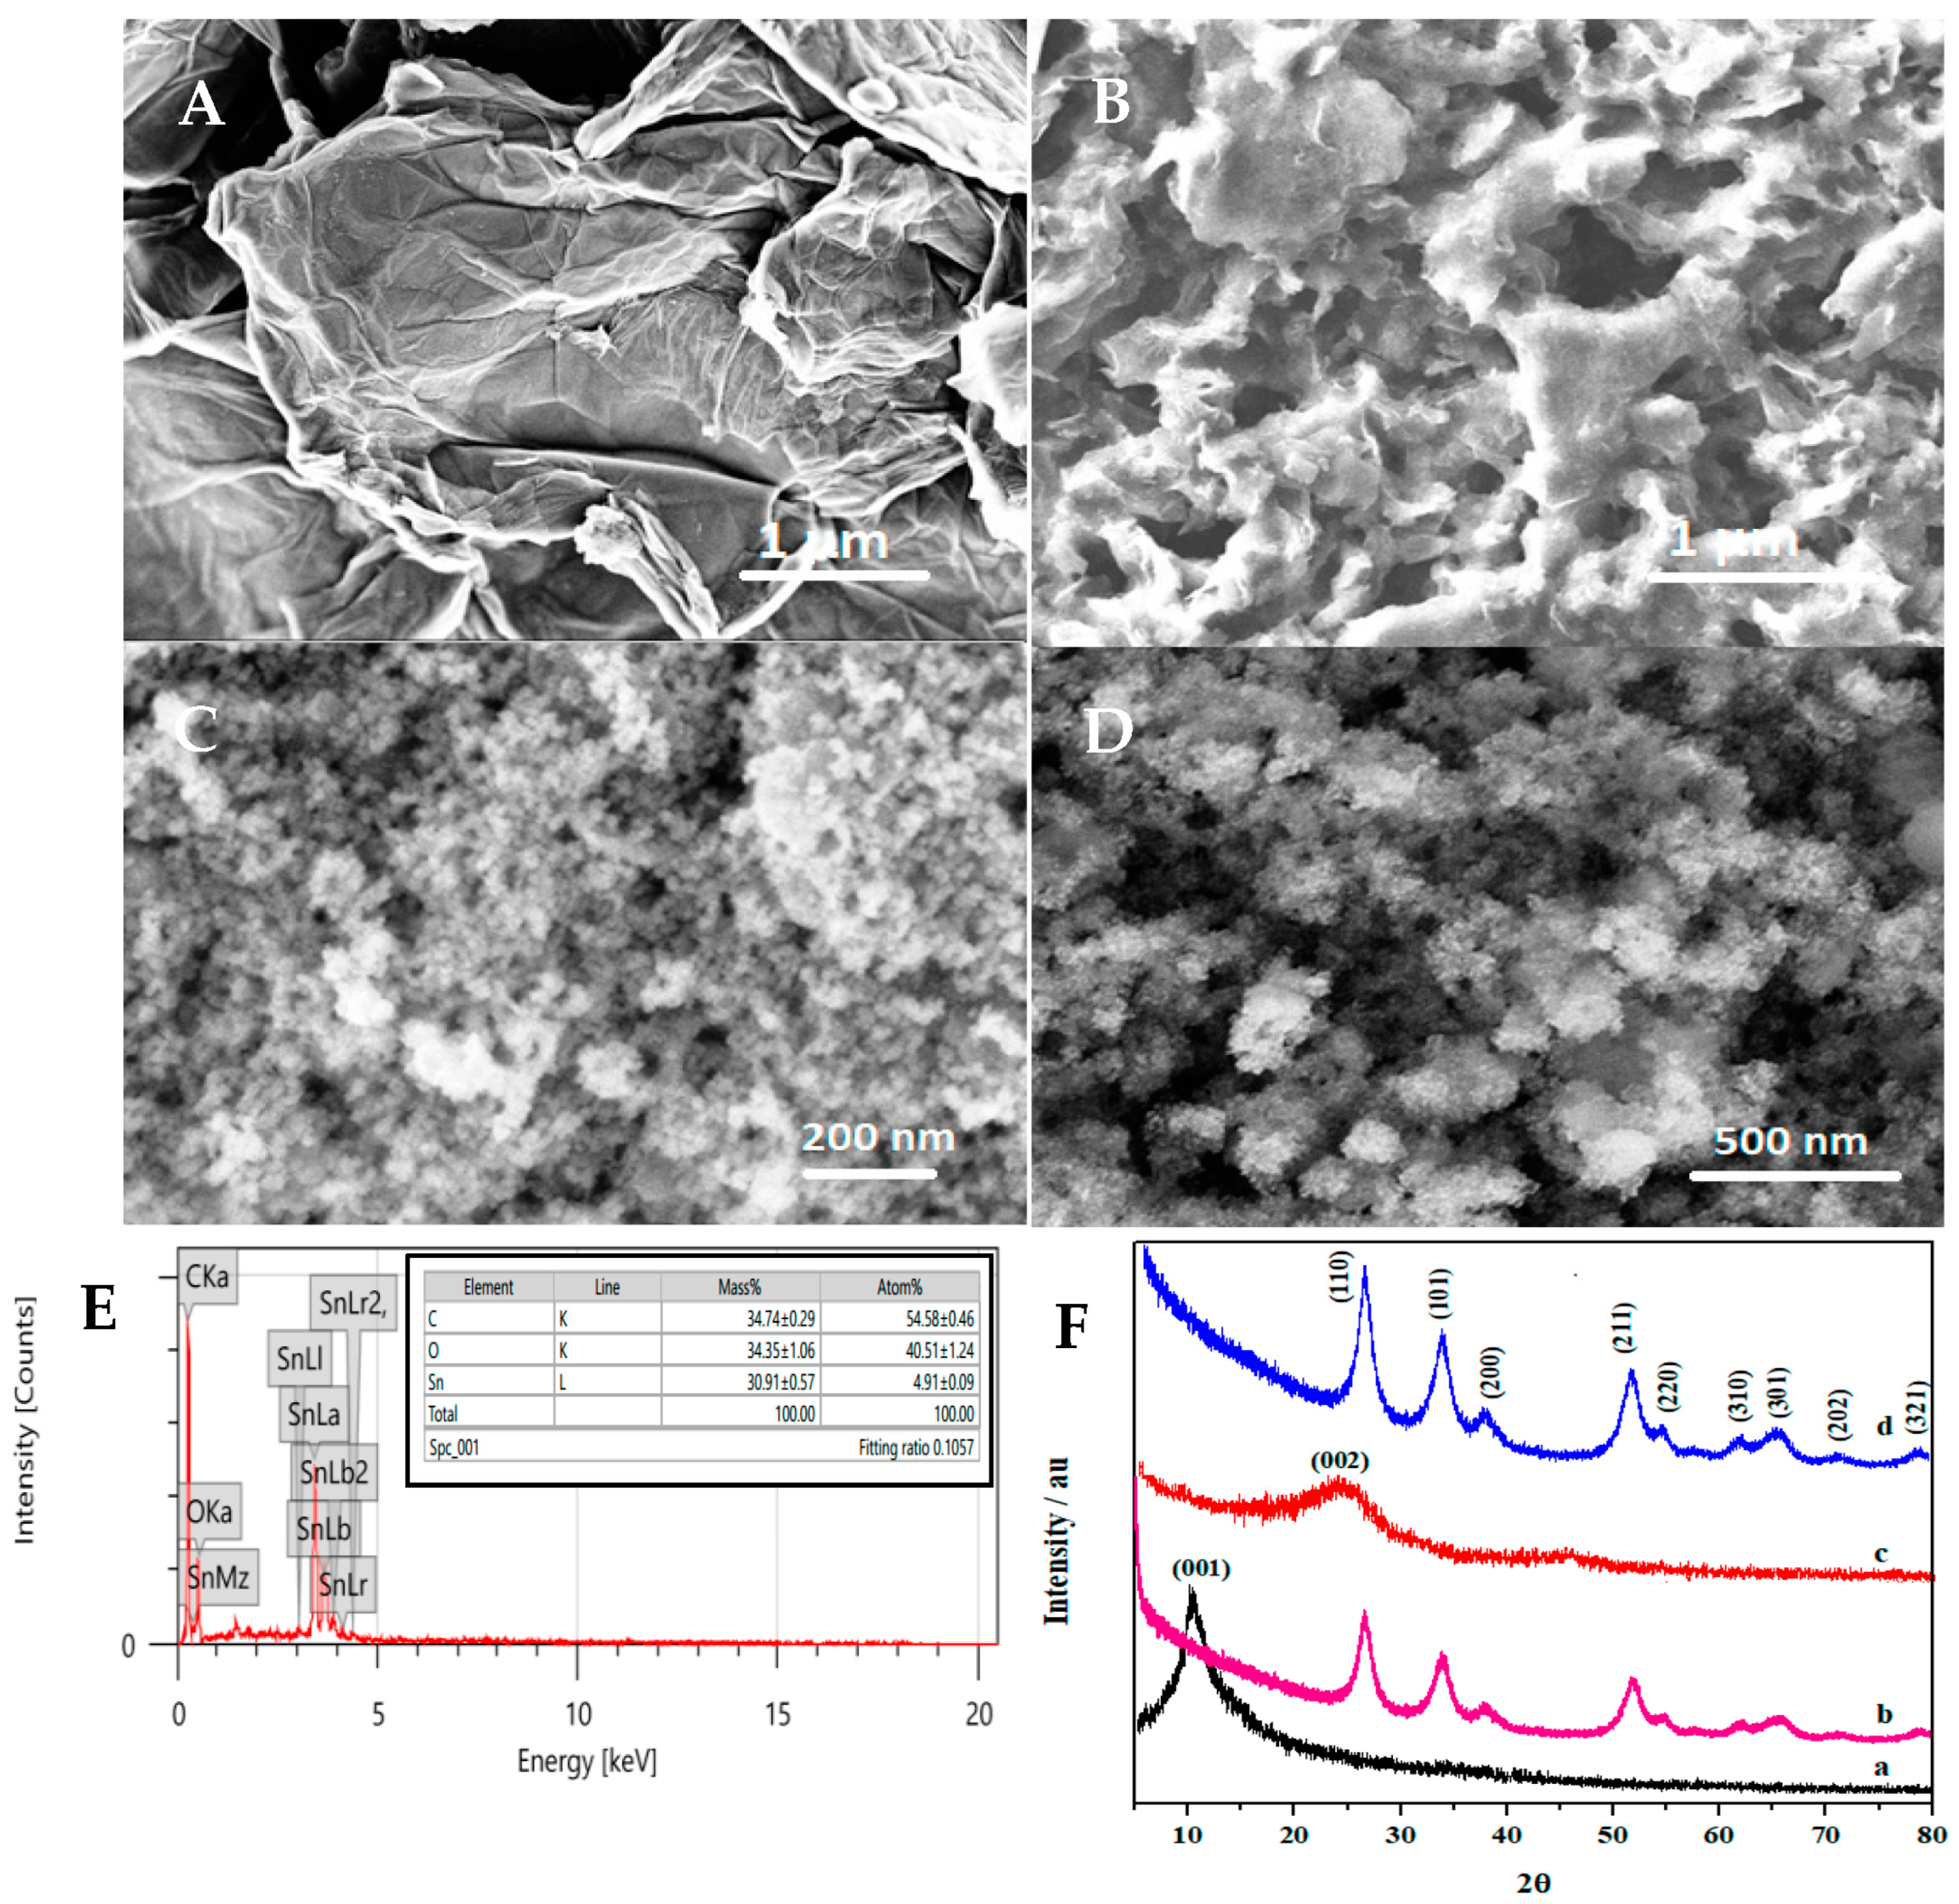
Scanning electron microscopic (SEM) images were recorded to understand the surface morphology and microstructures of GO, SnO2, p-rGO, and SnO2@p-rGO composite. The surface morphology of GO (Figure 1A) consisted of thin flexible stacked sheet-like texture, indicating its layered microstructure. Figure 1C presents an SEM image of SnO2 nanoparticles, which shows the spherical morphology of SnO2 nanoparticles with sizes in the range of 4–12 nm. The average size of SnO2 nanoparticles was 7.8 nm, which matched with the average crystallite size obtained from XRD data. The interconnected 3D porous network-like morphological structure possessing pores with diameters ranging from nanometer to micrometer was observed in p-rGO (Figure 1B), which could provide a larger exposed surface area and electrically conductive pathway. This facilitated efficient charge transfer and mass transfer. It is reported that the interconnected 3D carbon porous network of graphene would be beneficial for the enhancement of electrochemical response when used for electrochemical sensor application [32,53]. A rough porous surface with highly dense and uniformly distributed SnO2 nanoparticles on p-rGO microstructure was evident for hybrid SnO2@p-rGO (Figure 1D). This increased the stability of individual p-rGO sheets by reducing the restacking of p-rGO sheets and also increased the interfacial surface area. The introduction of porosity with a 3D network in p-rGO and the attachment of SnO2 nanoparticles to a p-rGO sheet created a high density of active sites with increased interfacial surface area. Consequently, it improved the contact between the analyte and p-rGO modified electrode surface. Hence, the electrochemically active molecules would obtain more active sites for the electron transfer reaction.
The elemental composition of SnO2@p-rGO nanocomposite was investigated by EDX. The peaks corresponding to O, C, and Sn were observed in the EDX spectrum (Figure 1E), which revealed the purity of prepared electrode material. The percentage of these elements in the composite is given in the inset of Figure 1E.
XRD patterns of GO, p-rGO, SnO2, and SnO2/p-rGO are displayed in Figure 1F. The XRD pattern of GO showed a typical intense peak at 2θ =10.2° (Figure 1F, a), attributable to the (001) plane with an interlayer d-spacing of 0.34 nm [54], indicating the successful preparation of GO by oxidation of graphite [39]. The peak at 24.4° for p-rGO (Figure 1F, c) due to the reflection from the (002) plane ensured that GO was transformed into graphene 2D sheets (porous reduced GO) after combustion and poor ordering of the reduced GO nanosheets along their stacking direction [53]. The diffraction pattern of SnO2 nanoparticles (Figure 1F, b) represented nine reflections at 2θ = 26.59, 33.84, 37.72, 51.96, 57.64, 61.85, 65.45, 71.60, and 78.91°, which corresponded to the planes (110), (101), (200), (211), (220), (310), (301), (202), and (321), respectively (JCPDS card no. 41-1445) [55]. The characteristic peaks of pure SnO2 could be indexed as tetragonal rutile structures for SnO2 (space group of P42/mnm (136)). The mean crystallite size of SnO2 nanocrystals calculated from the (110) peak using Scherrer’s formula was an ultrafine 7 nm. However, the diffraction pattern of SnO2/p-rGO nanocomposite (Figure 1F, d) displayed all the peaks corresponding to SnO2 nanoparticles. However, no obvious peak ascribed to p-rGO was noticed in the XRD pattern, which could be due to the overlapping of the crystallographic (002) plane of p-rGO with the (110) plane of SnO2 [56].
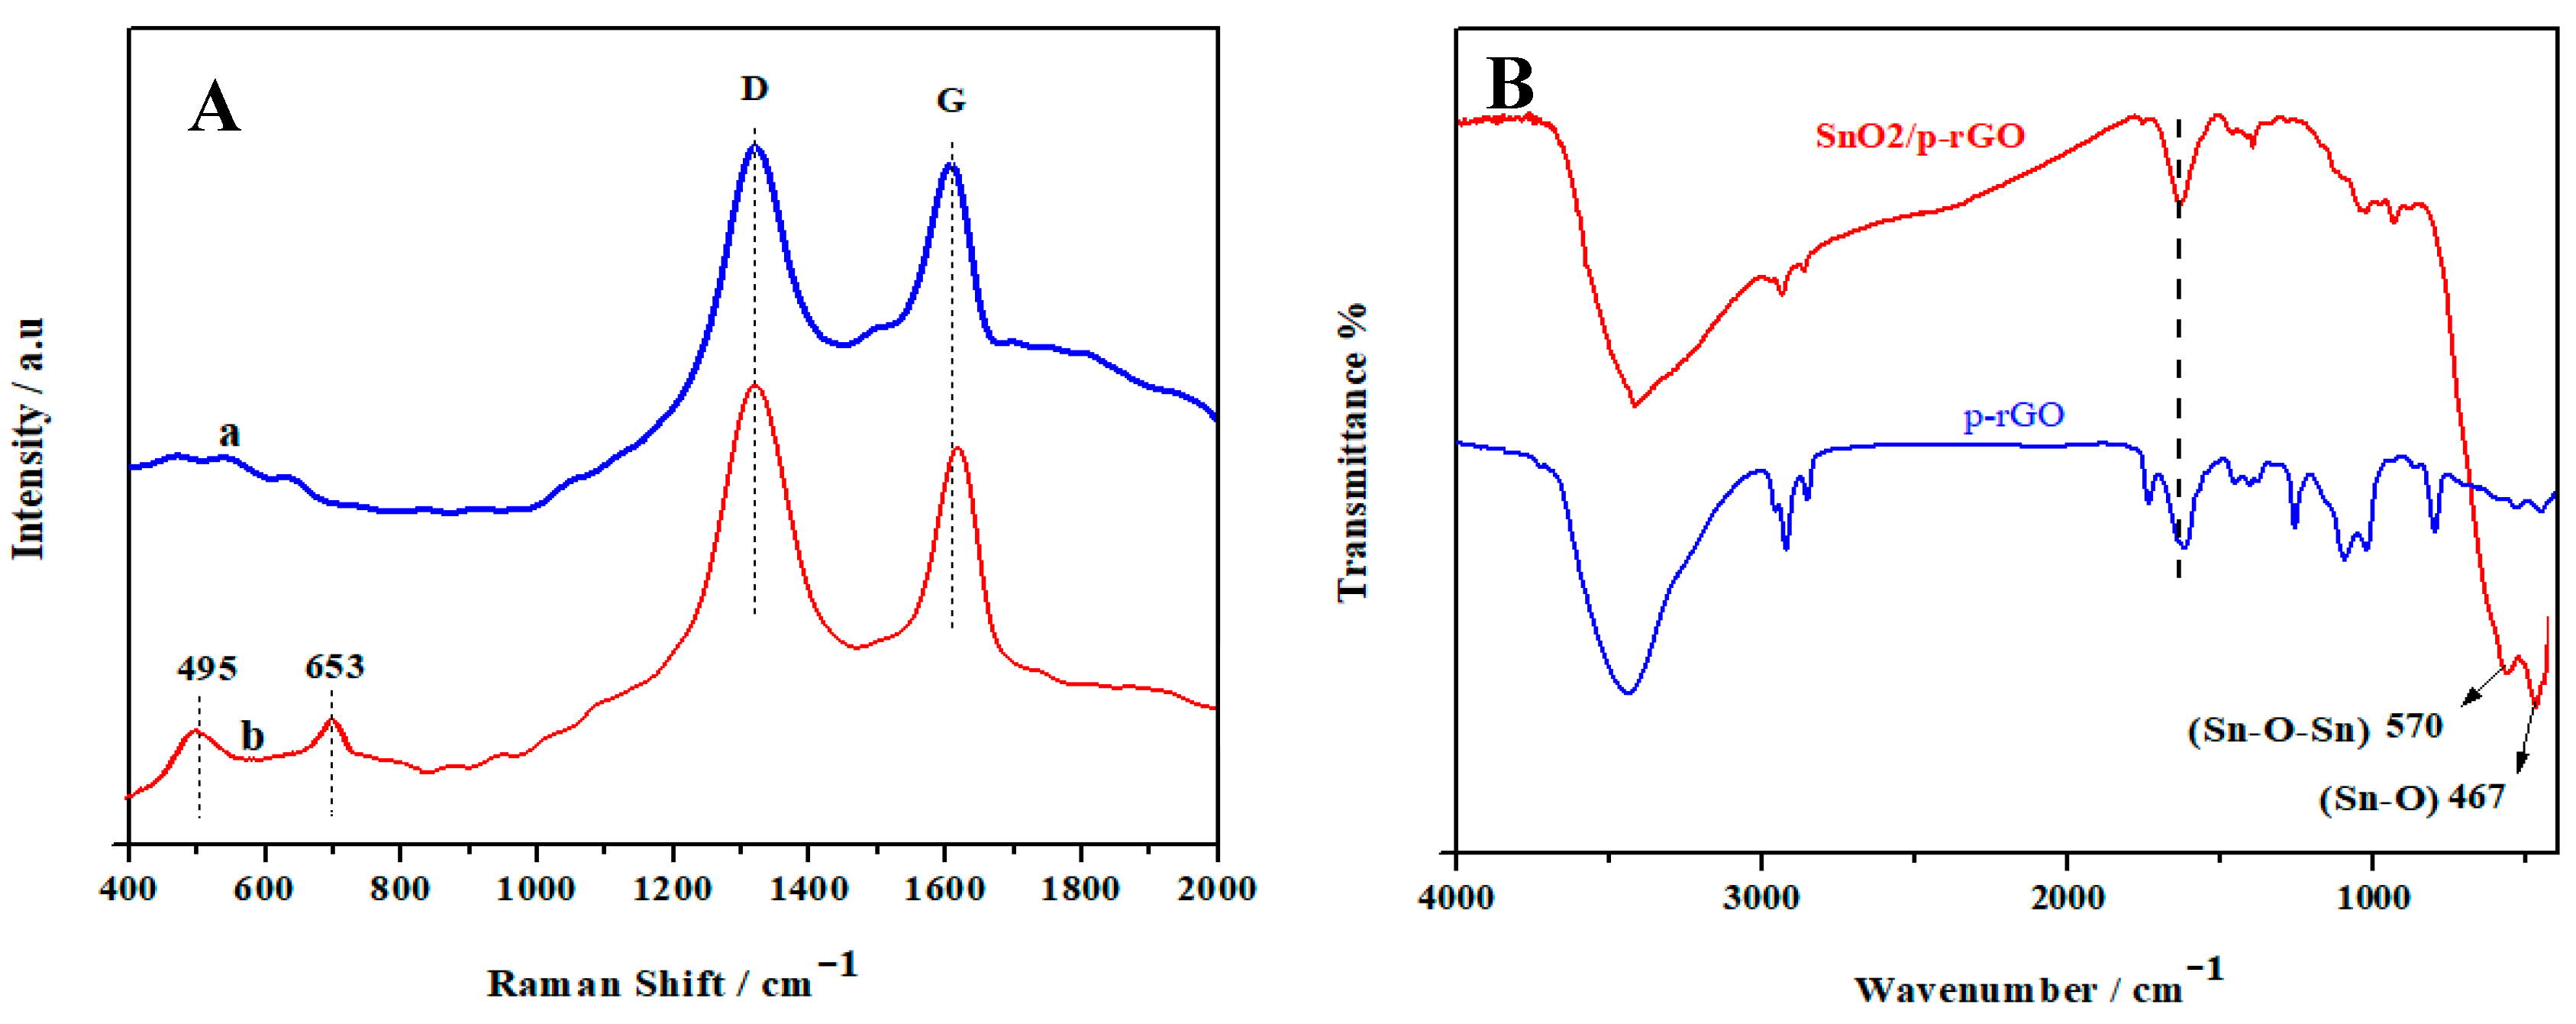
Raman spectroscopy was employed to understand the structural changes during the conversion of GO to p-rGO and formation SnO2@p-rGO (Figure 2A). Raman spectra of p-rGO (Figure 2A, a) exhibited two Raman peaks at nearly 1310 and 1598 cm−1, which were characterized by the disorder-induced D band and graphitic G band, respectively [57]. The D band originated from the edges, structural disorders, and defects of the graphitic structure, while the G band arose from the first-order scattering of the E2g mode of graphitic carbon (sp2) [56]. The Raman spectra of the SnO2@p-rGO (Figure 2A, b) composite contained D and G bands at 1310 and 1612 cm−1, respectively. The blue shift of 13 cm−1 in the G band of the composite was observed relative to the G band of the pure p-rGO. It could be owing to the electronic interaction between the SnO2 nanoparticles and porous graphene sheets. Further, other Raman peaks situated at the low-frequency region at 495 and 653 cm−1 revealed the existence of Eg and A1g vibrational modes of SnO2 nanoparticles deposited on p-rGO nanosheets [58]. The estimated value of the ratio of D to G band (ID/IG) of the SnO2@p-rGO (1.21) was higher than that of the bare p-rGO (1.09), indicating the decreased sp2 carbon domain and a higher degree of defects (Csp3). It was caused by increased vacancies, more edges and defects on the porous nanosheets surface of p-rGO [25], the porosity of the p-rGO matrix, and SnO2 nanoparticles on the surface of graphene sheets [59].
FTIR spectra (Figure 2B) were recorded to characterize the functional groups present in the sample. The FTIR spectrum of p-rGO (Figure 2B) consisted of bands at 3100–3500 cm−1(O-H stretching vibration), 2924 and 2852 cm−1 (stretching vibrations of C-H), 1722 cm−1 (C=O stretching of carboxylic acid groups), 1630 cm−1 (aromatic C=C stretching), 1300 cm−1 (C-OH stretching of epoxide groups), and 1057 cm−1 (C-O stretching), which confirmed the existence of oxygenated functional groups such as carboxyl, hydroxyl, carboxylic, and epoxide groups on the p-rGO surface. Even though the process of combustion was accompanied by the reduction of GO, there were still plenty of functional groups on the surface of partially reduced graphene oxide (p-rGO) [60]. The FTIR spectrum of SnO2@p-rGO (Figure 2B) clearly showed the representative bands of p-rGO with reduced intensity. In addition, the characteristic absorption peak positioned at 467 cm−1 was attributed to the stretching vibrations of the terminal Sn–OH, while the band at 570 cm−1 corresponded to the Eu mode of SnO2 (the anti-symmetric stretching modes of Sn–O–Sn) [61], thereby demonstrating that the SnO2 nanoparticles were anchored on p-rGO.
Absorption spectral data confirmed the formation of SnO2@p-rGO. The p-rGO dispersion displayed a wavelength of maximum absorption at nearly 260 nm (as shown in Figure S1a) that corresponded to π to π* electronic transition of aromatic C–C conjugated double bonds. In addition to this peak, another absorption peak at 330 nm was also observed for the SnO2@p-rGO composite (Figure S1c), which was the characteristic peak of SnO2 (Figure S1b) [58]. These absorption bands confirmed the deposition of SnO2 on p-rGO nanosheets.
The presence of SnO2 on p-rGO was evaluated by thermogravimetric analysis (TGA), and the corresponding thermograms are presented in Figure S2. Two obvious weight loss processes were observed from TGA profiles for both p-rGO (Figure S2a) and SnO2@p-rGO (Figure S2b) samples. The initial decline and sharp drop observed in thermograms at nearly 230 °C were due to the loss of adsorbed water and pyrolysis of the various oxygen-based functional groups on the p-rGO surface. The abrupt mass loss in the second stage at nearly 400 °C was mainly attributed to the decomposition of the carbon skeleton of a p-rGO [62]. The loss in mass was about 22 and 46 wt. % for p-rGO and SnO2@p-rGO, respectively, when the temperature reached 600 °C [63]. Based on TGA results, approximately 24 wt. % of SnO2 was anchored on p-rGO surface in the SnO2@p-rGO composite.

3.3. Electrochemical Characterization of Modified GCEs

The electrochemical performance of the electrode in terms of acceleration of electron/charge transfer process and the electrocatalytic activity was examined by cyclic voltammetry (CV) using 1 mM ferro/ferricyanide solution as a standard redox probe in 0.1 M potassium chloride electrolyte. Cyclic voltammograms were recorded at bare GCE and modified electrodes (Figure 3A). The heterogeneous electron transfer (HET) rate, a function of peak separation (ΔEp) of the cathodic and anodic peaks, is a crucial attribute when investigating the electrocatalytic efficiency of the sensor material [64]. The lower the ΔEp value, the faster the HET rate and the better the conductivity of electrode material in sensing applications. A reversible redox peak was observed for the redox probe with the ΔEp value of 85 mV and Ip value of ~14.20 μA at bare GCE (Figure 3A, a). The SnO2 nanoparticles-based electrode showed a greater peak current (Ip = 30.45 μA and ΔEp = 79 mV) (Figure 3A, b) compared to that of the bare electrode, indicating its good conductive nature. At p-rGO/GCE, the ΔEp was observed to be reduced to 75 mV, and Ip increased considerably to 41.87 μA (Figure 3A, c), which was due to the larger electroactive surface area and excellent conductivity of p-rGO. However, the voltammogram of the probe at SnO2@p-rGO/GCE shows the grafting of SnO2 nanostructures on a p-rGO/GCE platform that not only amplified the peak signal remarkably (Ip = 51.75 μA) but also decreased the peak potential difference (ΔEp) to 70 mV (Figure 3A, d). These results suggest enhanced electron transfer kinetics and electrocatalytic activity at the surface of the SnO2@p-rGO/GCE sensor, which could be due to the enhanced electrochemical performance caused by a larger electroactive surface area with high edge density and excellent conductivity of the porous structure of p-rGO. The highest electrochemical response noted was closely related to the synergic effect of SnO2 and p-rGO. The corresponding CV results are presented in Table 1.
The electroactive surface area is one of the key factors that affect the sensitivity of the electrochemical sensor, owing to the increased interaction between the analyte and interface of the sensor. To examine the electro-active surface area of the modified platform, CV experiments were performed for the standard probe solution of K4[Fe(CN)6] under variable scan rates (10–350 mV/s). Further, the active surface areas of SnO2@p-rGO/GCE, p-rGO/GCE, SnO2, and bare GCE were obtained from voltammograms using the Randles–Sevcik equation shown below [65]:
ip = (2.69 × 10⁵) n3/2AD1/2 C √υ
where ‘Ip’ is the peak current, ‘n’ is the number of electrons transferred in the redox process (n = 1), ‘D’ is the diffusion coefficient (7.6 × 10⁻⁶ cm2 s−1), ‘A’ is the surface area of the electrode, ‘C’ is the concentration of the redox probe, and υ is the scan rate. From the slope value of the graph of Ip vs. √υ, the real surface areas of bare GCE, SnO2, p-rGO/GCE, and SnO2@p-rGO/GCE were calculated to be 0.058, 0.088, 0.115, and 0.594 cm2, respectively. The material SnO2@p-rGO/GCE exhibited more extensive active sites (larger effective surface area), which were beneficial to adsorb more analyte molecules, promoting the sensing reaction that resulted in rapid charge transfer kinetics at the interface and hence an enhanced current response at SnO2@p-rGO/GCE.
In order to assess the conductance and interfacial charge transfer property of the proposed electrode, the EIS technique was used. Figure 3B shows the EIS scans as Nyquist plots for [Fe(CN)6]3−/4− at GCE (Figure 3B, a), SnO2 (Figure 3B, b), p-rGO/GCE (Figure 3B, c), and SnO2@p-rGO/GCE (Figure 3B, d). Nyquist plots were constructed to measure charge transfer kinetics at the electrode surface. The plots consisted of broader semicircle curves in the medium frequencies and inclined lines at lower frequencies. The semicircle diameter measures interfacial electron transfer resistance (Rct), which governs the electron transfer kinetics of the electrode reaction [66]. From Figure 3B, it was observed that the diameter of the semicircle for bare GCE (Rct = 738.6 Ω) was wider than that for SnO2 (Rct = 486.5 Ω), demonstrating a low rate of the electron transfer ability of GCE and conductive nature of SnO2. The p-rGO/GCE displayed much lower impedance (Rct = 162.3 Ω) to the electron transfer process than SnO2/GCE, indicating that p-rGO with 3D porous microstructure and high edge density was highly conductive and could effectively promote the charge transfer at the interface. However, for the SnO2@p-rGO/GCE electrode, a nearly straight line with a very smaller semicircle curve (Rct = 28.7 Ω) was noticed confirming the excellent conductivity of SnO2@p-rGO. This was mainly due to the presence of highly conductive and unique porous structural material (SnO2@p-rGO) on the electrode surface that has an open porous microstructure and a 3D interpenetrating network that allowed the electrolyte to access almost all the graphene sheets. Further, small pores in p-rGO offered lesser inner-pore resistance, facilitating the transfer of electrons and the diffusion of ions during an electrochemical reaction [67]. The ohmic resistance signified the excellent conductive nature of SnO2@p-rGO/GCE compared to other electrodes. The EIS findings validate the results of CV.

3.4. Electrochemical Behavior of RPG at Bare GCE and Modified GCEs

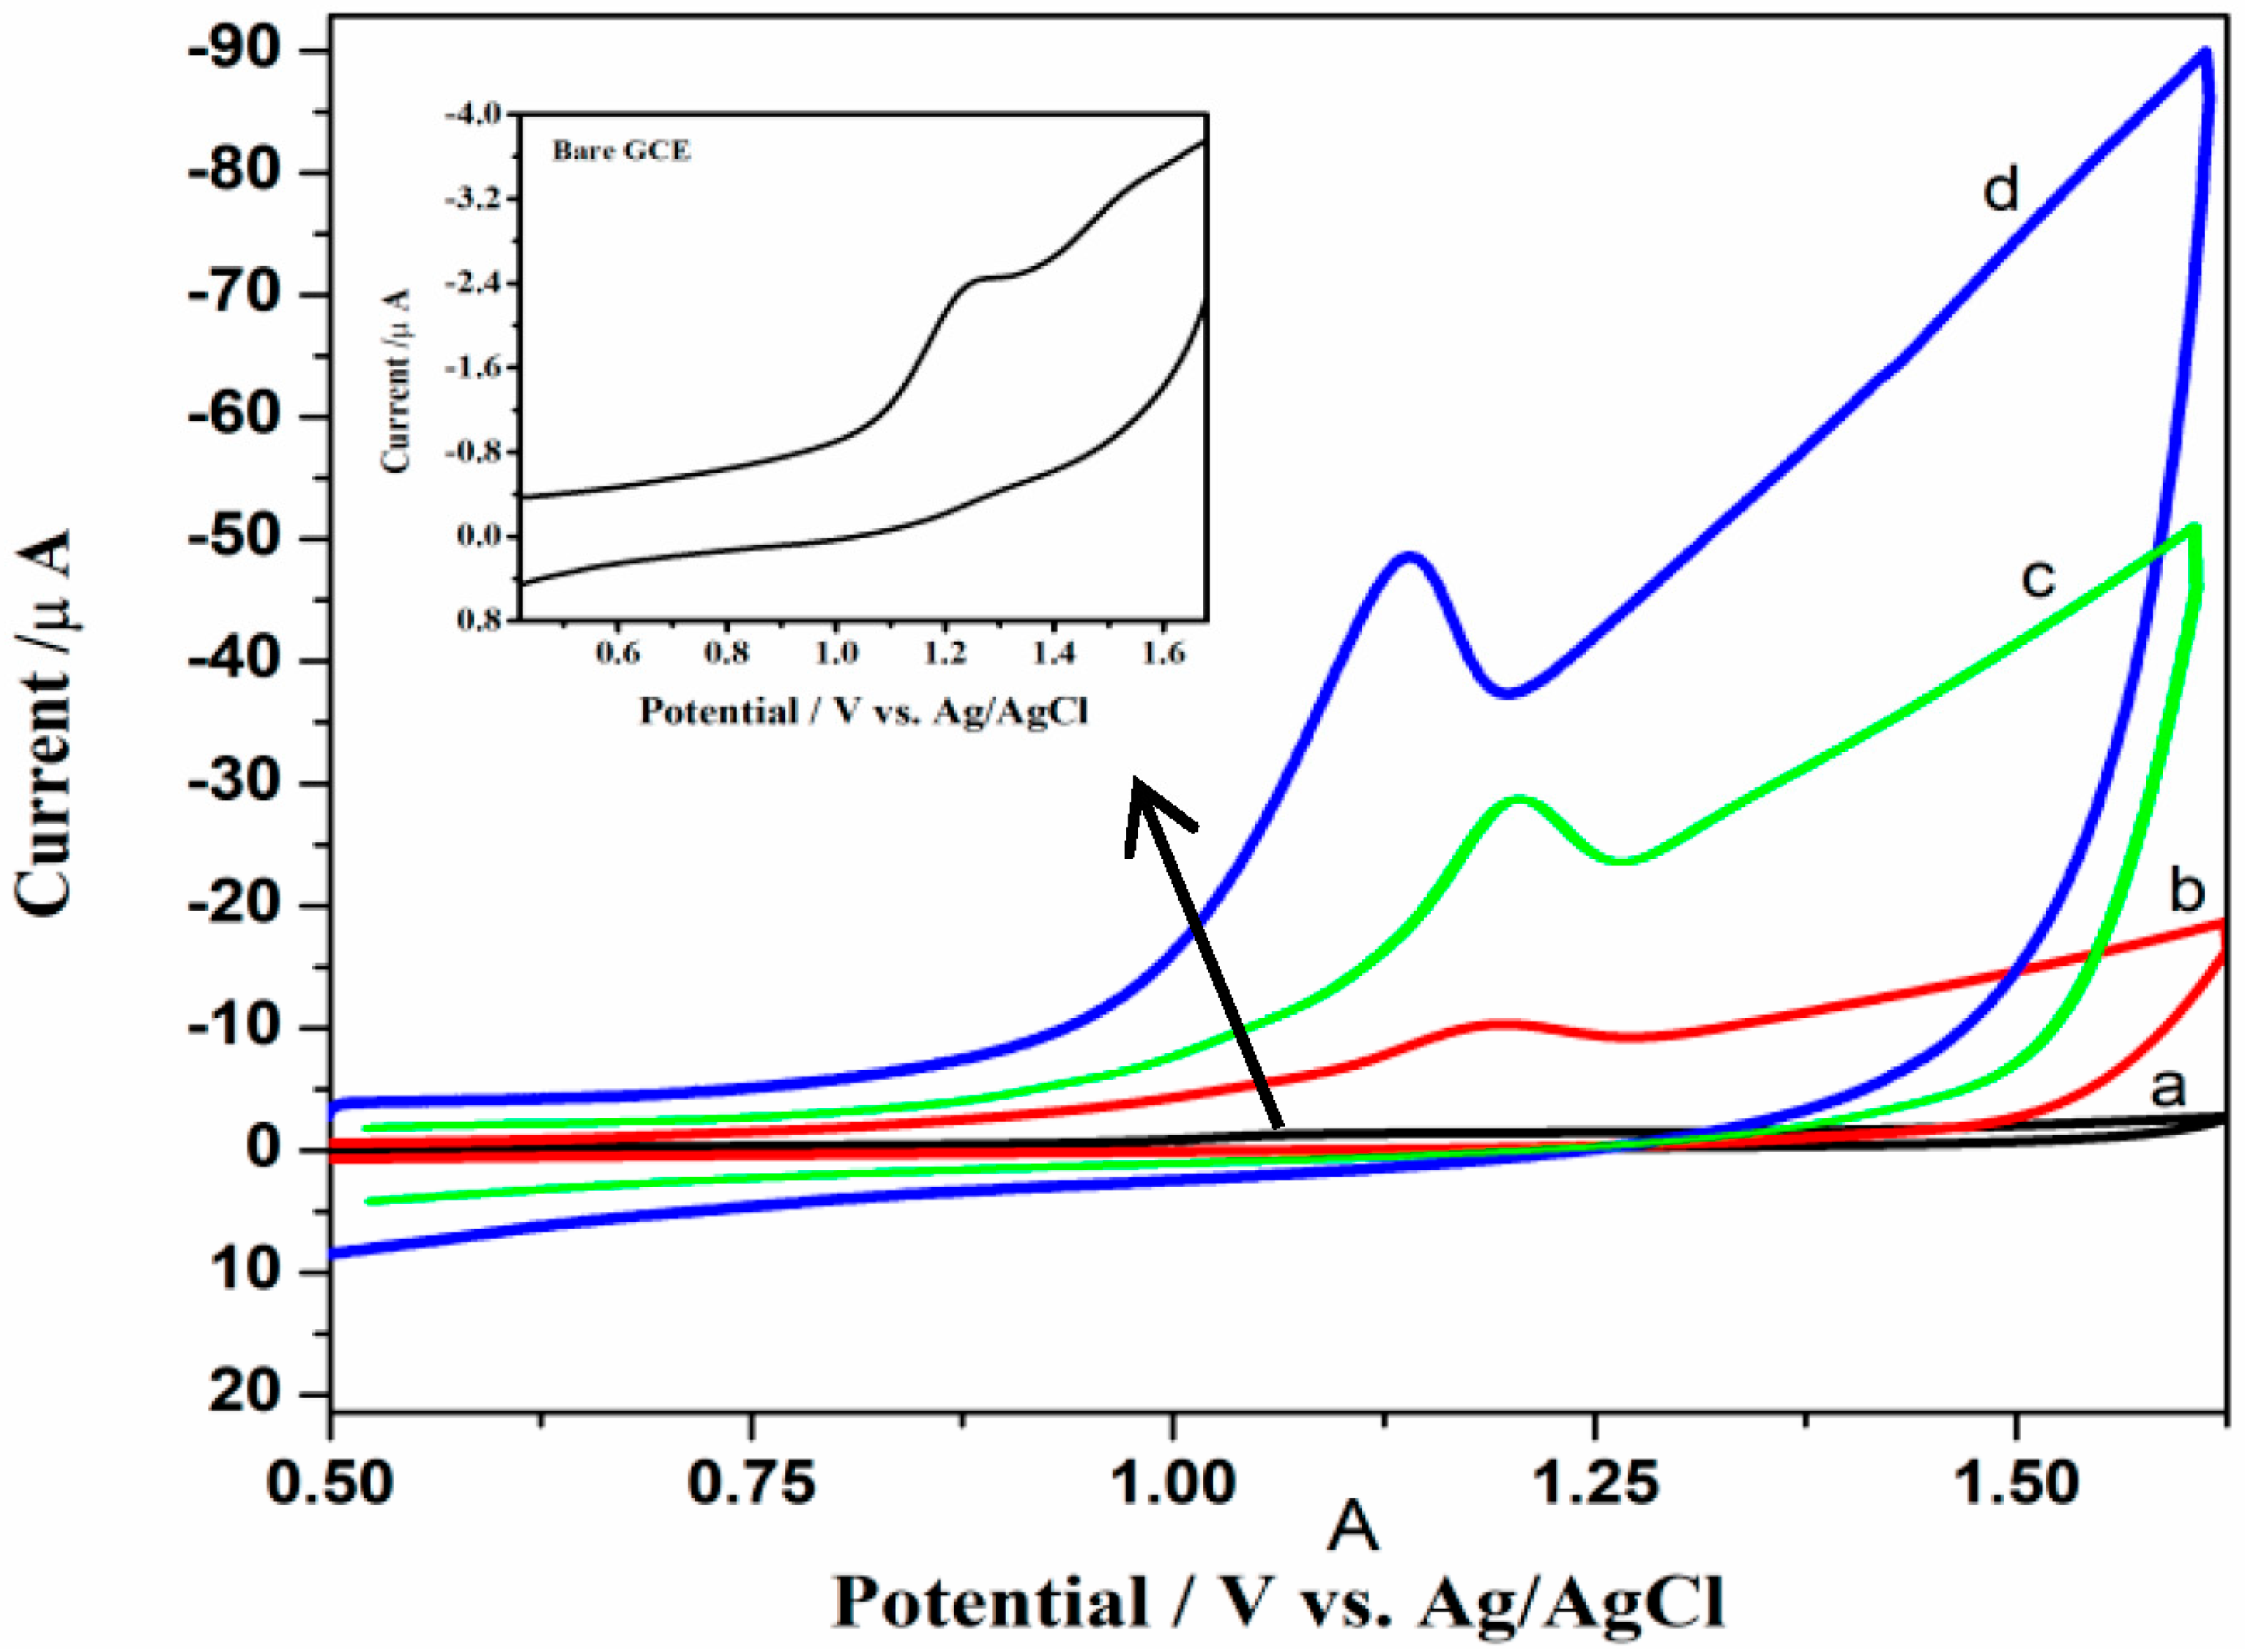
To examine the electrochemical behavior of RPG, cyclic voltammograms were recorded for an RPG solution (10 μM) in PBS of pH 3 at bare GCE (Figure 4, a), SnO2/GCE (Figure 4, b), p-rGO/GCE (Figure 4, c), and SnO2/p-rGO/GCE (Figure 4, d). RPG exhibited an irreversible anodic peak at all three electrodes with varied peak currents (Ipa) and anodic peak potentials (Epa). At bare GCE, the peak appeared at 1.28 V (peak a1) with the lowest current due to the slow electron transfer kinetics between the electrolyte and electrode surface. At SnO2/GCE, RPG exhibited higher Ip compared to that at bare GCE (with Ep = 1.20 V) due to the conductive nature of SnO2. However, the Ep value was observed at 1.156 V with notable enhancement in the current signal at p-rGO/GCE compared to that at GCE, owing to the presence of conductive p-rGO with a larger electroactive surface area. Further, RPG exhibited significant enhancement in the peak current (~28-fold) at a lower anodic peak potential (Ep = 1.09 V) at SnO2@p-rGO/GCE compared to that at bare GCE. This indicated that the SnO2@p-rGO/GCE catalyzed and facilitated the interface electron transfer when the electrochemical oxidation of RPG occurred. The superior sensing performance and improved electrocatalytic activity observed at SnO2@p-rGO/GCE towards the oxidation of RPG was due to the 3D porous structure, higher surface area, and excellent conductivity of the SnO2@p-rGO/GCE electrode.
The 3D porous network in SnO2@p-rGO/GCE provided highly conductive multiplexed pathways for better diffusion of the electrolyte along with the analyte to access the active electrode material. This increased the enrichment of analyte at electrode. The presence of SnO2 nanoparticles on p-rGO led to even more active sites as well as more exposed edges within the p-rGO network, which are favorable for transferring electrons [67]. The lower Fermi level energy of SnO2 compared to p-rGO facilitated the electron move from SnO2 to p-rGO. Therefore, the electron transfer rate was faster [57]. Good conductivity and morphological uniqueness of SnO2@p-rGO synergistically contributed to excellent electrochemical performance of SnO2@p-rGO/GCE, and it is thus acknowledged as a promising electrode for further experiments.

3.5. Effect of pH and Supporting Electrolyte

The pH of the medium influences the electrochemical performance of a sensor. The peak potential (Ep), current (Ip), and shape of peak significantly depend on the pH of the buffer solution. Thus, the effect of pH was assessed to understand the number of protons that participated in the electrode process and to choose the best pH for achieving a higher sensitivity for the determination of RPG. Therefore, buffer solutions of different pH (from 2.0 to 10) were used as the supporting electrolyte, and cyclic voltammograms were recorded (Figure S3A). A linear negative shift in the oxidation potential was noticed with an increase in pH of the medium (Figure S3A). In addition to the first oxidation peak, the new oxidation peak appeared for pH beyond 4. This shift in the first oxidation peak potential confirmed the participation of H+ ions in the electrode process. Further, the graph of Ep vs. pH (Figure S3B) indicated breaks at pH 4 and 6 for linear segments, which was probably owing to a change in the protonation–deprotonation equilibrium of RPG. The breaks were close to pKa1 (3.9) and pKa2 (6.0) of RPG.
The plots of Ep vs. pH yielded slopes of 52.5 mV per pH (pH 2–4), 63.3 mV per pH (pH 4–6), and 65.0 mV per pH (pH 6–10), in three different regions. These values are close to the expected slope value of 59 mV/pH, indicating that an identical number of electrons and protons have taken part in the electro-oxidation of RPG [43].
Epa [V] = −0.0525 [pH] + 1.287; R2 = 0.9899 (pH 2.0–4.0)
Epa [V] = −0.0633 [pH] + 1.032; R2 = 0.9825 (pH 4.0–6.0)
Epa [V] = −0.065 [pH] + 0.982; R2 = 0.9825 (pH 6.0–10.6)
It was further observed in Figure S3A that the maximum peak current for RPG was observed at pH 3.0. Thus, electrochemical responses were recorded in different buffer solutions, viz. H2SO4, acetate buffer, Britton–Robinson buffer, and PBS at pH 3.0. By taking into consideration peak current, peak potential, and shape of peak, PBS was found to be the most favorable buffer medium for the electro-oxidation of RPG, and it was used for subsequent work.

3.6. Optimization of the Sensing Response

Charge transfer kinetics in the electrode reaction and the mass transfer mechanism through the porous modifier film were examined by varying the thickness of the modifier film on the electrode surface. For this, different volumes of SnO2@p-rGO suspension (1 mg/mL) were drop-casted on GCE, and cyclic voltammograms of RPG were recorded. A significant increase in the anodic peak current was noticed with an increase in the amount of the modifier from 1 to 5 µL (Figure S4A). Beyond 5 µL, a thick film of modifier on the electrode would obstruct the diffusion of the analyte through the modifier, which led to a decrease in the peak current of RPG. Therefore, 5 µL of SnO2@p-rGO suspension was used as an optimal amount to fabricate the modified electrode towards the electro-oxidation of RPG. The effect of the accumulation time on the peak current of 10 µM RPG was studied in PBS of pH 3.0. As shown in Figure S4B, the peak current of RPG was raised with an increase in the accumulation time from 30 to 280 s, and a maximum peak current was reached at 120 s, suggesting that the adsorption equilibrium was reached. An accumulation time of beyond 120 s led to desorption of RPG, and thus, the optimal time was set at 120 s. Therefore, the suspension of 5 µL, accumulation time of 120 s, and PBS of pH 3.0 were maintained throughout the investigation.

3.7. Scan Rate Studies

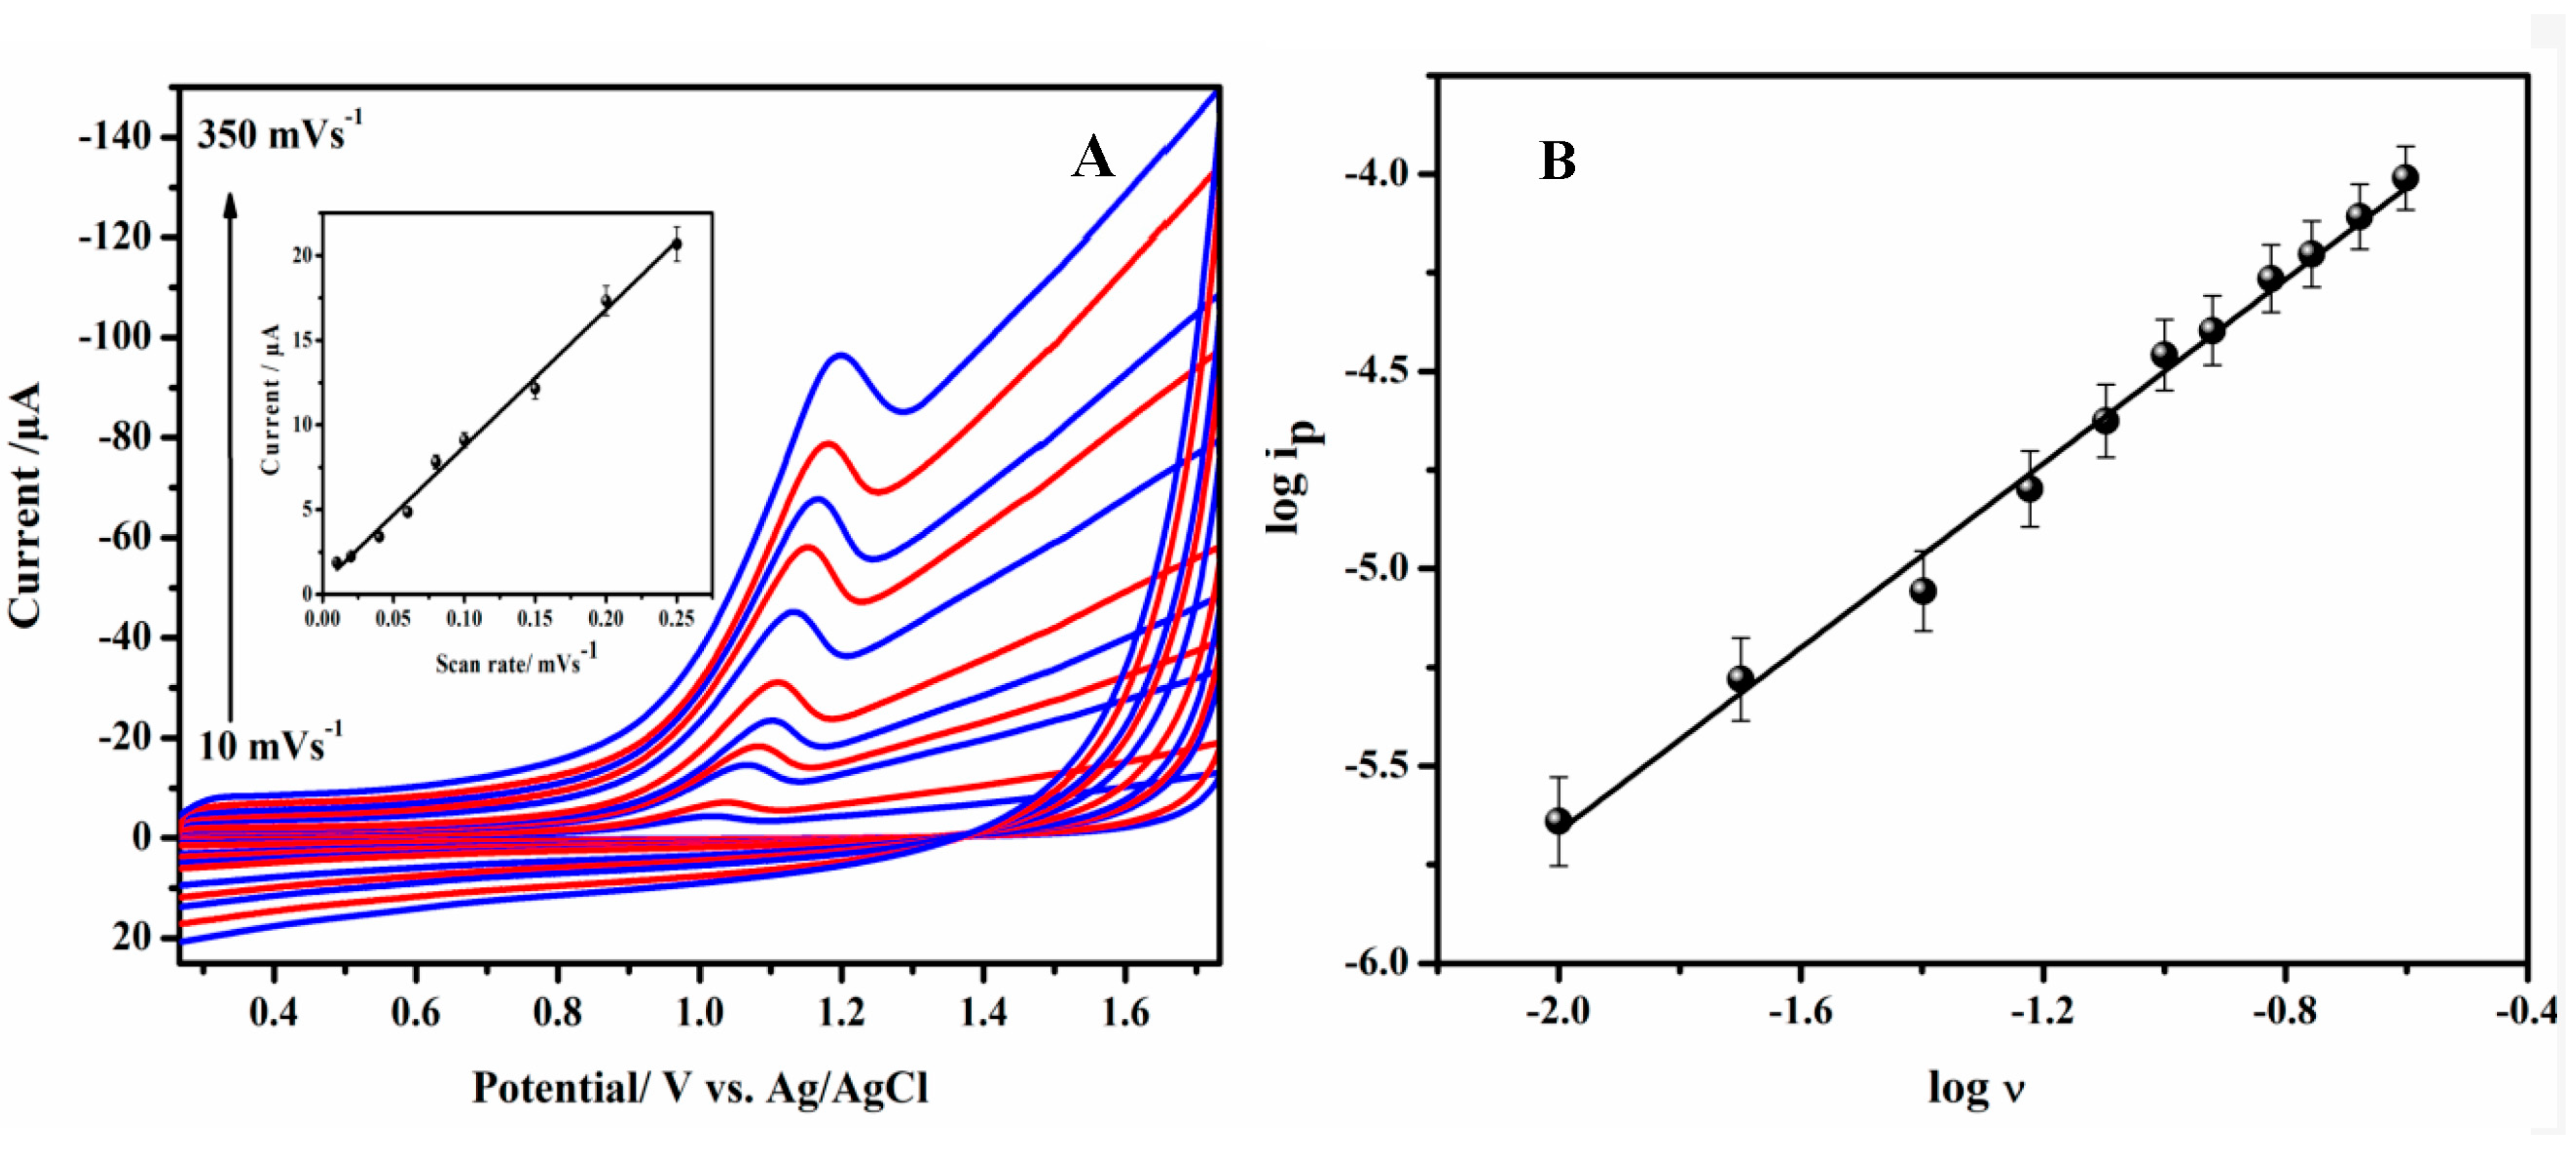
In order to inspect the electro-oxidation of RPG at the SnO2@p-rGO/GCE surface, the impact of scan rate (υ) on the voltammetric response was investigated by recording cyclic voltammograms of 10 μM RPG solution at SnO2@p-rGO/GCE in the 10 to 350 mV s−1 scan rate ranges. With increases in the scan rate, not only did the oxidation peak currents increase, but their peak potentials were moved towards a positive potential window. The plot of peak current vs. the scan rate (υ) revealed the linear relationship. The corresponding regression equation is presented below:
Ipa (μA) = 3.826 × 10⁻⁴ (υ) − 6.811 × 10⁻⁶; (R2 = 0.989)
The linear regression equation for the plot of the log Ipa versus log υ (Figure 5B) equation is indicated below:
log ipa = 1.092 log υ − 3.469; R2 = 0.99
The electrode process followed the adsorption-controlled behavior, as evident from the slope value of 1.092, which is close to the theoretical value of 1.0, known to characterize an ideal adsorption-controlled electrode process [68]. According to Laviron’s theory, the relationship between Ep and scan rate (υ) is outlined below [69]:
Epa = E°′ − RT/αnF [ln (RTks)/(αnF) + ln υ] (for an irreversible electrode process)
where E°′ is the formal standard potential; υ, T, R, and F stand for their usual meaning; and α, n, and ks are the electron transfer coefficient, the number of electrons involved, and the HET rate constant, respectively. The values of ‘n’ and ‘ks’ were calculated using the value of the slope of the linear plot of Epa versus ln υ. The intercept of the plot was used to determine the value of E°′ for RPG at SnO2@p-rGO/GCE. The values of ‘ks’ and ‘αn’ were calculated to be 1.095 s−1 and 1.11. The value of ‘α’ was typically assumed to be 0.5 for an irreversible oxidation process [70], and the value of ‘n’ was calculated to be 2.22. Based on these findings, we have proposed that RPG has undergone two electrons’ irreversible oxidation at SnO2@p-rGO/GCE followed by the loss of two protons.

3.8. Electrode Reaction Mechanism

The probable mechanism for the oxidation of RPG at SnO2@p-rGO/GCE is proposed based on the results of the experiments, and the same is presented in Scheme 3. It is proposed that the RPG has undergone oxidation with the loss of two electrons and two protons at SnO2@p-rGO/GCE. Taking into account the experimental data, the electrochemical oxidation behavior of piperidine, and previous reports for other piperidine-containing compounds [71,72], we suppose that the nitrogen atom in the piperidine moiety of RPG has undergone oxidation. The oxidation has followed the two-step oxidation mechanism. RPG was electrochemically oxidized by two electrons to yield piperidine N-oxide at SnO2@p-rGO over the investigated pH range.

3.9. Construction of Calibration Curve

Because of RPG’s enhanced electrochemical response at SnO2@p-rGO/GCE, new electrochemical methods for its quantification were developed. In the current work, sensitive square-wave voltammetric and differential pulse voltammetric methods for the determination of RPG were established under optimal conditions. As seen in Figure 6A,B, the current responses increased linearly with increased concentrations of RPG on SnO2@p-rGO/GCE in the ranges of 4.99 × 10⁻⁸–1.83 × 10⁻⁵ mol L−1 and 1.99 × 10⁻⁸–1.45 × 10⁻⁵ mol L−1 for DPV and SWV methods, respectively. Below are the corresponding regression expressions:
Ip (μA) = 0.9259 [RPG] + 2.306 × 10⁻⁷, R2 = 0.994   (For DPV method)
Ip (μA) = 0.9523 [RPG] + 4.463 × 10⁻⁸, R2 = 0.988   (For SWV method)
The limit of detection (LOD), the limit of quantification (LOQ), and linear ranges are critical figures of merit indicative of the performance of an electrochemical sensor and ensure the practical implementation of the designed sensor. Therefore, the developed electroanalytical methods for the assay of RPG were successfully validated by assessing the values of analytical parameters such as LOD, LOQ, RSD, and selectivity. The LOD and LOQ values for DPV and SWV methods were determined and are given in Table 2. LOD values of 9.02 × 10⁻⁹ mol L−1 and 8.50 × 10⁻¹⁰ mol L−1 for DPV and SWV methods, respectively, were achieved. These values were noticed to be lower than those of the reported methods (Table 3). These results highlight the high sensitivity of the proposed procedures. The SWV method demonstrated greater sensitivity in terms of LOD and LOQ compared to the DPV method. It allows rapid determination with higher sensitivity and selectivity, as it could suppress background and non-faradaic currents.
Further, better sensitivity was noticed at SnO2@p-rGO/GCE. This could be attributed to the existence of numerous pores in p-rGO (for catalytic activity) and increased surface area, which facilitated rapid charge transfer at the electrode surface [73]. Furthermore, the proposed methods’ inter-day and intra-day assays were examined by recording differential pulse and square-wave voltammograms of five replicates of RPG on the same day and three separate days. RSD values for inter-day and intra-day assay results were calculated to be 2.45% and 1.74% for DPV method and 2.19% and 2.23% for SWV method, respectively (Table 2). Low RSD values indicated that the proposed methods are precise.

3.10. Reproducibility and Stability of SnO2@p-rGO/GCE

To verify the repeatability and stability of SnO2@p-rGO/GCE, five modified electrodes were constructed using identical technique, and their performances were examined by monitoring the peak current of 10 μM RPG by CV in PBS of pH 3.0. Peak currents had a relative standard deviation (RSD) of less than 2.06% (average of five observations on each electrode). The RSD for five replicate SWV measurements with a single electrode for 10 μM RPG was found to be 2.3%. The findings show that the developed sensor has greater reproducibility and repeatability in both fabrication and voltammetric measurements. The stability of SnO2@p-rGO/GCE was evaluated over 3 weeks. During this period, the peak current was recorded regularly. Up to 15 days of storage, no appreciabledrop in peak current was detected. Further, 97.3 ± 0.4% response of the initial peak current was retained in the next 7 days. This revealed that the thin film of the SnO2@p-rGO/GCE modifier on the GCE surface has long-term stability (for 3 weeks) for sensing RPG.

3.11. Determination of RPG in Urine Samples

The practical implication of the developed SWV and DPV methods was further established by determining RPG in untreated human urine samples. The recovery of RPG was examined using the standard addition protocol by adding known dosages of pure RPG to drug-free urine samples of healthy volunteers obtained upon their written consent and recording voltammograms. The calibration curve was utilized to calculate the amount of RPG in urine samples. The findings of the urine sample analysis are summarized in Table 4. The percentage recovery ranged from 98.0 to 99.6%, with RSD values ranging from 1.5 to 3.02%. These results demonstrate the electrode’s high repeatability in real sample analysis, confirming the electrode’s potential for practical utility.

3.12. Determination of RPG in Pharmaceutical Formulations

The fabricated sensor, SnO2@p-rGO/GCE, was successfully used in practice for the determination of RPG in tablets. The stock solution of the tablet sample was prepared as given in the experimental section. By proper dilution, the working tablet solution was prepared. Then, under optimal circumstances, differential pulse and square-wave voltammograms were recorded. For recovery studies, the standard addition method was used. Higher average recovery (97.60–99.60%) (Table 5) demonstrated the efficacy of the suggested approaches. Low RSD readings (below 3.0%) indicated that the recommended procedure was precise.
By applying Student’s t-test and the variance ratio F-test, the results of analysis of proposed methods were statistically compared to those obtained by the reported methods in the literature [6]. The results reveal that there was no notable difference in the accuracy of the suggested and reported procedures, as evidenced by the Student’s t-test values (Table 5), which were less than the tabulated value (2.132) at a 95% confidence level. Since F-calculated values (Table 5) were less than the tabulated value (6.39) at a 95% confidence level, we propose that there was no appreciable difference in precision between the reported and proposed methodologies.

3.13. Selectivity and Interference Studies

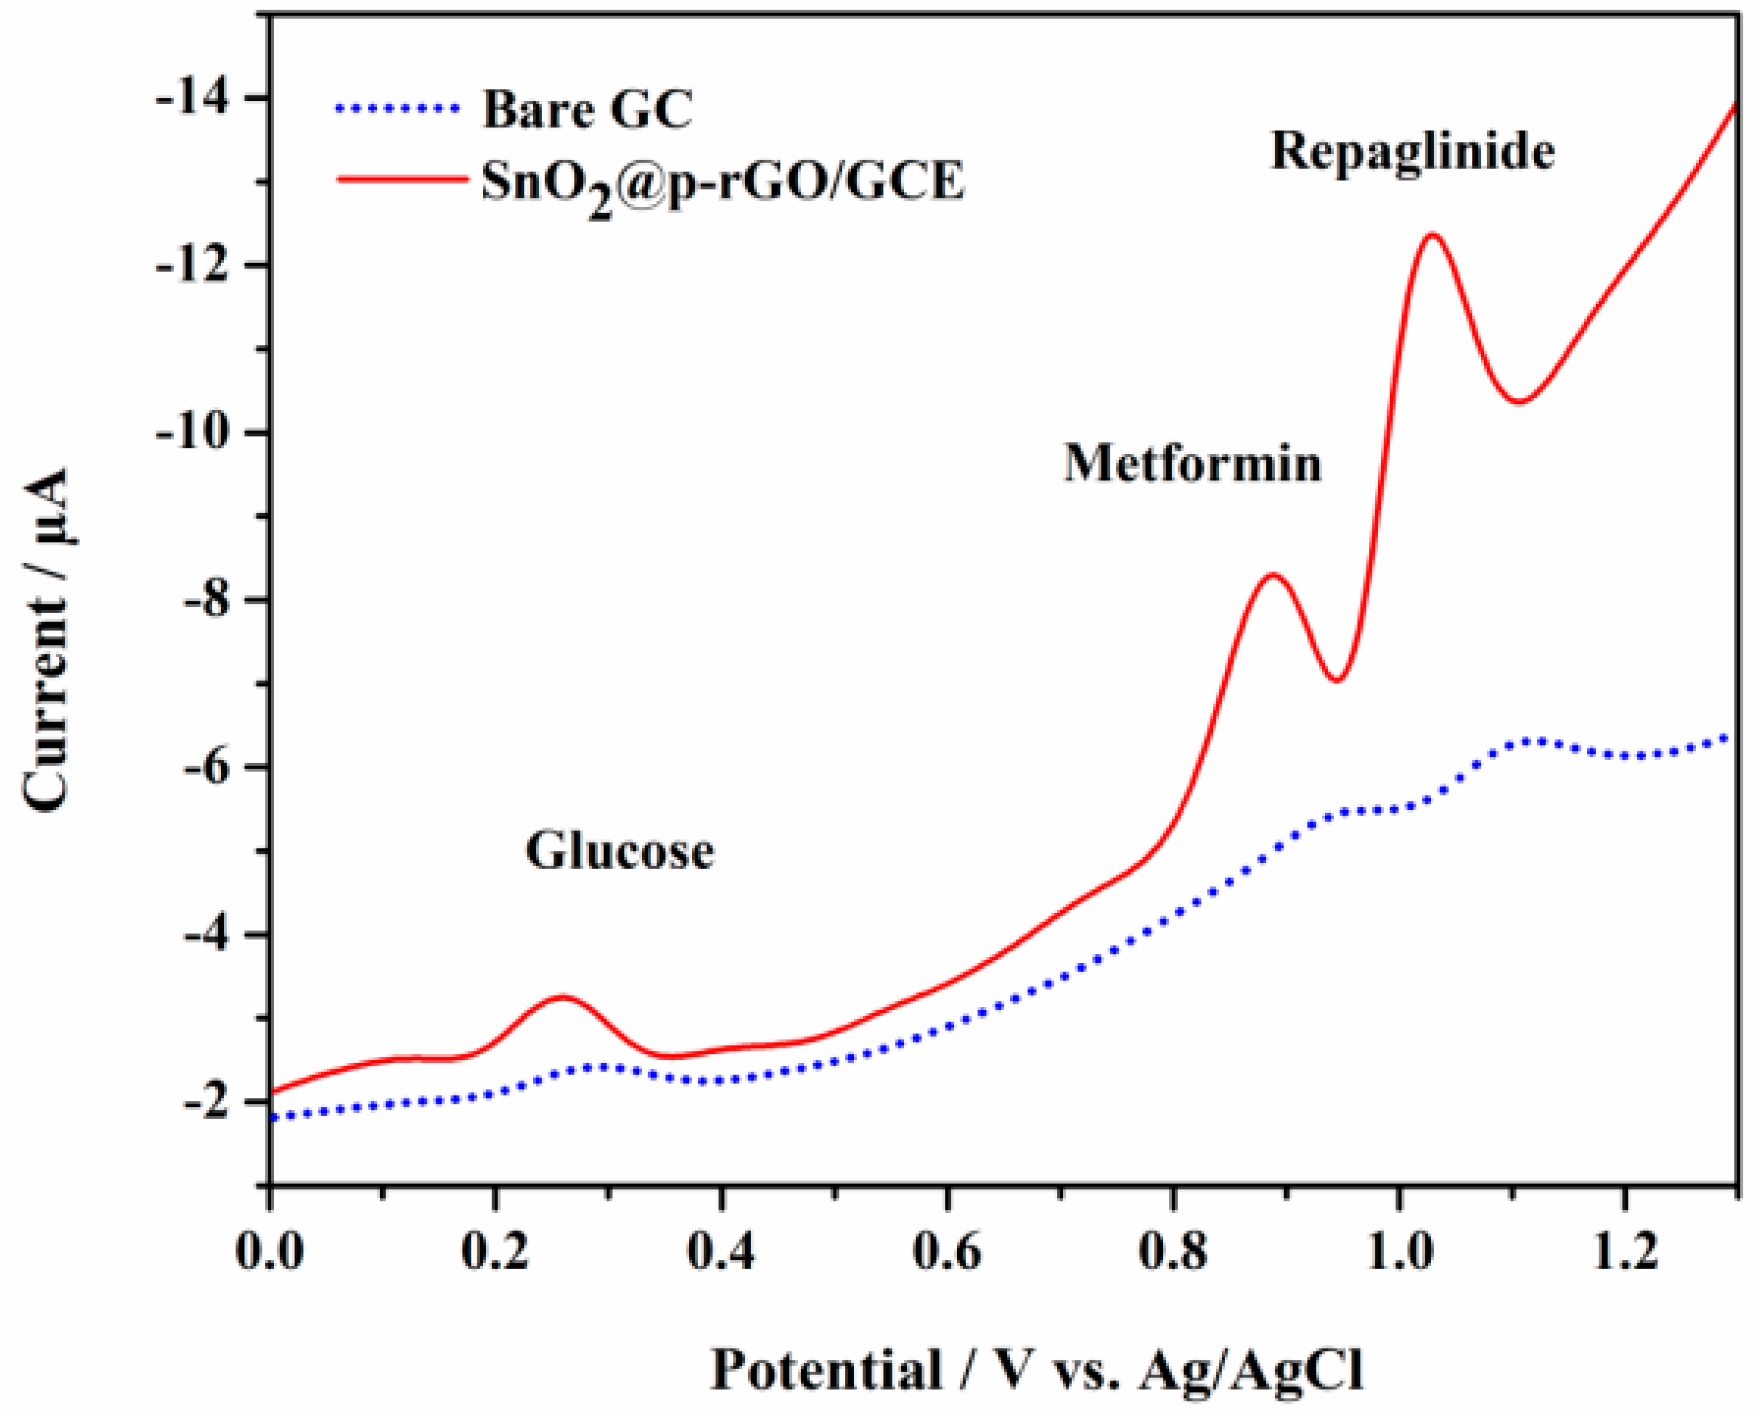
To investigate the selectivity of the proposed method using a newly developed sensor, SnO2@p-rGO/GCE, the effect of possible electroactive interfering species in the determination of RPG was evaluated. For this purpose, differential pulse and square-wave voltammograms of 5 µM RPG solutions were recorded in the presence of some chosen biologically active molecules. The SWV of 5 µM RPG in the presence of metformin and glucose at bare GCE and SnO2@p-rGO/GCE is shown in Figure 7. No peak corresponding glucose was noticed at bare GCE in PBS of pH 3, while a broad peak was observed for RPG and metformin. Three well-resolved anodic peaks were found at SnO2@p-rGO/GCE. The first one was due to oxidation of glucose to glucolactone that hydrolyses to gluconic acid in water to yield an anodic peak at 0.26 V. The second peak, noticed at 0.905 V, was attributed to the conversion of the imino group of guanidine moiety into N-hydroxy imino group of metformin, while the third peak corresponded to oxidation of RPG at 1.09 V.
Further, the effect of chosen interferents, viz. ascorbic acid, lactose, glucose, acacia, uric acid, and metformin, was examined in the determination of RPG under optimal conditions. As shown in Table S1, several folds of the aforementioned interferents did not significantly influence the peak current response of RPG. The results suggest that the proposed electrochemical sensor could be utilized to determine RPG selectively.

4. Conclusions

In summary, a facile, inexpensive, and sustainable protocol was developed for the fabrication of an electrochemical sensor, SnO2@p-rGO/GCE, that could be used for the determination of RPG. Glycine and aqueous extract of empty cotton boll peels were utilized to prepare p-rGO and SnO2. The morphological and structural characterization of SnO2@p-rGO was performed by XRD, SEM-EDX, Raman, FTIR, TGA, UV-vis, CV, and EIS measurements. The proposed electrochemical sensor exhibited selectivity and sensitivity for the determination of RPG due to the synergism between the larger surface area of SnO2 nanoparticles and the superior electronic characteristics of p-rGO. The pH-dependent irreversible oxidation peak was observed at all due to electro-oxidation of RPG with the participation of two electrons and two protons. The effect of pH and scan rate studies confirmed the adsorption-controlled electrode process. Between the DPV and SWV methods, the lower LOD of 8.50 × 10⁻¹⁰ mol L−1 was realized with the SWV method. This method exhibited linearity in the range of 1.99 × 10⁻⁸ to 1.45 × 10⁻⁵ mol L−1 RPG. The sensing platform, SnO2@p-rGO/GCE, was successfully demonstrated for the assay of RPG in pharmaceutical formulations and RPG-fortified urine samples with precise results and satisfactory recoveries. Therefore, the SnO2@p-rGO/GCE could be a good electrode for sensitive determination of RPG in clinical diagnostics and pharmaceutical industries.

Supplementary Materials

The following supporting information can be downloaded at: https://www.mdpi.com/article/10.3390/chemosensors11010050/s1. Figure S1: UV-visible absorption spectra of p-rGO (a), SnO2 (b), and SnO2@p-rGO (c); Figure S2: TGA curves for p-rGO (a) and SnO2/p-rGO (b); Figure S3: (A) Cyclic voltammograms of 10 μM RPG at different pH and (B) plot of Ep vs. pH; Figure S4: (A) Dependence of peak current on the amount of SnO2/p-rGO suspension and (B) accumulation time; Scheme S1: Plausible mechanism for the formation of SnO2 nanoparticles by cotton boll peel extract; Table S1: Tolerance of interferents in the determination of 2.26 μg mL−1 RPG using proposed sensor by SWV method.

Author Contributions

A.M.: Conceptualization, data curation, software, formal analysis, writing—original draft preparation. K.K.: Software, formal analysis. S.J.: Supervision, funding acquisition, methodology, investigation, project administration, resources, validation. S.K.: Visualization and editing. All authors have read and agreed to the published version of the manuscript.

Funding

Council of Scientific and Industrial Research (CSIR), New Delhi, Ref. No. 01(3068)/21/EMR-II dated 23-08-2021.

Institutional Review Board Statement

Not applicable.

Informed Consent Statement

Not applicable.

Data Availability Statement

Not applicable.

Acknowledgments

We thank the CSIR, New Delhi, for financial support to carry out this work. Thanks are also due to SAIF, Karnatak University, Dharwad, for instrumental facilities.

Conflicts of Interest

The authors declare no conflict of interest.

References

  1. Gumieniczek, A.; Berecka, A. Analytical Tools for Determination of New Oral Antidiabetic Drugs, Glitazones, Gliptins, Gliflozins and Glinides, in Bulk Materials, Pharmaceuticals and Biological Samples. Open Chem. 2016, 14, 215–242. Available online: https://doi.org/10.1515/CHEM-2016-0023/ASSET/GRAPHIC/J_CHEM-2016-0023_FIG_007.JPG (accessed on 25 November 2022). [CrossRef]
  2. Fuhlendorff, J.; Rorsman, P.; Kofod, H.; Brand, C.L.; Rolin, B.; MacKay, P.; Shymko, R.; Carr, R.D. Stimulation of Insulin Release by Repaglinide and Glibenclamide Involves both Common and Distinct Processes. Diabetes 1998, 47, 345–351. [Google Scholar] [CrossRef]
  3. Kim, J.M.; Seo, S.W.; Han, D.G.; Yun, H.; Yoon, I.S. Assessment of Metabolic Interaction between Repaglinide and Quercetin via Mixed Inhibition in the Liver: In Vitro and In Vivo. Pharmaceutics 2021, 13, 782. [Google Scholar] [CrossRef] [PubMed]
  4. Ding, D.; Wang, M.; Wu, J.X.; Kang, Y.; Chen, L. The Structural Basis for the Binding of Repaglinide to the Pancreatic KATP Channel. Cell Rep. 2019, 27, 1848–1857.e4. [Google Scholar] [CrossRef] [PubMed] [Green Version]
  5. Jirovský, D.; Bartošová, Z.; Skopalová, J.; Maier, V. Electrochemical Characterization of Repaglinide and Its Determination in Human Plasma Using Liquid Chromatography with Dual-Channel Coulometric Detection. J. Chromatogr. B 2010, 878, 3243–3248. [Google Scholar] [CrossRef]
  6. Dhole, S.M.; Amnerkar, N.D.; Khedekar, P.B. Comparison of UV Spectrophotometry and High Performance Liquid Chromatography Methods for the Determination of Repaglinide in Tablets. Pharm. Methods 2012, 3, 68–72. [Google Scholar] [CrossRef] [Green Version]
  7. Patel, D.; Patel, L.J.; Patel, M. Development and Validation of Stability Indicating Method for the Determination of Repaglinide in Pharmaceutical Dosage Form Using High Performance Liquid Chromatography. Int. J. ChemTech Res. 2011, 3, 539–546. [Google Scholar]
  8. Lakshmi, K.S.; Rajesh, T. Separation and Quantification of Eight Antidiabetic Drugs on a High-Performance Liquid Chromatography: Its Application to Human Plasma Assay. ISRN Pharm. 2011, 2011, 1–7. [Google Scholar] [CrossRef] [Green Version]
  9. Gumustas, M.; Coskun, G.; Ozkan, S.A. Selective and sensitive determination of repaglinide in pharmaceuticals by voltammetric and lc methods. Rev. Roum. Chim. 2015, 60, 477–490. [Google Scholar]
  10. Gandhimathi, M.; Ravi, T.K.; Renu, S.K. Determination of Repaglinide in Pharmaceutical Formulations by HPLC with UV Detection. Anal. Sci. 2003, 19, 1675–1677. [Google Scholar] [CrossRef] [Green Version]
  11. Wang, M.; Miksa, I.R. Multi-Component Plasma Quantitation of Anti-Hyperglycemic Pharmaceutical Compounds Using Liquid Chromatography-Tandem Mass Spectrometry. J. Chromatogr. B Analyt. Technol. Biomed. Life Sci. 2007, 856, 318–327. [Google Scholar] [CrossRef]
  12. Ho, E.N.M.; Yiu, K.C.H.; Wan, T.S.M.; Stewart, B.D.; Watkins, K.L. Detection of Anti-Diabetics in Equine Plasma and Urine by Liquid Chromatography-Tandem Mass Spectrometry. J. Chromatogr. B Analyt. Technol. Biomed. Life Sci. 2004, 811, 65–73. [Google Scholar] [CrossRef]
  13. Gumieniczek, A.; Berecka, A.; Hopkała, H. Quantitative Analysis of Repaglinide in Tablets by Reversed-Phase Thin-Layer Chromatography with Densitometric UV Detection. JPC—J. Planar Chromatogr.—Mod. TLC 2007, 18, 155–159. [Google Scholar] [CrossRef]
  14. Goyal, A.; Singhvi, I. Visible Spectrophotometric Methods for Estimation of Repaglinide in Tablet Formulation. Indian J. Pharm. Sci. 2006, 68, 656–657. [Google Scholar] [CrossRef] [Green Version]
  15. Tatiparthi, R.; Ramanjireddy, T.; Dhachinamoorthi, D.; Chandrasekhar, K.B. Pharmacokinetic Study of Repaglinide Floating Drug Delivery System in Rabbits by RP-HPLC Method Improving the Outpatient Medication Adherence towards the Chronic Diseases by Sending SMS to Remind the Dosing Instructions in Local Languages View Project Herbal Medicine Use: Clinical and Economic Outcomes View Project Pharmacokinetic Study of Repaglinide Floating Drug Delivery System in Rabbits by RP HPLC Method. Artic. J. Chin. Pharm. Sci. 2012, 21, 162–168. [Google Scholar] [CrossRef]
  16. Li, G.; Qi, X.; Wu, J.; Xu, L.; Wan, X.; Liu, Y.; Chen, Y.; Li, Q. Ultrasensitive, Label-Free Voltammetric Determination of Norfloxacin Based on Molecularly Imprinted Polymers and Au Nanoparticle-Functionalized Black Phosphorus Nanosheet Nanocomposite. J. Hazard. Mater. 2022, 436, 129107. [Google Scholar] [CrossRef] [PubMed]
  17. Li, G.; Wu, J.; Qi, X.; Wan, X.; Liu, Y.; Chen, Y.; Xu, L. Molecularly Imprinted Polypyrrole Film-Coated Poly(3,4-Ethylenedioxythiophene): Polystyrene Sulfonate-Functionalized Black Phosphorene for the Selective and Robust Detection of Norfloxacin. Mater. Today Chem. 2022, 26, 101043. [Google Scholar] [CrossRef]
  18. Ozcelikay, G.; Kaya, S.I.; Ozkan, E.; Cetinkaya, A.; Nemutlu, E.; Kır, S.; Ozkan, S.A. Sensor-Based MIP Technologies for Targeted Metabolomics Analysis. TrAC Trends Anal. Chem. 2022, 146, 116487. [Google Scholar] [CrossRef]
  19. Mathad, A.S.; Seetharamappa, J.; Kalanur, S.S. β-Cyclodextrin Anchored Neem Carbon Dots for Enhanced Electrochemical Sensing Performance of an Anticancer Drug, Lapatinib via Host-Guest Inclusion. J. Mol. Liq. 2022, 350, 118582. [Google Scholar] [CrossRef]
  20. Bilge, S.; Karadurmus, L.; Atici, E.B.; Sınağ, A.; Ozkan, S.A. A Novel Electrochemical Sensor Based on Magnetic Co3O4 Nanoparticles/Carbon Recycled from Waste Sponges for Sensitive Determination of Anticancer Drug Ruxolitinib. Sens. Actuators B Chem. 2022, 367, 132127. [Google Scholar] [CrossRef]
  21. Genidy, G.; Kamal, A.; Nabi, M.A. Electrochemical Determination of the Antidiabetic Drug Repaglinide. Yakugaku Zasshi 2008, 128, 171–177. [Google Scholar]
  22. Roushani, M.; Jalilian, Z. Development of Electrochemical Sensor Based on Glassy Carbon Electrode Modified with a Molecularly Imprinted Copolymer and Its Application for Detection of Repaglinide. Electroanalysis 2018, 30, 2712–2718. [Google Scholar] [CrossRef]
  23. Wang, Q.; Wang, X.; Chai, Z.; Hu, W. Low-Temperature Plasma Synthesis of Carbon Nanotubes and Graphene Based Materials and Their Fuel Cell Applications. Chem. Soc. Rev. 2013, 42, 8821–8834. [Google Scholar] [CrossRef] [PubMed]
  24. Kemp, K.C.; Seema, H.; Saleh, M.; Le, N.H.; Mahesh, K.; Chandra, V.; Kim, K.S. Environmental Applications Using Graphene Composites: Water Remediation and Gas Adsorption. Nanoscale 2013, 5, 3149–3171. [Google Scholar] [CrossRef] [PubMed] [Green Version]
  25. Huang, X.; Qian, K.; Yang, J.; Zhang, J.; Li, L.; Yu, C.; Zhao, D. Functional Nanoporous Graphene Foams with Controlled Pore Sizes. Adv. Mater. 2012, 24, 4419–4423. [Google Scholar] [CrossRef] [PubMed]
  26. Karaman, C.; Karaman, O.; Atar, N.; Yola, M.L. Tailoring of Cobalt Phosphide Anchored Nitrogen and Sulfur Co-Doped Three Dimensional Graphene Hybrid: Boosted Electrocatalytic Performance towards Hydrogen Evolution Reaction. Electrochim. Acta 2021, 380, 138262. [Google Scholar] [CrossRef]
  27. Yang, Y.; Ma, G.; Huang, J.; Nan, J.; Zhen, S.; Wang, Y.; Li, A. Hollow MnO2 Spheres/Porous Reduced Graphene Oxide as a Cathode Host for High-Performance Lithium-Sulfur Batteries. J. Solid State Chem. 2020, 286, 121297. [Google Scholar] [CrossRef]
  28. Van Hoa, N.; Dat, P.A.; Van Hieu, N.; Le, T.N.; Minh, N.C.; Van Tang, N.; Nga, D.T.; Ngoc, T.Q. Rapid and Efficient Synthesis of High-Porous Reduced Graphene Oxide/NiCo2S4 Nanocomposites for Supercapacitor Application. Diam. Relat. Mater. 2020, 106, 107850. [Google Scholar] [CrossRef]
  29. Qiu, H.J.; Guan, Y.; Luo, P.; Wang, Y. Recent Advance in Fabricating Monolithic 3D Porous Graphene and Their Applications in Biosensing and Biofuel Cells. Biosens. Bioelectron. 2017, 89, 85–95. [Google Scholar] [CrossRef]
  30. Zamani, P.; Higgins, D.C.; Hassan, F.M.; Fu, X.; Choi, J.Y.; Hoque, M.A.; Jiang, G.; Chen, Z. Highly Active and Porous Graphene Encapsulating Carbon Nanotubes as a Non-Precious Oxygen Reduction Electrocatalyst for Hydrogen-Air Fuel Cells. Nano Energy 2016, 26, 267–275. [Google Scholar] [CrossRef]
  31. Saisahas, K.; Soleh, A.; Somsiri, S.; Senglan, P.; Promsuwan, K.; Saichanapan, J.; Kanatharana, P.; Thavarungkul, P.; Lee, K.; Chang, K.H.; et al. Electrochemical Sensor for Methamphetamine Detection Using Laser-Induced Porous Graphene Electrode. Nanomaterials 2021, 12, 73. [Google Scholar] [CrossRef] [PubMed]
  32. Mahmood, F.; Sun, Y.; Wan, C. Biomass-Derived Porous Graphene for Electrochemical Sensing of Dopamine. RSC Adv. 2021, 11, 15410–15415. [Google Scholar] [CrossRef] [PubMed]
  33. Karaman, C.; Aktaş, Z.; Bayram, E.; Karaman, O.; Kizil, C. Correlation between the Molecular Structure of Reducing Agent and PH of Graphene Oxide Dispersion on the Formation of 3D-Graphene Networks. CS J. Solid State Sci. Technol. 2020, 9, 071003. [Google Scholar] [CrossRef]
  34. Yin, S.; Niu, Z.; Chen, X. Assembly of Graphene Sheets into 3D Macroscopic Structures. Small 2012, 8, 2458–2463. [Google Scholar] [CrossRef] [PubMed]
  35. Huang, X.; Sun, B.; Su, D.; Zhao, D.; Wang, G. Soft-Template Synthesis of 3D Porous Graphene Foams with Tunable Architectures for Lithium–O2 Batteries and Oil Adsorption Applications. J. Mater. Chem. A 2014, 2, 7973–7979. [Google Scholar] [CrossRef]
  36. Hassan Oghli, A.; Soleymanpour, A. Ultrasensitive Electrochemical Sensor for Simultaneous Determination of Sumatriptan and Paroxetine Using Molecular Imprinted Polymer/Sol-Gel/Polyoxometalate/RGO Modified Pencil Graphite Electrode. Sens. Actuators B Chem. 2021, 344, 130215. [Google Scholar] [CrossRef]
  37. Mehmandoust, M.; Erk, N.; Karaman, O.; Karimi, F.; Bijad, M.; Karaman, C. Three-Dimensional Porous Reduced Graphene Oxide Decorated with Carbon Quantum Dots and Platinum Nanoparticles for Highly Selective Determination of Azo Dye Compound Tartrazine. Food Chem. Toxicol. 2021, 158, 112698. [Google Scholar] [CrossRef]
  38. Xu, C.; Shi, X.; Ji, A.; Shi, L.; Zhou, C.; Cui, Y. Fabrication and Characteristics of Reduced Graphene Oxide Produced with Different Green Reductants. PLoS ONE 2015, 10, e0144842. [Google Scholar] [CrossRef] [Green Version]
  39. Fan, M.; Zhu, C.; Feng, Z.Q.; Yang, J.; Liu, L.; Sun, D. Preparation of N-Doped Graphene by Reduction of Graphene Oxide with Mixed Microbial System and Its Haemocompatibility. Nanoscale 2014, 6, 4882–4888. [Google Scholar] [CrossRef]
  40. Wang, J.; Salihi, E.C.; Šiller, L. Green Reduction of Graphene Oxide Using Alanine. Mater. Sci. Eng. C 2017, 72, 1–6. [Google Scholar] [CrossRef]
  41. Karimi-Maleh, H.; Karimi, F.; Fu, L.; Sanati, A.L.; Alizadeh, M.; Karaman, C.; Orooji, Y. Cyanazine Herbicide Monitoring as a Hazardous Substance by a DNA Nanostructure Biosensor. J. Hazard. Mater. 2022, 423, 127058. [Google Scholar] [CrossRef] [PubMed]
  42. Huang, Z.; Zhu, J.; Hu, Y.; Zhu, Y.; Zhu, G.; Hu, L.; Zi, Y.; Huang, W. Tin Oxide (SnO2) Nanoparticles: Facile Fabrication, Characterization, and Application in UV Photodetectors. Nanomaterials 2022, 12, 632. [Google Scholar] [CrossRef] [PubMed]
  43. Sharma, A.; Ahmed, A.; Singh, A.; Oruganti, S.K.; Khosla, A.; Arya, S. Review—Recent Advances in Tin Oxide Nanomaterials as Electrochemical/Chemiresistive Sensors. J. Electrochem. Soc. 2021, 168, 027505. [Google Scholar] [CrossRef]
  44. Singh, J.; Dutta, T.; Kim, K.H.; Rawat, M.; Samddar, P.; Kumar, P. ‘Green’ Synthesis of Metals and Their Oxide Nanoparticles: Applications for Environmental Remediation. J. Nanobiotechnol. 2018, 16, 84. [Google Scholar] [CrossRef]
  45. Narasaiah, B.P.; Banoth, P.; Sohan, A.; Mandal, B.K.; Dominguez, A.G.B.; Valladares, L.D.L.S.; Kollu, P. Green Biosynthesis of Tin Oxide Nanomaterials Mediated by Agro-Waste Cotton Boll Peel Extracts for the Remediation of Environmental Pollutant Dyes. ACS Omega 2022, 7, 15423–15438. [Google Scholar] [CrossRef]
  46. Saadat Niavol, S.; Milani Moghaddam, H. SnO2 Nanoparticles/Reduced Graphene Oxide Nanocomposite for Fast Ethanol Vapor Sensing at a Low Operating Temperature with an Excellent Long-Term Stability. J. Mater. Sci. Mater. Electron. 2021, 32, 6550–6569. [Google Scholar] [CrossRef]
  47. Cheng, J.P.; Wang, J.; Li, Q.Q.; Liu, H.G.; Li, Y. A Review of Recent Developments in Tin Dioxide Composites for Gas Sensing Application. J. Ind. Eng. Chem. 2016, 44, 1–22. [Google Scholar] [CrossRef]
  48. Hummers, W.S.; Offeman, R.E. Preparation of Graphitic Oxide. J. Am. Chem. Soc. 1958, 80, 1339. [Google Scholar] [CrossRef]
  49. Li, Y.; Zhang, L.; Hu, Z.; Yu, J.C. Synthesis of 3D Structured Graphene as a High Performance Catalyst Support for Methanol Electro-Oxidation. Nanoscale 2015, 7, 10896–10902. [Google Scholar] [CrossRef]
  50. Kumar, A.; Khandelwal, M. Amino Acid Mediated Functionalization and Reduction of Graphene Oxide—Synthesis and the Formation Mechanism of Nitrogen-Doped Graphene. New J. Chem. 2014, 38, 3457–3467. [Google Scholar] [CrossRef]
  51. Suresh, K.C.; Surendhiran, S.; Manoj Kumar, P.; Ranjth Kumar, E.; Khadar, Y.A.S.; Balamurugan, A. Green Synthesis of SnO2 Nanoparticles Using Delonix Elata Leaf Extract: Evaluation of Its Structural, Optical, Morphological and Photocatalytic Properties. SN Appl. Sci. 2020, 2, 1735. [Google Scholar] [CrossRef]
  52. Narasaiah, B.P.; Mandal, B.K. Remediation of Azo-Dyes Based Toxicity by Agro-Waste Cotton Boll Peels Mediated Palladium Nanoparticles. J. Saudi Chem. Soc. 2020, 24, 267–281. [Google Scholar] [CrossRef]
  53. Niu, X.; Li, X.; Chen, W.; Li, X.; Weng, W.; Yin, C.; Dong, R.; Sun, W.; Li, G. Three-Dimensional Reduced Graphene Oxide Aerogel Modified Electrode for the Sensitive Quercetin Sensing and Its Application. Mater. Sci. Eng. C 2018, 89, 230–236. [Google Scholar] [CrossRef]
  54. Feng, H.; Cheng, R.; Zhao, X.; Duan, X.; Li, J. A Low-Temperature Method to Produce Highly Reduced Graphene Oxide. Nat. Commun. 2013, 4, 1539. [Google Scholar] [CrossRef] [Green Version]
  55. Zhao, Y.; Li, H.; Li, Y.; Ma, Y.; Yang, H.; Liu, H.; Ren, X.; Zhao, H. Layered SnO2 Nanorods Arrays Anchored on Reduced Graphene Oxide for Ultra-High and Ppb Level Formaldehyde Sensing. Sens. Actuators B Chem. 2021, 346, 130452. [Google Scholar] [CrossRef]
  56. Sha, R.; Badhulika, S. Facile Green Synthesis of Reduced Graphene Oxide/Tin Oxide Composite for Highly Selective and Ultra-Sensitive Detection of Ascorbic Acid. J. Electroanal. Chem. 2018, 816, 30–37. [Google Scholar] [CrossRef]
  57. Fadillah, G.; Wicaksono, W.P.; Fatimah, I.; Saleh, T.A. A Sensitive Electrochemical Sensor Based on Functionalized Graphene Oxide/SnO2 for the Determination of Eugenol. Microchem. J. 2020, 159, 105353. [Google Scholar] [CrossRef]
  58. Choudhari, A.; Bhanvase, B.A.; Saharan, V.K.; Salame, P.H.; Hunge, Y. Sonochemical Preparation and Characterization of RGO/SnO2 Nanocomposite: Electrochemical and Gas Sensing Performance. Ceram. Int. 2020, 46, 11290–11296. [Google Scholar] [CrossRef]
  59. Bansode, S.R.; Khare, R.T.; Jagtap, K.K.; More, M.A.; Koinkar, P. One Step Hydrothermal Synthesis of SnO2-RGO Nanocomposite and Its Field Emission Studies. Mater. Sci. Semicond. Process. 2017, 63, 90–96. [Google Scholar] [CrossRef]
  60. Tao, Y.; Kong, D.; Zhang, C.; Lv, W.; Wang, M.; Li, B.; Huang, Z.H.; Kang, F.; Yang, Q.H. Monolithic Carbons with Spheroidal and Hierarchical Pores Produced by the Linkage of Functionalized Graphene Sheets. Carbon N. Y. 2014, 69, 169–177. [Google Scholar] [CrossRef]
  61. Li, G.; Shen, Y.; Zhou, P.; Hao, F.; Fang, P.; Wei, D.; Meng, D.; San, X. Design and Application of Highly Responsive and Selective RGO-SnO2 Nanocomposites for NO2 Monitoring. Mater. Charact. 2020, 163, 110284. [Google Scholar] [CrossRef]
  62. Huang, J.; Meng, C.; Wang, H.; Ren, H.; Lu, X.; Joo, S.W. Preparation of Cross-Linked Porous SnO2 Nanosheets Using Three-Dimensional Reduced Graphene Oxide as a Template and Their Gas Sensing Property. J. Alloys Compd. 2022, 910, 164763. [Google Scholar] [CrossRef]
  63. Yu, X.; Wu, Q.; Zhang, H.; Zeng, G.; Li, W.; Qian, Y.; Li, Y.; Yang, G.; Chen, M. Investigation on Synthesis, Stability, and Thermal Conductivity Properties of Water-Based SnO2/Reduced Graphene Oxide Nanofluids. Materials 2018, 11, 38. [Google Scholar] [CrossRef] [PubMed]
  64. Alizadeh, M.; Mehmandoust, M.; Nodrat, O.; Salmanpour, S.; Erk, N. A Glassy Carbon Electrode Modified Based on Molybdenum Disulfide for Determination of Folic Acid in the Real Samples. J. Food Meas. Charact. 2021, 15, 5622–5629. [Google Scholar] [CrossRef]
  65. Mehmandoust, M.; Çakar, S.; Özacar, M.; Salmanpour, S.; Erk, N. Electrochemical Sensor for Facile and Highly Selective Determination of Antineoplastic Agent in Real Samples Using Glassy Carbon Electrode Modified by 2D-MoS2 NFs/TiO2 NPs. Top. Catal. 2021, 65, 564–576. [Google Scholar] [CrossRef]
  66. Yu, L.; Zhang, Q.; Yang, B.; Xu, Q.; Xu, Q.; Hu, X. Electrochemical Sensor Construction Based on Nafion/Calcium Lignosulphonate Functionalized Porous Graphene Nanocomposite and Its Application for Simultaneous Detection of Trace Pb2+ and Cd2+. Sens. Actuators B Chem. 2018, 259, 540–551. [Google Scholar] [CrossRef]
  67. Yu, X.; Sheng, K.; Shi, G. A Three-Dimensional Interpenetrating Electrode of Reduced Graphene Oxide for Selective Detection of Dopamine. Analyst 2014, 139, 4525–4531. [Google Scholar] [CrossRef] [Green Version]
  68. Laviron, E.; Roullier, L. General Expression of the Linear Potential Sweep Voltammogram for a Surface Redox Reaction with Interactions between the Adsorbed Molecules: Applications to Modified Electrodes. J. Electroanal. Chem. Interfacial Electrochem. 1980, 115, 65–74. [Google Scholar] [CrossRef]
  69. Laviron, E. General Expression of the Linear Potential Sweep Voltammogram in the Case of Diffusionless Electrochemical Systems. J. Electroanal. Chem. Interfacial Electrochem. 1979, 101, 19–28. [Google Scholar] [CrossRef]
  70. Bourlinos, A.B.; Stassinopoulos, A.; Anglos, D.; Zboril, R.; Karakassides, M.; Giannelis, E.P. Surface Functionalized Carbogenic Quantum Dots. Small 2008, 4, 455–458. [Google Scholar] [CrossRef]
  71. Grimshaw, J. Chapter 6—Oxidation of Aromatic Rings. Electrochem. React. Mech. Org. Chem. 2000, 203–218. Available online: https://books.google.co.in/books?hl=en&lr=&id=kGWj4pLZY6wC&oi=fnd&pg=PP1&dq=+Oxidation+of+Aromatic+Rings.+by++Grimshaw,+&ots=2PcmIf0mjA&sig=RLSwtcuhEBpcuUcheExLQ8vyZzU#v=onepage&q=Oxidation%20of%20Aromatic%20Rings.%20by%20%20Grimshaw%2C&f=false (accessed on 22 November 2022).
  72. Özkan, S.A.; Özkan, Y.; Şentürk, Z. Electrooxidation of Pimozide and Its Differential Pulse Voltammetric and HPLC–EC Determination. Anal. Chim. Acta 2002, 453, 221–229. [Google Scholar] [CrossRef]
  73. Zhang, H.; Bo, X.; Guo, L. Electrochemical Preparation of Porous Graphene and Its Electrochemical Application in the Simultaneous Determination of Hydroquinone, Catechol, and Resorcinol. Sens. Actuators B Chem. 2015, 220, 919–926. [Google Scholar] [CrossRef]
Scheme 1. Structure of repaglinide.
Chemosensors 11 00050 sch001
Scheme 2. Schematic representation of fabrication process of modified electrode.
Chemosensors 11 00050 sch002
Figure 1. SEM images of (A) GO, (B) p-rGO, (C) SnO2 (Inset: particles size distribution histogram), and (D) SnO2@p-rGO. (E) EDX micrograph of SnO2@p-rGO; inset graph represents elemental composition of SnO2@p-rGO. (F) Powder XRD pattern of GO (a), SnO2 (b), p-rGO (c), and SnO2@p-rGO (d).
Chemosensors 11 00050 g001
Figure 2. (A) Raman spectra and (B) FTIR spectra of p-rGO (a) and SnO2/p-rGO (b).
Chemosensors 11 00050 g002
Figure 3. (A) Cyclic voltammograms and (B) impedance spectra of 1 mM [Fe(CN)6]3−/4− at bare GCE (a), SnO2 (b), p-rGO (c), and SnO2/p-rGO (d) in 0.1 M KCl. Inset in (B) shows equivalent circuit for modified GCE.
Chemosensors 11 00050 g003
Figure 4. Cyclic voltammograms of 10 µM RPG at bare GCE (a), SnO2 (b), p-rGO (c), and SnO2/p-rGO (d) in phosphate buffer of pH 3.
Chemosensors 11 00050 g004
Figure 5. (A) Cyclic voltammograms of 10 μM RPG (at pH 3) at the scan rate range of 10–350 mV s−1 and (B) dependence of log Ipa on log υ.
Chemosensors 11 00050 g005
Scheme 3. Plausible mechanism of oxidation of RPG.
Chemosensors 11 00050 sch003
Figure 6. (A) Differential pulse and (B) square-wave voltammograms for increasing concentration of RPG in phosphate buffer of pH 3 and respective calibration plots (Inset).
Chemosensors 11 00050 g006
Figure 7. SWV of PBS solution (pH 3) containing 5 μM RPG with metformine and glucose monitored at bare GCE and SnO2@p-rGO/GCE.
Chemosensors 11 00050 g007
Table 1. Electrochemical characteristics of different modified electrodes.
Voltammetric ResultsImpedance Spectroscopic Results
Modified GCEArea
(cm2)
ΔEp
(mV)
Ip
(µA)
Rct
(Ω cm2)
Rs
(Ω cm2)
CPE
(µF cm−2)
nW0
(kΩ cm2)
SnO2@p-rGO/GCE 0.5947051.7228.71.114.1370.8902.45 × 10−4
p-rGO/GCE0.1157541.87162.31.063.1200.8711.56 × 10−4
SnO2/GCE0.0887930.45486.51.123.3260.8231.21 × 10−4
Bare GCE0.0588514.20738.61.184.3720.7981.26 × 10−4
Table 2. Characteristics of the calibration plot for the determination of RPG.
ParametersDPVSWV
Linearity range, mol L−14.99 × 10⁻⁸–1.83 × 10−51.99 × 10−8–1.45 × 10⁻⁵
LOD, mol L−19.02 × 10−98.50 × 10−10
LOQ, mol L−13.00 × 10−82.83 × 10−9
Inter-day assay, RSD * (%)2.452.19
Intra-day assay, RSD * (%)1.742.23
* Average of 5 determinations.
Table 3. Comparison of analytical range and detection limits of the proposed methods with those of reported methods.
MethodLinearity RangeLODLOQRef.
HPLC a5–50 μg/mL0.73 μg/mL2.21 μg/mL[6]
HPLC0.5–3 μg/mL0.056 μg/mL0.172 μg/mL[7]
HPLC50–2000 ng/mL-20 ng/mL[8]
HPLC-EC b-0.017µg/mL0.051 µg/mL[9]
HPLC-UV c0.1–0.5 μg/mL--[10]
LC-MS/MS d-1.0 ng/mL-[12]
RPTLC e0.6–3.6 µg/10 μL0.08 µg/10 µL0.27 µg/10 µL[13]
RP-HPLC f110–550 ng/mL-110 ng/mL[15]
Differential pulse voltammetry [19]
Carbon paste electrode, CPE0.36–1.44 µg/mL0.0161 µg/mL0.203 µg/mL
Glassy carbon electrode, GCE0.18–1.81 µg/mL0.048 µg/mL0.160 µg/mL
MIP-PoDB/PoPD/GCE g0.002–0.452 µg/mL0.8 ng/mL-[20]
DPV (SnO2@p-rGO/GCE)
Square-wave voltammetry0.02–8.14 µg/mL4.08 ng/mL13.5 ng/mL
SWV (SnO2@p-rGO/GCE)0.009–6.56 µg/mL0.38 ng/mL1.28 ng/mLProposed work
a High-performance liquid chromatography method; b High-performance liquid chromatography–Electrochemical method; c High-performance liquid chromatography–Ultraviolet method; d Liquid chromatography–tandem mass spectrometric method; e Reversed phase thin-layer chromatographic method; f Reversed-phase-HPLC method; g Electropolymerized o-dihydroxy benzene (o-DB) and o-phenylenediamine (o-PD) modified GCE.
Table 4. Results of analysis of RPG in spiked human urine samples.
Proposed
Method
Amount of RPG Added, μMnAmount Found, μMAverage Recovery (%)RSD, %
0.150.09898.03.02
DPV0.2550.24899.21.95
0.550.49599.02.56
0.150.09999.02.50
SWV0.2550.24999.61.50
0.550.49799.42.38
Table 5. Results of analysis of RPG in pharmaceutical formulations by DPV and SWV methods.
DPVSWV
Eurepa MF1 bRipadep cEurepa MF1Ripadep
Labeled amount, mg0.510.501.00
Amount found, mg0.4850.9960.490.997
Recovery, %97.0099.698.0099.70
RSD a, %2.341.982.512.86
t-Value at 95% confidence level1.64-0.16-
F-Value at 95% confidence level2.37-4.39-
Pure RPG added, mg0.250.30.250.3
Amount found, mg0.2440.2940.2480.299
Recovery, %97.6098.0099.2099.60
RSD a, %2.463.062.602.76
a Average of 5 replicates; b Torrent Pharmaceuticals Ltd., Ahmedabad, India; c Globus Labs.
Disclaimer/Publisher’s Note: The statements, opinions and data contained in all publications are solely those of the individual author(s) and contributor(s) and not of MDPI and/or the editor(s). MDPI and/or the editor(s) disclaim responsibility for any injury to people or property resulting from any ideas, methods, instructions or products referred to in the content.