Article

Li6BaLa2Ta2O12 Solid-State Probe for Studying Li Activity in Molten Sn-Li Alloys

Electrochemical Methods Laboratory–Analytical and Applied Chemistry Department, IQS School of Engineering, Universitat Ramon Llull, Via Augusta 390, 08017 Barcelona, Spain
*
Author to whom correspondence should be addressed.
Chemosensors 2023, 11(1), 6; https://doi.org/10.3390/chemosensors11010006
Submission received: 18 November 2022 / Revised: 13 December 2022 / Accepted: 20 December 2022 / Published: 21 December 2022
(This article belongs to the Section Applied Chemical Sensors)

Abstract

:
Metals or alloys that are liquid at or near room temperature are of interest of the scientific community due to the versatility of their applications. Considering the nuclear fusion energy applications, Sn-Li alloys appear as a great candidate for plasma facing materials. However, plasma interactions can induce alterations on the lithium concentration and, as a consequence, modify the properties of the LM. Therefore, in order to prevent these situations, thermodynamic data such as activity coefficients and analytical devices capable of monitoring the lithium content in these alloys are of great interest. In this work, a lithium sensor based on the Li6BaLa2Ta2O12 solid-state electrolyte was used to determine lithium activity correlations for Sn-Li alloys at 400 and 500 °C. It was observed that the activity coefficient was constant for lithium concentrations lower than 8.5 at% with values, at the infinite dilution condition, of 8.4·10−5 at 400 °C and 2.7·10−4 at 500 °C, respectively. Above this concentration (from 8.5 to 16.5 at% Li), the activity coefficient varied with lithium concentration. In this case, correlations between lithium activity and the lithium atomic fraction were obtained.

1. Introduction

Liquid metals or alloys (LM) have recently gained attention from the scientific community. This class of materials is characterised by having low melting points (i.e., between room temperature and 300 °C [1]). These LM have outstanding properties due to their electron-rich metallic cores such as high density, electrical and thermal conductance, excellent physical characteristics and unique chemical properties [2,3,4]. These materials can offer great applicability in fields ranging from nuclear engineering to material sciences and medicine.
LM have also been applied in bulk synthesis over the past few decades [5]. LM can be used as an inactive solvent for the obtention of intermetallic compounds. In this case, LM facilitate the solubility of the adducts and, therefore, enhance the synthesis of these intermetallic compounds [6,7].
Three-dimensional printing and other additive manufacturing techniques are likewise implementing LM [8,9]. They can be easily extruded out of a nozzle, allowing the obtention of complex shapes. This application may include the printing of LM onto surfaces, as well as the creation of free-standing structures.
Apart from mercury, other LM were proposed as energy storage media such as batteries [10,11,12]. Because these materials are in a liquid state, dendrite growth or even electrode cracking cannot occur. Moreover, the high conductivity values reported for the LM enhance the efficiency and allow the optimization of the battery design [11,12]. Furthermore, the characterization of batteries based on LM shows good cycle performance as well as an increased lifetime [10].
LM are also considered for their use in nuclear fusion reactors. For example, lithium is needed for the in situ fuel generation in these devices [13,14]. Molten lead–lithium appears as a good candidate not only for its lithium content but also for the neutron multiplicity property of lead, which enhances the fuel production [15]. Moreover, LM such as lithium, gallium, tin or its alloys are also considered for plasma-facing materials in nuclear fusion reactors [16].
Tungsten has been considered as the most interesting solid plasma-facing material. However, surface cracking or surface modifications in solid-state components due to interactions are problems that are still unresolved [17]. In this field, LM are a good alternative because they are very resistant to plasma and neutron irradiation and do not need to be continuously replaced because they can be recirculated and regenerated. All these positive aspects have caused the scientific community to work for their implementation in future fusion reactors [18].
Lithium is by far the best-known liquid metal applied to fusion [19,20]. However, its high evaporation rate limits the maximum temperature that these materials can exhibit. Considering tin and gallium, both have emerged as interesting candidates due to a lack of this issue. Currently, some studies are being performed under plasma conditions for these two elements [21]. However, the high Z number of these elements appears as a disadvantage because plasma contaminations can occur.
Instead, tin–lithium alloys appear as an outstanding candidate because the evaporation of this material is observed to be at least three orders of magnitude lower than lithium [22]. Hence, it is possible to use these materials at much higher temperatures. However, it should be noted that the plasma interaction with this material could induce alterations in the surface composition. The total depletion of lithium will then lead to a pure tin condition with the associated plasma contamination issues [22]. Therefore, in order to prevent these situations, thermodynamic data such as activity coefficients and analytical devices capable of monitoring the lithium content in these alloys are of great interest.
Different methods are described in the literature for the determination of the activities and activity coefficients in molten metal alloys [23,24,25]. For a direct measurement, two different experimental set-ups can be used: (i) the measurement of the effusion rate using a Kneudsen effusion cell and (ii) the measurement of the potential difference in a concentration cell. The former method consists of the calculation of the vapour pressure from the effusion rate of vapour in equilibrium with the alloy. The effusion rate can be calculated from the mass loss of the sample as a function of time. Then, the activity of a substance in the alloy can be defined as the ratio of the vapour pressure of the substance to that of a pure substance [26]. The latter method, which is the one selected in the present work, consists of the use of potentiometric sensors to relate the activity of the desired element in an unknown system with the established activity in a reference system, using the Nernst equation [27]. This method is simpler but needs the use of selective electrolytes for the desired element and a reference system. In this work, a potentiometric lithium sensor based on the Li6BaLa2Ta2O12 solid-state electrolyte was used to determine lithium activity data for Sn-Li alloys as a function of the lithium content and the alloy temperature.

2. Materials and Methods

2.1. Synthesis, Sintering and Characterisation of the Lithium Solid-State Electrolyte

Li6BaLa2Ta2O12 (Identification code: LBLTO) was synthesised by solid-state reaction and sintered as pellets (Ø = 13 mm), as described in previous work [28]. Then, the crystal structure of the LBLTO pellets was determined by X-ray diffraction (XRD), with a Malvern Panalytical Empyrean diffractometer (Malvern, UK) using Cu Kα radiation. A JEOL JSM-5310 (Tokyo, Japan) scanning electron microscope (SEM) was used to analyse the surface microstructure of the pellets [28].
Electrochemical impedance spectroscopy (EIS) was used to measure the ionic conductivity of the LBLTO solid-state electrolyte. First, LBLTO pellets surfaces were gold-sputtered (Surface coated: 80 mm2) using a Polaron SC7620 (Hertfordshire, UK). Then, the electrolyte was placed in the centre of the setup (see Figure 1) and two stainless steel springs were used to ensure electric contact between the electrolyte and the electrodes. Moreover, springs avoided the collapse of the sample due to dilatation at high temperatures. These springs were attached to the electrodes, which were insulated from the metallic housing using two feedthroughs. Finally, the reactor was heated with a clamp-type electrical resistance (600 W) that was regulated with a PID-type temperature controller. Glass wool was used to avoid any temperature fluctuation. Finally, the assembly was placed in a glovebox (High purity Ar atmosphere 99.9992%, O2 and H2O concentrations <1 ppm, MBraun UNIlab, Garching, Germany).
EIS measurements were performed using a Metrohm Autolab PGSTAT 302N equipped with a FRA2 module (Herisau, Switzerland). The frequency range was set from 1 MHz to 10 Hz, and 10 points of frequency per decade were collected. Amplitude was modified according to the decrease in the resistance of the material as the temperature was raised from 30 to 300 °C.

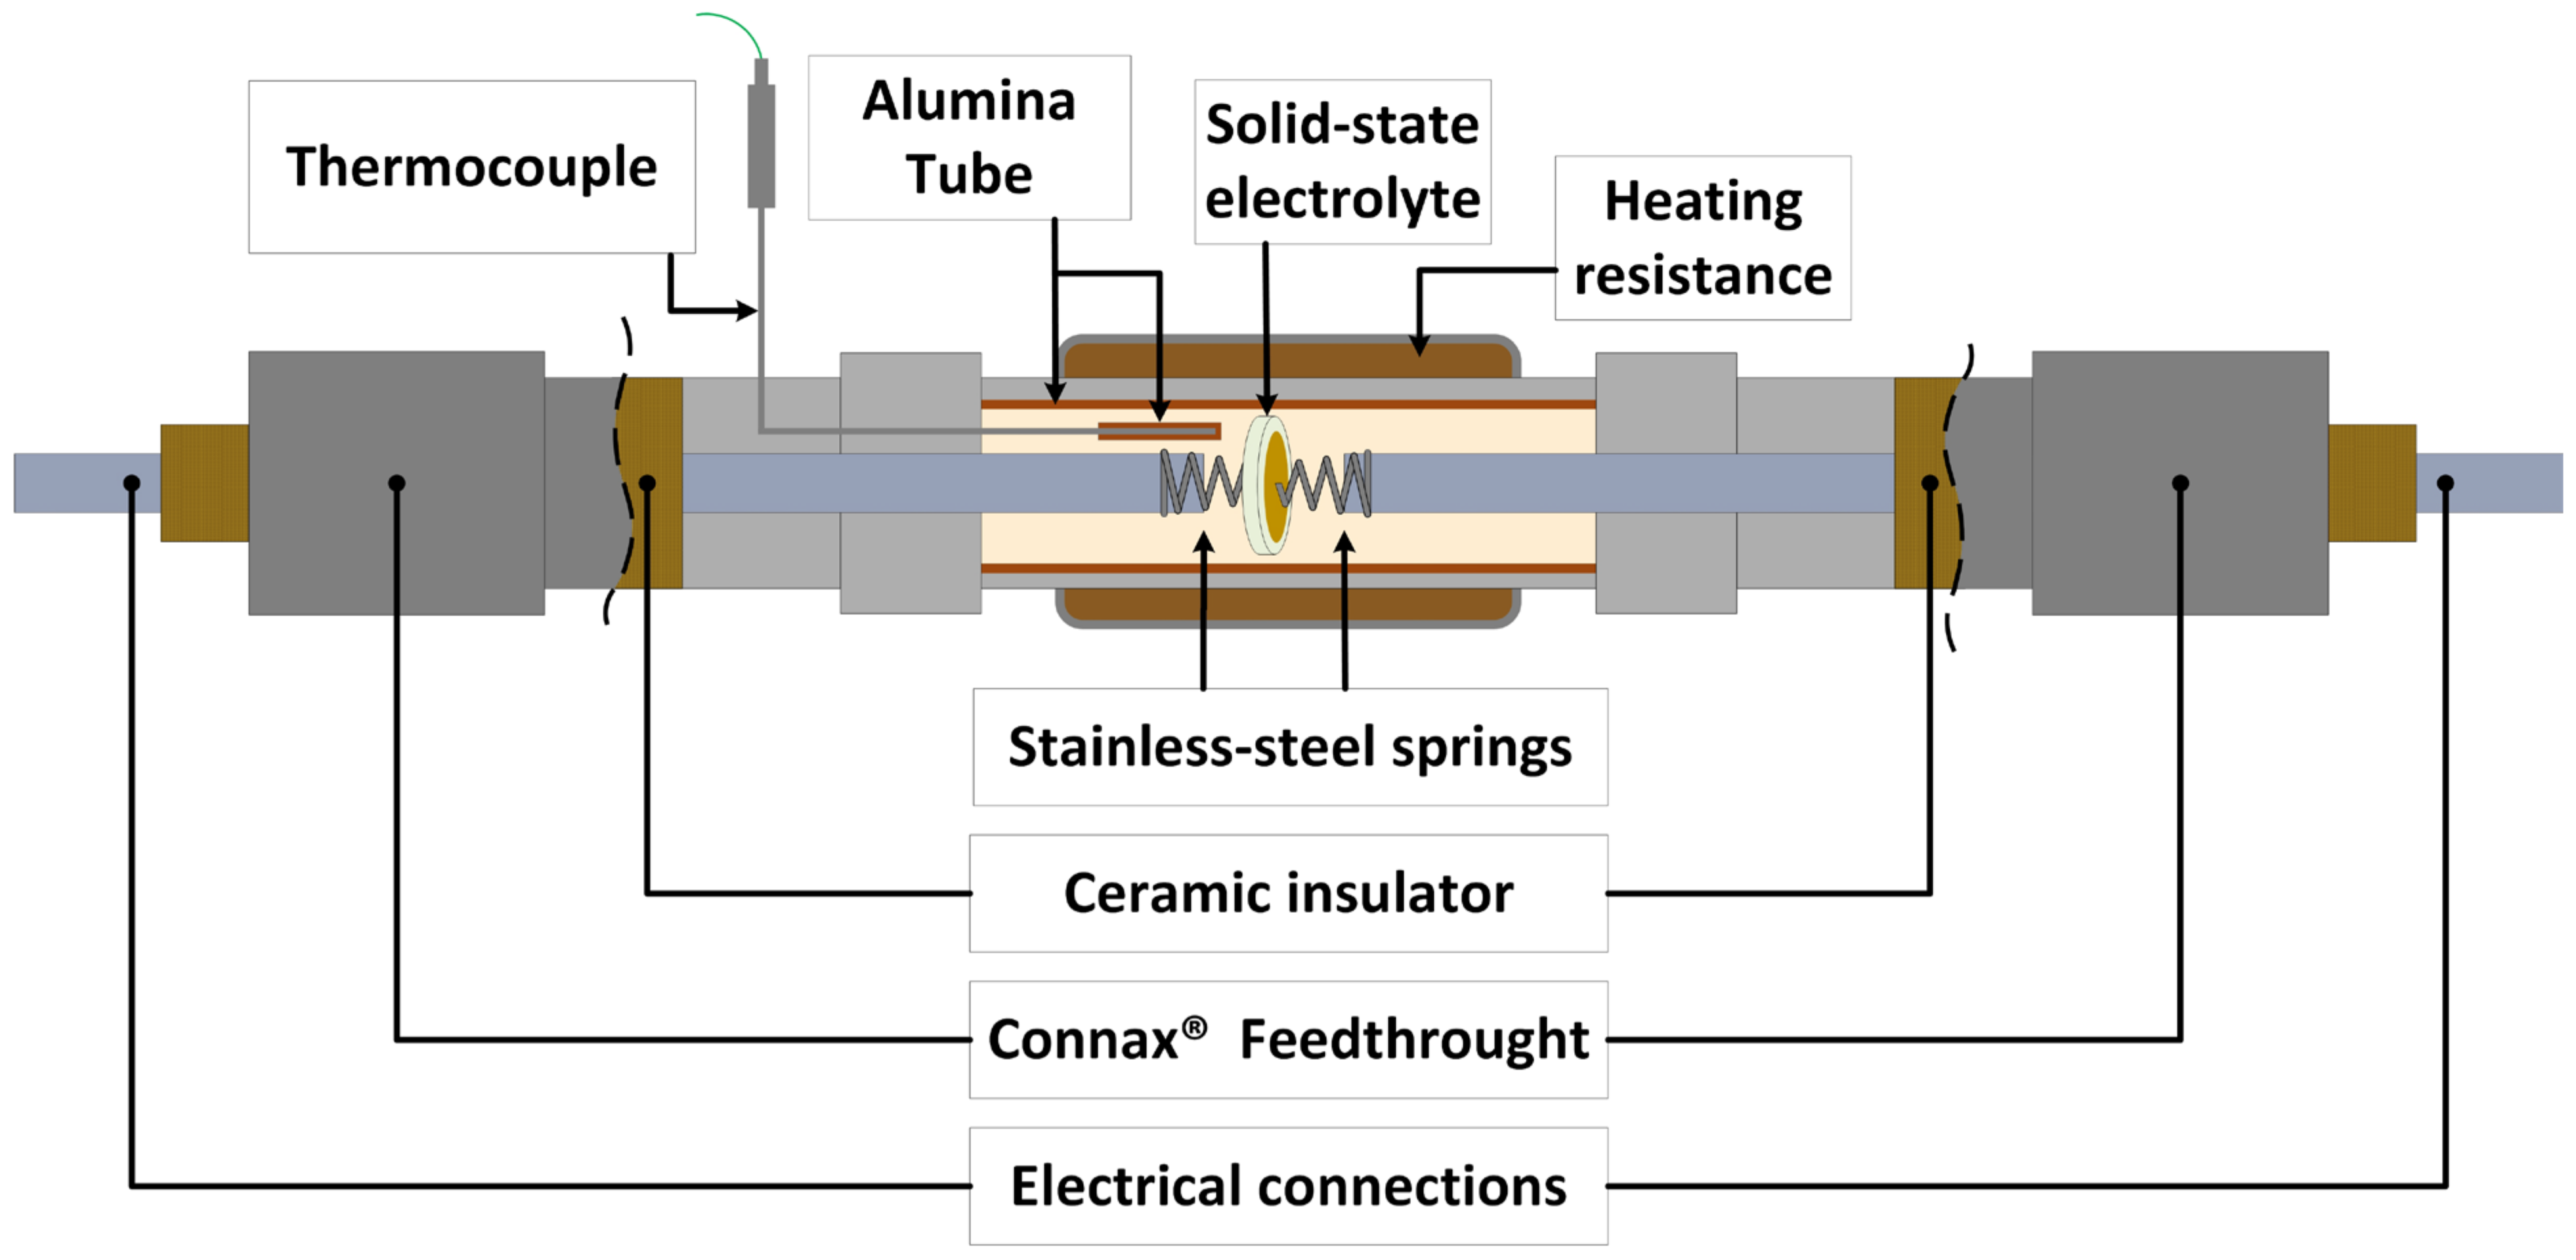
2.2. Sensor Construction

The lithium sensors were constructed by binding with a glass cement the sintered pellets to alumina tubes (Al-23 tube, Øint = 10 mm, Øext = 15 mm, and L = 30 mm, Alfa Aesar, Tewksbury, MA, USA). Then, the binder was cured at 900 °C for 1 h. Figure 2 shows a schematic representation of the sensor assembly and the experimental set-up.
The sensor works as a concentration cell. On the one hand, the inner compartment was filled with Sn-Li alloy with 3.04 at% Li (Sn-3.04Li). On the other hand, different Li concentrations of molten alloys of Sn-Li (from 3.00 to 16.50 at% Li with melting points ranging between 220 °C to 290 °C) or Pb-Li alloys (from 3.05 to 15.53 at% Li with melting points ranging between 235 °C to 313 °C) were used in the outer compartment. Electrodes were connected to a high-impedance voltmeter (Metrohm Autolab PGSTAT302N, Herisau, Switzerland) using molybdenum wires (99.95%, Alfa Aesar, Tewksbury, MA, USA) and its potential difference was measured at 400 and 500 °C.
The theoretical potential difference is defined using the Nernst equation (see Equation (1)):
Δ E =   RT nF ln a Li Pb - Li / Sn - Li a Li Sn - Li
The components in Equation (1) are the universal gas constant (R = 8.314 J·K−1·mol−1), the temperature (T, in K), the number of electrons involved in the electrochemical reaction (n), the Faraday constant (F = 96,485 C·mol−1) and the lithium activity (aLi).
The electrochemical measurements were performed in a stainless-steel reactor placed inside a glovebox (MBraun UNIlab, Garching, Germany) with a high-purity argon atmosphere (99.9992% with O2 and H2O concentrations <1 ppm). The temperature was controlled with a PID temperature controller (Fuji PXR4, Tokyo, Japan) connected to a K-type thermocouple and a clamp-type heating resistance (1500 W). To assure a stable temperature, the reactor was covered with glass wool (Kaowool® Blanket, Morgan thermal ceramics, Windsor, UK).

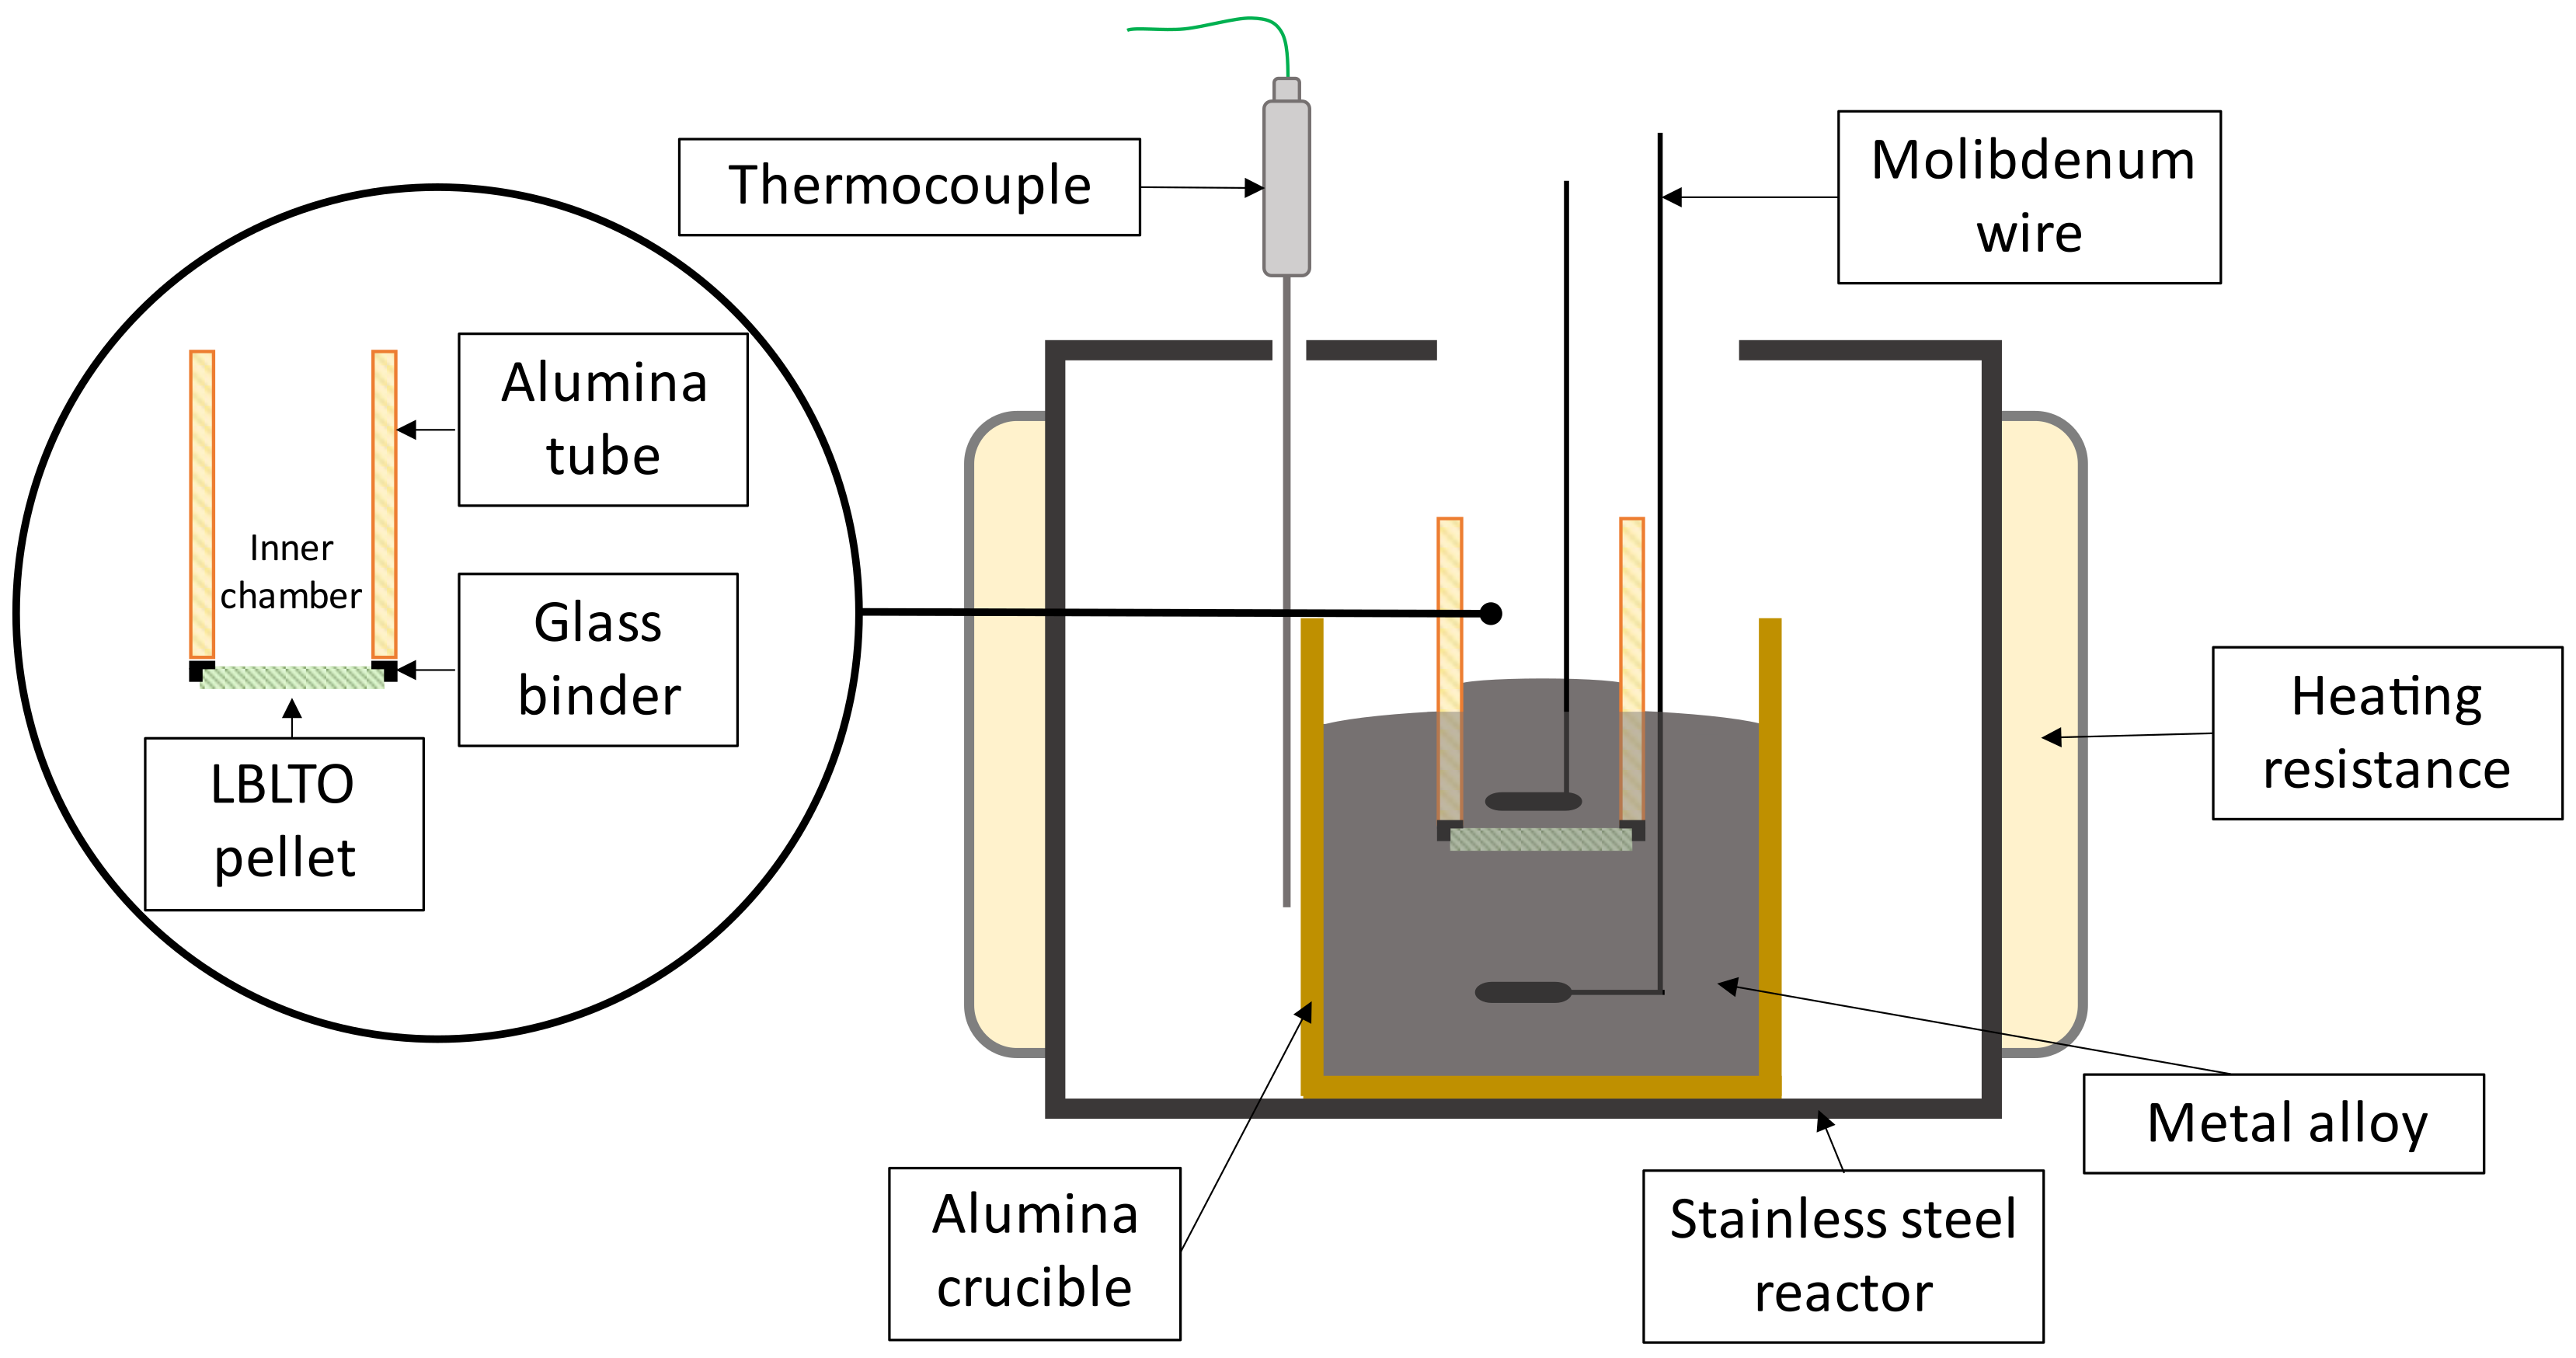
2.3. Synthesis of Sn-Li and Pb-Li Alloys

Li alloys were prepared by mixing the required lithium quantities (granular, 99%, Sigma Aldrich, St. Louis, MO, USA) and lead (rod, 99.95%, Goodfellow, Hamburg, Germany) or tin (granulated, 99.95%, Scharlau, Barcelona, Spain) inside a glovebox (High purity Ar atmosphere 99.9992%, O2 and H2O concentrations <1 ppm, MBraun UNIlab, Garching, Germany). Both metals (Sn-Li or Pb-Li) were melted in an alumina crucible and manually mixed with an alumina rod until a homogenous mixture was obtained.

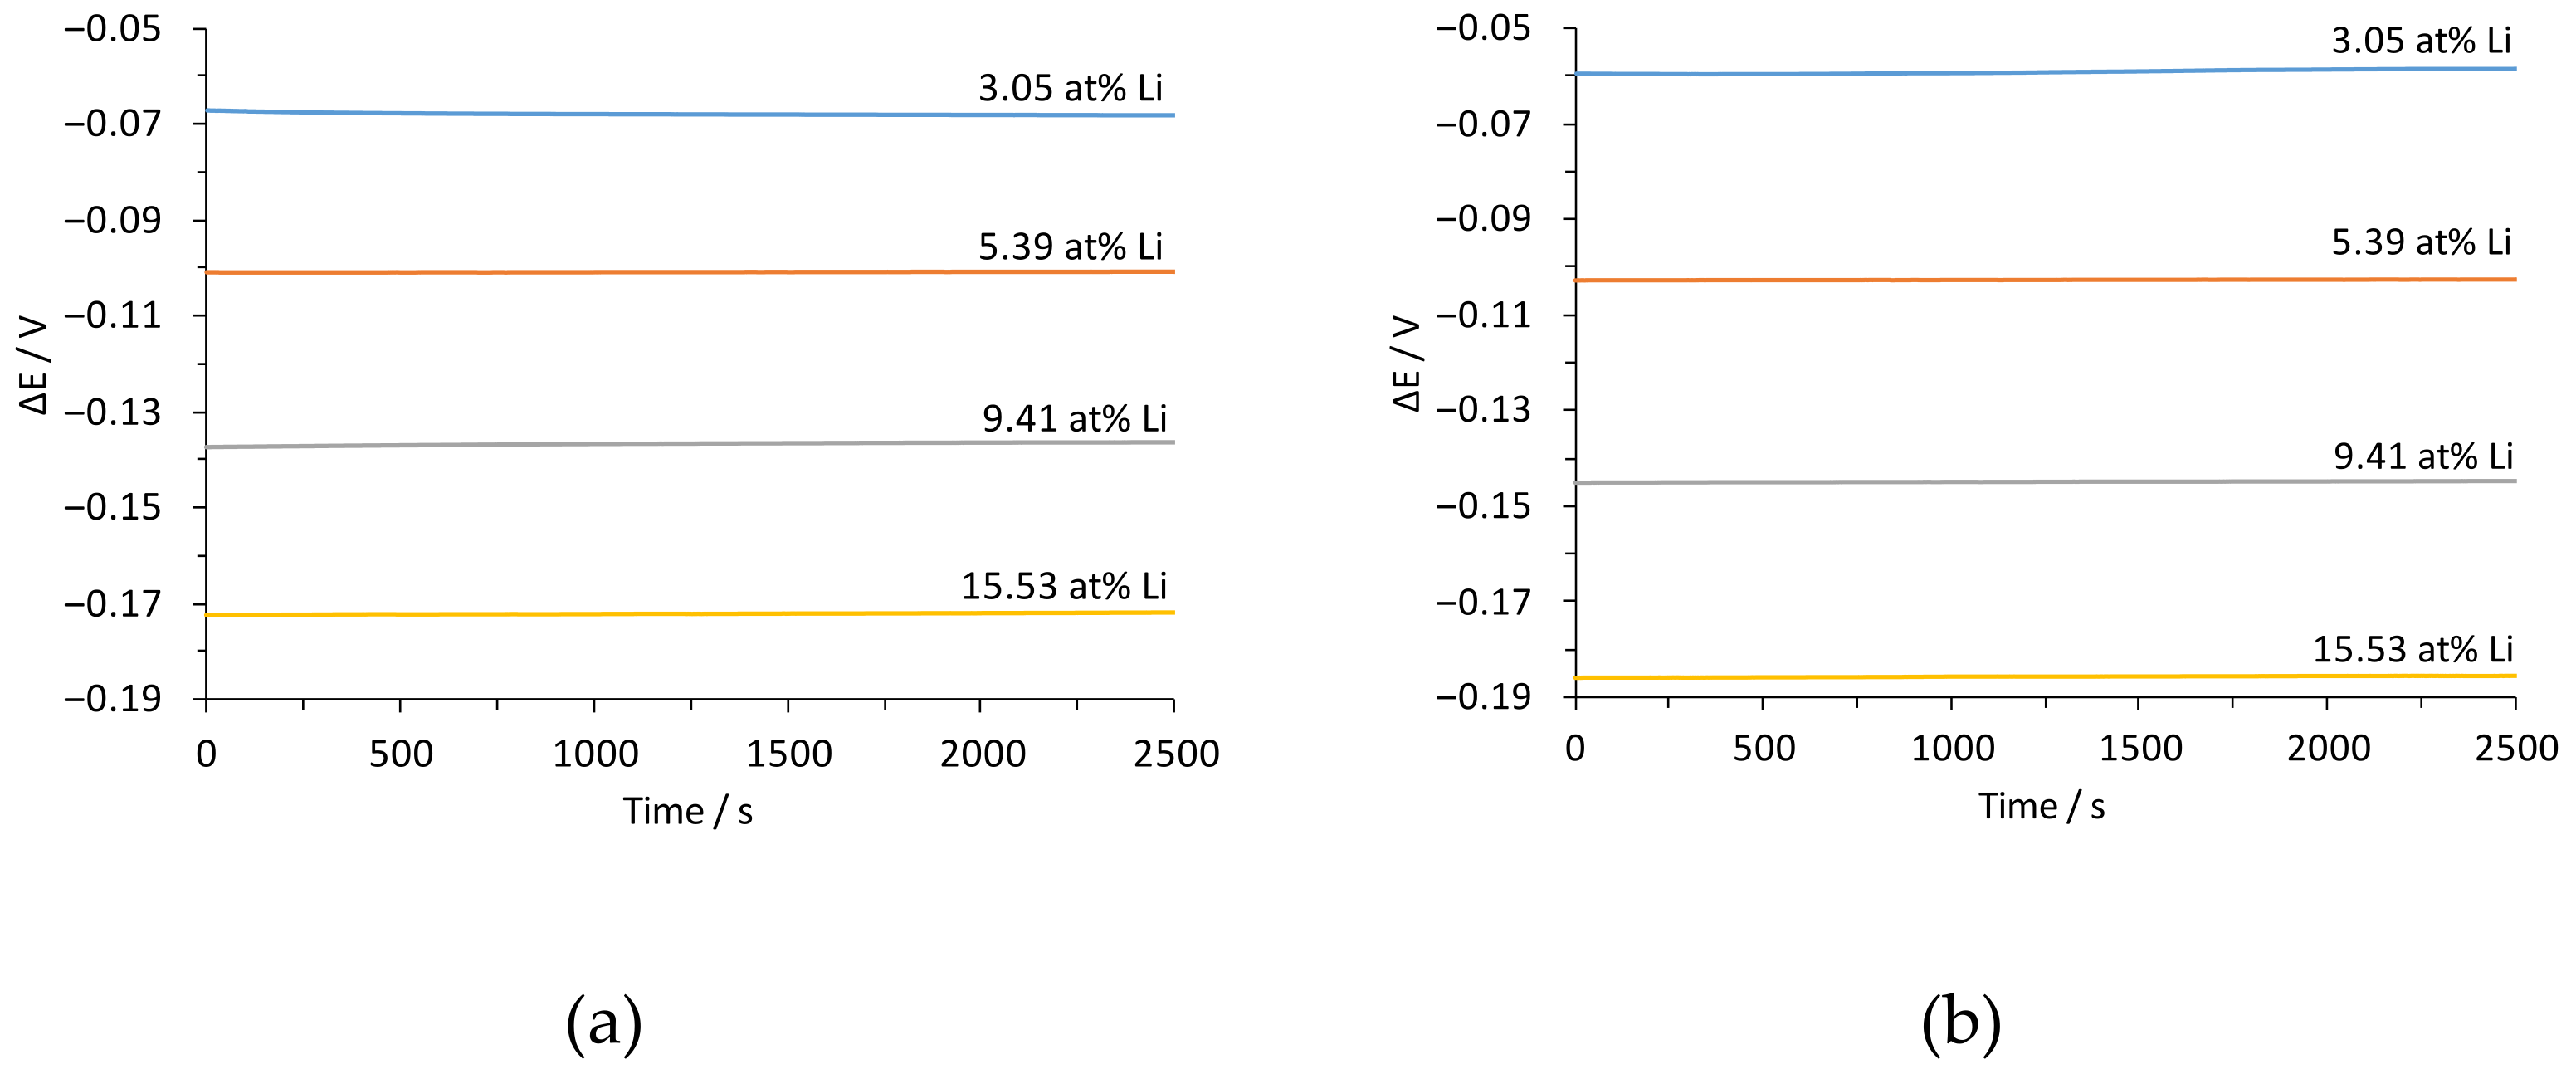
3. Results and Discussion

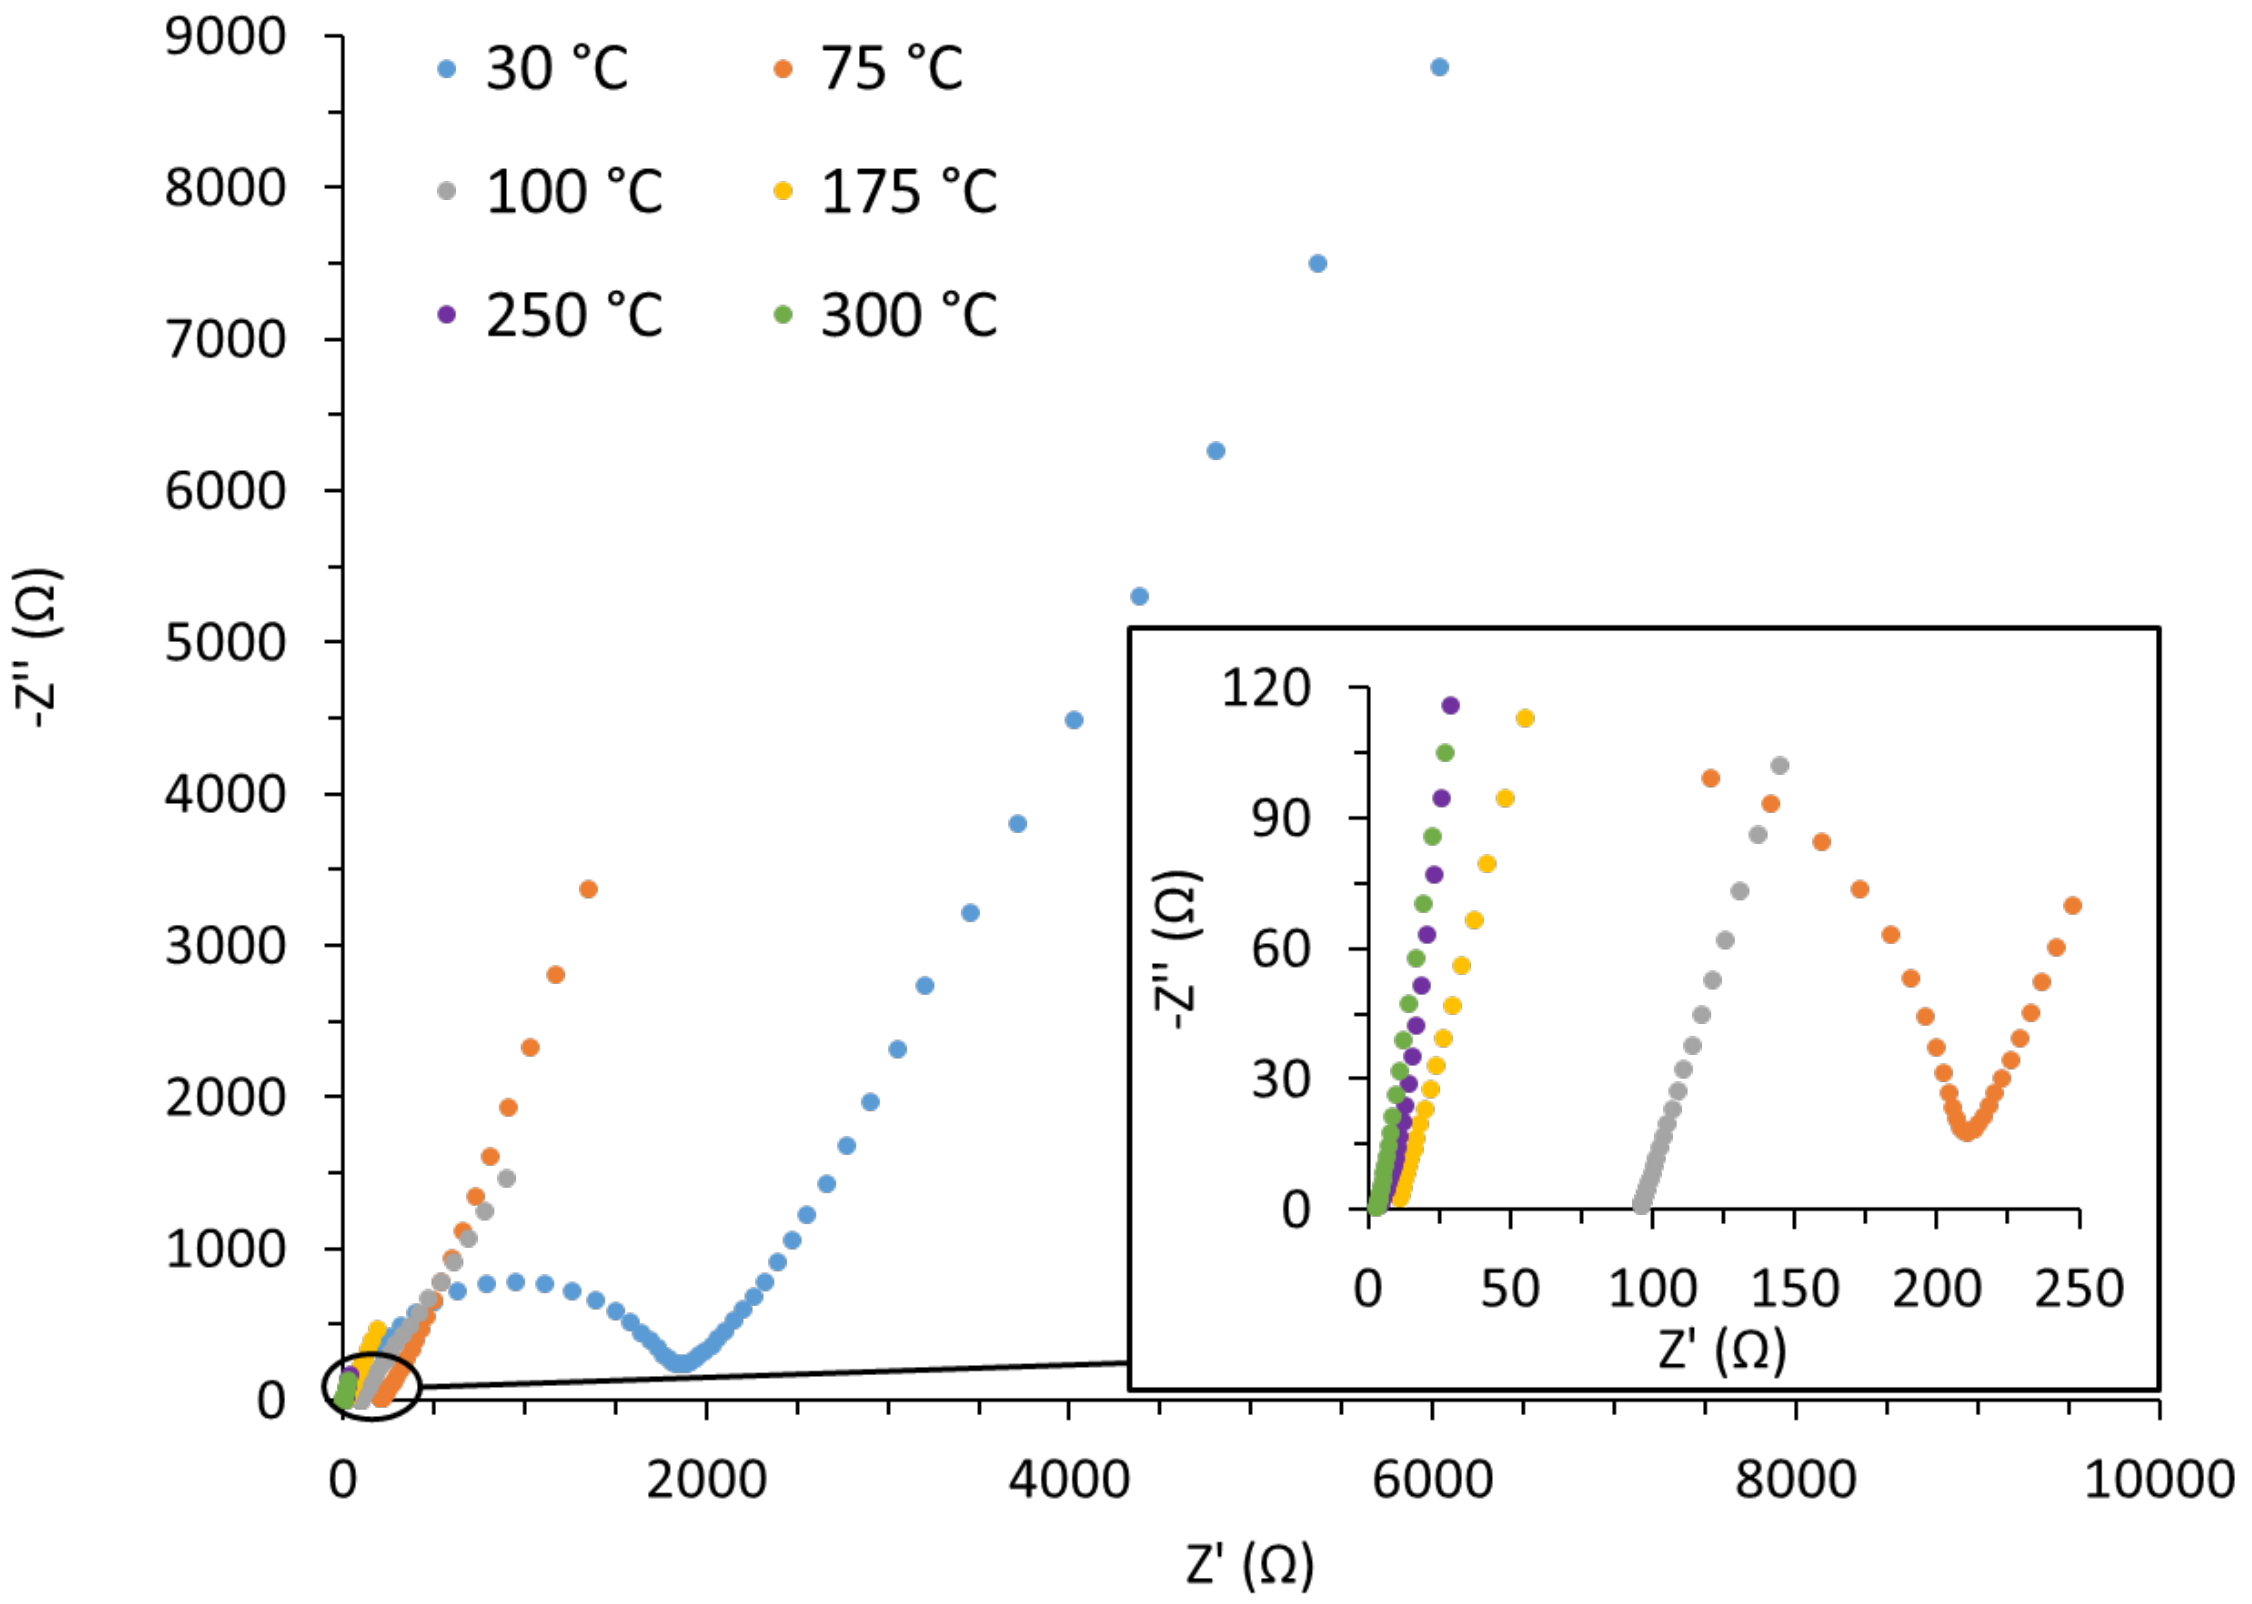
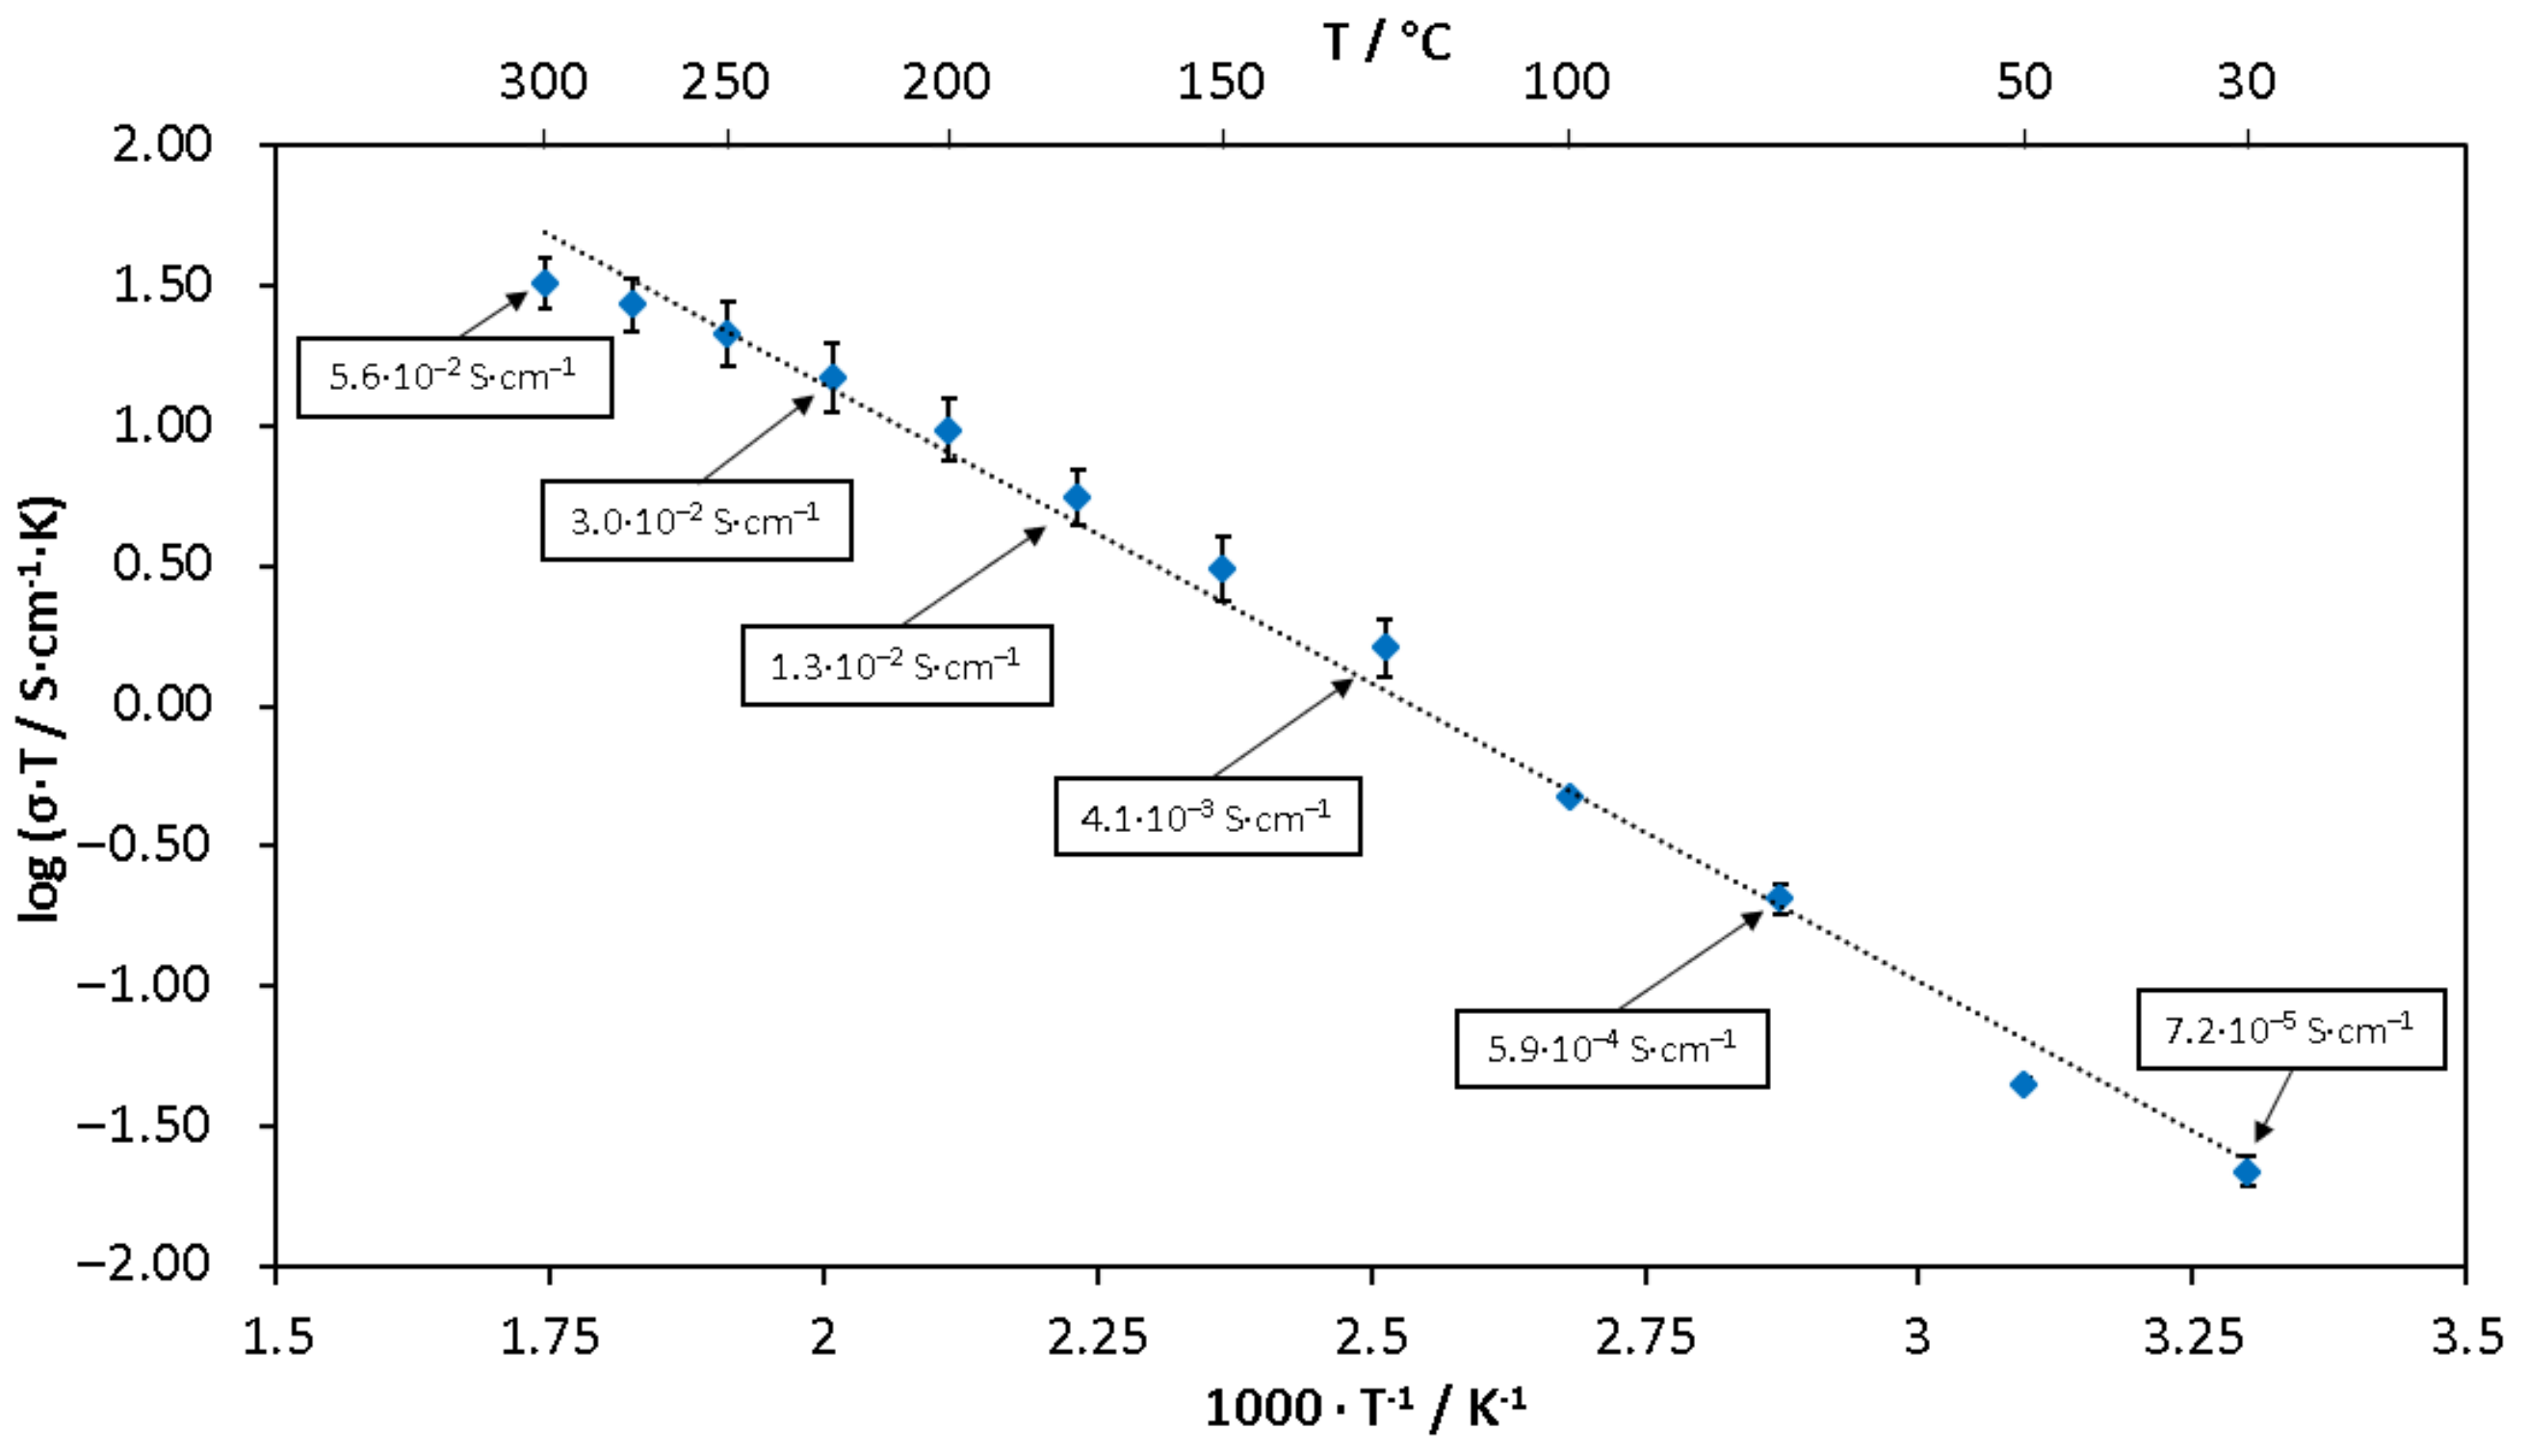
3.1. Ionic Conductivity of LBLTO Solid-State Electrolyte

EIS measurements were used to determine the ionic conductivity of LBLTO sintered pellets. Ionic conductivity is a key parameter of solid-state electrolytes. Note that, this property directly relates to the adequate performance of the electrolyte when forming part of a sensor. Although there are bibliographic values reported for the LBLTO electrolyte [29], it should be highlighted that both synthesis and sintering procedures will affect its ionic conductivity [30]. Since these thermal processes were optimised in previous works [28], it is possible that the conductivity may be affected. Electrochemical impedance measurements on LBLTO were performed from 30 to 300 °C. Figure 3 shows a representative example of the Nyquist plots obtained.
The shape of the impedance curves was in good agreement with the behaviour of these garnet-type oxides [31,32,33]. At 30 °C, a distinguished arc of the grain boundary contribution was observed at the high-frequency region and the electrode spike was found at low frequencies. When the temperature increased, the arc slowly diminished. From 100 °C, nothing more than the electrode spike could be distinguished. From Figure 3, total ionic conductivity was calculated according to (Equation (2)):
σ T = 1 R T · L A
where σT is the total ionic conductivity (S·cm−1), L is the pellet thickness (cm), A is the surface area of the gold layer on the pellet (cm2), and RT is the total resistance of the solid-state electrolyte (Ω). The latter was obtained from the intersection of the spike of the impedance curve with the real axis. Then, the ionic conductivity of LBLTO was plotted as a function of temperature (Figure 4).
From Figure 4, it can be observed that the higher the temperature, the higher the ionic conductivity. For this electrolyte, conductivity values ranged between 7.2 × 10⁻⁵ S·cm−1 at 30 °C and 5.6 × 10⁻² S·cm−1 at 300 °C. Note that divergencies between replicates were not significant. It indicates that despite using different synthesis and sintering conditions than those reported in the bibliography, the measured conductivity of the solid-state electrolyte was in good agreement with the reported data [29]. Moreover, it can be observed that at 300 °C, LBLTO pellets had high enough ionic conductivity to be used in a lithium sensor [34]. The activation energy was calculated using the Arrhenius equation, and it was 0.2 eV. This value is slightly lower than the one obtained in the bibliography (0.4 eV) [29].

3.2. Performance of the Sensor

First, the proper performance of the lithium sensor based on the LBLTO electrolyte was verified. To do so, the sensor was tested using the Sn-3.04Li alloy in the inner compartment and four different Pb-Li alloys (3.05, 5.39, 9.42 and 15.53 at% Li) in the outer compartment. The Pb-Li alloy was selected because it was extensively investigated by Hubberstey et al [35]. In that work, Hubberstey et al. established correlations that predicted the lithium activity evolution with the concentration for a fixed temperature. These correlations at 400 and 500 °C are the following:
400 ° C : ln ( a Li ) = 1 . 03 · ln ( x Li ) 8 . 127
500 ° C : ln ( a Li ) = 1 . 08 · ln ( x Li ) 7 . 085
These relationships were validated for 1 ≤ at% Li ≤ 17%. Notably, the Pb-Li alloys used in this experiment had lithium concentrations within the range (from 3.05 to 15.53 at% Li). Therefore, Equations (3) and (4) can be used to calculate the lithium activity values in the Pb-Li alloys used. Figure 5 shows the potential difference for the different Pb-Li alloys at 400 and 500 °C.
It can be seen in Figure 5 that the potential difference decreased when the lithium concentration increased, as predicted by the Nernst equation. It is worth mentioning that independently of the temperature, a high potential stability was observed throughout the entire measurement (ΔE < 1 mV). Standard deviations during measurements were lower than ± 0.3 mV. To further analyse the performance of the sensors and discern whether or not they satisfy the Nernst equation, potential differences were plotted as a function of the natural logarithm of lithium activities in Pb-Li alloys (Figure 6). Lithium activities in Pb-Li alloys were calculated according to Hubberstey correlations (Equations (3) and (4)). Then, according to Equation (1) (Nernst equation), the slope obtained should be RT/nF.
The correlations obtained in Figure 6 are shown below:
400 °C: ΔE(V) = −0.062 ln(aLi)Pb-Li + 0.790; R2 = 0.998
500 °C: ΔE(V) = −0.072 ln(aLi)Pb-Li + 0.838; R2 = 0.999
It can be observed in Equations 5 and 6 that all sensors presented a linear correlation (correlation coefficient >0.99) of the potential difference versus the natural logarithm of lithium activity (between 3.05 and 15.53 at% Li). The slopes calculated using the Nernst equation (see Equation (1)) were −0.058 and −0.067, at 400 and 500 °C, respectively. The discrepancies obtained between the experimental and the theoretical slopes were 7.8% or lower. Thus, the slopes of the correlation curves were in good agreement with the theoretical ones.

3.3. Determination of the Lithium Activity in Sn-3.04Li Alloy

Once it was verified, the good performance of the sensor in the above-mentioned conditions (see Section 3.2), the potentiometric data of all the Pb-Li alloys (3.05 to 15.53 at% Li) were used to calculate the activity coefficient of the Sn-3.04Li molten alloy as described in (Equations (7) and (8)).
ln a Li Sn - Li = E · nF RT + ln a Li Pb - Li
a Li Sn - Li = γ Li Sn - Li · x Li Sn - Li
The components in Equations (7) and (8) are the potential difference for each Pb-Li alloy (ΔE, in V), the universal gas constant (R = 8.314 J·K−1·mol−1), the temperature (T, in K), the number of electrons involved in the electrochemical reaction (n), the Faraday constant (F = 96,485 C·mol−1), the lithium activity (aLi), the lithium atomic fraction (x) and the lithium activity coefficient (γ). Notably, lithium activities in molten Pb-Li were calculated using Hubberstey correlations [35] at each lithium concentration and temperature. Table 1 shows the obtained results.
From Table 1, all the activity coefficients were of the same order of magnitude at each temperature. Notably, regardless of the lithium concentration in Pb-Li, the activity concentration of Sn-3.04Li alloy did not vary significantly. Thus, the average value and the standard deviation of the activity coefficient were calculated (Table 2).
As can be observed in Table 2, the lithium activity coefficients for the Sn-3.04Li alloy were 8.1 × 10⁻⁵ and 2.5 × 10⁻⁴ at 400 and 500 °C respectively. Moreover, it is worth mentioning that standard deviations were 5 × 10⁻⁶ at 400 °C and 1 × 10⁻⁵ at 500 °C, representing coefficients with a variation of 6% or lower, regardless of temperature. In the following section, the activity coefficients obtained are used to study the evolution of the activity in the Sn-Li binary system from 3 to 16.5 at% Li.

3.4. Determination of Correlations of Lithium Activity in Sn-Li

Finally, the LBLTO sensor was used to determine the activity coefficients of lithium in different Sn-Li alloys with a lithium concentration ranging from 3.00 to 16.50 at% Li at 400 and 500 °C. In all cases, an Sn-3.04Li alloy was used in the inner compartment. Therefore, the activity coefficients for this specific alloy were considered to be 8.06 × 10⁻⁵ and 2.47 × 10⁻⁴ at 400 and 500 °C, respectively. The following equation (Equation (9)) was used to determine the lithium activity for the different Sn-Li alloys:
ln a Li WE = E · nF RT + ln ( a Li ( 3 . 04   at % ) )
Figure 7 shows the natural logarithms of the lithium activity of different Sn-Li alloys as a function of their lithium atomic fraction.
As can be seen in Figure 7, similar behaviours were observed at 400 and 500 °C. Two zones were observed in the evaluated lithium atomic percentage, being 8.5 at% Li the intersection point. Correlations obtained in Figure 7 are shown in Table 3:
On the one hand, considering the concentration range from 3.0 to 8.5 at% Li, linear relationships were obtained between the lithium atomic fraction and the lithium activity (R2 > 0.99). It is worth mentioning that these relationships at both temperatures (400 and 500 °C) had a slope close to 1.00 (1.01 and 1.04 at 400 and 500 °C, respectively). Therefore, the activity coefficient can be considered constant in this lithium concentration range according to the equation (Equation (10)):
ln (aLi) = ln(xLi) + ln (γLi)
Moreover, the activity coefficients derived from the y-intercept (−9.38 and −8.20 at 400 and 500 °C, respectively) are the values at the infinite dilution condition. These correspond to activity coefficients of 8.4 × 10⁻⁵ at 400 °C and 2.7 × 10⁻⁴ at 500 °C. These results are in good agreement with those obtained for the Sn-3.04Li alloy (See Table 2). Moreover, if the activity coefficients obtained for Sn-Li alloys at infinite dilution are compared with those obtained by Hubberstey for Pb-Li alloys [35], 3.0 × 10⁻⁴ at 400 °C and 8.4 × 10⁻⁴ at 500 °C, it can be observed that the activity coefficients for molten Sn-Li are slightly lower but in the same order of magnitude.
On the other hand, a different behaviour was observed for lithium concentrations higher than 8.5 at% Li. In this case, correlations also had a linear relationship between the lithium atomic fraction and the lithium activity (R2 > 0.99). However, it should be highlighted that the slopes were considerably higher than 1.00 at both 400 and 500 °C. Therefore, the activity coefficient cannot be considered constant in this concentration range. In any case, these correlations allow the calculation of the lithium activity for a specific lithium atomic fraction.

4. Conclusions

Li6BaLa2Ta2O12 was used as a solid-state electrolyte in an electrochemical sensor in molten metals. Its electrochemical performance was evaluated in molten Pb-Li alloys and an Sn-3.04Li alloy at 400 and 500 °C. Linear correlations were obtained at both temperatures and the slopes were close to those predicted by the Nernst equation. Then, the lithium activity coefficients for the Sn-3.04Li alloy were calculated, being 8.1 × 10⁻⁵ and 2.5 × 10⁻⁴ at 400 and 500 °C, respectively.
The activity coefficients of lithium in Sn-Li (from 3.00 to 16.50 at% Li) were determined at 400 and 500 °C using the lithium sensor. It was observed that the activity coefficient was constant for lithium concentrations lower than 8.5 at%. Above this concentration, the activity coefficient changed with the lithium concentration. In this case, correlations between the lithium activity and the lithium atomic fraction were obtained from 8.5 to 16.5 at% Li at 400 and 500 °C in the Sn-Li binary system. From these results, it can be concluded that the developed device can be used to determine lithium thermodynamic data in molten Sn-Li alloys.

Author Contributions

Conceptualization, S.C. and J.A.; methodology, M.N.-l., E.L., A.H., S.C. and J.A.; validation, M.N.-l., E.L., A.H., S.C. and J.A.; formal analysis, M.N.-l., E.L. and A.H.; investigation, M.N.-l., E.L., A.H., S.C. and J.A.; resources, M.N.-l., E.L. and A.H.; data curation, M.N.-l., E.L. and A.H.; writing—original draft preparation, E.L.; writing—review and editing, M.N.-l., E.L., A.H., S.C., J.A.; supervision, S.C. and J.A.; project administration, S.C. and J.A.; funding acquisition, S.C. and J.A. All authors have read and agreed to the published version of the manuscript.

Funding

This project is partially financed by the Ministry of Science and Innovation of Spain, under grant number RTI2018–095045-B-I00.

Data Availability Statement

The data are contained within the article.

Acknowledgments

Enric Lujan wants to acknowledge the financial support received from Secretaria d’Universitats i Recerca of the Departament d’Educació i Coneixement of the Generalitat de Catalunya [2021 FISDU 00136].

Conflicts of Interest

The authors declare no conflict of interest. The funders had no role in the design of the study; in the collection, analyses, or interpretation of data; in the writing of the manuscript; or in the decision to publish the results.

References

  1. Daeneke, T.; Khoshmanesh, K.; Mahmood, N.; de Castro, I.A.; Esrafilzadeh, D.; Barrow, S.J.; Dickey, M.D.; Kalantar-zadeh, K. Liquid metals: Fundamentals and applications in chemistry. Chem. Soc. Rev. 2018, 47, 4073–4111. [Google Scholar] [CrossRef] [PubMed]
  2. Kazem, N.; Hellebrekers, T.; Majidi, C. Soft Multifunctional Composites and Emulsions with Liquid Metals. Adv. Mater. 2017, 29, 1605985. [Google Scholar] [CrossRef] [PubMed]
  3. Dickey, M.D. Stretchable and Soft Electronics using Liquid Metals. Adv. Mater. 2017, 29, 1606425. [Google Scholar] [CrossRef] [PubMed]
  4. Khoshmanesh, K.; Tang, S.-Y.; Zhu, J.Y.; Schaefer, S.; Mitchell, A.; Kalantar-zadeh, K.; Dickey, M.D. Liquid metal enabled microfluidics. Lab. Chip. 2017, 17, 974–993. [Google Scholar] [CrossRef] [PubMed]
  5. Kanatzidis, M.G.; Pöttgen, R.; Jeitschko, W. The Metal Flux: A Preparative Tool for the Exploration of Intermetallic Compounds. Angew. Chem. Int. Ed. 2005, 44, 6996–7023. [Google Scholar] [CrossRef]
  6. Sebastian, C.P.; Malliakas, C.D.; Chondroudi, M.; Schellenberg, I.; Rayaprol, S.; Hoffmann, R.-D.; Pöttgen, R.; Kanatzidis, M.G. Indium Flux-Growth of Eu 2 AuGe 3: A New Germanide with an AlB 2 Superstructure. Inorg. Chem. 2010, 49, 9574–9580. [Google Scholar] [CrossRef]
  7. Bobev, S.; Merz, J.; Lima, A.; Fritsch, V.; Thompson, J.D.; Sarrao, J.L.; Gillessen, M.; Dronskowski, R. Unusual Mn−Mn Spin Coupling in the Polar Intermetallic Compounds CaMn 2 Sb 2 and SrMn 2 Sb 2. Inorg. Chem. 2006, 45, 4047–4054. [Google Scholar] [CrossRef]
  8. Ladd, C.; So, J.-H.; Muth, J.; Dickey, M.D. 3D Printing of Free Standing Liquid Metal Microstructures. Adv. Mater. 2013, 25, 5081–5085. [Google Scholar] [CrossRef]
  9. Wang, L.; Liu, J. Liquid phase 3D printing for quickly manufacturing conductive metal objects with low melting point alloy ink. Sci. China Technol. Sci. 2014, 57, 1721–1728. [Google Scholar] [CrossRef]
  10. Li, H.; Yin, H.; Wang, K.; Cheng, S.; Jiang, K.; Sadoway, D.R. Liquid Metal Electrodes for Energy Storage Batteries. Adv. Energy Mater. 2016, 6, 1600483. [Google Scholar] [CrossRef]
  11. Kim, H.; Boysen, D.A.; Newhouse, J.M.; Spatocco, B.L.; Chung, B.; Burke, P.J.; Bradwell, D.J.; Jiang, K.; To-maszowska, A.A.; Wang, K.; et al. Liquid Metal Batteries: Past, Present, and Future. Chem. Rev. 2013, 113, 2075–2099. [Google Scholar] [CrossRef]
  12. Wang, K.; Jiang, K.; Chung, B.; Ouchi, T.; Burke, P.J.; Boysen, D.A.; Bradwell, D.J.; Kim, H.; Muecke, U.; Sadoway, D.R. Lithium–antimony–lead liquid metal battery for grid-level energy storage. Nature 2014, 514, 348–350. [Google Scholar] [CrossRef] [Green Version]
  13. Giancarli, L.; Chuyanov, V.; Abdou, M.; Akiba, M.; Hong, B.G.; Lässer, R.; Pan, C.; Strebkov, Y. Breeding Blanket Modules testing in ITER: An international program on the way to DEMO. Fusion Eng. Des. 2006, 81, 393–405. [Google Scholar] [CrossRef]
  14. Puma, A.L.; Aiello, G.; Gabriel, F.; Laffont, G.; Rampal, G.; Salavy, J.-F. Requirements and proposals for control and monitoring measurements of the HCLL TBM. Fusion Eng. Des. 2010, 85, 1642–1652. [Google Scholar] [CrossRef]
  15. Abdou, M.; Morley, N.B.; Smolentsev, S.; Ying, A.; Malang, S.; Rowcliffe, A.; Ulrickson, M. Blanket/first wall challenges and required R&D on the pathway to DEMO. Fusion Eng. Des. 2015, 100, 2–43. [Google Scholar] [CrossRef] [Green Version]
  16. Loureiro, J.P.S.; Tabarés, F.L.; Fernandes, H.; Silva, C.; Gomes, R.; Alves, E.; Mateus, R.; Pereira, T.; Alves, H.; Figueiredo, H. Behavior of liquid Li-Sn alloy as plasma facing material on ISTTOK. Fusion Eng. Des. 2017, 117, 208–211. [Google Scholar] [CrossRef]
  17. Linke, J.; Du, J.; Loewenhoff, T.; Pintsuk, G.; Spilker, B.; Steudel, I.; Wirtz, M. Challenges for plasma-facing components in nuclear fusion. Matter Radiat. Extrem. 2019, 4, 056201. [Google Scholar] [CrossRef] [Green Version]
  18. Tabarés, F.L. Present status of liquid metal research for a fusion reactor. Plasma Phys. Control. Fusion 2016, 58, 014014. [Google Scholar] [CrossRef] [Green Version]
  19. Majeski, R.; Kaita, R.; Boaz, M.; Efthimion, P.; Gray, T.; Jones, B.; Hoffman, D.; Kugel, H.; Menard, J.; Munsat, T.; et al. Testing of liquid lithium limiters in CDX-U. Fusion Eng. Des. 2004, 72, 121–132. [Google Scholar] [CrossRef] [Green Version]
  20. Mazzitelli, G.; Apicella, M.L.; Apruzzese, G.; Crescenzi, F.; Iannone, F.; Maddaluno, G.; Pericoli-Ridolfini, V.; Roccella, S.; Reale, M.; Viola, B.; et al. Experiments on FTU with an actively water cooled liquid lithium limiter. J. Nucl. Materials 2015, 463, 1152–1155. [Google Scholar] [CrossRef]
  21. Gomes, R.B.; Fernandes, H.; Silva, C.; Sarakovskis, A.; Pereira, T.; Figueiredo, J.; Carvalho, B.; Soares, A.; Varandas, C.; Lielausis, O.; et al. Interaction of a liquid gallium jet with the tokamak ISTTOK edge plasma. Fusion Eng. Des. 2008, 83, 102–111. [Google Scholar] [CrossRef]
  22. Allain, J.P.; Ruzic, D.N.; Hendricks, M.R. D, He and Li sputtering of liquid eutectic Sn–Li. J. Nucl. Mater. 2001, 290, 33–37. [Google Scholar] [CrossRef]
  23. Shin, D.J.; Gao, X.; Ueda, S.; Kitamura, S. Measurement of the Activity Coefficients of P and Mn in Carbon-Saturated Fe-P-Mn-C Alloy. Metall. Mater. Trans. B 2019, 50, 825–833. [Google Scholar] [CrossRef]
  24. Miki, T.; Tsujita, K.; Ban-Ya, S.; Hino, M. Activity measurement of the constituents in molten Fe–B and Fe–B–C alloys. Calphad 2006, 30, 449–454. [Google Scholar] [CrossRef]
  25. Poling, B.E.; Prausnitz, J.M.; O’Connel, J.P. Properties of Gases and Liquids, 5th ed.; McGraw-Hill Education: New York, NY, USA, 2001. [Google Scholar]
  26. Itoh, S.; Inoue, Y. Activity Measurement of Titanium-Tin Alloys by Knudsen Effusion Method. Mater. Trans. 2011, 52, 704–708. [Google Scholar] [CrossRef] [Green Version]
  27. Katayama, I.; Zivkovic, D.; Manasijevic, D.; Oishi, T.; Zivkovic, Z.; Iida, T. Activity measurement of Ga in liquid Ga-Pb alloys by EMF method with zirconia solid electrolyte. J. Min. Metall. Sect. B Metall. 2002, 38, 229–236. [Google Scholar] [CrossRef]
  28. Nel-lo, M.; Colominas, S.; Abellà, J. Lithium conducting ceramics for future electrochemical sensors in molten metals. Fusion Eng. Des. 2019, 146, 1216–1220. [Google Scholar] [CrossRef]
  29. Murugan, R.; Thangadurai, V.; Weppner, W. Lithium ion conductivity of Li5+x Ba x La 3-x Ta2O12 (x=0-2) with garnet-related structure in dependence of the barium content. Ionics 2007, 13, 195–203. [Google Scholar] [CrossRef]
  30. Lopez Maldonado, K.L.; de la Presa, P.; de la Rubia, M.A.; Crespo, P.; de Frutos, J.; Hernando, A.; Matutes Aquino, J.A.; Elizalde Galindo, J.T. Effects of grain boundary width and crystallite size on conductivity and magnetic properties of magnetite nanoparticles. J. Nanoparticle Res. 2014, 16, 2482. [Google Scholar] [CrossRef]
  31. Narayanan, S.; Hitz, G.T.; Wachsman, E.D.; Thangadurai, V. Effect of Excess Li on the Structural and Electrical Properties of Garnet-Type Li 6 La 3 Ta 1.5 Y 0.5 O 12. J. Electrochem. Soc. 2015, 162, A1772–A1777. [Google Scholar] [CrossRef]
  32. Braun, P.; Uhlmann, C.; Weber, A.; Störmer, H.; Gerthsen, D.; Ivers-Tiffée, E. Separation of the bulk and grain boundary contributions to the total conductivity of solid lithium-ion conducting electrolytes. J. Electroceramics 2017, 38, 157–167. [Google Scholar] [CrossRef]
  33. Mori, D.; Sugimoto, K.; Matsuda, Y.; Ohmori, K.; Katsumata, T.; Taminato, S.; Takeda, Y.; Yamamoto, O.; Imanishi, N. Synthesis, Structure and Ionic Conductivity of Garnet Like Lithium Ion Conductor Li 6.25+ x Ga 0.25 La 3-x Sr x Zr 2 O 12. J. Electrochem. Soc. 2019, 166, A5168–A5173. [Google Scholar] [CrossRef]
  34. Fabry, P.; Khireddine, H.; Cretin, M. Ionic Recognition Using Conducting Ceramics. In Hermodynamic Modeling and Materials Data Engineering; Springer: Berlin/Heidelberg, Germany, 1998; pp. 305–312. [Google Scholar] [CrossRef]
  35. Hubberstey, P.; Sample, T. Pb-17Li-water interactions: A thermodynamic and experimental characterization. J. Nucl. Mater. 1993, 199, 149–158. [Google Scholar] [CrossRef]
Figure 1. EIS experimental setup for ionic conductivity measurement of LBLTO sintered pellets.
Chemosensors 11 00006 g001
Figure 2. Sensor assembly and experimental set-up.
Chemosensors 11 00006 g002
Figure 3. Nyquist plots of an LBLTO sintered pellet.
Chemosensors 11 00006 g003
Figure 4. Ionic conductivity Arrhenius plot of sintered LBLTO pellets.
Chemosensors 11 00006 g004
Figure 5. Potential difference (ΔE) measurements in Pb-Li with 3.05, 5.39, 9.41 and 15.53 at% Li alloy. (a) 400 °C; (b) 500 °C. The Sn-3.04Li alloy was used in the inner compartment of the concentration cell.
Chemosensors 11 00006 g005
Figure 6. Potential difference versus the logarithm of lithium activities in Pb-Li at 400 and 500 °C.
Chemosensors 11 00006 g006
Figure 7. Lithium activity as a function of the lithium atomic fraction in Sn-Li at 400 and 500 °C.
Chemosensors 11 00006 g007
Table 1. Activity coefficient of Sn-3.04Li alloy at 400 and 500 °C.
Temperature/°CPb-Li/at% LiγLi (Sn-3.04Li)
4003.058.3 × 10–5
5.398.4 × 10–5
9.418.1 × 10–5
15.537.4 × 10–5
5003.052.6 × 10–4
5.392.5 × 10–4
9.412.5 × 10–4
15.532.3 × 10–4
Table 2. Average activity coefficients of Sn-3.04Li alloy at 400 and 500 °C.
Temperature/°CγStandard Deviation
4008.1 × 10–55 × 10–6
5002.5 × 10–41 × 10–5
Table 3. Correlation curves of lithium activity correlation with lithium atomic fraction in Sn-Li alloy at 400 and 500 °C.
Temperature/°Cat% Li ≤ 8.5at% Li ≥ 8.5
400Ln(aLi) = 1.01·ln(xLi) − 9.38 R² = 0.998Uncertainty *: ±7 × 10⁻⁷Ln(aLi) = 1.20·ln(xLi) − 8.86 R² = 0.999Uncertainty *: ±8 × 10⁻⁷
500Ln(aLi) = 1.04·ln(xLi) − 8.20 R² = 0.996Uncertainty *: ±3 × 10⁻⁶Ln(aLi) = 1.42·ln(xLi) − 7.23 R² = 0.993Uncertainty *: ±1 × 10⁻⁵
* Uncertainties corresponding to lithium activities.
Disclaimer/Publisher’s Note: The statements, opinions and data contained in all publications are solely those of the individual author(s) and contributor(s) and not of MDPI and/or the editor(s). MDPI and/or the editor(s) disclaim responsibility for any injury to people or property resulting from any ideas, methods, instructions or products referred to in the content.

