Article

Updating Ortho- and Metachromatic Acridine Orange Fluorescence in Cytochemical Chromosome Staining: A Proposal for Understanding Its Differential Fluorescence on Double- and Single-Stranded Nucleic Acids Substrates Based on Intercalation

by
Juan C. Stockert
1,2,* and
Alfonso Blázquez-Castro
3,*
1
Instituto de Ciencias Ambientales y Salud (ICAS), Fundación Pro Salud y Medio Ambiente (PROSAMA), Paysandú 752, Buenos Aires CP1405, Argentina
2
Centro Integrativo de Biología y Química Aplicada (CIBQA), Universidad Bernardo O’Higgins, General Gana 1702, Santiago 8370854, Chile
3
Departamento de Biología, Universidad Autónoma de Madrid, c/Darwin 2, 28049 Madrid, Spain
*
Authors to whom correspondence should be addressed.
Chemosensors 2023, 11(10), 540; https://doi.org/10.3390/chemosensors11100540
Submission received: 11 September 2023 / Revised: 12 October 2023 / Accepted: 13 October 2023 / Published: 16 October 2023

Abstract

:
Many fluorophores display interesting features that make them useful biological labels and chemosensors, in particular in Cell Biology. Changes in the absorption-emission spectra (ortho- and metachromasia) are accounted among them. Acridine orange (AO) is one such fluorochromes that shows a prototypical orthochromatic vs. metachromatic behavior depending on its concentration and binding mode to different cellular substrates. Here, we revisit the differential AO fluorescence that occurs in selected biological examples, which allows for the identification of single-stranded or double-stranded nucleic acids. Although known for long, the ultimate reason for this phenomenon has not been properly advanced. We provide a potential molecular mechanism that adequately accounts for the different aspects of the phenomenon. This theoretical mechanism implies a difference in the degree of overlap of excited state orbitals whenever AO molecules are interacting with a single-stranded or a double-stranded nucleic acid. In the first case, massive π-electron overlapping between bases and intercalated AO leads to a metachromatic red emission. On the contrary, no excited-state orbital overlapping in AO-intercalated DNA duplexes is possible due to excessive separation between AO molecules and compliancy to the nearest neighbor exclusion principle, which manifests as orthochromatic green fluorescence.

1. Introduction

The acridinium dye acridine orange (AO, CI: 46005), already applied by early authors [1], is now one of the most known and useful cationic fluorochromes employed in microscopic studies [2,3,4,5,6,7,8]. For example, it allows differential fluorescent labeling of the cytoplasm/nucleus/lysosomes in living cells due to different accumulation in these particular subcellular domains [7,8]. Similarly, it stains differentially the cytoplasm and the nucleus in fixed dead cells [7,8]. Most puzzling, AO displays different fluorescent labeling behavior in regard to different cellular substrates. Regarding nucleic acids (NAs), AO has been widely and notably employed to differentiate simultaneously NAs strandedness, namely between DNA (orthochromatic green fluorescence) and RNA (metachromatic red fluorescence) [2,8,9,10,11,12,13].
The chemical structure of AO, its cationic isomers, and its uncharged free base are illustrated in Figure 1. It has an acridine core with two dimethylamino lateral groups. This allows for a molecular resonance among different forms, which is directly related to its fluorescent properties. Although the orthoquinone form is equally correct (Figure 1C), the distribution of positive charges over N atoms makes the resonant paraquinone isomers (Figure 1A,B) the most relevant structures for the cationic AO [8].
AO is a fluorescent molecule, commonly excited in the blue range of the spectrum (450–500 nm) and emitting in the green (500–600 nm) under highly diluted conditions. Due to its chemical features, it displays differential accumulation and interaction behaviors among different cell domains and biological substrates, both for live and dead cells. 
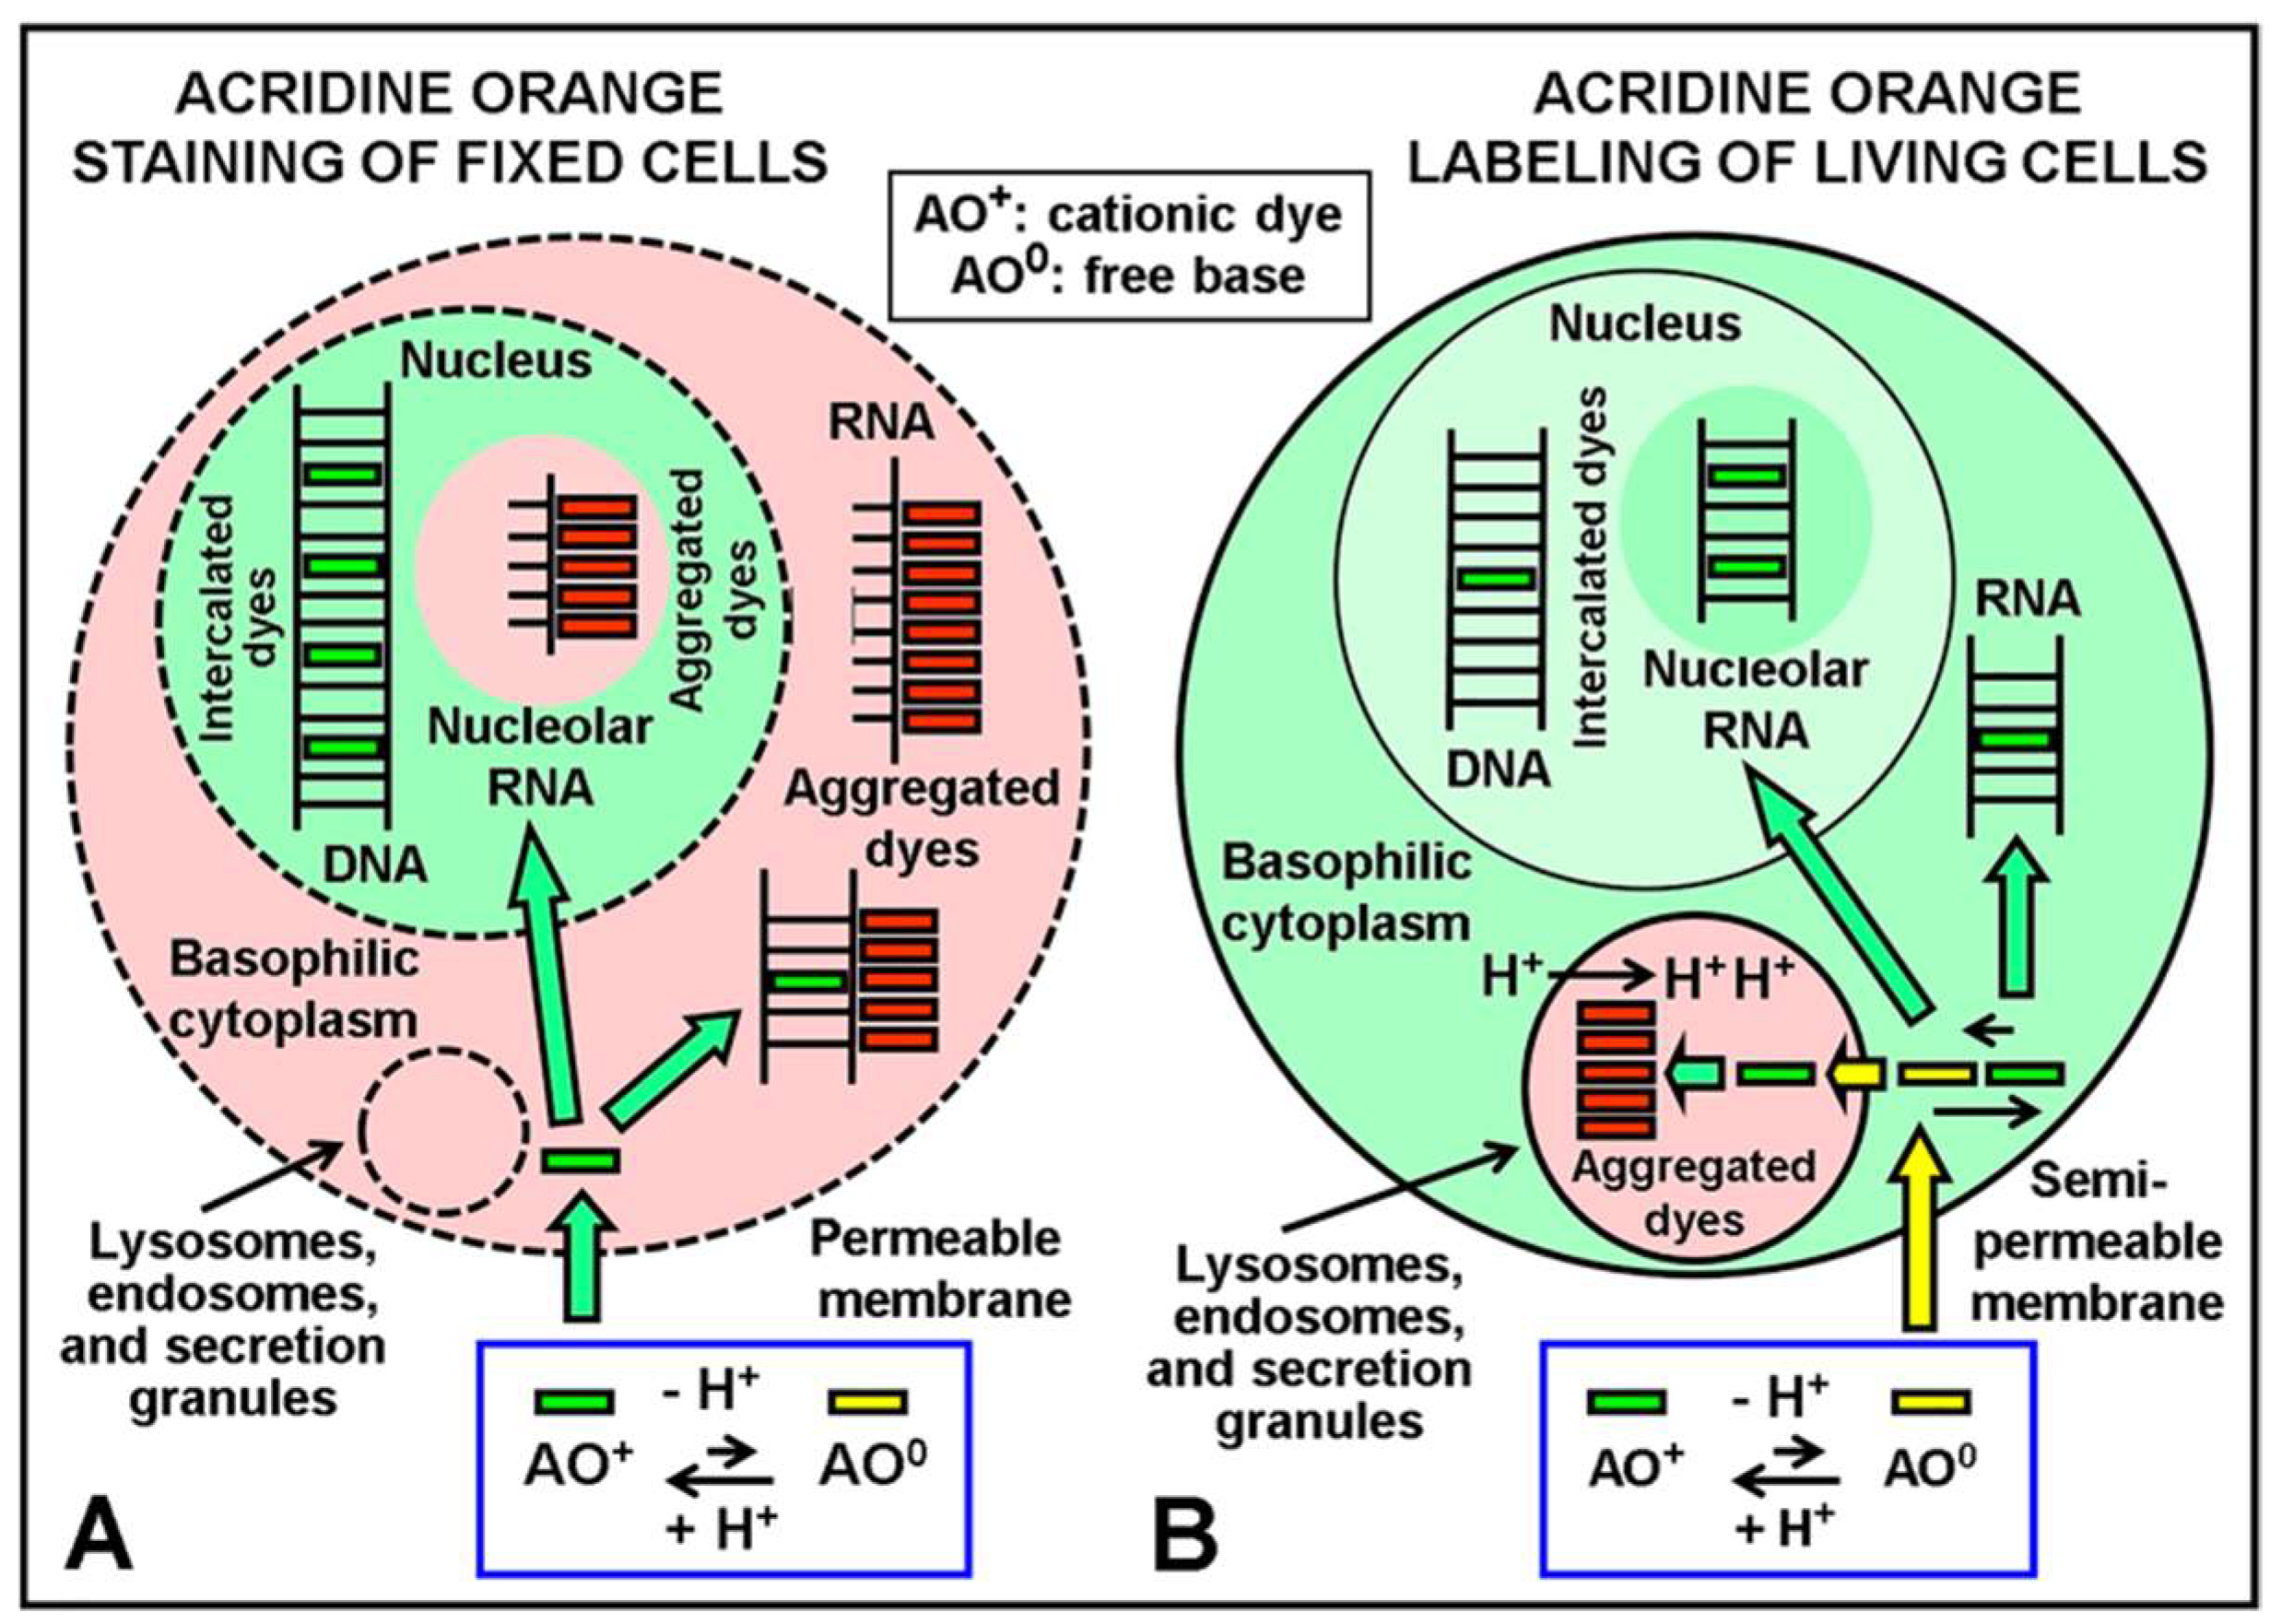
Figure 2 shows the classical understanding of the differential labeling/staining reactions of AO in live/dead cells [8]. Fluorescence staining reactions by AO are also applied on live cultured cells to detect lysosomes and nuclei [14], as well as in chromosome studies after specific protocols for DNA staining. Today, it is widely assumed that AO interacts with the nucleic acid (NA) components of nuclei, interphase chromatin, mitotic and meiotic chromosomes, chromatids, and chromosome regions. In keeping with this, DNA is the principal component of these biological substrates. Likewise, there are mainly two binding modes of AO to NAs (DNA, RNA), namely, hydrophobic intercalation of the planar dye monomers between base pairs of ds-NAs and external, ionic binding of dye monomers, dimers, and higher (stacked) aggregates to the phosphates of ss-NAs. Regarding fluorescence, as monomer dye intercalation and external binding of dye aggregates induce, respectively, green (orthochromatic) and red (metachromatic) emission of NAs, this color reaction has been used for revealing strandedness. In these cases, different kinetics of denaturation-reassociation (Denaturation-Reassociation-AO method, DRAO) [11] or differential bromo-substitution between sister chromatids [15,16] can be revealed using differential AO fluorescence. In summary, a single fluorophore, AO, allows for differential identification of different cellular subdomains and of different substrates. As such, it is a very interesting and flexible molecular probe for use in Cell Biology and Cytogenetics.
In addition to NAs, numerous polyanionic substrates in fixed tissue or cell samples exhibit metachromatic fluorescence when stained with AO. Examples are chondroitin sulfates from the cartilage matrix, the mucin content of intestinal goblet cells, and specific heparin-containing granules of mast cells [17]. Likewise, on account of their acridine core fluorophore, other colorants such as acriflavine, acridine yellow G, coriphosphine O, euchrysin GGNX, phosphine E, etc., also display similar metachromatic properties [5,7,18].
Although it is commonly accepted that the ortho- and metachromatic emission of AO-stained microscopic substrates is due, respectively, to the selective binding of monomeric and aggregated dye molecules [8,13,16,19], arguably some features regarding the detailed cause of fluorescence mechanism are not yet fully understood. In the present work, we describe and characterize these features experimentally and attempt to explain them using cytochemical comparisons based on a proposal of differential AO staining reactions with different cellular polymeric substrates, namely NAs.

2. Materials and Methods

2.1. Chromosome Preparations and Staining

The DRAO method was performed on BALB/c mice injected with 50-µg demecolcine. Cell suspensions from the spleen and thymus were incubated in a hypotonic solution (isotonic saline/distilled water, 1:7) for 30 min and then fixed in 3:1 methanol-acetic acid. DNA denaturation and reassociation were achieved by heating preparations at 100 °C for 2 min in a mixture (1:9) of formamide and 0.1 × SSC solution (SSC: 0.15 M NaCl, 0.015 M Na3-citrate) and immediately transferred to 2 × SSC at 66 °C during 30 s for differential reassociation. Other reassociation times were also tested (from 0 s to 10 min). Formaldehyde was then added at a final concentration of 4% for 1 min, followed by washing twice in cold absolute ethanol and air-drying.
Cell smears and chromosome preparations were stained for 2–5 min with AO (0.1 mg/mL in 0.1 M phosphate buffer at pH 6.0). Preparations were washed in distilled water and mounted in glycerol-PBS (1:1) or air-dried and mounted in DPX. In control samples, extraction methods for DNA and RNA were performed using treatment with DNase I (0.5 mg/mL in 1 mM MgCl2 at 37 °C for 2 h), RNase (1 mg/mL in distilled water) for 2 h, and with 5% trichloroacetic acid (TCA) at boiling temperature for 15 min.

2.2. Fluorescence Microscopy and Spectroscopy

Microscopic observations and photography were made in a Zeiss (Oberkochen, Baden-Württemberg, Germany)photomicroscope III containing the epifluorescence condenser IIIRS and in an Olympus BX61 (Olympus, Tokyo, Japan) BX61 epifluorescence microscope, equipped with a super-pressure mercury lamp HBO-100 W and the filter sets for violet-blue (436 nm) or blue (450–490 nm) light.
Spectrofluorometric studies were performed with a Perkin-Elmer fluorescence spectrophotometer 650-10S (Norwalk, CT, USA), equipped with a 150 W xenon lamp, two grating monochromators, the R372F photomultiplier detector, and a 016 recorder. Fluorescence analysis was made in the sensitivity range 0.3–1, with the mode switch and gain selector in normal position and a 10 nm bandpass for the excitation and emission slits.

3. Results and Discussion

To better appreciate the implications of the presented experimental data and the proposed mechanism to explain it, an introduction to the phenomenon of bathochromism, in particular in concern to AO, is pertinent. Bathochromism is the shift of emission or absorption bands towards longer wavelengths due to some changing parameter (medium polarizability, electric fields, etc.) [8]. Of concern here is concentration bathochromism, which alludes to the red shift in the fluorophore emission (in this case, AO) due to an increase in the concentration of the very fluorophore. Spectrofluorometric studies using increasing concentrations of aqueous AO appropriately show the known dependence on the emission peaks of the fluorophore (Figure 3), shifting from green to yellow, orange, and red fluorescence. This occurs because, on increasing the concentration of the fluorophore, more and more fluorophore molecules tend to directly interact with each other. Frequently, this leads to stacking and molecular orbitals overlapping, the consequence of which is the red-shifted emission (metachromatic) compared to the canonical fluorescence (orthochromatic) already alluded to [6,7]. Interestingly, in the presence of specific NA substrates, orthochromatic green fluorescence of AO with native DNA occurs at 502 nm, whereas RNA presents a red metachromatic emission at 650 nm as if AO concentration had (locally) increased [7].
It is now accepted that these conspicuous changes in the emission color of aqueous AO solutions are related to the monomeric, oligomeric, or polymeric (aggregated) status of the fluorophore and its modification of the light-emitting state [3,7,8,11,12,13]. Furthermore, in the presence of specific substrates, a given concentration of AO shows a fluorescence color that indicates the monomeric (orthochromatic) or aggregated (metachromatic) condition of the bound dye. In particular, the interaction of AO with biological substrates in the living or dead cell leads to such ortho-/metachromatic phenomenon as a consequence of the local concentration of the fluorophore and, therefore, its aggregation state. A schematic microscopic correlation of AO change in fluorescence wavelength for different cell subdomains and increasing concentrations of the fluorophore is clearly observed in Figure 4, where the nuclei and heparin-containing granules of mast cells are used as an illustrative staining model [17]. At low AO concentrations, all emission is orthochromatic (green), so there is no differential labeling. With increasing AO concentrations, a differential fluorescence is observed: a metachromatic emission (yellow-orange-red) from the cytoplasmic granules in contrast to the orthochromatic emission (green) from the nucleus. It is known that the cytoplasmic granules in mast cells take up large quantities of AO, thus explaining the metachromatic emission as AO aggregation proceeds in these organelles. At high enough AO concentrations, nuclear uptake is forced, and aggregation also occurs in it, explaining the overall cellular metachromatic emission observed in the last example.
Polyanionic glycosaminoglycans, such as the mucin content of goblet cells and luminal microvilli of intestinal epithelial cells from tissue sections, appear metachromatic (red-orange) after AO staining, thanks to the strong local AO concentration due to the large negative charge of these substrates, whereas cell nuclei show up orthochromatic (green). Likewise, lysosomes of live cultured cells are strongly acid organelles that readily label with AO [8]. This occurs due to the low pH value of lysosomes, which allows for the massive protonation of the dye, which remains trapped within this organelle, largely as stacked aggregates with resultant metachromatic fluorescence.
Focusing on the labeling/staining of AO with NAs (DNA and RNA), there are many experimental accounts of differential fluorescence depending on the nature and structure of the considered NA [8]. Regarding this differential staining of NAs using AO, Ehrlich ascites tumor cells show a perfect example of an orthochromatic (green) emission of chromatin DNA, while RNA-containing basophilic cytoplasm and nucleoli display a metachromatic (red) fluorescence (Figure 5).
In this context, it must be remarked that AO bathochromism has been widely exploited to evaluate NA strandedness. Under cellular conditions, DNA is usually present as a double-stranded molecule, while RNA appears mainly as a single-stranded entity. When used under the proper conditions, AO is capable of differentiating single-stranded (ss) from double-stranded (ds) NA conformations by emitting red or green fluorescence, respectively [4,8,10,11,12,13,16]. However, the precise dye-substrate binding modes causing this notable phenomenon are not yet well known. It can be assumed, in a first approximation, that after methanol or methanol-acetic fixation, phosphate groups from both ssNAs and dsNAs are rather available to react with cationic dyes. Should this be the case, however, then both NAs should display metachromatic emission due to non-differential ionic binding when stained by a given AO concentration, as free phosphate groups would be available from both DNA and RNA, irrespective of strandedness.
Another mechanism must come into play to support this differential fluorescence behavior. A potential candidate is AO intercalative binding between nucleobases of NAs. A commonly accepted schematic model for different kinds of interactions of planar dyes (e.g., AO) with NAs is illustrated in Figure 6, in which intercalative (I) versus external binding modes (E1, E2, … En) are shown in a simplistic way. Intercalation of planar aromatic compounds is a well-known binding mechanism to DNA [20,21,22]. Hydrophobic interactions between the aromatic molecular moiety and the nucleobases promote the slipping of the dye between two adjacent base pairs. On the other hand, dye monomers can interact ionically with the outer NA backbone, mainly with charged phosphate groups, leading to external binding. Under this external ionic binding, high dye concentration leads to stacking on the outside of the NA. Massively stacked AO (En), for example, also results in metachromatic fluorescence of polyanionic glycosaminoglycans. Classical monomerizing and aggregating model substrates for intercalative and external binding modes to NAs have been described [8].
At first sight, it would seem that external binding should readily explain the ortho- vs. metachromatic emission of AO interacting with NAs. However, both DNA and RNA offer one phosphate group per nucleobase. Therefore, external binding does not properly explain the differential emission from DNA and RNA, that is, the experimentally shown capacity to distinguish strandedness. If external binding is the main interaction between AO and NAs, then both DNA and RNA should display an orthochromatic green emission at low concentrations and a metachromatic red emission at high concentrations.
We here propose that internal, intercalative binding of AO between nucleobases can satisfactorily explain the differential fluorescent emission observed between DNA and RNA, irrespective of the concentration employed to label/stain the biological sample. To support such a proposal, it is first necessary to provide some grounds to understand the particular details of this binding mode. First, it is worth noting that intercalation can only take place in the second free position between base pairs in double-stranded NAs, namely following the “nearest neighbor exclusion principle”, due to severe constraints for elongation and unwinding of polynucleotide duplexes [21,22]. However, under denaturation conditions promoting single-strandedness, ssNA chains can freely elongate and unwind, allowing unrestricted intercalation access, and this is a central feature of our model to understand AO staining after DNA denaturation-reassociation procedures (see later). An external AO binding with massive dye stacking is also assumed to explain the clear metachromatic emission of ssRNA in nucleoli and basophilic cytoplasm from fixed cells (see Figure 5), but an absence of intercalation cannot be excluded.
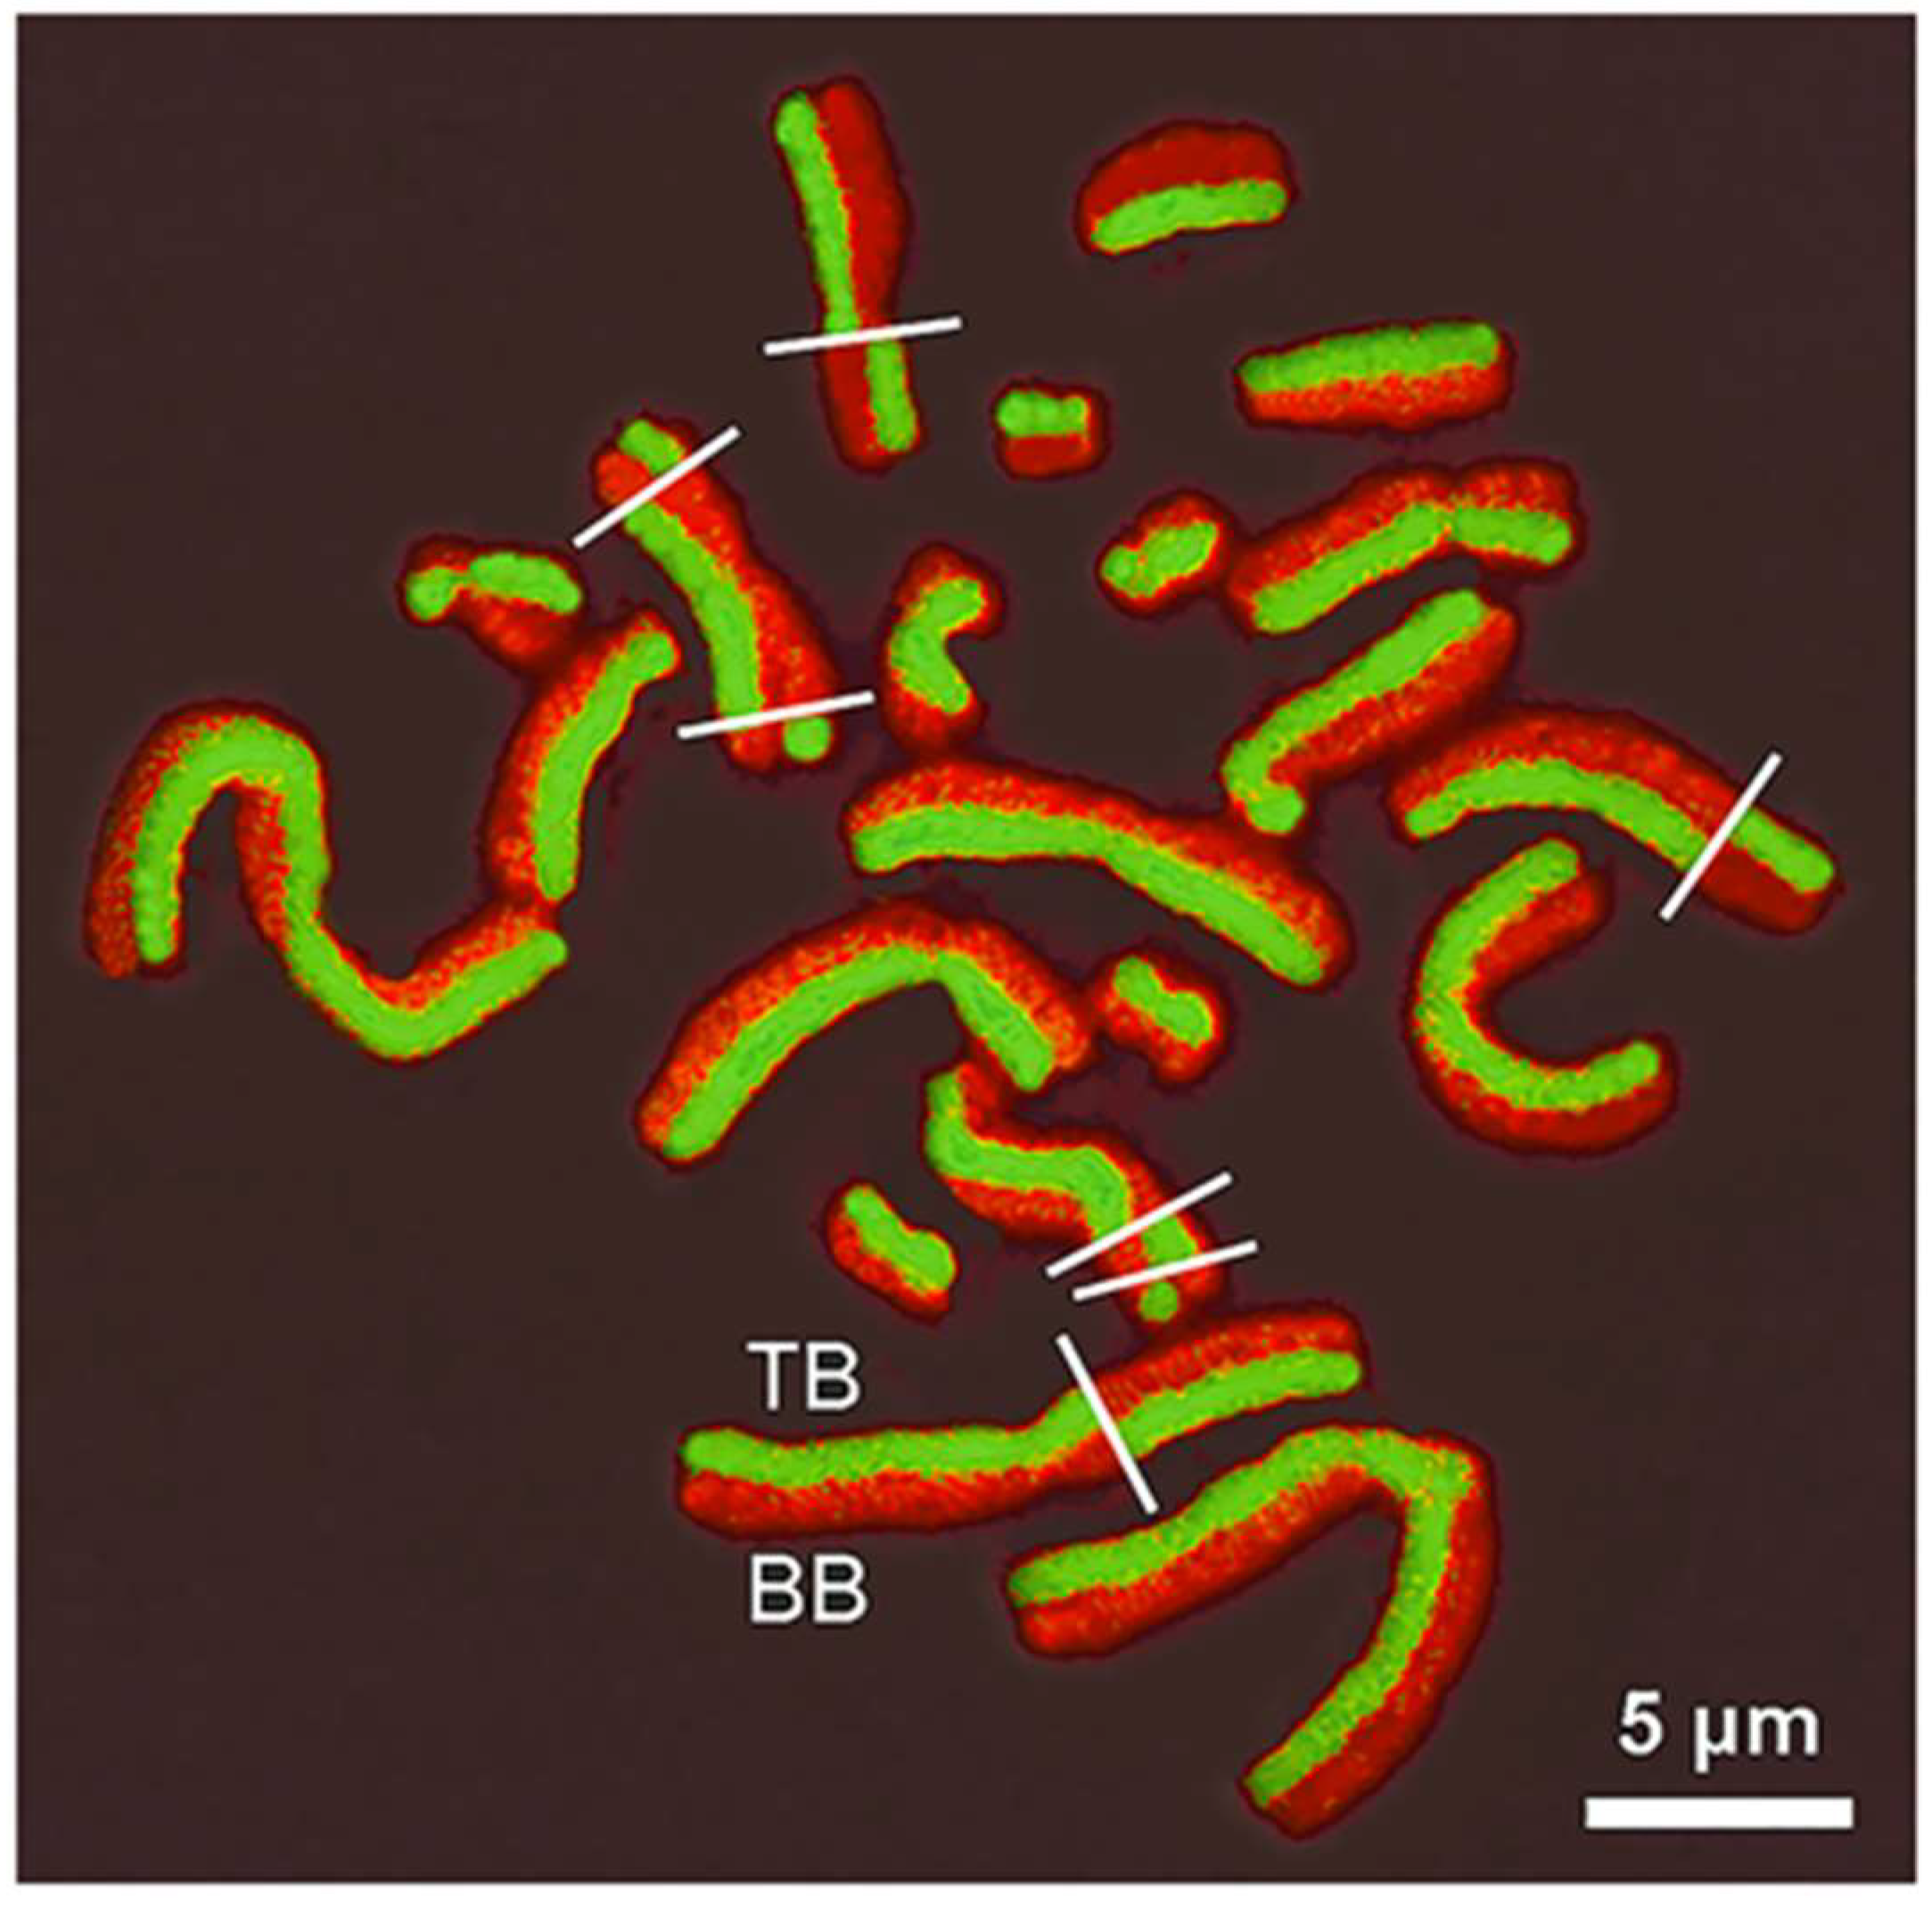
To further substantiate this proposed model, additional experimental arguments are provided. In the case of modified chromatin DNA (therefore dsNAs) due to specific cytogenetic procedures, different AO ortho- vs. metachromatic fluorescence colors appear according to the strandedness of the final products. In particular, when BrdU is incorporated into DNA for two cell cycles, two types of chromatids are produced: one with thymidine and BrdU (TB chromatid) and another completely substituted with BrdU in both chromatids (BB chromatid). After direct AO staining, TB and BB chromatids appear with green and red fluorescence, respectively [15,16,19], which is clearly seen in Figure 7. In this sister chromatid differentiation (SCD) method, ds- and ssDNA generate green (TB chromatid) and red (BB chromatid) signals, respectively. The process is related to the differential strandedness produced by lesser or greater chromatin disorganization and DNA denaturation induced by aggressive protocols (acid or alkaline pH, heating, UV irradiation) applied after bromo-substitution [16,19,23]. After the treatment, BB chromatid displays ssNAs and TB chromatid dsNAs.
Differentially AO-stained chromatids that underwent sister chromatid exchanges (SCE) have a harlequin appearance when observed under fluorescence excitation as a consequence of the differential ortho- or metachromatic emission. Chromatids with no or low content of Br-substitution show a concave shape, whereas a convex shape appears in those with high content of Br-substitution. This curvature is due to the different chromatin degrees of spatial compaction related to changes in chromosomal proteins (i.e., histone H2B) and their binding to DNA in chromatids more or less enriched in BrdU [19].
Cytochemical studies on chromosome banding patterns [24] were initiated by the pioneering work of Caspersson’s group [25] using the acridine dye quinacrine and its alkylating bis-chloroethyl derivative, quinacrine mustard. These fluorochromes showed fluorescence quenching at GC-rich sites and revealed selectively AT-rich regions [26], which are now known as Q/G bands. Similarly, the possibility of analyzing the DNA strandedness by AO staining of fixed cells was described early [10,27]. A differential ortho- and metachromatic fluorescence along mitotic and meiotic chromosomes was achieved via DNA denaturation-reassociation followed by AO staining [11]. Denaturation-reassociation studies take advantage of the differential time of reestablishment of double-strandedness for different regions of DNA after complete denaturation, attending to their sequence composition. Highly repetitive regions will renature faster than low repetitive sequences, providing a method to distinguish among them. Thus, the highly repetitive DNA in the centromeric heterochromatin from mouse chromosomes, containing numerous consecutive ([dA]4-6[dT]4-6)n sequences [28,29] can be visualized with green fluorescence (dsNA) after renaturation of the fast-reassociating repetitive sequences for 30 s. In contrast, the non-repetitive and slow-reassociating sequences in chromosome arms show a red emission (ssNA) (Figure 8).
Undenatured mouse chromosomes, before any denaturation-renaturation proceeding, show a general bright green emission, with centromeric regions fluorescing in green, too, but somewhat weaker than chromatid arms. After using the DRAO method, the observed reassociation kinetics clearly indicate that without reassociation, a homogeneous red metachromatic fluorescence occurs in all chromosomes, whereas with a prolonged reassociation time (2–10 min), all chromosome regions have regained the green orthochromatic emission again. As it is known that the centromeric heterochromatin DNA regions of mouse chromosomes (Q/G bands) are AT-rich (approximately 69% AT), appearing composed of a highly repetitive 230–240 base pair unit [28], fast DNA reassociation in these regions is allowed due to the easy in-phase reformation of H bonding, in spite of any potential linear displacement of ssDNA chains during the processes. This fast reassociation is not possible for non-repetitive sequences.
In summary, the experimental results point to a clear differential fluorescence behavior of AO in the presence of either dsNAs (green orthochromatic emission) or ssNAs (red metachromatic emission). In order to try to explain this long-standing, interesting, and useful phenomenon, we advance a potential model that could explain the phenomenon, attending to the differences in the local concentration of AO in the presence of dsNAs or ssNAs.
Firstly, external AO binding is considered invalid to explain the observed differential fluorescence patterns because this binding mode should not distinguish between ds- and ssNAs: both should promote non-stacking AO binding (leading to orthochromatic emission) at low concentrations and stacking binding (leading to metachromatic emission) at high concentrations. Then, we proceed to consider if differences in the internal, intercalating binding mode can indeed explain the differential fluorescence. When in the presence of dsNAs, AO intercalates between available bases. Given the known fact that, within a broad range of AO concentrations, only one very two available sites will be occupied by AO (nearest neighbor exclusion principle [21,22]), within dsNAs any two AO molecules should be apart enough so that overlapping of their π-electrons is negligible. Consequently, the electronic excitation energy after photon absorption by an AO molecule is not shared among two or more AO units (they are, effectively non-stacked and isolated from each other), finally leading to monomer orthochromatic emission (Figure 9A). A second scenario occurs when AO interacts with denatured dsNAs (Figure 9B). Here, each NA strand is no longer constrained by the other strand through the base-to-base hydrogen bonding. A higher amount of unwinding is tolerated, which should pave the way for discretional AO intercalation at every available site above a certain AO concentration. The nearest neighbor exclusion principle is no longer in order. If enough AO is available, then full intercalation is expected. Now, distances between intercalated AO units should be small enough for appreciable π-electron overlapping. Upon light excitation, the available electronic excitation energy could be shared among several stacked AO units, leading to metachromatic fluorescence. Finally, ssNAs like RNA, offer the same molecular environment as denatured dsNAs (compare Figure 9B,C). The same reasoning applies then in this case as that introduced to explain metachromatic emission for denatured dsNAs.
Interestingly, complexes involving dye intercalation between nucleobases of ssNAs were already described, in agreement with the present structural model for ssNAs-AO complexes. This is the case for poly(U)-ethidium bromide [30] and poly(A)-AO [31]. In this model, intercalation of AO takes place with the N groups toward the DNA minor groove [32,33,34]. As denatured ssDNA chains could elongate and result in an unwound ladder-like structure (see the intercalated complex [35]), easy in phase renaturation is expected to occur only for repetitive (dA)n(dT)n sequences. Obviously, a similar purine- and pyrimidine-AO stacking pattern can form in ssNAs. Therefore, it can be proposed that freely intercalated AO monomers into ssNAs are the component units responsible for the conformation enabling the metachromatic emission of the fluorochromes under slow- or non-reassociating DNA conditions or bound to ssRNA in fixed cell structures.

4. Conclusions

Herein are summarized the proposals for a potential mechanistic explanation of some ortho- and metachromatic fluorescence reactions after AO staining of biological samples. The green AO signal from dsDNA in fixed cells would be due to limited intercalation of dye monomers, according to the nearest neighbor exclusion principle, without π-electron coupling among the monomers due to the excessive microscopic distance. On the other hand, AO interaction with ssNAs permits free intercalation at, presumably, all available positions, favoring π-electron coupling, sharing of electronic excitation energy, and metachromatic emission. This would broadly explain the observed emission differences in experiments employing AO biological labeling/staining.
However, why does not a red emission due to massive external binding to phosphates occur in dsDNA? A simple explanation could be that even after fixation, phosphate groups remain bound to basic residues from nucleosomal histones, whereas in the case of RNA, these groups are generally free [36]. In contrast, after AO labeling of live cells, chromatin DNA and RNA from cytoplasm and nucleoli fluoresce in green [8,14].
Interestingly, a comparison of different dsDNA substrates (chromatids, chromosome regions) allows for a more precise interpretation of DNA strandedness after different experimental conditions and AO staining. In SCD, the AO signal from highly Br-substituted chromatids (BB) is red due to greater DNA denaturation than in BT or TT chromatids, which appear in green. Likewise, after the DRAO procedure, native dsDNA and fast-reassociating DNA are green, whereas denatured ssDNA and slow- or non-reassociating DNA are red. As ssRNA and ssDNA have no restriction to elongate and unwind, dye intercalation along each nucleobase plane is possible, avoiding the nearest neighbor exclusion principle. Thus, the proposed model neatly explains the observed differences depending on the available intercalation sites. Some practical applications of the AO differential fluorescence have been described in this work. Although new possible uses of this phenomenon are not intended to be introduced in the present work, only a new interpretation of its potential action mechanism is advanced; its application in flow cytometry and fluorescent cell sorting could take advantage of this differential emission after particular treatments that could alter the genetic material of cells.
In conclusion, in this work, we have shown that revisiting and updating several AO staining procedures allows for a deeper understanding of the fluorescence mechanisms induced by AO bound to specific substrates. This proposal should contribute to a better interpretation of the differential AO fluorescence using this classical fluorochrome as a sensitive chemosensor for the demonstration of NA strandedness.

Author Contributions

Conceptualization, J.C.S.; methodology, A.B.-C.; software, J.C.S.; investigation, J.C.S. and A.B.-C.; writing—original draft preparation, J.C.S.; writing—review and editing, J.C.S. and A.B.-C.; supervision, J.C.S. and A.B.-C. All authors have read and agreed to the published version of the manuscript.

Funding

This research received no external funding.

Institutional Review Board Statement

Not applicable.

Informed Consent Statement

Not applicable.

Data Availability Statement

All data generated or analyzed during this study are included in the published article.

Acknowledgments

We thank J.L. Bella, J. Espada, M.N. Felix-Pozzi and J.A. Lisanti for valuable collaboration, stimulating discussions, and critical reading of the manuscript.

Conflicts of Interest

The authors declare no conflict of interest.

References

  1. Strugger, S. Fluorescence microscope in examination of bacteria in soil. Can. J. Res. 1948, C26, 188–193. [Google Scholar] [CrossRef] [PubMed]
  2. Dart, L.H.; Turner, T.R. Fluorescence microscopy in exfoliative cytology. Acridine orange examination of 5491 cases, with comparison by the Papanicolaou technic. Lab. Investig. 1959, 8, 1513–1522. [Google Scholar] [PubMed]
  3. Kasten, F.H. Cytochemical studies with acridine orange and the influence of dye contaminants in the staining of nucleic acids. Int. Rev. Cytol. 1967, 21, 141–202. [Google Scholar] [CrossRef]
  4. Bobrow, M. Acridine orange and the investigation of chromosome banding. Cold Spring Harb. Symp. Quant. Biol. 1973, 138, 435–440. [Google Scholar] [CrossRef]
  5. Lillie, R.D. Conn’s Biological Stains, 9th ed.; Williams and Wilkins: Baltimore, MD, USA, 1977. [Google Scholar]
  6. Kasten, F.H. Methods for Fluorescence Microscopy. In Staining Procedures Used by the Biological Stain Commission, 4th ed.; Clark, G., Ed.; Williams and Wilkins: Baltimore, MD, USA, 1981; pp. 39–103. [Google Scholar]
  7. Horobin, R.W.; Kiernan, J.A. (Eds.) Conn’s Biological Stains. In A Handbook of Dyes, Stains and Fluorochromes for Use in Biology and Medicine, 10th ed.; Bios Scientific Publishers: Oxford, UK, 2002. [Google Scholar]
  8. Stockert, J.C.; Blázquez-Castro, A. Fluorescence Microscopy in Life Sciences; Bentham Science Publishers: Sharjah, United Arab Emirates, 2017. [Google Scholar] [CrossRef]
  9. von Bertalanffy, L.; Bickis, I. Identification of cytoplasmic basophilia (ribonucleic acid) by fluorescence microscopy. J. Histochem. Cytochem. 1956, 4, 481–493. [Google Scholar] [CrossRef] [PubMed]
  10. Rigler, R.; Killander, D.; Bolund, L.; Ringertz, N.R. Cytochemical characterization of deoxyribonucleoprotein in individual cell nuclei. Exp. Cell Res. 1969, 55, 215–224. [Google Scholar] [CrossRef]
  11. Stockert, J.C.; Lisanti, J.A. Acridine orange differential fluorescence of fast and slow reassociating DNA after in situ DNA denaturation and reassociation. Chromosoma 1972, 37, 117–130. [Google Scholar] [CrossRef]
  12. Kasten, F.H. Acridine dyes. In The Encyclopedia of Microscopy and Microtechnique; Gray, P., Ed.; Van Nostrand Reinhold: New York, NY, USA, 1973; pp. 4–7. [Google Scholar]
  13. Stockert, J.C. Cytochemistry of nucleic acids: Binding mechanisms of dyes and fluorochromes. Biocell 1985, 9, 89–131. [Google Scholar]
  14. Horobin, R.W.; Stockert, J.C.; Rashid-Doubell, F. Uptake and localisation of small-molecule fluorescent probes in living cells: A critical appraisal of QSAR models and a case study concerning probes for DNA and RNA. Histochem. Cell Biol. 2013, 139, 623–637. [Google Scholar] [CrossRef]
  15. Kato, H. Spontaneous sister chromatid exchanges detected by a BrdU-labelling method. Nature 1974, 251, 70–72. [Google Scholar] [CrossRef]
  16. Mezzanotte, R.; Nieddu, M. A historical overview of bromo-substituted DNA and sister chromatid differentiation. Meth. Mol. Biol. 2014, 1094, 89–98. [Google Scholar] [CrossRef]
  17. Love, L.D. Fluorescence microscopy of viable mast cells stained with different concentrations of acridine orange. Histochemistry 1979, 62, 221–225. [Google Scholar] [CrossRef]
  18. Roth, D.; London, M.; Manjon, M. Binding specificity and affinity of acriflavine for nucleic acids. Stain Technol. 1967, 42, 125–132. [Google Scholar] [CrossRef] [PubMed]
  19. Ribas, M.; Korenberg, J.R.; Peretti, D.; Pichiri, G.; Stockert, J.C.; Gosalvez, J.; Mezzanotte, R. Sister chromatid differentiation in 5-bromo-2′-deoxyuridine-substituted chromosomes: A study with DNA-specific ligands and monoclonal antibody to histone H2B. Chrom. Res. 1994, 2, 428–438. [Google Scholar] [CrossRef] [PubMed]
  20. Lerman, L.S. The structure of the DNA-acridine complex. Proc. Natl. Acad. Sci. USA 1963, 49, 94–102. [Google Scholar] [CrossRef]
  21. Saenger, W. Principles of Nucleic Acid Structure; Springer: New York, NY, USA; Berlin/Heidelberg, Germany, 1984. [Google Scholar] [CrossRef]
  22. Blackburn, G.M.; Gait, M.J. Nucleic Acids in Chemistry and Biology; Oxford University Press: Oxford, UK; New York, NY, USA; Tokyo, Japan, 1990; pp. 310–336. [Google Scholar]
  23. Mezzanotte, R.; Peretti, D.; Orru’, S.; Rossino, R.; Ennas, M.G.; Gosalvez, J. DNA alteration induced by ultraviolet light in human metaphase chromosomes substituted with 5′-bromodeoxy uridine: Monitoring by monoclonal antibodies to double-stranded and single stranded DNA. Chromosoma 1989, 97, 356–362. [Google Scholar] [CrossRef] [PubMed]
  24. Bickmore, W.; Craig, J. Chromosome Bands: Pattern in the Genome; Springer: Berlin/Heidelberg, Germany, 1997. [Google Scholar]
  25. Caspersson, T.; Zech, L.; Johansson, C.; Modest, E.J. Identification of human chromosomes by DNA binding fluorescent agents. Chromosoma 1970, 30, 215–227. [Google Scholar] [CrossRef] [PubMed]
  26. Weisblum, B.; De Haseth, P.L. Quinacrine, a chromosome stain specific for deoxyadenylate-deoxythymidylate rich regions in DNA. Proc. Natl. Acad. Sci. USA 1972, 69, 629–632. [Google Scholar] [CrossRef]
  27. Nash, D.; Plaut, W. On the denaturation of chromosomal DNA in situ. Proc. Natl. Acad. Sci. USA 1964, 51, 731–735. [Google Scholar] [CrossRef]
  28. Hörz, W.; Altenburger, W. Nucleotide sequence of mouse satellite DNA. Nucleic Acids Res. 1981, 9, 683–696. [Google Scholar] [CrossRef]
  29. Redi, C.A.; Garagna, S.; Della Valle, G.; Bottiroli, G.; Dell’Orto, P.; Viale, G.; Peverali, F.A.; Raimondi, E.; Forejt, J. Differences in the organization and chromosomal allocation of satellite DNA between the European long tailed house mice Mus domesticus and Mus musculus. Chromosoma 1990, 99, 11–17. [Google Scholar] [CrossRef]
  30. Kreishman, G.P.; Chan, S.I.; Bauer, W. Proton magnetic resonance study of the interaction of ethidium bromide and several uracil residues, uridylyl (3′→5′) uridine and polyuridylyc acid. J. Mol. Biol. 1971, 61, 45–59. [Google Scholar] [CrossRef] [PubMed]
  31. von Tscharner, V.; Schwarz, G. Complex formation of acridine orange with single-stranded polyriboadenylic acid and 5’-AMP: Cooperative binding and intercalation between bases. Biophys. Struct. Mech. 1979, 5, 75–90. [Google Scholar] [CrossRef] [PubMed]
  32. Alden, C.J.; Arnott, S. Visualization of planar drug intercalation in B-DNA. Nucleic Acids Res. 1975, 2, 1701–1717. [Google Scholar] [CrossRef] [PubMed]
  33. Reddy, B.S.; Seshadri, T.P.; Sakore, T.D.; Sobell, H.M. Visualization of drug-nucleic acid interactions at atomic resolution. J. Mol. Biol. 1979, 135, 787–812. [Google Scholar] [CrossRef] [PubMed]
  34. Wang, A.H.J.; Quigley, G.C.; Rich, A. Atomic resolution analysis of a 2:1 complex of CpG and acridine orange. Nucleic Acids Res. 1979, 6, 3879–3890. [Google Scholar] [CrossRef]
  35. Arnott, S.; Bond, P.J.; Chandrasekaran, R. Visualization of an unwound DNA duplex. Nature 1980, 287, 561–563. [Google Scholar] [CrossRef]
  36. Alfert, M.; Geschwind, I.I. A Selective Staining Method for the Basic Proteins of Cell Nuclei. Proc. Natl. Acad. Sci. USA 1953, 39, 991–999. [Google Scholar] [CrossRef]
Figure 1. Chemical structure of AO shows the acridine core (three fused benzene-like rings) and two functional side groups (dimethylamino). A resonance is established among the different potential isomers. Resonant (green arrow) paraquinone isomers (A,B), the orthoquinone form (C), and the uncharged (unprotonated) free base with atom numbering (D).
Chemosensors 11 00540 g001
Figure 2. Differences between fixed (A) and living cells (B) subjected to staining or labeling with AO. The schemes show AO uptake and localization mechanisms related to the equilibrium between the protonated (cationic) and deprotonated (free base, yellow). AO monomers are shown as green bars, and AO aggregates as red bars. It must be taken into account that in the case of fixed cells (A), the binding of AO to ss-RNA in nucleolus and cytoplasm is shown following only the classical view, namely, external binding of aggregates and not intercalation. Note the difference between NAs-associated fluorescence for live or fixed cells, as well as the difference between DNA and RNA in fixed cells. (Reprinted from Fluorescence Microscopy in Life Sciences, Stockert JC and Blázquez-Castro A. Chapter 15, Vital Probes 1. Cell organelles, pp. 481–531. Copyright (2017), with permission from Bentham).
Chemosensors 11 00540 g002
Figure 3. Normalized fluorescence spectra of different molar concentrations of AO in distilled water under the same excitation wavelength (λexc: 440 nm). Note the emission shift toward longer wavelengths (bathochromism) from the initial green fluorescence at 10−7 M (orthochromatic emission) to the yellow and red emissions (metachromatic fluorescence, values of emission peaks at curves top) with increasing AO concentrations.
Chemosensors 11 00540 g003
Figure 4. Scheme of fluorescence of mast cells at increasing AO concentrations as a microscopic model for orthochromasia (chromatin DNA) and metachromasia (heparin-containing cytoplasm granules) under excitation at 436 nm [17]. At low AO concentrations, all AO cell emission is orthochromatic (green). Increasing AO concentration leads to some structures retaining an orthochromatic emission (nucleus) while others (cytoplasmic granules) display a metachromatic turn. Observe the limited range of AO concentrations where simultaneous ortho- and metachromatic structures are clearly discernible (dashed squares) as a consequence of bathochromism. At high enough AO concentrations, all emission is metachromatic.
Chemosensors 11 00540 g004
Figure 5. Differential NA fluorescent emission by AO. Smear of Ehrlich ascites tumor cells (EATC, large cells) fixed in methanol (2 min) and stained with AO, showing the orthochromatic (green) and metachromatic (red) fluorescence of chromatin DNA (Ch) and basophilic cytoplasm, respectively. Note also the subtle but appreciable metachromatic emission from the RNA-rich nucleoli. L: lymphocyte. Nu: nucleoli. λexc: 436 nm. (Reprinted from Fluorescence Microscopy in Life Sciences, Stockert JC and Blázquez-Castro A. Chapter 5, Spectral Analysis, pp. 135–158. Copyright (2017), with permission from Bentham).
Chemosensors 11 00540 g005
Figure 6. Schematic structure of a double-stranded nucleic acid (dsNA, lateral view showing horizontal base pairs as coarse dotted areas) and commonly accepted binding modes for planar cationic dyes (fine dotted areas) to it. Either internal, hydrophobic-driven binding between nucleobases or external, through ionic interactions with the NA backbone, binding modes are possible under this model. Note the potential for dye stacking and metachromatic emission following external binding under high colorant concentration. I: intercalating dye; E1 and E2: external binding of a dye monomer and dimer, respectively; En: external binding of a dye aggregate. Black circles indicate NA backbone phosphate groups.
Chemosensors 11 00540 g006
Figure 7. Metaphase chromosomes from a CHO-K1 cell grown for two division cycles in the presence of BrdU showing SCD after AO staining [19]. Cells were grown in Ham’s F12 medium containing 15% fetal calf serum and 75 mM HEPES buffer and treated with 5-bromo-2′-deoxyuridine (BrdU, 10 µg/mL for two division cycles). Cells were resuspended in 0.075 M KC1 for 10 min, fixed in methanol-acetic acid (3:1), spread onto cold, clean slides, air-dried, and stained using AO. Green emission from dsDNA and red emission from ssDNA correspond to TB and BB chromatids, respectively, which further appear with concave and convex shape. White lines highlight points of sister chromatid exchanges, appreciable by the dramatic swap between emission colors in the same chromatid. λexc: 450–490 nm (Reprinted from Fluorescence Microscopy in Life Sciences, Stockert JC, and Blázquez-Castro A. Chapter 4, Fluorescent Labels, pp. 96–134. Copyright (2017), with permission from Bentham).
Chemosensors 11 00540 g007
Figure 8. Cytochemical AO visualization of the highly repetitive DNA in the centromeric heterochromatin (CH) from mouse prometaphase (A) and metaphase chromosomes (B) after denaturation and differential renaturation of fast-reassociating, highly repetitive AT-rich DNA sequences in the centromeres. Green orthochromatic emission appears in these dsNA regions. Meanwhile, red metachromatic fluorescence comes from the non-reassociated, low-repetition sequences in ssNA chromosomal arms. Observe the clusters of CH, which will form heterochromatic chromocenters in interphase nuclei after mitosis resolves. Y: chromosome Y, lacking CH.
Chemosensors 11 00540 g008
Figure 9. Schematic representation of different types of NA-AO fluorescence emission due to the differences in local AO concentration. Cyan rectangles: nucleobases; Yellow circles: positive partial charges of N atoms in AO, shown as resonant in (B,C) and localized in (A); Vertical black lines: pentose-phosphate chains; Black circles: phosphate groups; WC-H: Watson and Crick H-bonding. Potentially overlapping electronic energy levels (blue, violet) involving AO (green or red) and nucleobases (cyan) are shown (asterisks). Note the isolated nature of the proposed fluorescent emission “units” (dashed rectangles) in the case of dsDNA-AO complex (A), favoring orthochromatic emission (green AO). In contrast, ssDNA/ssRNA-AO complexes would display extended fluorescent emission “units” due to overlapping AO-nucleobases π-electrons ((B,C), ssDNA-AO and RNA-AO), leading to metachromatic fluorescence (red AO).
Chemosensors 11 00540 g009
Disclaimer/Publisher’s Note: The statements, opinions and data contained in all publications are solely those of the individual author(s) and contributor(s) and not of MDPI and/or the editor(s). MDPI and/or the editor(s) disclaim responsibility for any injury to people or property resulting from any ideas, methods, instructions or products referred to in the content.

