

Modifying Headspace Sampling Environment Improves Detection of Boar Taint Compounds in Pork Fat Samples


Abstract
:1. Introduction
2. Materials and Methods
2.1. Samples
2.2. Sample Characterization
2.2.1. Skatole and Androstenone Quantification in Backfat
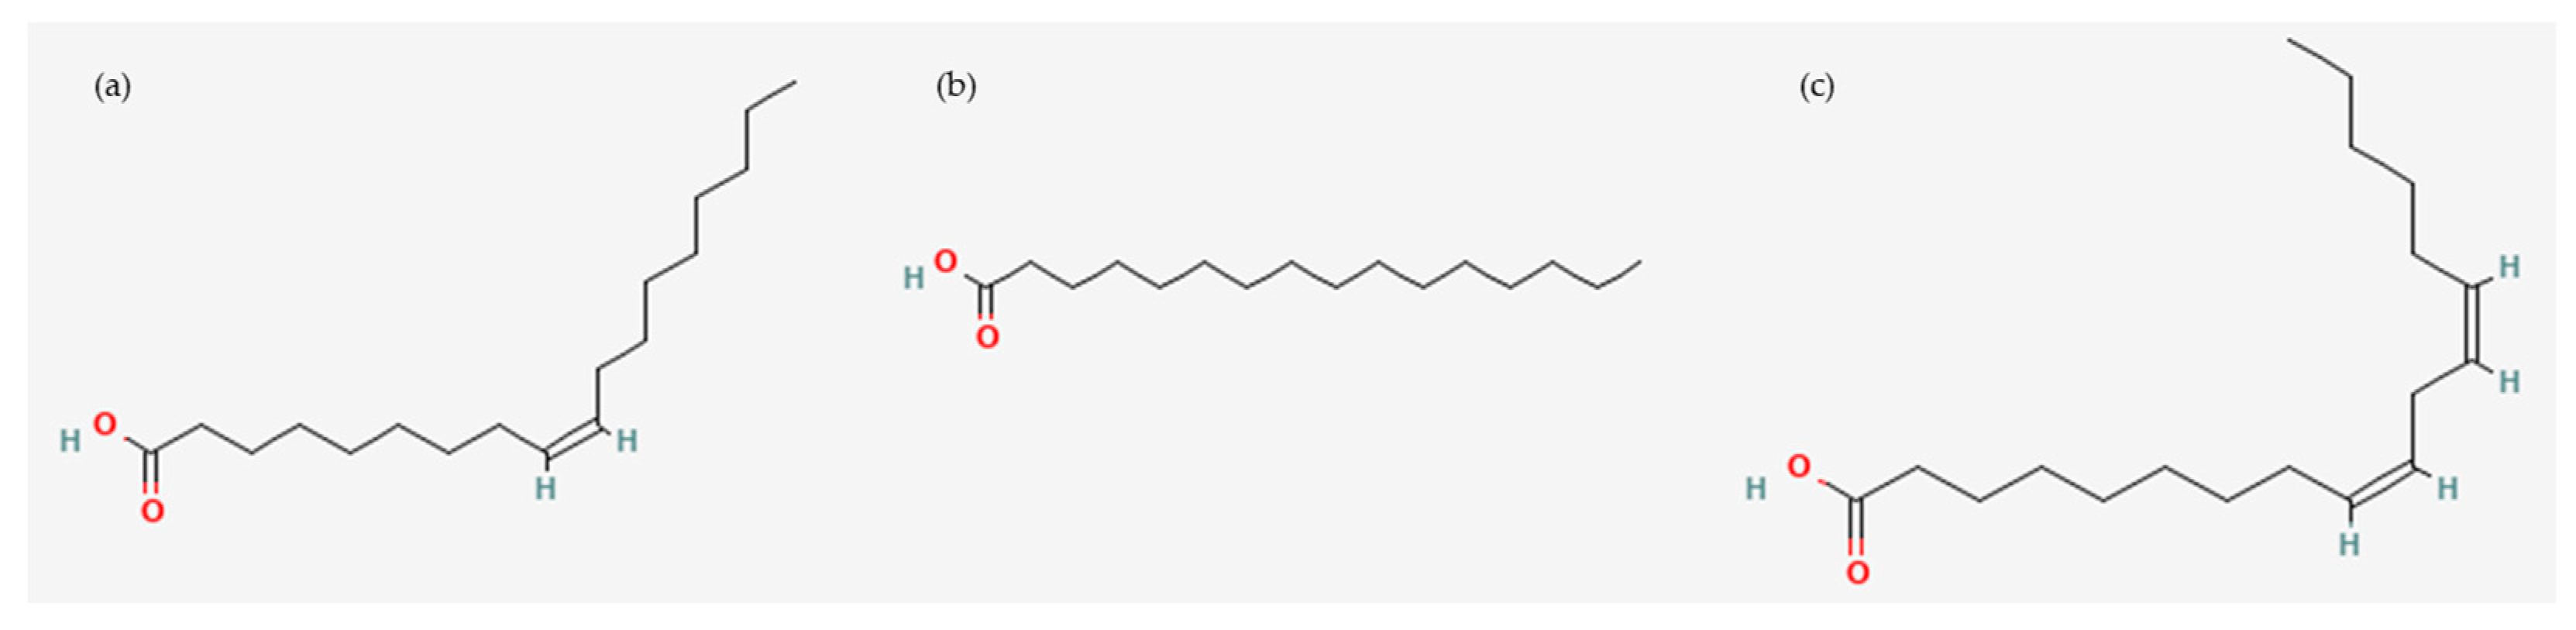
2.2.2. Fatty Acid Composition Analysis
2.3. Variation of the Sampling Parameters on VOC Extraction from Fat
2.3.1. Studied Parameters
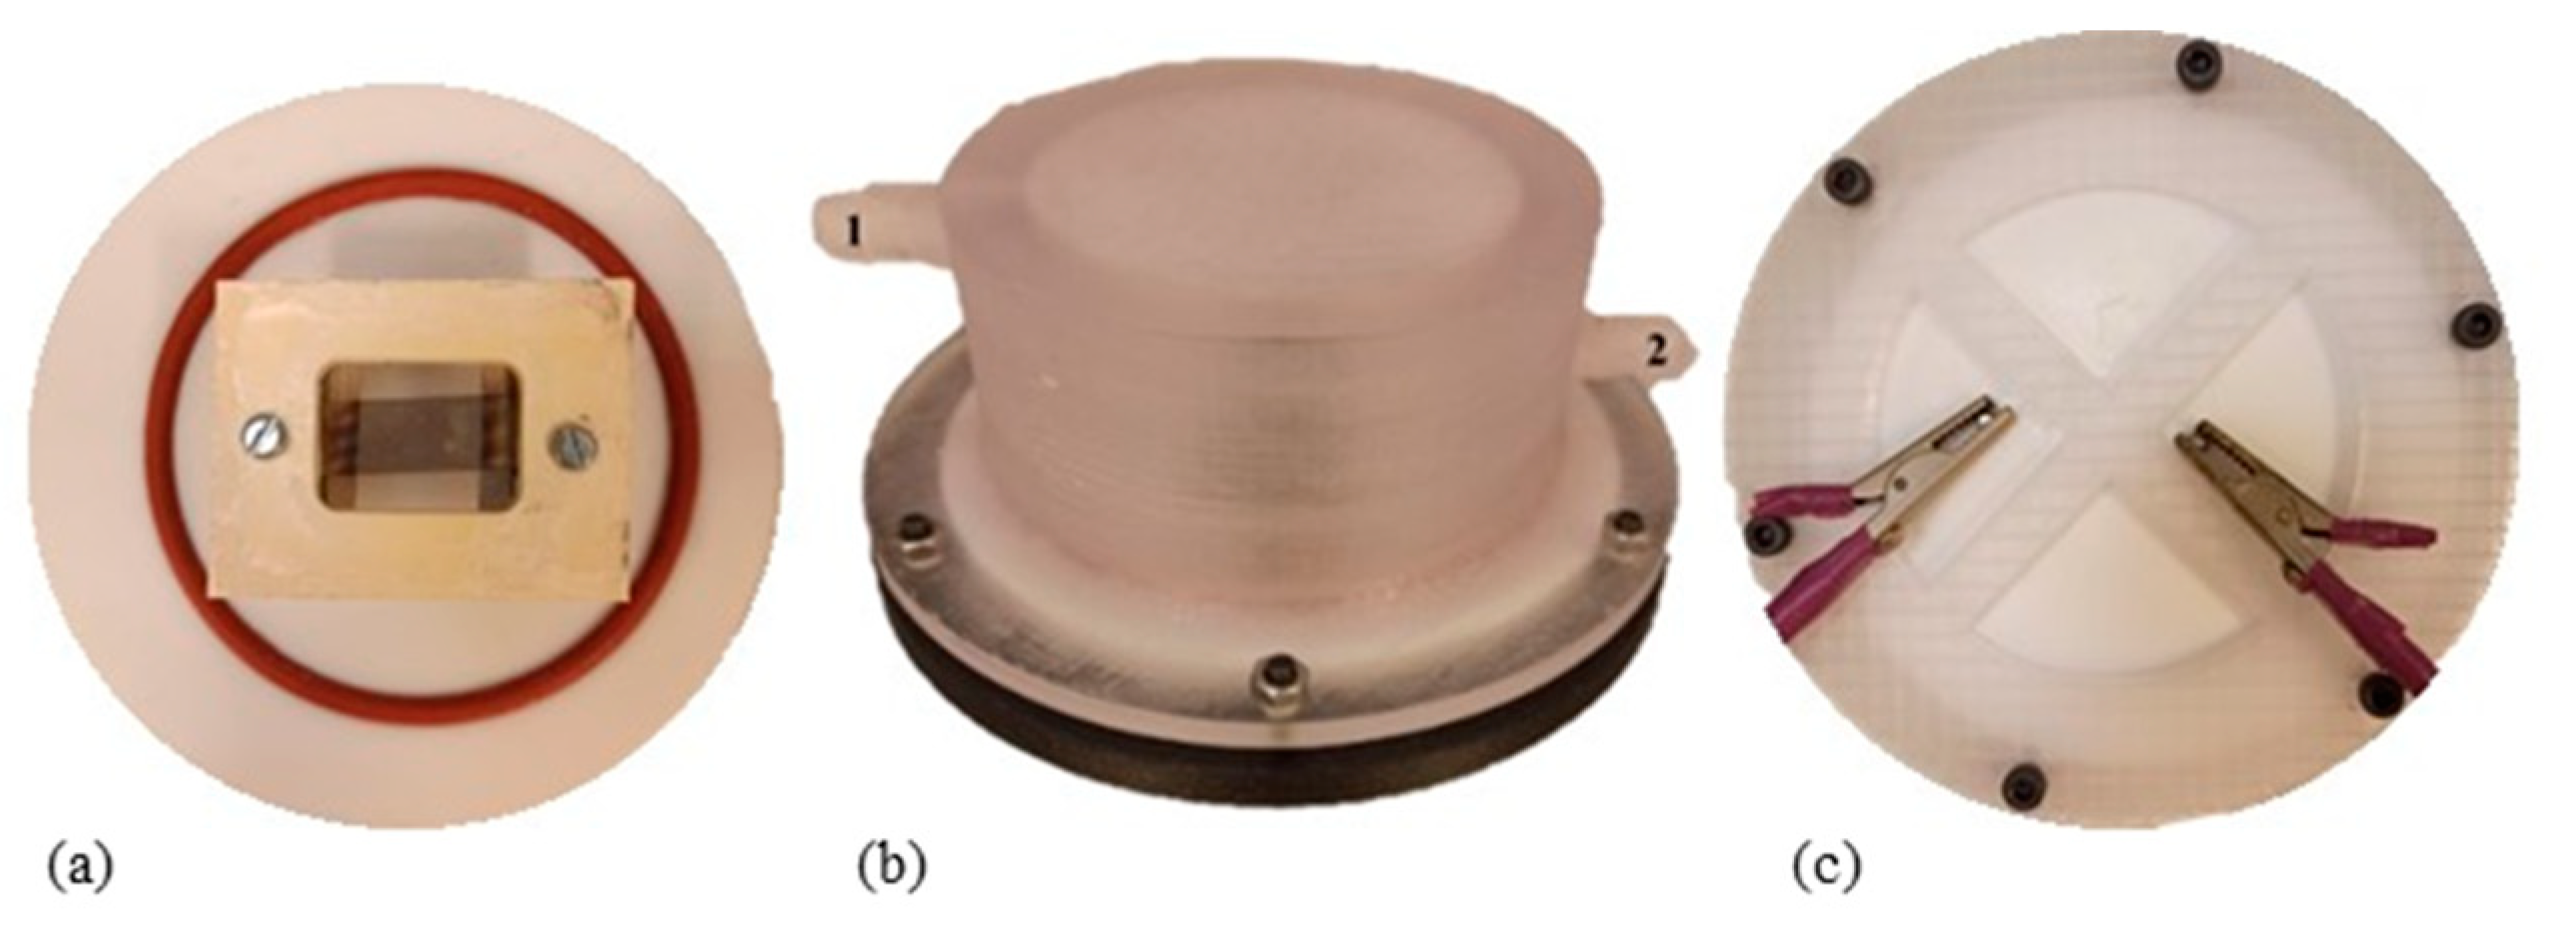
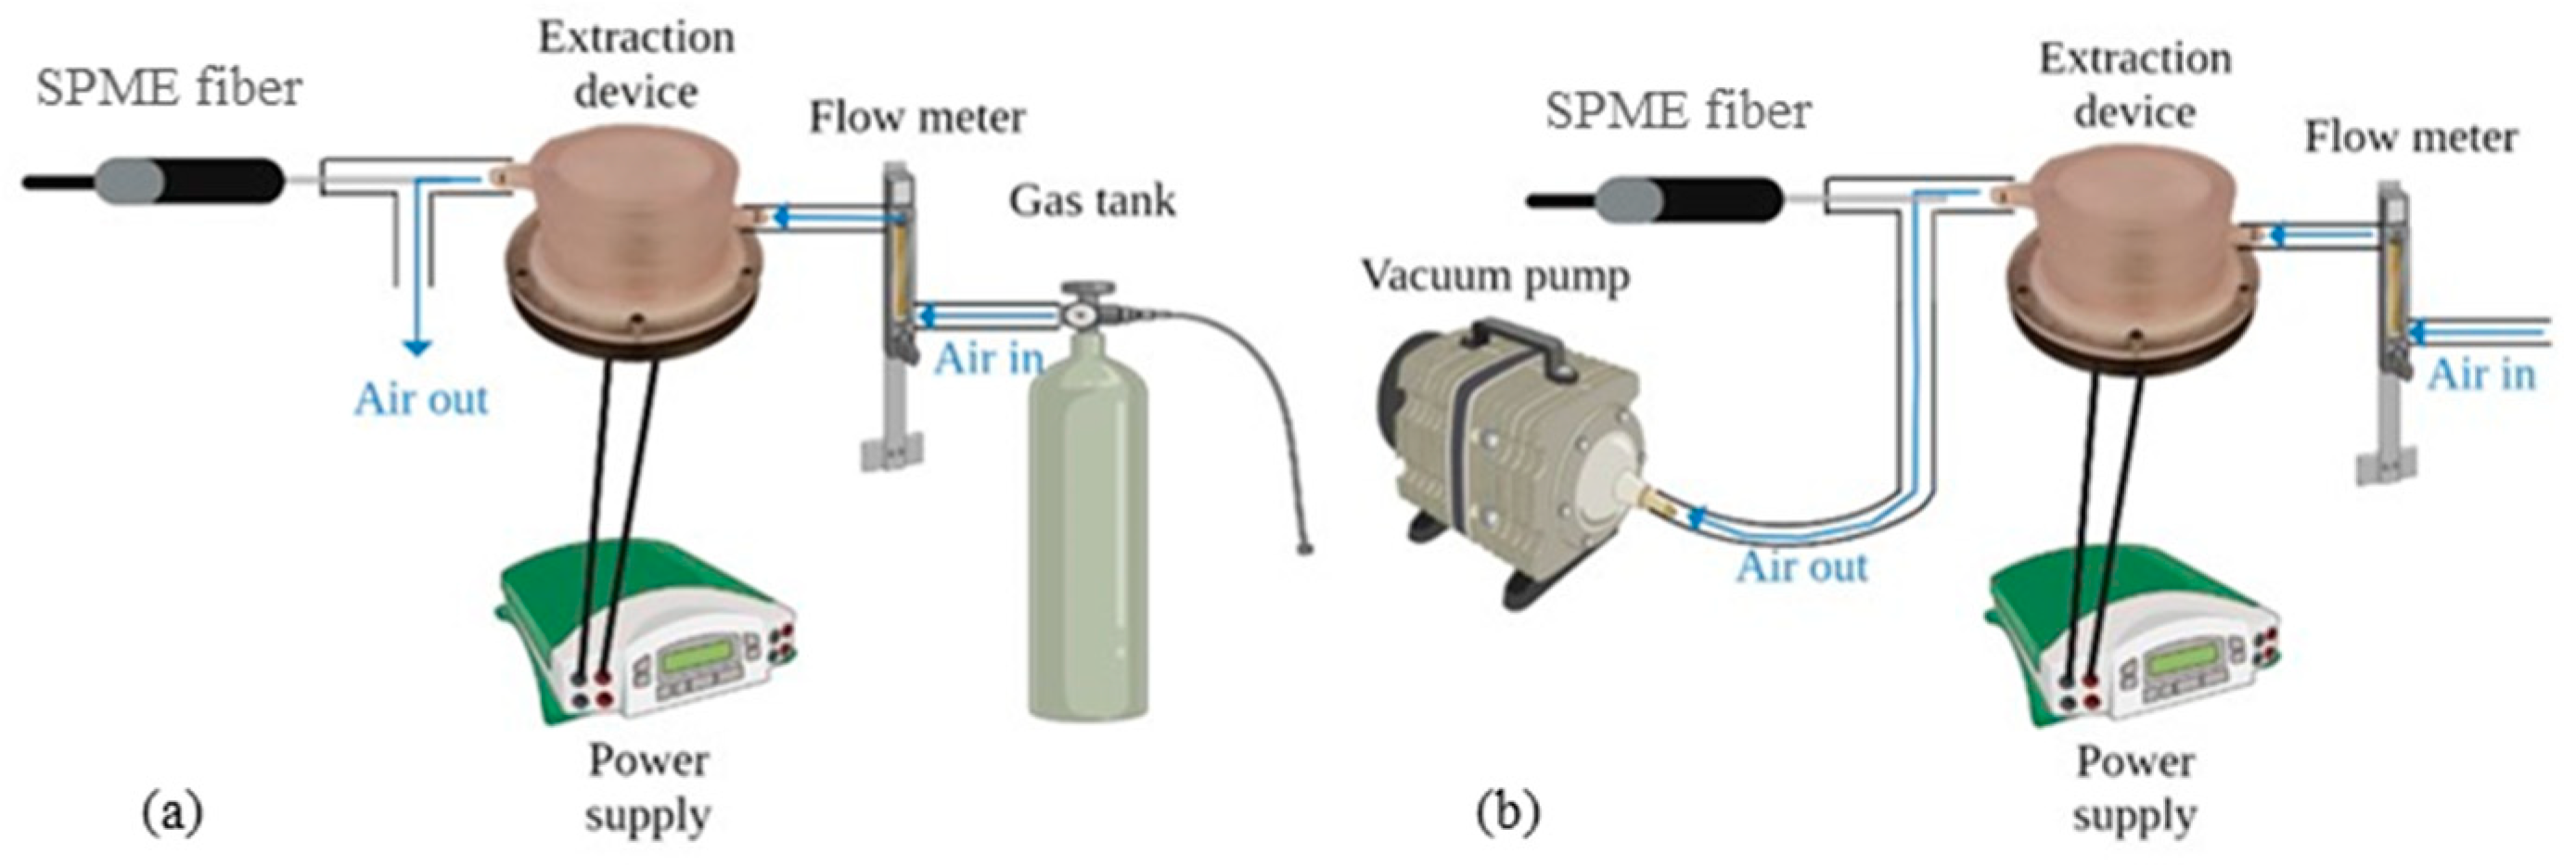
2.3.2. Heating Device Description
2.3.3. Extraction Parameters for Heating of Fat and VOC Sampling
2.3.4. SPME-GC-MS VOCs Analyses
2.4. Statistical Analysis
3. Results
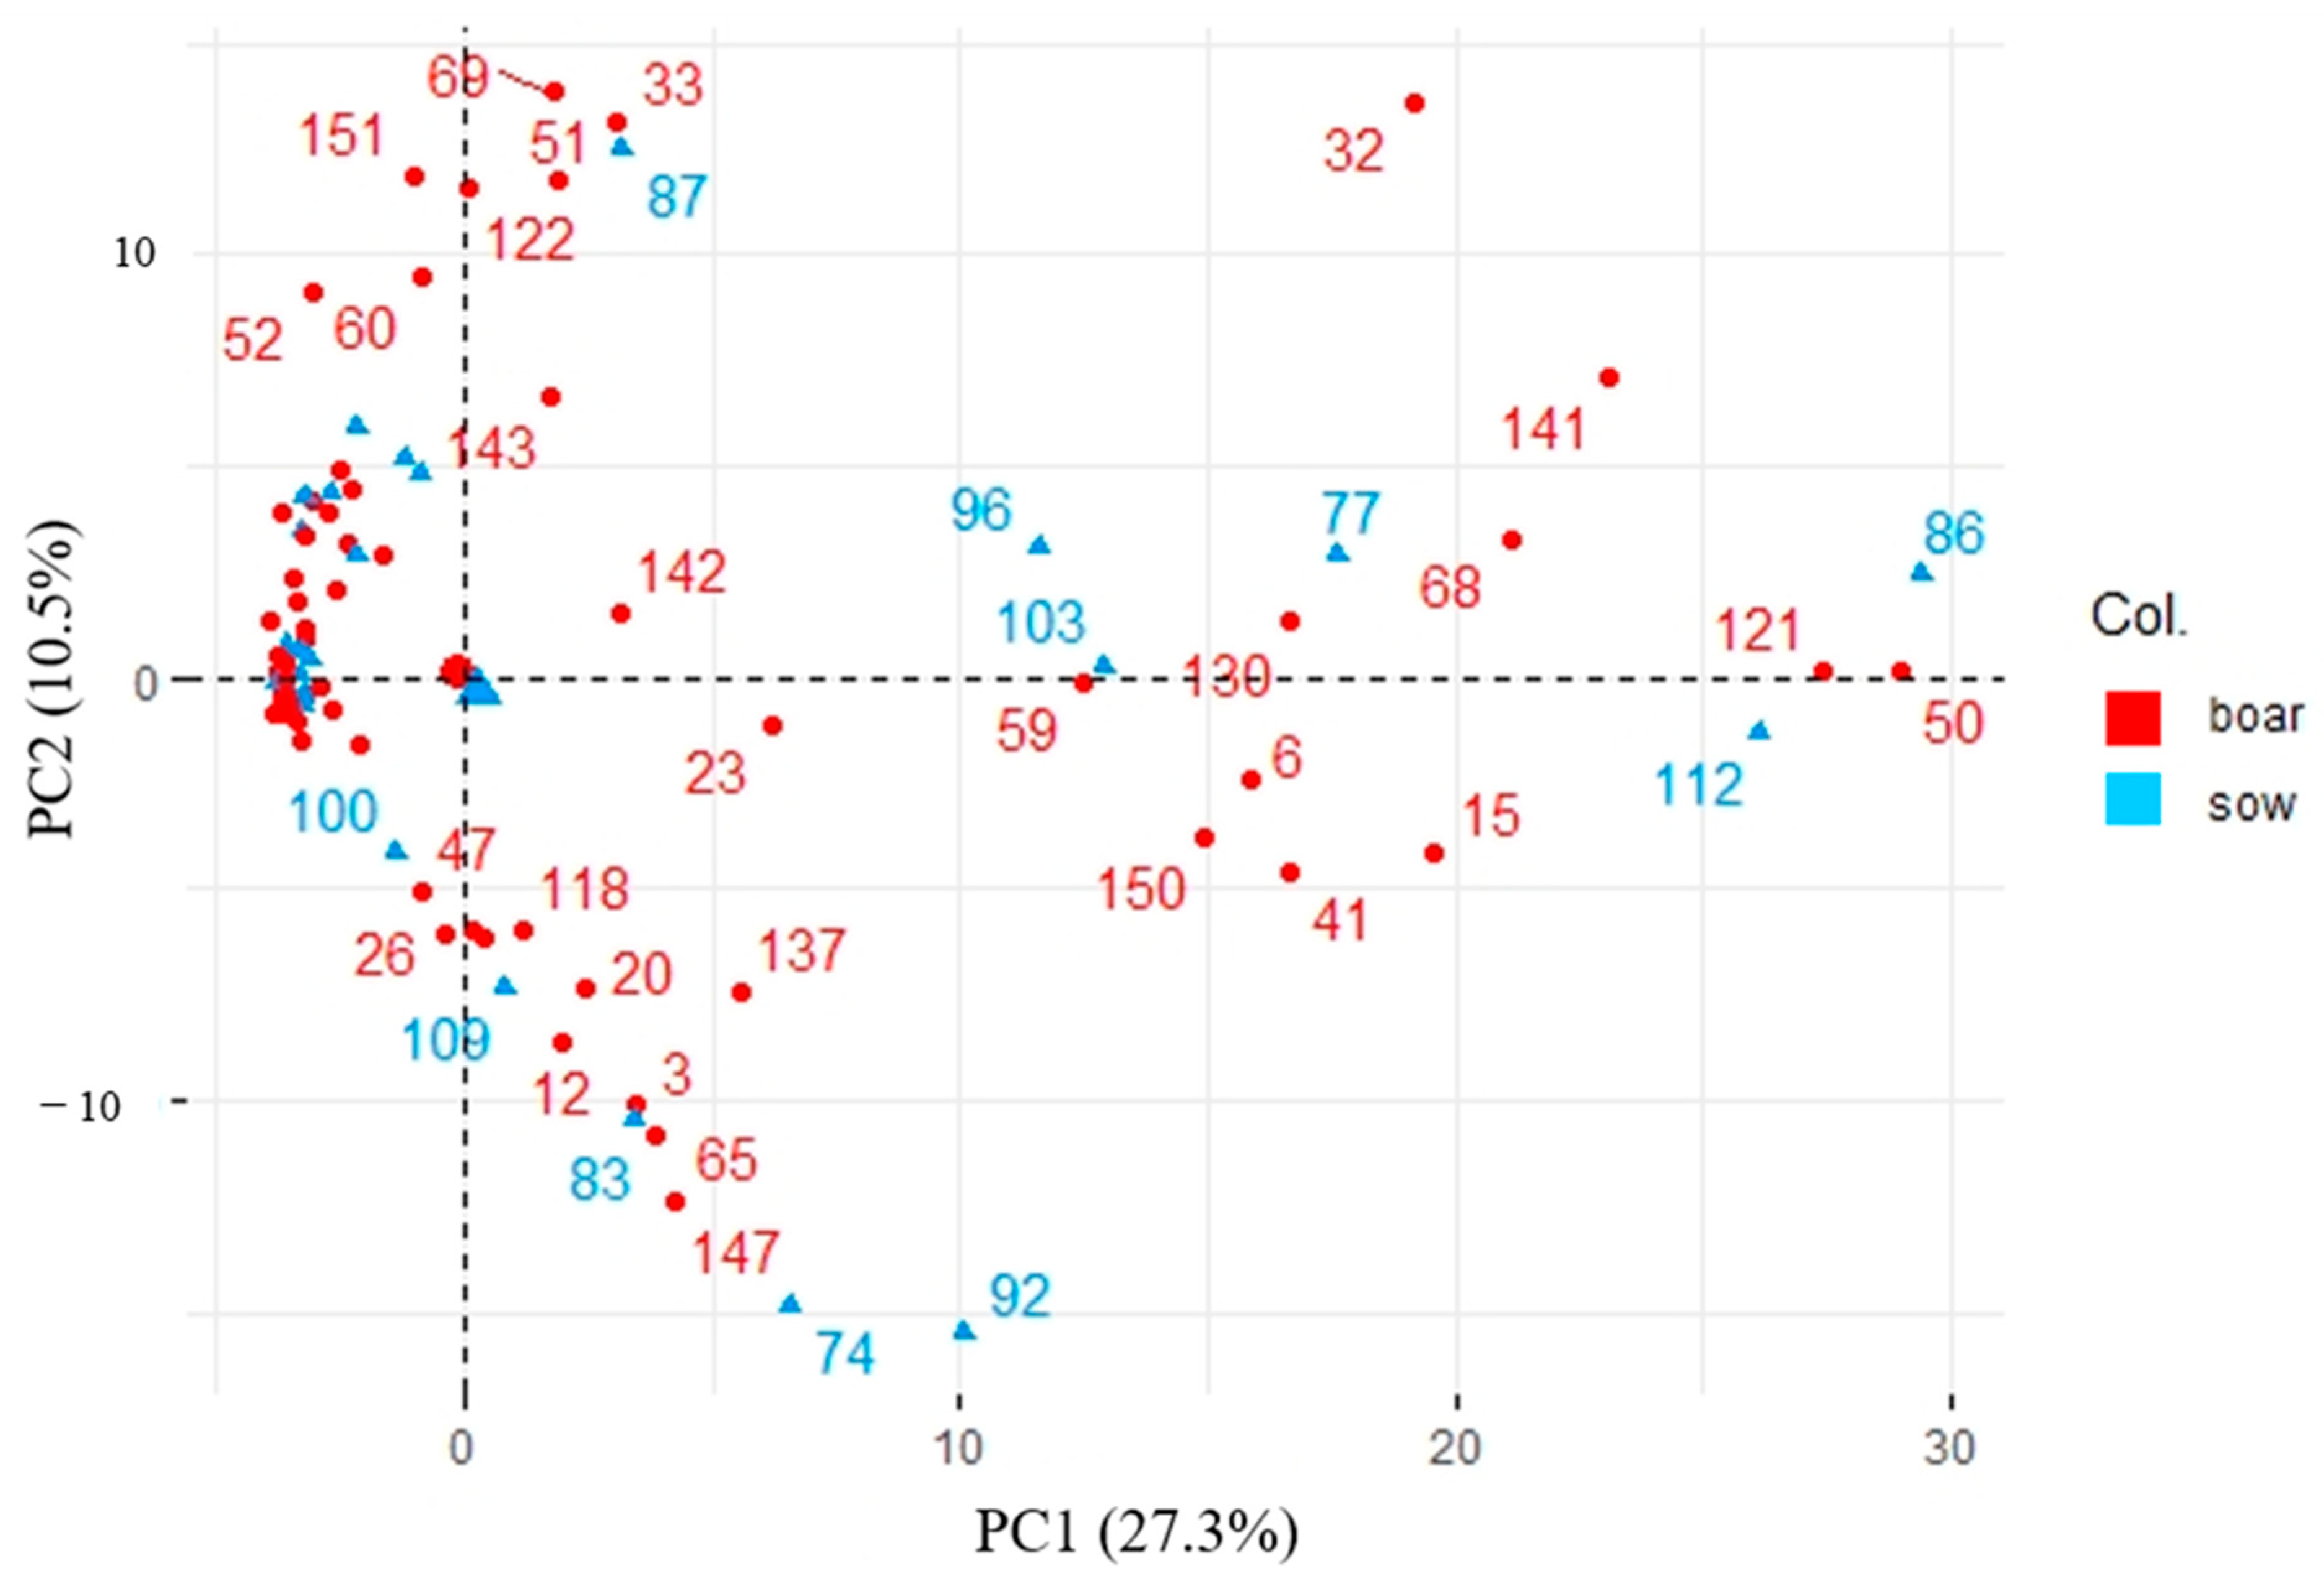
3.1. Characterizing the Fat Samples—Fatty Acid Composition and Boar Taint Compounds’ Content Analyses
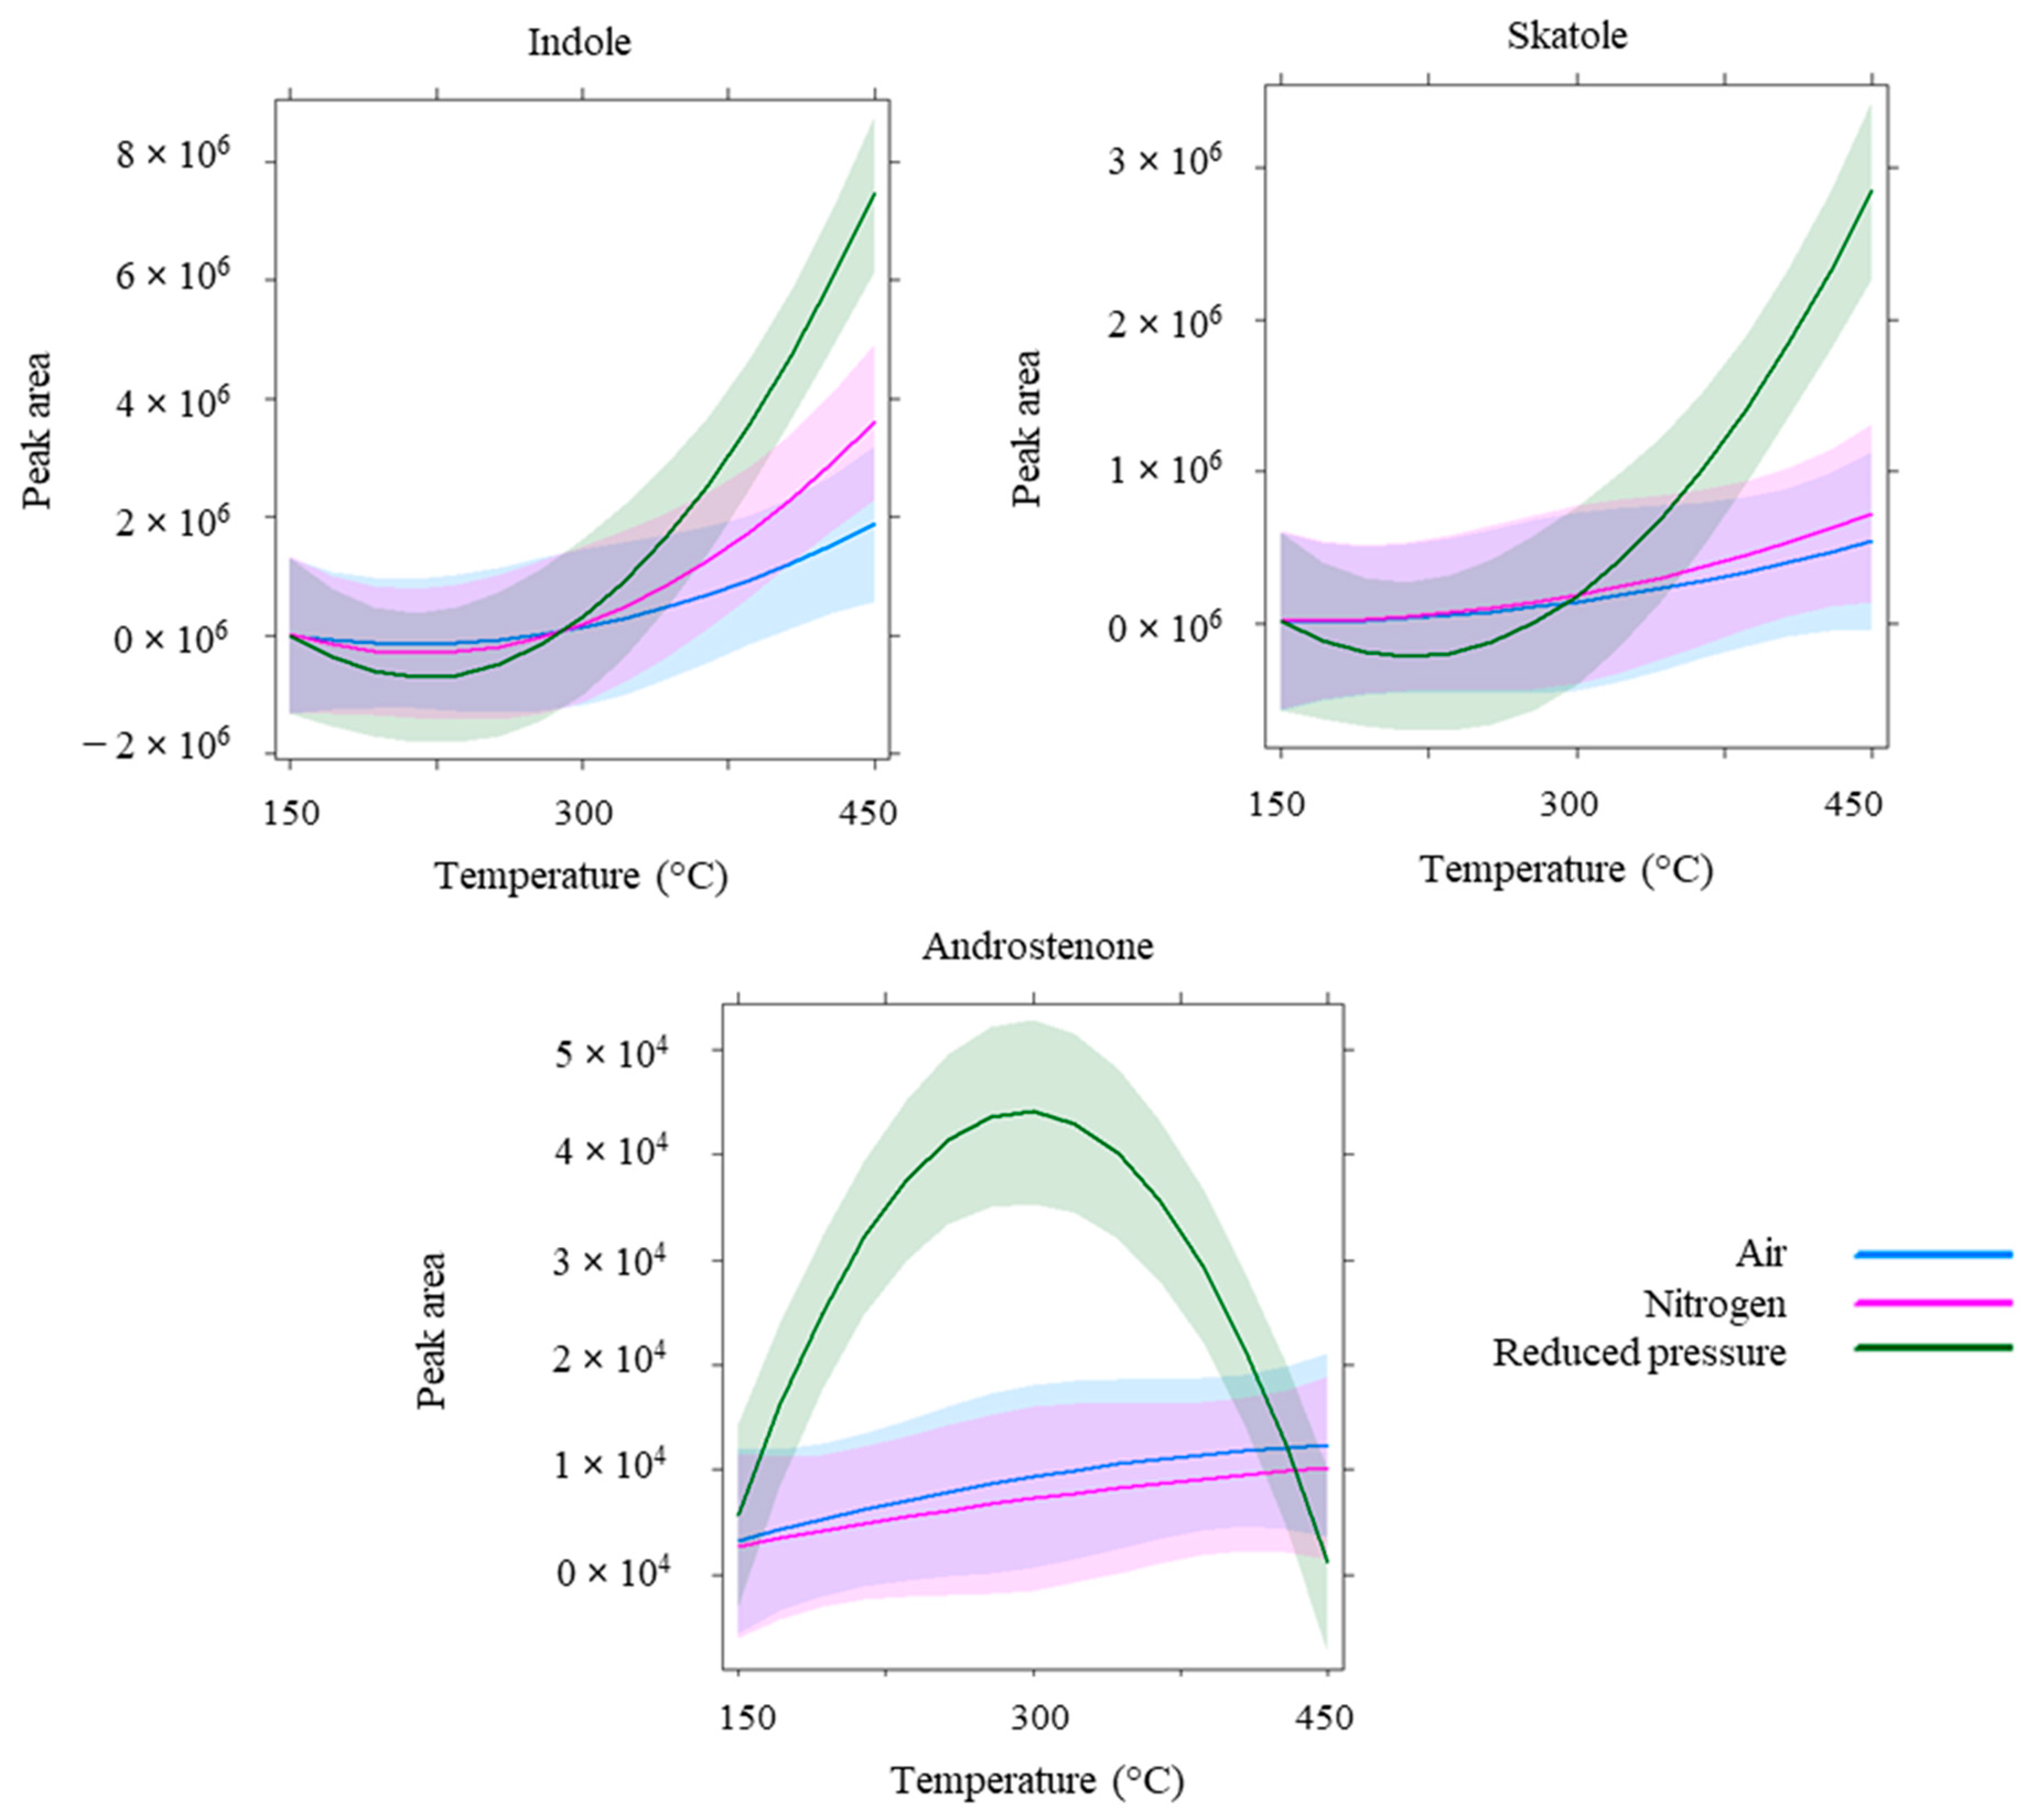
3.2. Impact of Sampling Parameters Variations on Boar Taint Compounds Headspace Sampling
4. Discussion
5. Conclusions
Author Contributions
Funding
Institutional Review Board Statement
Informed Consent Statement
Data Availability Statement
Acknowledgments
Conflicts of Interest
Appendix A

| Fatty Acid | Boar | Sow |
|---|---|---|
| C6:0 | 0.01 ± 0.01 | 0.01 ± 0.01 |
| C10:0 | 0.01 ± 0.01 | 0.00 ± 0.00 |
| C12:0 | 0.04 ± 0.02 | 0.03 ± 0.02 |
| C14:0 | 1.27 ± 0.04 | 1.14 ± 0.02 |
| C15:0 | 0.02 ± 0.01 | 0.04 ± 0.04 |
| C16:0 | 22.12 ± 0.21 | 22.08 ± 0.20 |
| C17:0 | 0.38 ± 0.02 | 0.23 ± 0.01 |
| C18:0 | 13.21 ± 0.35 | 13.25 ± 0.12 |
| C20:0 | 0.66 ± 0.02 | 0.21 ± 0.11 |
| C21:0 | 0.03 ± 0.02 | 0.07 ± 0.01 |
| C22:0 | 0.00 ± 0.00 | 0.02 ± 0.01 |
| C23:0 | 0.00 ± 0.01 | 0.01 ± 0.01 |
| ΣSFA | 37.75 | 37.09 |
| C16:1 | 2.05 ± 0.07 | 2.07 ± 0.03 |
| C17:1 | 0.22 ± 0.03 | 0.17 ± 0.00 |
| C18:1n-9 cis | 34.06 ± 0.47 | 35.08 ± 0.08 |
| C18:1n-9 trans | 2.13 ± 0.16 | 2.11 ± 0.08 |
| C20:1n-9 | 0.10 ± 0.06 | 0.20 ± 0.1 |
| C24:1n-9 | 0.03 ± 0.03 | 0.15 ± 0.02 |
| ΣMUFA | 38.59 | 39.78 |
| C18:2 | 19.10 ± 0.42 | 16.90 ± 0.12 |
| C18-3n-3 | 3.26 ± 0.35 | 4.89 ± 0.08 |
| C20:2 | 0.68 ± 0.02 | 0.62 ± 0.00 |
| C20:3n-6 | 0.45 ± 0.01 | 0.57 ± 0.00 |
| C20:4n-6 | 0.17 ± 0.04 | 0.15 ± 0.00 |
| ΣPUFA | 23.66 | 23.13 |
| Total | 100.00 | 100.00 |
Appendix B
| Fat Content (ng g−1 of Fat) | ||
|---|---|---|
| Sample Number | Skatole | Androstenone |
| 1 | 23.5 ± 4.9 | 3751.9 ± 316.1 |
| 2 | 39.6 ± 3.1 | 3506.2 ± 412.4 |
| 3 | 422.7 ± 186.2 | 743.1 ± 309.9 |
| 4 | 257.1 ± 20.6 | 3577.0 ± 116.1 |
| 5 | 214.2 ± 36.6 | 398.8 ± 8.0 |
| 6 | 99.6 ± 11.0 | 2169.9 ± 310.5 |
| 7 | 345.1 ± 78.1 | 353.9 ± 190.8 |
| 8 | 213.0 ± 27.9 | 3801.8 ± 234.5 |
| 9 | 27.4 ± 2.5 | 4689.9 ± 86.9 |
| 10 | 42.1 ± 15.6 | 2005.0 ± 417.4 |
| 11 | 19.6 ± 1.0 | 3150.1 ± 947.5 |
Appendix C
| MF | CAS | Calc. | Lit. | A150 | N150 | RP150 | A300 | N300 | RP300 | A450 | N450 | RP450 | |||||||||||||||||||
|---|---|---|---|---|---|---|---|---|---|---|---|---|---|---|---|---|---|---|---|---|---|---|---|---|---|---|---|---|---|---|---|
| RI | RI | ||||||||||||||||||||||||||||||
| Alcohols | |||||||||||||||||||||||||||||||
| Pentan-1-ol | 93 | 71-41-0 | 768 | 768 | 0.08 ± 0.23 | n.d. | n.d. | 0.48 ± 0.22 | n.d. | n.d. | 0.05 ± 0.15 | n.d. | n.d. | ||||||||||||||||||
| Hexan-1-ol | 91 | 111-27-3 | 865 | 865 | n.d. | n.d. | n.d. | 0.08 ± 0.11 | n.d. | n.d. | 0.04 ± 0.07 | 0.02 ± 0.09 | n.d. | ||||||||||||||||||
| Heptan-1-ol | 93 | 111-70-6 | 970 | 970 | 0.15 ± 0.33 | n.d. | n.d. | 0.69 ± 0.39 | n.d. | n.d. | 0.03 ± 0.12 | n.d. | n.d. | ||||||||||||||||||
| Oct-1-en-3-ol | 93 | 3391-86-4 | 980 | 980 | 0.27 ± 0.59 | n.d. | n.d. | 1.12 ± 0.49 | n.d. | n.d. | 0.27 ± 0.30 | 0.03 ± 0.10 | n.d. | ||||||||||||||||||
| Phenol | 90 | 108-95-2 | 988 | 989 | n.d. | n.d. | n.d. | n.d. | n.d. | n.d. | 0.05 ± 0.15 | 0.61 ± 0.84 | 0.86 ± 1.21 | ||||||||||||||||||
| 2,4-Dimethylcyclohexanol | 86 | 69542-91-2 | 1034 | 1032 | 0.01 ± 0.04 | n.d. | n.d. | 0.14 ± 0.09 | n.d. | n.d. | n.d. | n.d. | n.d. | ||||||||||||||||||
| Octan-1-ol | 92 | 111-87-5 | 1073 | 1073 | 0.20 ± 0.56 | n.d. | n.d. | 1.04 ± 0.55 | n.d. | n.d. | 0.22 ± 0.34 | n.d. | n.d. | ||||||||||||||||||
| 4-Methylphenol | 87 | 106-44-5 | 1082 | 1082 | n.d. | n.d. | n.d. | n.d. | n.d. | 0.03 ± 0.12 | 0.03 ± 0.15 | 0.40 ± 0.85 | 1.37 ± 1.95 | ||||||||||||||||||
| Nonan-1-ol | 89 | 143-08-8 | 1173 | 1173 | n.d. | n.d. | n.d. | 0.06 ± 0.10 | n.d. | n.d. | n.d. | n.d. | n.d. | ||||||||||||||||||
| (Z)-Tetradec-9-en-1-ol | 89 | 35153-15-2 | 1670 | 1667 | n.d. | n.d. | n.d. | 0.01 ± 0.03 | n.d. | n.d. | 0.03 ± 0.06 | 0.02 ± 0.07 | 0.02 ± 0.10 | ||||||||||||||||||
| Total alcohols | 0.71 | n.d. | n.d. | 3.62 | n.d. | 0.03 | 0.72 | 1.08 | 2.25 | ||||||||||||||||||||||
| Aldehydes | |||||||||||||||||||||||||||||||
| Unknown aldehyde | 682 | 0.01 ± 0.04 | n.d. | n.d. | 0.10 ± 0.09 | n.d. | n.d. | n.d. | 0.02 ± 0.07 | n.d. | |||||||||||||||||||||
| 2-Methylbutanal | 85 | 96-17-3 | 706 | 689 | n.d. | n.d. | n.d. | 0.00 ± 0.01 | 0.13 ± 0.30 | 0.00 ± 0.01 | 0.01 ± 0.03 | 0.18 ± 0.13 | 1.39 ± 5.85 | ||||||||||||||||||
| Pentanal | 91 | 110-62-3 | 712 | 711 | 0.69 ± 1.50 | n.d. | n.d. | 1.47 ± 0.73 | 0.15 ± 0.31 | n.d. | 0.67 ± 0.42 | 0.10 ± 0.13 | 0.97 ± 4.12 | ||||||||||||||||||
| (E)-Pent-2-enal | 92 | 1576-87-0 | 758 | 758 | 0.01 ± 0.04 | n.d. | n.d. | 0.03 ± 0.06 | n.d. | n.d. | n.d. | n.d. | n.d. | ||||||||||||||||||
| Hexanal | 91 | 66-25-1 | 797 | 797 | 12.12 ± 21.16 | 11.85 ± 29.70 | 5.56 ± 10.09 | 2.38 ± 1.27 | 3.58 ± 7.02 | 0.14 ± 0.56 | 1.92 ± 0.68 | 0.08 ± 0.32 | n.d. | ||||||||||||||||||
| (E)-Hex-2-enal | 95 | 6728-26-3 | 847 | 847 | 0.01 ± 0.04 | n.d. | n.d. | 0.13 ± 0.07 | n.d. | n.d. | 0.26 ± 0.19 | 0.01 ± 0.05 | n.d. | ||||||||||||||||||
| Heptanal | 95 | 111-71-7 | 900 | 900 | 0.84 ± 1.66 | n.d. | 0.28 ± 1.03 | 2.88 ± 0.71 | 0.22 ± 0.45 | n.d. | 2.78 ± 1.01 | 0.22 ± 0.81 | n.d. | ||||||||||||||||||
| (E)-Hept-2-enal | 92 | 18829-55-5 | 952 | 952 | 1.88 ± 3.55 | n.d. | n.d. | 7.26 ± 2.04 | 0.01 ± 0.06 | n.d. | 3.41 ± 1.41 | 0.22 ± 0.91 | n.d. | ||||||||||||||||||
| Benzaldehyde | 93 | 100-52-7 | 959 | 959 | 0.00 ± 0.01 | n.d. | n.d. | 0.14 ± 0.06 | 0.18 ± 0.38 | 0.00 ± 0.01 | 0.70 ± 0.65 | 0.44 ± 0.31 | 0.01 ± 0.04 | ||||||||||||||||||
| (2E,4E)-Hepta-2,4-dienal | 92 | 05-03-13 | 1003 | 1003 | 1.06 ± 2.63 | n.d. | n.d. | 5.21 ± 2.89 | 0.04 ± 0.18 | n.d. | 1.45 ± 1.46 | 0.10 ± 0.30 | n.d. | ||||||||||||||||||
| Octanal | 95 | 124-13-0 | 1010 | 1010 | 1.55 ± 2.94 | n.d. | 0.29 ± 1.05 | 4.29 ± 0.84 | 1.07 ± 1.57 | n.d. | 3.56 ± 1.05 | 0.42 ± 1.22 | n.d. | ||||||||||||||||||
| 5-Ethylcyclopentene-1-carbaldehyde | 84 | 36431-60-4 | 1031 | 1035 | 0.03 ± 0.10 | n.d. | n.d. | 0.03 ± 0.03 | n.d. | n.d. | 0.00 ± 0.01 | n.d. | n.d. | ||||||||||||||||||
| (E)-Oct-2-enal | 95 | 2548-87-0 | 1059 | 1059 | 0.91 ± 1.64 | n.d. | 0.17 ± 0.60 | 3.06 ± 0.49 | 0.13 ± 0.32 | n.d. | 2.53 ± 0.94 | 0.26 ± 0.78 | n.d. | ||||||||||||||||||
| 2-Phenylacetaldehyde | 88 | 122-78-1 | 1063 | 1061 | n.d. | n.d. | n.d. | 0.03 ± 0.04 | 0.38 ± 0.42 | 0.01 ± 0.03 | 0.01 ± 0.02 | 0.12 ± 0.29 | n.d. | ||||||||||||||||||
| (E)-Non-4-enal | 84 | 2277-16-9 | 1094 | 1096 | n.d. | n.d. | n.d. | 0.07 ± 0.07 | n.d. | n.d. | n.d. | n.d. | n.d. | ||||||||||||||||||
| Nonanal | 96 | 124-19-6 | 1111 | 1111 | 23.33 ± 21.82 | 27.08 ± 34.28 | 13.65 ± 27.22 | 16.17 ± 3.75 | 11.84 ± 10.97 | 0.21 ± 0.48 | 7.88 ± 3.58 | 1.41 ± 2.54 | n.d. | ||||||||||||||||||
| (Z)-Non-2-enal | 88 | 60784-31-8 | 1148 | 1148 | 0.04 ± 0.15 | n.d. | n.d. | 0.26 ± 0.13 | n.d. | n.d. | 0.20 ± 0.27 | n.d. | n.d. | ||||||||||||||||||
| (E)-Non-2-enal | 92 | 18829-56-6 | 1161 | 1161 | 0.42 ± 0.91 | n.d. | n.d. | 2.14 ± 0.66 | 0.36 ± 0.68 | n.d. | 1.82 ± 0.87 | 0.23 ± 0.65 | n.d. | ||||||||||||||||||
| (Z)-Dec-7-enal | 87 | 21661-97-2 | 1189 | 1179 | n.d. | n.d. | n.d. | 0.31 ± 0.21 | n.d. | n.d. | 0.03 ± 0.14 | n.d. | n.d. | ||||||||||||||||||
| Decanal | 97 | 112-31-2 | 1211 | 1211 | 1.73 ± 4.28 | 0.25 ± 0.90 | n.d. | 4.25 ± 1.03 | 1.79 ± 1.61 | n.d. | 5.91 ± 2.57 | 2.16 ± 0.79 | 0.12 ± 0.00 | ||||||||||||||||||
| (2E,4E)-Nona-2,4-dienal | 86 | 5910-87-2 | 1213 | 1213 | 0.02 ± 0.08 | n.d. | n.d. | 0.13 ± 0.09 | n.d. | n.d. | 0.03 ± 0.08 | n.d. | n.d. | ||||||||||||||||||
| (Z)-Dec-2-enal | 88 | 2497-25-8 | 1250 | 1250 | 0.09 ± 0.37 | n.d. | n.d. | 1.15 ± 0.37 | n.d. | n.d. | 0.80 ± 0.47 | 0.03 ± 0.14 | n.d. | ||||||||||||||||||
| (E)-Dec-2-enal | 92 | 3913-81-3 | 1271 | 1273 | 3.71 ± 5.76 | 1.82 ± 4.59 | 3.92 ± 9.46 | 10.17 ± 1.28 | 11.13 ± 13.13 | 0.42 ± 1.05 | 5.39 ± 2.33 | 0.89 ± 2.03 | 0.07 ± 0.29 | ||||||||||||||||||
| (2E,4E)-Deca-2,4-dienal | 91 | 25152-84-5 | 1290 | 1293 | 3.22 ± 6.92 | n.d. | 0.53 ± 1.89 | 10.19 ± 3.77 | 9.28 ± 16.27 | 0.81 ± 2.27 | 3.81 ± 1.93 | 3.26 ± 3.71 | 0.39 ± 0.92 | ||||||||||||||||||
| Undecanal | 98 | 112-44-7 | 1309 | 1309 | 0.25 ± 0.57 | 0.18 ± 0.63 | n.d. | 1.87 ± 0.86 | 0.47 ± 1.11 | n.d. | 1.51 ± 1.04 | 0.09 ± 0.36 | n.d. | ||||||||||||||||||
| (E)-Undec-2-enal | 94 | 2463-77-6 | 1388 | 1386 | 2.62 ± 4.80 | 1.82 ± 4.53 | 7.57 ± 14.72 | 7.35 ± 1.59 | 5.01 ± 6.00 | 1.70 ± 3.37 | 4.17 ± 1.55 | 1.16 ± 1.08 | 0.17 ± 0.40 | ||||||||||||||||||
| Dodecanal | 97 | 112-54-9 | 1410 | 1410 | 0.18 ± 0.41 | n.d. | n.d. | 1.10 ± 0.50 | 0.53 ± 1.23 | n.d. | 0.98 ± 0.50 | 0.02 ± 0.08 | n.d. | ||||||||||||||||||
| Tridecanal | 97 | 10486-19-8 | 1511 | 1511 | 0.02 ± 0.08 | n.d. | n.d. | 0.36 ± 0.23 | n.d. | n.d. | 0.26 ± 0.22 | n.d. | n.d. | ||||||||||||||||||
| Tetradecanal | 93 | 124-25-4 | 1613 | 1613 | 0.01 ± 0.02 | n.d. | n.d. | 0.10 ± 0.10 | n.d. | 0.03 ± 0.13 | 0.04 ± 0.08 | n.d. | n.d. | ||||||||||||||||||
| Pentadecanal | 89 | 09-11-65 | 1715 | 1715 | n.d. | 0.30 ± 1.07 | n.d. | 0.06 ± 0.09 | n.d. | 0.09 ± 0.37 | 0.03 ± 0.08 | n.d. | n.d. | ||||||||||||||||||
| Total aldehydes | 54.75 | 43.30 | 31.97 | 82.69 | 46.30 | 3.41 | 50.16 | 11.42 | 3.12 | ||||||||||||||||||||||
| Alkanes | |||||||||||||||||||||||||||||||
| Unknown alkane A | 722 | 0.04 ± 0.18 | n.d. | 0.04 ± 0.14 | 0.03 ± 0.14 | 0.24 ± 0.60 | n.d. | 0.25 ± 0.45 | 0.15 ± 0.22 | 0.01 ± 0.03 | |||||||||||||||||||||
| 1-Ethyl-2-methylcyclopentane | 91 | 930-89-2 | 787 | 783 | 0.02 ± 0.08 | n.d. | n.d. | 0.01 ± 0.04 | n.d. | n.d. | 0.29 ± 0.71 | n.d. | n.d. | ||||||||||||||||||
| Octane | 90 | 111-65-9 | 795 | 800 | 1.10 ± 2.54 | 1.26 ± 4.56 | n.d. | 0.10 ± 0.43 | 5.50 ± 22.89 | n.d. | 0.16 ± 0.19 | 0.54 ± 0.45 | 3.21 ± 13.60 | ||||||||||||||||||
| Nonane | 94 | 111-84-2 | 897 | 900 | n.d. | n.d. | n.d. | 0.31 ± 0.24 | n.d. | n.d. | 0.66 ± 0.52 | 0.36 ± 0.41 | 0.01 ± 0.03 | ||||||||||||||||||
| Propylcyclohexane | 85 | 1678-92-8 | 926 | 927 | n.d. | n.d. | n.d. | 0.03 ± 0.03 | n.d. | n.d. | n.d. | n.d. | n.d. | ||||||||||||||||||
| Butylcyclopentane | 91 | 2040-95-1 | 930 | 930 | 0.01 ± 0.04 | n.d. | n.d. | 0.13 ± 0.08 | n.d. | n.d. | 0.11 ± 0.11 | 0.01 ± 0.05 | n.d. | ||||||||||||||||||
| Decane | 92 | 124-18-5 | 999 | 1000 | 0.03 ± 0.10 | n.d. | n.d. | 0.69 ± 0.42 | 0.02 ± 0.08 | n.d. | 0.91 ± 0.82 | 0.53 ± 0.53 | 0.01 ± 0.06 | ||||||||||||||||||
| Methylcyclooctane | 91 | 1502-38-1 | 1094 | 1020 | n.d. | n.d. | n.d. | n.d. | n.d. | n.d. | 1.88 ± 2.06 | 0.15 ± 0.62 | n.d. | ||||||||||||||||||
| Undecane | 95 | 1120-21-4 | 1110 | 1100 | 0.05 ± 0.15 | n.d. | n.d. | 1.16 ± 0.66 | 0.10 ± 0.32 | n.d. | 2.20 ± 0.54 | 1.07 ± 0.83 | 0.04 ± 0.14 | ||||||||||||||||||
| Dodecane | 85 | 112-40-3 | 1199 | 1200 | 0.02 ± 0.08 | 0.08 ± 0.28 | n.d. | 0.02 ± 0.06 | 0.12 ± 0.41 | n.d. | n.d. | n.d. | 0.10 ± 0.23 | ||||||||||||||||||
| Tridecane | 95 | 629-50-5 | 1299 | 1300 | 0.07 ± 0.19 | 0.30 ± 0.75 | 0.27 ± 0.96 | 1.10 ± 0.62 | 1.28 ± 1.67 | n.d. | 2.38 ± 0.67 | 2.25 ± 1.41 | 0.41 ± 0.61 | ||||||||||||||||||
| Tetradecane | 95 | 629-59-4 | 1400 | 1400 | 0.02 ± 0.07 | 0.35 ± 0.92 | n.d. | 0.71 ± 0.38 | 0.48 ± 0.88 | 0.04 ± 0.18 | 1.41 ± 0.73 | 1.63 ± 1.29 | 1.00 ± 0.82 | ||||||||||||||||||
| Nonylcyclopentane | 92 | 2882-98-6 | 1448 | 1451 | 0.01 ± 0.02 | n.d. | n.d. | 0.13 ± 0.08 | 0.03 ± 0.14 | n.d. | 0.33 ± 0.28 | 0.17 ± 0.22 | 0.01 ± 0.06 | ||||||||||||||||||
| Pentadecane | 96 | 629-62-9 | 1497 | 1500 | 0.68 ± 1.83 | 2.34 ± 3.83 | 4.84 ± 7.01 | 0.70 ± 0.35 | 2.02 ± 2.55 | 1.29 ± 1.98 | 2.24 ± 1.29 | 3.38 ± 2.16 | 4.09 ± 2.31 | ||||||||||||||||||
| Nonylcyclohexane | 88 | 05-02-83 | 1551 | 1551 | n.d. | n.d. | 0.02 ± 0.09 | 0.04 ± 0.03 | 0.02 ± 0.11 | 0.07 ± 0.22 | 0.18 ± 0.17 | 0.13 ± 0.17 | 0.15 ± 0.23 | ||||||||||||||||||
| Hexadecane | 90 | 544-76-3 | 1602 | 1600 | n.d. | n.d. | 0.17 ± 0.61 | 0.11 ± 0.08 | n.d. | 0.09 ± 0.32 | 0.02 ± 0.06 | 0.20 ± 0.32 | 0.64 ± 0.81 | ||||||||||||||||||
| Heptadecane | 91 | 629-78-7 | 1699 | 1700 | 0.09 ± 0.33 | 0.51 ± 1.32 | 1.04 ± 1.85 | 0.01 ± 0.02 | 0.15 ± 0.64 | 0.49 ± 1.38 | 0.37 ± 0.38 | 0.31 ± 0.59 | 2.35 ± 2.64 | ||||||||||||||||||
| Total alkanes | 2.14 | 4.84 | 6.38 | 5.28 | 9.96 | 1.98 | 13.39 | 10.88 | 12.03 | ||||||||||||||||||||||
| Alkenes | |||||||||||||||||||||||||||||||
| 3-Methylcyclopentene | 87 | 1120-62-3 | 695 | 671 | n.d. | n.d. | n.d. | n.d. | n.d. | n.d. | 0.07 ± 0.13 | 0.00 ± 0.01 | n.d. | ||||||||||||||||||
| Cyclohexa-1,4-diene | 87 | 628-41-1 | 712 | 707 | n.d. | n.d. | n.d. | 0.01 ± 0.01 | n.d. | n.d. | 0.03 ± 0.03 | 0.00 ± 0.01 | n.d. | ||||||||||||||||||
| Cyclohexene | 91 | 110-83-8 | 713 | 707 | n.d. | n.d. | n.d. | n.d. | n.d. | n.d. | 0.04 ± 0.06 | 0.00 ± 0.01 | n.d. | ||||||||||||||||||
| Hept-1-ene | 94 | 592-76-7 | 717 | 707 | n.d. | n.d. | n.d. | 0.03 ± 0.05 | n.d. | n.d. | 0.64 ± 0.50 | 0.09 ± 0.13 | n.d. | ||||||||||||||||||
| Hept-2-ene | 84 | 592-77-8 | 726 | 702 | n.d. | n.d. | n.d. | n.d. | n.d. | n.d. | 0.03 ± 0.05 | 0.00 ± 0.01 | n.d. | ||||||||||||||||||
| 3-Methylcyclohexene | 91 | 591-48-0 | 745 | 745 | n.d. | n.d. | n.d. | n.d. | 0.01 ± 0.06 | n.d. | 0.09 ± 0.06 | 0.04 ± 0.04 | n.d. | ||||||||||||||||||
| 3-Methylcyclohexene | 86 | 591-48-0 | 747 | 745 | n.d. | n.d. | n.d. | n.d. | n.d. | n.d. | 0.03 ± 0.04 | n.d. | n.d. | ||||||||||||||||||
| 1-Methylcyclohexa-1,4-diene | 88 | 4313-57-9 | 778 | 780 | n.d. | n.d. | n.d. | n.d. | n.d. | n.d. | 0.04 ± 0.05 | n.d. | n.d. | ||||||||||||||||||
| Oct-1-ene | 93 | 111-66-0 | 787 | 788 | 0.00 ± 0.02 | n.d. | n.d. | 0.06 ± 0.08 | n.d. | n.d. | 0.71 ± 0.70 | 0.17 ± 0.25 | n.d. | ||||||||||||||||||
| (Z)-Oct-2-ene | 87 | 08-04-42 | 803 | 803 | n.d. | n.d. | n.d. | 0.02 ± 0.04 | n.d. | n.d. | 0.23 ± 0.22 | 0.09 ± 0.19 | n.d. | ||||||||||||||||||
| (3E)-Octa-1,3-diene | 90 | 1002-33-1 | 819 | 825 | n.d. | n.d. | n.d. | n.d. | n.d. | n.d. | 0.31 ± 0.27 | 0.02 ± 0.05 | n.d. | ||||||||||||||||||
| 5-Ethylcyclohexa-1,3-diene | 84 | 40085-08-3 | 832 | 844 | n.d. | n.d. | n.d. | n.d. | n.d. | n.d. | 0.02 ± 0.03 | n.d. | n.d. | ||||||||||||||||||
| 1-Propylcyclopentene | 87 | 3074-61-1 | 840 | 840 | n.d. | n.d. | n.d. | n.d. | n.d. | n.d. | 0.03 ± 0.05 | n.d. | n.d. | ||||||||||||||||||
| (3E,5Z)-Octa-1,3,5-triene | 86 | 33580-05-1 | 875 | 880 | n.d. | n.d. | n.d. | 0.01 ± 0.01 | n.d. | n.d. | 0.09 ± 0.13 | 0.05 ± 0.14 | n.d. | ||||||||||||||||||
| Nona-1,8-diene | 86 | 4900-30-5 | 878 | 880 | n.d. | n.d. | n.d. | n.d. | n.d. | n.d. | 0.04 ± 0.10 | n.d. | n.d. | ||||||||||||||||||
| Non-1-ene | 88 | 124-11-8 | 888 | 888 | 0.06 ± 0.23 | n.d. | n.d. | n.d. | n.d. | n.d. | 1.83 ± 1.10 | 0.46 ± 0.65 | n.d. | ||||||||||||||||||
| (Z)-Non-2-ene | 85 | 6434-77-1 | 906 | 903 | n.d. | n.d. | n.d. | n.d. | n.d. | n.d. | 0.10 ± 0.20 | 0.01 ± 0.02 | n.d. | ||||||||||||||||||
| 3-Butylcyclopentene | 86 | 22531-00-6 | 919 | 916 | n.d. | n.d. | n.d. | 0.00 ± 0.01 | n.d. | n.d. | 0.14 ± 0.15 | 0.01 ± 0.04 | n.d. | ||||||||||||||||||
| (3E)-Nona-1,3-diene | 86 | 56700-77-7 | 923 | 924 | n.d. | n.d. | n.d. | n.d. | n.d. | n.d. | 0.46 ± 0.54 | 0.02 ± 0.09 | n.d. | ||||||||||||||||||
| 1-Butylcyclopentene | 92 | 2423-01-0 | 945 | 940 | n.d. | n.d. | n.d. | 0.01 ± 0.06 | n.d. | n.d. | 0.71 ± 0.60 | 0.05 ± 0.22 | n.d. | ||||||||||||||||||
| Dec-1-ene | 92 | 872-05-9 | 991 | 993 | 0.15 ± 0.61 | n.d. | n.d. | n.d. | n.d. | n.d. | 1.31 ± 1.19 | 0.66 ± 0.60 | n.d. | ||||||||||||||||||
| (Z)-Dec-5-ene | 90 | 7433-78-5 | 1004 | 993 | n.d. | n.d. | n.d. | n.d. | n.d. | n.d. | n.d. | 0.04 ± 0.08 | n.d. | ||||||||||||||||||
| Undec-1-ene | 95 | 821-95-4 | 1091 | 1092 | 0.17 ± 0.66 | n.d. | n.d. | 0.03 ± 0.11 | 0.03 ± 0.12 | n.d. | 0.84 ± 1.46 | 1.48 ± 1.07 | 0.06 ± 0.27 | ||||||||||||||||||
| (E)-Undec-2-ene | 92 | 693-61-8 | 1104 | 1104 | n.d. | n.d. | n.d. | 0.05 ± 0.07 | 0.02 ± 0.08 | n.d. | 0.86 ± 0.61 | 2.49 ± 1.99 | 0.01 ± 0.05 | ||||||||||||||||||
| 1-Hexylcyclopentene | 86 | 4291-99-0 | 1125 | 1129 | 0.02 ± 0.07 | n.d. | n.d. | 0.02 ± 0.09 | n.d. | n.d. | 1.35 ± 1.58 | 1.58 ± 1.73 | 0.06 ± 0.18 | ||||||||||||||||||
| (3Z,5E)-Undeca-1,3,5-triene | 86 | 19883-27-3 | 1166 | 1174 | 0.01 ± 0.03 | n.d. | n.d. | 0.04 ± 0.04 | 0.03 ± 0.13 | n.d. | 1.09 ± 0.56 | 1.36 ± 1.58 | 0.06 ± 0.13 | ||||||||||||||||||
| Dodec-1-ene | 92 | 25378-22-7 | 1193 | 1193 | 0.18 ± 0.64 | 0.24 ± 0.88 | n.d. | 0.05 ± 0.13 | 0.26 ± 0.70 | n.d. | 2.12 ± 1.89 | 1.58 ± 1.55 | 0.26 ± 0.58 | ||||||||||||||||||
| Tridec-1-ene | 94 | 2437-56-1 | 1292 | 1292 | 0.02 ± 0.08 | 0.23 ± 0.84 | n.d. | 0.03 ± 0.08 | 0.15 ± 0.40 | n.d. | 2.66 ± 1.34 | 1.48 ± 1.43 | 0.49 ± 0.85 | ||||||||||||||||||
| (E)-Tetradec-7-ene | 88 | 10374-74-0 | 1388 | 1390 | n.d. | n.d. | n.d. | 0.04 ± 0.05 | n.d. | n.d. | 0.18 ± 0.13 | 0.07 ± 0.15 | n.d. | ||||||||||||||||||
| Tetradec-1-ene | 96 | 1120-36-1 | 1392 | 1392 | 0.46 ± 1.71 | 0.57 ± 2.05 | 0.55 ± 1.98 | 0.16 ± 0.22 | 0.42 ± 0.93 | 0.03 ± 0.11 | 0.65 ± 1.11 | 2.22 ± 1.75 | 1.31 ± 1.41 | ||||||||||||||||||
| Pentadec-1-ene | 90 | 13360-61-7 | 1488 | 1488 | 0.02 ± 0.06 | n.d. | 0.20 ± 0.71 | 0.19 ± 0.18 | 0.28 ± 0.78 | 0.05 ± 0.15 | 0.90 ± 0.82 | 1.33 ± 1.78 | 1.79 ± 2.02 | ||||||||||||||||||
| (Z)-Hexadec-7-ene | 90 | 35507-09-6 | 1580 | 1568 | n.d. | n.d. | 0.05 ± 0.18 | 0.09 ± 0.08 | n.d. | n.d. | 0.09 ± 0.23 | 0.10 ± 0.27 | 0.09 ± 0.39 | ||||||||||||||||||
| Hexadec-1-ene | 94 | 629-73-2 | 1591 | 1591 | n.d. | n.d. | n.d. | 0.03 ± 0.08 | n.d. | 0.09 ± 0.22 | 0.40 ± 0.32 | 0.23 ± 0.36 | 0.84 ± 0.94 | ||||||||||||||||||
| (E)-Heptadec-3-ene | 91 | 68155-00-0 | 1677 | 1684 | n.d. | n.d. | 1.30 ± 2.29 | 0.14 ± 0.11 | 0.22 ± 0.64 | 0.69 ± 1.35 | 0.66 ± 0.64 | 0.84 ± 0.83 | 3.82 ± 1.78 | ||||||||||||||||||
| Total alkenes | 1.09 | 1.04 | 2.10 | 1.01 | 1.42 | 0.86 | 18.75 | 16.47 | 8.79 | ||||||||||||||||||||||
| Amides | |||||||||||||||||||||||||||||||
| Pyridine-2-carboxamide | 87 | 1452-77-3 | 1265 | 1268 | n.d. | n.d. | n.d. | n.d. | n.d. | 0.10 ± 0.25 | n.d. | n.d. | 0.80 ± 1.12 | ||||||||||||||||||
| Hexadecanamide | 87 | 629-54-9 | 2190 | 2186 | 0.66 ± 2.66 | 0.26 ± 0.93 | n.d. | 0.03 ± 0.13 | 0.02 ± 0.09 | 0.14 ± 0.39 | 0.06 ± 0.18 | 0.22 ± 0.33 | 1.59 ± 1.20 | ||||||||||||||||||
| (Z)-Octadec-9-enamide | 85 | 301-02-0 | 2369 | 2375 | n.d. | n.d. | n.d. | 0.03 ± 0.12 | n.d. | n.d. | 0.04 ± 0.19 | 0.15 ± 0.35 | 1.00 ± 1.38 | ||||||||||||||||||
| Octadecanamide | 85 | 124-26-5 | 2396 | 2398 | n.d. | n.d. | n.d. | n.d. | n.d. | n.d. | 0.02 ± 0.09 | 0.02 ± 0.08 | 0.41 ± 0.69 | ||||||||||||||||||
| Total amides | 0.66 | 0.26 | n.d. | 0.06 | 0.02 | 0.24 | 0.12 | 0.39 | 3.80 | ||||||||||||||||||||||
| Amines | |||||||||||||||||||||||||||||||
| 2-(Dimethylamino)ethanol | 89 | 108-01-0 | 739 | 711 | n.d. | n.d. | n.d. | 0.01 ± 0.02 | 0.07 ± 0.22 | 0.06 ± 0.20 | 0.02 ± 0.06 | 0.32 ± 0.44 | 0.75 ± 1.33 | ||||||||||||||||||
| Pyridin-2-amine | 90 | 504-29-0 | 1009 | 1002 | n.d. | n.d. | n.d. | n.d. | n.d. | n.d. | n.d. | 0.15 ± 0.62 | 1.17 ± 1.58 | ||||||||||||||||||
| 4-Methylaniline | 94 | 106-49-0 | 1027 | 1068 | n.d. | n.d. | n.d. | 0.01 ± 0.01 | 0.10 ± 0.27 | n.d. | 0.04 ± 0.08 | 0.18 ± 0.30 | 0.02 ± 0.04 | ||||||||||||||||||
| 2,4,6-Trimethylaniline | 85 | 88-05-1 | 1256 | 1261 | n.d. | n.d. | n.d. | n.d. | n.d. | n.d. | n.d. | 0.28 ± 0.43 | 0.00 ± 0.02 | ||||||||||||||||||
| Total amines | n.d. | n.d. | n.d. | 0.02 | 0.17 | 0.06 | 0.06 | 0.93 | 1.94 | ||||||||||||||||||||||
| Benzene derivatives | |||||||||||||||||||||||||||||||
| Toluene | 93 | 108-88-3 | 799 | 796 | n.d. | n.d. | n.d. | 0.02 ± 0.02 | 0.16 ± 0.24 | n.d. | 0.51 ± 0.44 | 2.29 ± 1.60 | 0.06 ± 0.10 | ||||||||||||||||||
| Ethylbenzene | 90 | 100-41-4 | 855 | 855 | n.d. | n.d. | n.d. | n.d. | n.d. | n.d. | 0.19 ± 0.12 | 0.67 ± 0.48 | n.d. | ||||||||||||||||||
| 1,3-Xylene | 84 | 108-38-3 | 864 | 864 | n.d. | n.d. | n.d. | n.d. | n.d. | n.d. | 0.01 ± 0.03 | 0.03 ± 0.05 | n.d. | ||||||||||||||||||
| Styrene | 93 | 100-42-5 | 887 | 887 | n.d. | n.d. | n.d. | n.d. | n.d. | n.d. | 0.12 ± 0.11 | 0.42 ± 0.30 | n.d. | ||||||||||||||||||
| Propylbenzene | 93 | 103-65-1 | 951 | 950 | n.d. | n.d. | n.d | 0.00 ± 0.01 | 0.01 ± 0.03 | n.d | 0.19 ± 0.09 | 0.30 ± 0.13 | 0.00 ± 0.01 | ||||||||||||||||||
| 2,3-Dihydro-1H-indene | 85 | 496-11-7 | 1025 | 1027 | n.d. | n.d. | n.d. | n.d. | n.d. | n.d. | 0.06 ± 0.08 | 0.26 ± 0.19 | 0.00 ± 0.01 | ||||||||||||||||||
| 1-Ethynyl-4-methylbenzene | 86 | 766-97-2 | 1043 | 1004 | n.d. | n.d. | n.d. | n.d. | n.d. | n.d. | 0.03 ± 0.04 | 0.04 ± 0.05 | 0.00 ± 0.02 | ||||||||||||||||||
| 1H-indene | 88 | 95-13-6 | 1043 | 1042 | n.d. | n.d. | n.d. | n.d. | n.d. | n.d. | 0.02 ± 0.07 | 0.03 ± 0.07 | 0.03 ± 0.06 | ||||||||||||||||||
| Butylbenzene | 89 | 104-51-8 | 1076 | 1078 | n.d. | n.d. | n.d. | 0.05 ± 0.06 | 0.13 ± 0.22 | 0.00 ± 0.01 | 0.45 ± 0.18 | 0.66 ± 0.29 | 0.02 ± 0.04 | ||||||||||||||||||
| Unknown benzene derivative | 1126 | n.d. | n.d. | n.d. | n.d. | n.d. | n.d. | 0.07 ± 0.10 | 0.12 ± 0.19 | n.d. | |||||||||||||||||||||
| 1,2-Dihydronaphthalene | 84 | 447-53-0 | 1151 | 1149 | n.d. | n.d. | n.d. | n.d. | n.d. | n.d. | 0.02 ± 0.07 | 0.04 ± 0.07 | n.d. | ||||||||||||||||||
| Pentylbenzene | 89 | 538-68-1 | 1158 | 1158 | n.d. | n.d. | n.d. | 0.06 ± 0.10 | 0.10 ± 0.36 | n.d. | 0.76 ± 0.39 | 0.82 ± 0.91 | 0.03 ± 0.08 | ||||||||||||||||||
| 1-Butyl-4-methylbenzene | 87 | 2719-52-0 | 1168 | 1127 | n.d. | n.d. | n.d. | n.d. | n.d. | n.d. | 0.07 ± 0.08 | 0.17 ± 0.24 | 0.01 ± 0.03 | ||||||||||||||||||
| Naphthalene | 86 | 91-20-3 | 1184 | 1183 | n.d. | n.d. | n.d. | n.d. | n.d. | n.d. | 0.08 ± 0.13 | 0.15 ± 0.21 | 0.02 ± 0.06 | ||||||||||||||||||
| Hexylbenzene | 84 | 1077-16-3 | 1261 | 1260 | n.d. | n.d. | n.d. | 0.01 ± 0.02 | n.d. | n.d. | 0.19 ± 0.22 | 0.34 ± 0.58 | 0.01 ± 0.04 | ||||||||||||||||||
| Heptylbenzene | 84 | 1078-71-3 | 1364 | 1362 | n.d. | n.d. | n.d. | 0.00 ± 0.01 | 0.04 ± 0.16 | n.d. | 0.10 ± 0.16 | 0.35 ± 0.36 | 0.05 ± 0.12 | ||||||||||||||||||
| 2,6-Ditert-butyl-4-methylphenol | 87 | 128-37-0 | 1527 | 1524 | n.d. | 0.06 ± 0.23 | 15.50 ± 37.50 | 0.25 ± 0.75 | 4.18 ± 7.04 | 0.39 ± 0.79 | 0.01 ± 0.03 | 0.12 ± 0.28 | 0.10 ± 0.35 | ||||||||||||||||||
| Dodecan-6-ylbenzene | 82 | 2719-62-2 | 1733 | 1727 | n.d. | n.d. | 8.05 ± 27.64 | n.d. | n.d. | 0.01 ± 0.02 | n.d. | n.d. | n.d. | ||||||||||||||||||
| Total benzene derivatives | n.d. | 0.06 | 23.55 | 0.39 | 4.62 | 0.40 | 2.89 | 6.86 | 0.33 | ||||||||||||||||||||||
| Fatty acids | |||||||||||||||||||||||||||||||
| Nonanoic acid | 86 | 112-05-0 | 1280 | 1280 | n.d. | n.d. | n.d. | n.d. | n.d. | 0.08 ± 0.19 | n.d. | n.d. | 0.07 ± 0.28 | ||||||||||||||||||
| Methyl hexadecanoate | 85 | 112-39-0 | 1926 | 1925 | n.d. | n.d. | n.d. | n.d. | n.d. | 0.18 ± 0.30 | n.d. | n.d. | 0.26 ± 0.27 | ||||||||||||||||||
| (Z)-Hexadec-11-enoic acid | 84 | 2416-20-8 | 1947 | 1953 | n.d. | n.d. | n.d. | n.d. | n.d. | 1.01 ± 1.64 | n.d. | 0.07 ± 0.29 | 0.29 ± 1.24 | ||||||||||||||||||
| Hexadecanoic acid | 94 | 57-10-3 | 1965 | 1965 | 8.75 ± 19.22 | 11.06 ± 15.47 | 5.75 ± 9.79 | 1.23 ± 2.86 | 5.39 ± 8.13 | 33.46 ± 22.38 | 3.03 ± 3.55 | 8.08 ± 5.11 | 35.52 ± 20.11 | ||||||||||||||||||
| 2-Dodecanone | 88 | 544-63-8 | 1397 | 1401 | n.d. | n.d. | n.d. | n.d. | n.d. | 1.26 ± 1.79 | 0.07 ± 0.16 | 0.58 ± 2.41 | 1.46 ± 2.37 | ||||||||||||||||||
| Methyl (9Z,12Z)-octadeca-9,12-dienoate | 89 | 112-63-0 | 2095 | 2095 | n.d. | n.d. | 0.06 ± 0.20 | 0.01 ± 0.02 | 0.14 ± 0.43 | 1.76 ± 3.10 | 0.02 ± 0.08 | 0.07 ± 0.21 | 0.79 ± 1.27 | ||||||||||||||||||
| Methyl (E)-octadec-9-enoate | 89 | 1937-62-8 | 2101 | 2100 | n.d. | n.d. | 0.10 ± 0.36 | 0.01 ± 0.04 | 0.28 ± 0.74 | 3.99 ± 7.56 | 0.02 ± 0.08 | 0.09 ± 0.37 | 1.37 ± 1.87 | ||||||||||||||||||
| Methyl octadecanoate | 84 | 112-61-8 | 2128 | 2123 | n.d. | n.d. | n.d. | n.d. | n.d. | 0.04 ± 0.13 | n.d. | n.d. | 0.08 ± 0.15 | ||||||||||||||||||
| (Z)-Octadec-11-enoic acid | 91 | 506-17-2 | 2134 | 2141 | 9.19 ± 25.54 | 14.34 ± 27.48 | 8.60 ± 20.99 | 2.74 ± 5.28 | 17.00 ± 25.22 | 34.41 ± 30.77 | 3.46 ± 6.63 | 17.74 ± 10.32 | 6.44 ± 14.98 | ||||||||||||||||||
| Octadecanoic acid | 90 | 57-11-4 | 2161 | 2161 | n.d. | 1.70 ± 6.12 | 1.39 ± 3.40 | 0.28 ± 0.66 | 1.28 ± 2.79 | 7.04 ± 6.86 | 0.98 ± 1.39 | 2.36 ± 2.01 | 8.23 ± 5.29 | ||||||||||||||||||
| Decanoic acid | 86 | 334-48-5 | 3177 | 1372 | n.d. | n.d. | n.d. | n.d. | n.d. | 0.18 ± 0.61 | n.d. | n.d. | 0.12 ± 0.43 | ||||||||||||||||||
| Total fatty acids | 17.94 | 27.10 | 15.90 | 4.27 | 24.09 | 83.41 | 7.58 | 28.99 | 54.63 | ||||||||||||||||||||||
| Furans | |||||||||||||||||||||||||||||||
| 2-Methyloxolane | 92 | 96-47-9 | 708 | 685 | n.d. | n.d. | n.d. | 0.00 ± 0.01 | n.d. | n.d. | 0.43 ± 0.39 | 0.01 ± 0.06 | n.d. | ||||||||||||||||||
| 2,5-Dimethyloxolane | 94 | 1003-38-9 | 729 | 727 | n.d. | n.d. | n.d. | n.d. | n.d. | n.d. | 0.13 ± 0.13 | 0.00 ± 0.02 | n.d. | ||||||||||||||||||
| 2,5-Diethyloxolane | 87 | 41239-48-9 | 894 | 896 | n.d. | n.d. | n.d. | n.d. | n.d. | n.d. | 0.21 ± 0.25 | 0.01 ± 0.03 | n.d. | ||||||||||||||||||
| 2-Pentylfuran | 88 | 3777-69-3 | 991 | 990 | 0.58 ± 1.31 | n.d. | n.d. | 0.48 ± 0.29 | 0.45 ± 0.81 | n.d. | 0.02 ± 0.07 | n.d. | n.d. | ||||||||||||||||||
| 5-Dodecyloxolan-2-one | 86 | 730-46-1 | 2106 | 2106 | n.d. | 0.23 ± 0.82 | 1.48 ± 3.15 | 0.02 ± 0.05 | n.d. | 0.28 ± 0.56 | 0.08 ± 0.10 | 0.01 ± 0.02 | 0.10 ± 0.31 | ||||||||||||||||||
| Total furans | 0.58 | 0.23 | 1.48 | 0.50 | 0.45 | 0.28 | 0.87 | 0.03 | 0.10 | ||||||||||||||||||||||
| Heterocyclic compounds | |||||||||||||||||||||||||||||||
| Pyridine | 93 | 110-86-1 | 750 | 751 | n.d. | n.d. | n.d. | 0.04 ± 0.03 | 2.19 ± 5.87 | n.d. | 0.20 ± 0.13 | 0.74 ± 0.39 | 0.01 ± 0.03 | ||||||||||||||||||
| Unknown heterocyclic compound B | 86 | 110-87-2 | 759 | 708 | n.d. | n.d. | n.d. | 0.01 ± 0.03 | n.d. | n.d. | 0.07 ± 0.08 | n.d. | n.d. | ||||||||||||||||||
| 1H-Pyrrole | 96 | 109-97-7 | 760 | 758 | n.d. | n.d. | n.d. | 0.03 ± 0.05 | 0.41 ± 0.94 | n.d. | 0.79 ± 0.63 | 3.72 ± 2.05 | 0.08 ± 0.17 | ||||||||||||||||||
| 2-Methyl-1H-pyrrole | 88 | 636-41-9 | 802 | 799 | n.d. | n.d. | n.d. | n.d. | n.d. | n.d. | 0.15 ± 0.22 | 0.94 ± 0.96 | 0.00 ± 0.02 | ||||||||||||||||||
| 1-Ethylpyrrole | 88 | 617-92-5 | 809 | 810 | n.d. | n.d. | n.d. | 0.01 ± 0.02 | 0.14 ± 0.41 | n.d. | 0.05 ± 0.15 | 0.54 ± 0.88 | n.d. | ||||||||||||||||||
| 2-Methylpyridine | 88 | 109-06-8 | 810 | 811 | n.d. | n.d. | n.d. | 0.00 ± 0.01 | 0.03 ± 0.11 | n.d. | 0.16 ± 0.15 | 0.83 ± 0.52 | 0.01 ± 0.02 | ||||||||||||||||||
| 3-Methyl-1H-pyrrole | 93 | 616-43-3 | 844 | 841 | n.d. | n.d. | n.d. | n.d. | n.d. | n.d. | 0.03 ± 0.07 | 0.35 ± 0.37 | 0.00 ± 0.01 | ||||||||||||||||||
| 3-Methylpyridine | 89 | 108-99-6 | 855 | 856 | n.d. | n.d. | n.d. | n.d. | n.d. | n.d. | 0.06 ± 0.20 | 0.27 ± 0.57 | 0.01 ± 0.05 | ||||||||||||||||||
| 2,6-Dimethylpyridine | 85 | 108-48-5 | 879 | 874 | n.d. | n.d. | n.d. | n.d. | n.d. | n.d. | 0.01 ± 0.03 | 0.10 ± 0.07 | n.d. | ||||||||||||||||||
| 2-Ethylpyridine | 90 | 100-71-0 | 901 | 901 | n.d. | n.d. | n.d. | 0.03 ± 0.02 | 0.00 ± 0.01 | n.d. | 0.05 ± 0.07 | 0.24 ± 0.18 | 0.00 ± 0.01 | ||||||||||||||||||
| 2,5-Dimethylpyrazine | 87 | 123-32-0 | 908 | 908 | n.d. | n.d. | n.d. | n.d. | 0.02 ± 0.10 | n.d. | 0.01 ± 0.02 | 0.01 ± 0.03 | n.d. | ||||||||||||||||||
| 2,4-Dimethylpyridine | 86 | 108-47-4 | 926 | 925 | n.d. | n.d. | n.d. | n.d. | 0.05 ± 0.15 | n.d. | 0.13 ± 0.33 | 0.90 ± 1.63 | 0.04 ± 0.11 | ||||||||||||||||||
| 2,5-Dimethyl-1H-pyrrole | 93 | 625-84-3 | 936 | 937 | n.d. | n.d. | n.d. | n.d. | n.d. | n.d. | 0.02 ± 0.08 | 0.47 ± 0.30 | 0.00 ± 0.01 | ||||||||||||||||||
| 2,5-Dimethylpyridine | 90 | 589-93-5 | 940 | 946 | n.d. | n.d. | n.d. | n.d. | n.d. | n.d. | 0.04 ± 0.11 | 0.43 ± 0.36 | 0.01 ± 0.04 | ||||||||||||||||||
| 3-Ethylpyridine | 83 | 536-78-7 | 954 | 955 | n.d. | n.d. | n.d. | n.d. | n.d. | n.d. | 0.01 ± 0.04 | 0.08 ± 0.14 | n.d. | ||||||||||||||||||
| 4-Ethyl-2-methyl-1H-pyrrole | 83 | 5690-96-0 | 972 | 951 | n.d. | n.d. | n.d. | n.d. | n.d. | n.d. | 0.01 ± 0.03 | 0.23 ± 0.29 | n.d. | ||||||||||||||||||
| Pyridin-2-amine | 90 | 504-29-0 | 1010 | 1002 | n.d. | n.d. | n.d. | n.d. | 0.05 ± 0.22 | n.d. | 0.07 ± 0.14 | 1.56 ± 0.66 | n.d. | ||||||||||||||||||
| 2,3,4-Trimethyl-1H-pyrrole | 87 | 3855-78-5 | 1019 | 978 | n.d. | n.d. | n.d. | n.d. | n.d. | n.d. | 0.02 ± 0.11 | 0.86 ± 0.86 | n.d. | ||||||||||||||||||
| 2,6-Diethylpyrazine | 85 | 13067-27-1 | 1079 | 1080 | n.d. | n.d. | n.d. | n.d. | 0.19 ± 0.36 | n.d. | 0.00 ± 0.01 | 0.05 ± 0.12 | n.d. | ||||||||||||||||||
| Unknown heterocyclic compound A | 87 | 496-15-1 | 1115 | 1192 | n.d. | n.d. | n.d. | 0.01 ± 0.02 | 0.28 ± 0.50 | n.d. | 0.05 ± 0.12 | 0.99 ± 0.92 | 0.02 ± 0.07 | ||||||||||||||||||
| 2-Isobutyl-4-methylpyridine | 87 | 85665-88-9 | 1149 | 1154 | n.d. | n.d. | n.d. | n.d. | n.d. | n.d. | 0.02 ± 0.08 | 0.41 ± 0.51 | 0.05 ± 0.11 | ||||||||||||||||||
| 2-Pentylpyridine | 86 | 2294-76-0 | 1197 | 1202 | n.d. | n.d. | n.d. | 0.05 ± 0.05 | n.d. | n.d. | 0.03 ± 0.07 | 0.23 ± 0.63 | n.d. | ||||||||||||||||||
| 1-Methylindole | 83 | 603-76-9 | 1246 | 1273 | n.d. | n.d. | n.d. | n.d. | n.d. | n.d. | n.d. | 0.19 ± 0.37 | n.d. | ||||||||||||||||||
| 1H-Indole | 89 | 120-72-9 | 1251 | 1251 | n.d. | n.d. | n.d. | 0.00 ± 0.02 | 0.04 ± 0.11 | 0.17 ± 0.44 | 0.16 ± 0.24 | 1.51 ± 1.67 | 2.04 ± 1.96 | ||||||||||||||||||
| 3-Methyl-1H-indole | 86 | 83-34-1 | 1381 | 1383 | n.d. | n.d. | n.d. | n.d. | 0.15 ± 0.58 | 0.02 ± 0.09 | n.d. | 0.26 ± 0.58 | 0.60 ± 0.84 | ||||||||||||||||||
| Total heterocyclic compounds | n.d. | n.d. | n.d. | 0.18 | 3.55 | 0.19 | 2.14 | 15.91 | 2.87 | ||||||||||||||||||||||
| Ketones | |||||||||||||||||||||||||||||||
| Pentan-3-one | 82 | 96-22-0 | 683 | 685 | 6.52 ± 24.95 | 7.85 ± 27.71 | n.d. | 0.01 ± 0.02 | 0.03 ± 0.10 | n.d. | 0.16 ± 0.23 | 0.02 ± 0.07 | n.d. | ||||||||||||||||||
| Hex-1-en-3-one | 91 | 1629-60-3 | 775 | 777 | n.d. | n.d. | n.d. | n.d. | n.d. | n.d. | 0.14 ± 0.12 | 0.01 ± 0.02 | n.d. | ||||||||||||||||||
| Hexan-3-one | 85 | 589-38-8 | 784 | 784 | n.d. | n.d. | n.d. | 0.03 ± 0.04 | n.d. | n.d. | 0.01 ± 0.01 | 0.00 ± 0.01 | n.d. | ||||||||||||||||||
| Cyclopentanone | 89 | 120-92-3 | 788 | 789 | n.d. | n.d. | n.d. | 0.00 ± 0.01 | 0.01 ± 0.02 | n.d. | 0.00 ± 0.01 | 0.00 ± 0.01 | n.d. | ||||||||||||||||||
| Cyclopent-2-en-1-one | 86 | 930-30-3 | 827 | 829 | n.d. | n.d. | n.d. | n.d. | n.d. | n.d. | 0.02 ± 0.04 | n.d. | n.d. | ||||||||||||||||||
| Hept-1-en-3-one | 88 | 2918-13-0 | 873 | 876 | n.d. | n.d. | n.d. | n.d. | n.d. | n.d. | 0.14 ± 0.13 | 0.00 ± 0.02 | n.d. | ||||||||||||||||||
| Heptan-3-one | 89 | 106-35-4 | 883 | 885 | 0.00 ± 0.01 | n.d. | n.d. | 0.09 ± 0.12 | n.d. | n.d. | 0.05 ± 0.05 | 0.01 ± 0.03 | n.d. | ||||||||||||||||||
| Heptan-2-one | 86 | 110-43-0 | 888 | 889 | n.d. | n.d. | n.d. | 0.20 ± 0.23 | 0.00 ± 0.01 | n.d. | 0.15 ± 0.42 | n.d. | n.d. | ||||||||||||||||||
| 4-Methylcyclohexan-1-one | 82 | 589-92-4 | 935 | 950 | n.d. | n.d. | n.d. | 0.01 ± 0.01 | n.d. | n.d. | 0.21 ± 0.33 | 0.01 ± 0.04 | n.d. | ||||||||||||||||||
| Octan-4-one | 88 | 589-63-9 | 972 | 970 | n.d. | n.d. | n.d. | 0.13 ± 0.16 | n.d. | n.d. | 1.15 ± 0.17 | 0.08 ± 0.00 | n.d. | ||||||||||||||||||
| Oct-1-en-3-one | 87 | 4312-99-6 | 977 | 977 | n.d. | n.d. | n.d. | 0.07 ± 0.12 | n.d. | n.d. | 0.20 ± 0.22 | 0.02 ± 0.09 | n.d. | ||||||||||||||||||
| Octan-3-one | 90 | 106-68-3 | 986 | 987 | n.d. | n.d. | n.d. | 0.07 ± 0.04 | n.d. | n.d. | 0.07 ± 0.06 | 0.01 ± 0.03 | n.d. | ||||||||||||||||||
| Octan-2-one | 84 | 111-13-7 | 990 | 990 | n.d. | n.d. | n.d. | 0.27 ± 0.21 | n.d. | n.d. | n.d. | n.d. | n.d. | ||||||||||||||||||
| Nonan-3-one | 82 | 925-78-0 | 1087 | 1089 | n.d. | n.d. | n.d. | 0.01 ± 0.01 | n.d. | n.d. | 0.00 ± 0.01 | n.d. | n.d. | ||||||||||||||||||
| (E)-Oct-3-en-2-one | 84 | 1669-44-9 | 1039 | 1040 | 0.00 ± 0.01 | n.d. | n.d. | 0.03 ± 0.02 | n.d. | n.d. | n.d. | n.d. | n.d. | ||||||||||||||||||
| Nonan-2-one | 85 | 821-55-6 | 1092 | 1092 | n.d. | n.d. | n.d. | 0.13 ± 0.17 | 0.01 ± 0.04 | n.d. | n.d. | n.d. | n.d. | ||||||||||||||||||
| 1-Phenylpropan-2-one | 86 | 103-79-7 | 1129 | 1124 | n.d. | n.d. | n.d. | n.d. | n.d. | n.d. | 0.01 ± 0.02 | 0.04 ± 0.08 | n.d. | ||||||||||||||||||
| (E)-Non-3-en-2-one | 84 | 14309-57-0 | 1139 | 1137 | 0.01 ± 0.05 | n.d. | n.d. | 0.13 ± 0.20 | n.d. | n.d. | n.d. | n.d. | n.d. | ||||||||||||||||||
| Decan-2-one | 89 | 693-54-9 | 1193 | 1190 | n.d. | n.d. | n.d. | 0.30 ± 0.16 | n.d. | n.d. | 0.24 ± 0.60 | n.d. | n.d. | ||||||||||||||||||
| Dodecan-2-one | 84 | 6175-49-1 | 1396 | 1397 | n.d. | n.d. | n.d. | 0.03 ± 0.05 | n.d. | n.d. | 0.05 ± 0.10 | n.d. | n.d. | ||||||||||||||||||
| Pentadecan-2-one | 90 | 2345-28-0 | 1690 | 1689 | 0.05 ± 0.18 | n.d. | 0.68 ± 2.45 | 0.34 ± 0.47 | 8.04 ± 15.55 | 4.72 ± 5.43 | 0.11 ± 0.21 | 0.78 ± 0.94 | 2.24 ± 3.06 | ||||||||||||||||||
| Heptadecan-2-one | 87 | 2922-51-2 | 1902 | 1902 | n.d. | n.d. | 0.19 ± 0.68 | 0.01 ± 0.03 | 0.03 ± 0.15 | 1.40 ± 1.17 | 0.07 ± 0.10 | 0.18 ± 0.29 | 0.29 ± 0.67 | ||||||||||||||||||
| Total ketones | 6.58 | 7.85 | 0.87 | 1.86 | 8.12 | 6.12 | 2.78 | 1.16 | 2.53 | ||||||||||||||||||||||
| Nitriles | |||||||||||||||||||||||||||||||
| 2-Methylbutanenitrile | 86 | 18936-17-9 | 737 | 729 | n.d. | n.d. | n.d. | n.d. | n.d. | n.d. | 0.00 ± 0.01 | 0.03 ± 0.05 | n.d. | ||||||||||||||||||
| 3-Methylbutanenitrile | 90 | 625-28-5 | 741 | 737 | n.d. | n.d. | n.d. | n.d. | n.d. | n.d. | 0.02 ± 0.04 | 0.15 ± 0.16 | n.d. | ||||||||||||||||||
| Pentanenitrile | 88 | 110-59-8 | 775 | 777 | n.d. | n.d. | n.d. | n.d. | n.d. | n.d. | 0.00 ± 0.01 | 0.02 ± 0.03 | n.d. | ||||||||||||||||||
| 4-Methylpentanenitrile | 89 | 542-54-1 | 836 | 843 | n.d. | n.d. | n.d. | 0.02 ± 0.05 | 0.22 ± 0.50 | n.d. | 0.11 ± 0.25 | 1.08 ± 0.95 | n.d. | ||||||||||||||||||
| Benzonitrile | 86 | 100-47-0 | 984 | 984 | n.d. | n.d. | n.d. | n.d. | n.d. | n.d. | 0.03 ± 0.08 | 0.02 ± 0.05 | n.d. | ||||||||||||||||||
| 2-Phenylacetonitrile | 94 | 140-29-4 | 1140 | 1140 | n.d. | n.d. | n.d. | n.d. | 0.09 ± 0.21 | 0.01 ± 0.02 | 0.09 ± 0.13 | 2.02 ± 0.96 | 0.23 ± 0.07 | ||||||||||||||||||
| 3-Phenylpropanenitrile | 90 | 645-59-0 | 1243 | 1244 | n.d. | n.d. | n.d. | 0.00 ± 0.01 | 0.04 ± 0.13 | 0.13 ± 0.40 | 0.22 ± 0.28 | 1.93 ± 1.48 | 0.69 ± 0.78 | ||||||||||||||||||
| Hexadecanenitrile | 91 | 629-79-8 | 1860 | 1857 | n.d. | n.d. | 0.10 ± 0.40 | 0.02 ± 0.08 | 0.00 ± 0.01 | 0.10 ± 0.41 | 0.02 ± 0.06 | 0.09 ± 0.22 | 2.78 ± 1.79 | ||||||||||||||||||
| (Z)-Octadec-9-enenitrile | 92 | 112-91-4 | 2083 | 2064 | n.d. | n.d. | n.d. | 0.01 ± 0.05 | n.d. | n.d. | 0.02 ± 0.07 | 0.06 ± 0.16 | 1.62 ± 1.26 | ||||||||||||||||||
| Octadecanenitrile | 90 | 28623-46-3 | 2107 | 2155 | n.d. | n.d. | 0.07 ± 0.25 | 0.01 ± 0.05 | n.d. | n.d. | 0.01 ± 0.05 | 0.03 ± 0.10 | 1.20 ± 1.19 | ||||||||||||||||||
| Total nitriles | n.d. | n.d. | 0.17 | 0.06 | 0.35 | 0.24 | 0.52 | 5.43 | 6.52 | ||||||||||||||||||||||
| Others | |||||||||||||||||||||||||||||||
| Unknown other | 1131 | n.d. | n.d. | n.d. | n.d. | n.d. | n.d. | n.d. | 0.21 ± 0.44 | n.d. | |||||||||||||||||||||
| Squalene | 90 | 111-02-4 | 2833 | 2833 | 15.55 ± 27.42 | 15.33 ± 30.38 | 17.60 ± 36.72 | 0.05 ± 0.09 | 0.89 ± 1.55 | 2.41 ± 3.17 | 0.05 ± 0.05 | 0.24 ± 0.23 | 1.05 ± 0.62 | ||||||||||||||||||
| Tocopherol | 83 | 10191-41-0 | 3178 | 3149 | n.d. | n.d. | n.d. | n.d. | 0.04 ± 0.12 | 0.38 ± 0.42 | n.d. | 0.02 ± 0.04 | 0.01 ± 0.06 | ||||||||||||||||||
| Total others | 15.55 | 15.33 | 17.60 | 0.05 | 0.93 | 2.79 | 0.05 | 0.47 | 1.06 | ||||||||||||||||||||||
| Total | 100 | 100 | 100 | 100 | 100 | 100 | 100 | 100 | 100 | ||||||||||||||||||||||
Appendix D
References
- Patterson, R.L.S. 5α-androst-16-ene-3-one:—Compound Responsible for Taint in Boar Fat. J. Sci. Food Agric. 1968, 19, 31–38. [Google Scholar] [CrossRef]
- Vold, E. Fleischproduktionseigenschaftenbei Ebernund Kastraten IV: Organoleptische und Gaschromatographische Untersuchungen Wasserdampfflüch- Tiger Stoffe Des Rücken-Speckes von Ebern. Meld. Fra Norges Landbrugshøgskole 1970, 49, 1–25. [Google Scholar]
- Brooks, R.I.; Pearson, A.M. Odor Thresholds of the C19-Δ16-Steroids Responsible for Boar Odor in Pork. Meat Sci. 1989, 24, 11–19. [Google Scholar] [CrossRef] [PubMed]
- Fischer, J.; Gerlach, C.; Meier-Dinkel, L.; Elsinghorst, P.W.; Boeker, P.; Schmarr, H.G.; Wüst, M. 2-Aminoacetophenone–A Hepatic Skatole Metabolite as a Potential Contributor to Boar Taint. Food Res. Int. 2014, 62, 35–42. [Google Scholar] [CrossRef]
- Aluwé, M.; Heyrman, E.; Almeida, J.M.; Babol, J.; Battacone, G.; Čítek, J.; Font-i-Furnols, M.; Getya, A.; Karolyi, D.; Kostyra, E.; et al. Exploratory Survey on European Consumer and Stakeholder Attitudes towards Alternatives for Surgical Castration of Piglets. Animals 2020, 10, 1758. [Google Scholar] [CrossRef] [PubMed]
- European Commission European Declaration on Alternatives to Surgical Castration of Pigs. Available online: https://ec.europa.eu/food/animals/welfare/practice/farm/pigs/castration_alternatives_en (accessed on 15 April 2021).
- Bonneau, M.; Weiler, U. Pros and Cons of Alternatives to Piglet Castration: Welfare, Boar Taint, and Other Meat Quality Traits. Animals 2019, 9, 884. [Google Scholar] [CrossRef]
- Kress, K.; Weiler, U.; Schmucker, S.; Čandek-Potokar, M.; Vrecl, M.; Fazarinc, G.; Škrlep, M.; Batorek-Lukač, N.; Stefanski, V. Influence of Housing Conditions on Reliability of Immunocastration and Consequences for Growth Performance of Male Pigs. Animals 2020, 10, 27. [Google Scholar] [CrossRef]
- Heyrman, E.; Kowalski, E.; Millet, S.; Tuyttens, F.A.M.; Ampe, B.; Janssens, S.; Buys, N.; Wauters, J.; Vanhaecke, L.; Aluwé, M. Monitoring of Behavior, Sex Hormones and Boar Taint Compounds during the Vaccination Program for Immunocastration in Three Sire Lines. Res. Vet. Sci. 2019, 124, 293–302. [Google Scholar] [CrossRef]
- Trautmann, J.; Gertheiss, J.; Wicke, M.; Mörlein, D. How Olfactory Acuity Affects the Sensory Assessment of Boar Fat: A Proposal for Quantification. Meat Sci. 2014, 98, 255–262. [Google Scholar] [CrossRef]
- Mortensen, A.B.; Sorensen, S.E. Relationship between Boar Taint and Skatole Determined with a New Analysis Method. In Proceedings of the 32nd European Meeting Research Workers, Graz, Austria, 18–19 October 1984; pp. 394–396. [Google Scholar]
- Burgeon, C.; Debliquy, M.; Lahem, D.; Rodriguez, J.; Ly, A.; Fauconnier, M.L. Past, Present, and Future Trends in Boar Taint Detection. Trends Food Sci. Technol. 2021, 112, 283–297. [Google Scholar] [CrossRef]
- Lund, B.W.; Borggaard, C.; Birkler, R.I.D.; Jensen, K.; Støier, S. High Throughput Method for Quantifying Androstenone and Skatole in Adipose Tissue from Uncastrated Male Pigs by Laser Diode Thermal Desorption-Tandem Mass Spectrometry. Food Chem. X 2021, 9, 100113. [Google Scholar] [CrossRef]
- Verplanken, K.; Stead, S.; Jandova, R.; Van Poucke, C.; Claereboudt, J.; Bussche, J.V.; De Saeger, S.; Takats, Z.; Wauters, J.; Vanhaecke, L. Rapid Evaporative Ionization Mass Spectrometry for High-Throughput Screening in Food Analysis: The Case of Boar Taint. Talanta 2017, 169, 30–36. [Google Scholar] [CrossRef]
- Sørensen, K.M.; Westley, C.; Goodacre, R.; Engelsen, S.B. Simultaneous Quantification of the Boar-Taint Compounds Skatole and Androstenone by Surface-Enhanced Raman Scattering (SERS) and Multivariate Data Analysis. Anal. Bioanal. Chem. 2015, 407, 7787–7795. [Google Scholar] [CrossRef]
- Liu, X.; Schmidt, H.; Mörlein, D. Feasibility of Boar Taint Classification Using a Portable Raman Device. Meat Sci. 2016, 116, 133–139. [Google Scholar] [CrossRef] [PubMed]
- Verplanken, K.; Wauters, J.; Van Durme, J.; Claus, D.; Vercammen, J.; De Saeger, S.; Vanhaecke, L. Rapid Method for the Simultaneous Detection of Boar Taint Compounds by Means of Solid Phase Microextraction Coupled to Gas Chromatography/Mass Spectrometry. J. Chromatogr. A 2016, 1462, 124–133. [Google Scholar] [CrossRef] [PubMed]
- Burgeon, C.; Markey, A.; Debliquy, M.; Lahem, D.; Rodriguez, J.; Ly, A.; Fauconnier, M.-L. Comprehensive SPME-GC-MS Analysis of VOC Profiles Obtained Following High-Temperature Heating of Pork Back Fat with Varying Boar Taint Intensities. Foods 2021, 10, 1311. [Google Scholar] [CrossRef] [PubMed]
- Rius, M.A.; Hortós, M.; García-Regueiro, J.A. Influence of Volatile Compounds on the Development of Off-Flavours in Pig Back Fat Samples Classified with Boar Taint by a Test Panel. Meat Sci. 2005, 71, 595–602. [Google Scholar] [CrossRef]
- Psillakis, E.; Yiantzi, E.; Sanchez-Prado, L.; Kalogerakis, N. Vacuum-Assisted Headspace Solid Phase Microextraction: Improved Extraction of Semivolatiles by Non-Equilibrium Headspace Sampling under Reduced Pressure Conditions. Anal. Chim. Acta 2012, 742, 30–36. [Google Scholar] [CrossRef] [PubMed]
- 3-Methylindole, C9H9N–PubChem. Available online: https://pubchem.ncbi.nlm.nih.gov/compound/3-Methylindole#section=Structures (accessed on 7 October 2023).
- 5alpha-Androst-16-En-3-One, C19H28O–PubChem. Available online: https://pubchem.ncbi.nlm.nih.gov/compound/6852393#section=Structures (accessed on 7 October 2023).
- Dansyl Hydrazine, C12H15N3O2S–PubChem. Available online: https://pubchem.ncbi.nlm.nih.gov/compound/94442#section=2D-Structure (accessed on 8 October 2023).
- Hogard, M.L.; Lunte, C.E.; Lunte, S.M. Detection of Reactive Aldehyde Biomarkers in Biological Samples Using Solid-Phase Extraction Pre-Concentration and Liquid Chromatography with Fluorescence Detection. Anal. Methods 2017, 9, 1848–1854. [Google Scholar] [CrossRef]
- Hansen-Møller, J. Rapid High-Performance Liquid Chromatographic Method for Simultaneous Determination of Androstenone, Skatole and Indole in Back Fat from Pigs. J. Chromatogr. B Biomed. Sci. Appl. 1994, 661, 219–230. [Google Scholar] [CrossRef]
- Paquot, C. Standard Methods for the Analysis of Oils, Fats and Derivatives. Pure Appl. Chem. 1982, 54, 233–246. [Google Scholar] [CrossRef]
- Burgeon, C.; Font-i-Furnols, M.; Garrido, M.D.; Linares, M.B.; Brostaux, Y.; Sabeña, G.; Fauconnier, M.-L.; Panella-Riera, N. Can Sensory Boar Taint Levels Be Explained by Fatty Acid Composition and Emitted Volatile Organic Compounds in Addition to Androstenone and Skatole Content? Meat Sci. 2022, 195, 108985. [Google Scholar] [CrossRef] [PubMed]
- Bekaert, K.M.; Aluwé, M.; Vanhaecke, L.; Heres, L.; Duchateau, L.; Vandendriessche, F.; Tuyttens, F.A.M. Evaluation of Different Heating Methods for the Detection of Boar Taint by Means of the Human Nose. Meat Sci. 2013, 94, 125–132. [Google Scholar] [CrossRef] [PubMed]
- Mörlein, D.; Tholen, E. Fatty Acid Composition of Subcutaneous Adipose Tissue from Entire Male Pigs with Extremely Divergent Levels of Boar Taint Compounds–An Exploratory Study. Meat Sci. 2015, 99, 1–7. [Google Scholar] [CrossRef]
- Oleic Acid, C18H34O2–PubChem. Available online: https://pubchem.ncbi.nlm.nih.gov/compound/Oleic-acid#section=Vapor-Pressure (accessed on 14 April 2021).
- Palmitic Acid, C16H32O2–PubChem. Available online: https://pubchem.ncbi.nlm.nih.gov/compound/985#section=2D-Structure (accessed on 8 October 2023).
- Linoleic Acid, C18H32O2–PubChem. Available online: https://pubchem.ncbi.nlm.nih.gov/compound/5280450#section=2D-Structure (accessed on 8 October 2023).
- Zamaratskaia, G.; Gilmore, W.J.; Lundström, K.; Squires, E.J. Effect of Testicular Steroids on Catalytic Activities of Cytochrome P450 Enzymes in Porcine Liver Microsomes. Food Chem. Toxicol. 2007, 45, 676–681. [Google Scholar] [CrossRef]
- Bonneau, M. Use of Entire Males for Pig Meat in the European Union. Meat Sci. 1998, 49, 257–272. [Google Scholar] [CrossRef]
- Whittington, F.M.; Zammerini, D.; Nute, G.R.; Baker, A.; Hughes, S.I.; Wood, J.D. Comparison of Heating Methods and the Use of Different Tissues for Sensory Assessment of Abnormal Odours (Boar Taint) in Pig Meat. Meat Sci. 2011, 88, 249–255. [Google Scholar] [CrossRef]
- Trautmann, J.; Meier-Dinkel, L.; Gertheiss, J.; Mörlein, D. Boar Taint Detection: A Comparison of Three Sensory Protocols. Meat Sci. 2016, 111, 92–100. [Google Scholar] [CrossRef]
- Hansson, K.E.; Lundstrom, K.; Fjelkner-Modig, S.; Persson, J. The Importance of Androstenone and Skatole for Boar Taint. Swedish J. Agric. Res. 1980, 10, 167–173. [Google Scholar]
- Rius, M.A.; García-Regueiro, J.A. Skatole and Indole Concentrations in Longissimus Dorsi and Fat Samples of Pigs. Meat Sci. 2001, 59, 285–291. [Google Scholar] [CrossRef]
- Shirey, R.E. SPME Commercial Devices and Fibre Coatings. In Handbook of Solid Phase Microextraction; Elsevier Inc.: Amsterdam, The Netherlands, 2012; pp. 99–133. ISBN 9780124160170. [Google Scholar]
- Serra, A.; Buccioni, A.; Rodriguez-Estrada, M.T.; Conte, G.; Cappucci, A.; Mele, M. Fatty Acid Composition, Oxidation Status and Volatile Organic Compounds in “Colonnata” Lard from Large White or Cinta Senese Pigs as Affected by Curing Time. Meat Sci. 2014, 97, 504–512. [Google Scholar] [CrossRef] [PubMed]
- Domínguez, R.; Pateiro, M.; Gagaoua, M.; Barba, F.J.; Zhang, W.; Lorenzo, J.M. A Comprehensive Review on Lipid Oxidation in Meat and Meat Products. Antioxidants 2019, 8, 429. [Google Scholar] [CrossRef]
- Moldoveanu, S.C. Pyrolysis of Amino Acids and Small Peptides. In Techniques and Instrumentation in Analytical Chemistry; Elsevier Inc.: Amsterdam, The Netherlands, 2010; Volume 28, pp. 527–578. ISBN 9780444531131. [Google Scholar]
- Methyl Stearate, C19H38O2–PubChem. Available online: https://pubchem.ncbi.nlm.nih.gov/compound/Methyl-Stearate#section=Vapor-Pressure (accessed on 9 October 2023).
- Mascrez, S.; Psillakis, E.; Purcaro, G. A Multifaceted Investigation on the Effect of Vacuum on the Headspace Solid-Phase Microextraction of Extra-Virgin Olive Oil. Anal. Chim. Acta 2020, 1103, 106–114. [Google Scholar] [CrossRef] [PubMed]
- Mathur, P.K.; ten Napel, J.; Bloemhof, S.; Heres, L.; Knol, E.F.; Mulder, H.A. A Human Nose Scoring System for Boar Taint and Its Relationship with Androstenone and Skatole. Meat Sci. 2012, 91, 414–422. [Google Scholar] [CrossRef]
- Bonneau, M.; Walstra, P.; Claudi-Magnussen, C.; Kempster, A.J.; Tornberg, E.; Fischer, K.; Diestre, A.; Siret, F.; Chevillon, P.; Claus, R.; et al. An International Study on the Importance of Androstenone and Skatole for Boar Taint: IV. Simulation Studies on Consumer Dissatisfaction with Entire Male Pork and the Effect of Sorting Carcasses on the Slaughter Line, Main Conclusions and Recommendations. Meat Sci. 2000, 54, 285–295. [Google Scholar] [CrossRef]
- Papadopoulou, O.S.; Tassou, C.C.; Schiavo, L.; Nychas, G.-J.E.; Panagou, E.Z. Rapid Assessment of Meat Quality by Means of an Electronic Nose and Support Vector Machines. Procedia Food Sci. 2011, 1, 2003–2006. [Google Scholar] [CrossRef]
- van Gemert, L.J. Flavour Thresholds–Compilations of Flavour Threshold Values in Water and Other Media; Oliemans Punter & Partners BV: Utrecht, The Netherlands, 2011. [Google Scholar]
- Aaslyng, M.D.; Meinert, L. Meat Flavour in Pork and Beef–From Animal to Meal. Meat Sci. 2017, 132, 112–117. [Google Scholar] [CrossRef]
- Han, D.; Zhang, C.H.; Fauconnier, M.L.; Jia, W.; Wang, J.F.; Hu, F.F.; Xie, D.W. Characterization and Comparison of Flavor Compounds in Stewed Pork with Different Processing Methods. Lwt 2021, 144, 111229. [Google Scholar] [CrossRef]
- Font-i-Furnols, M.; Martín-bernal, R.; Aluwé, M.; Bonneau, M.; Haugen, J.E.; Mörlein, D.; Mörlein, J.; Panella-riera, N.; Škrlep, M. Feasibility of on/at Line Methods to Determine Boar Taint and Boar Taint Compounds: An Overview. Animals 2020, 10, 1886. [Google Scholar] [CrossRef]


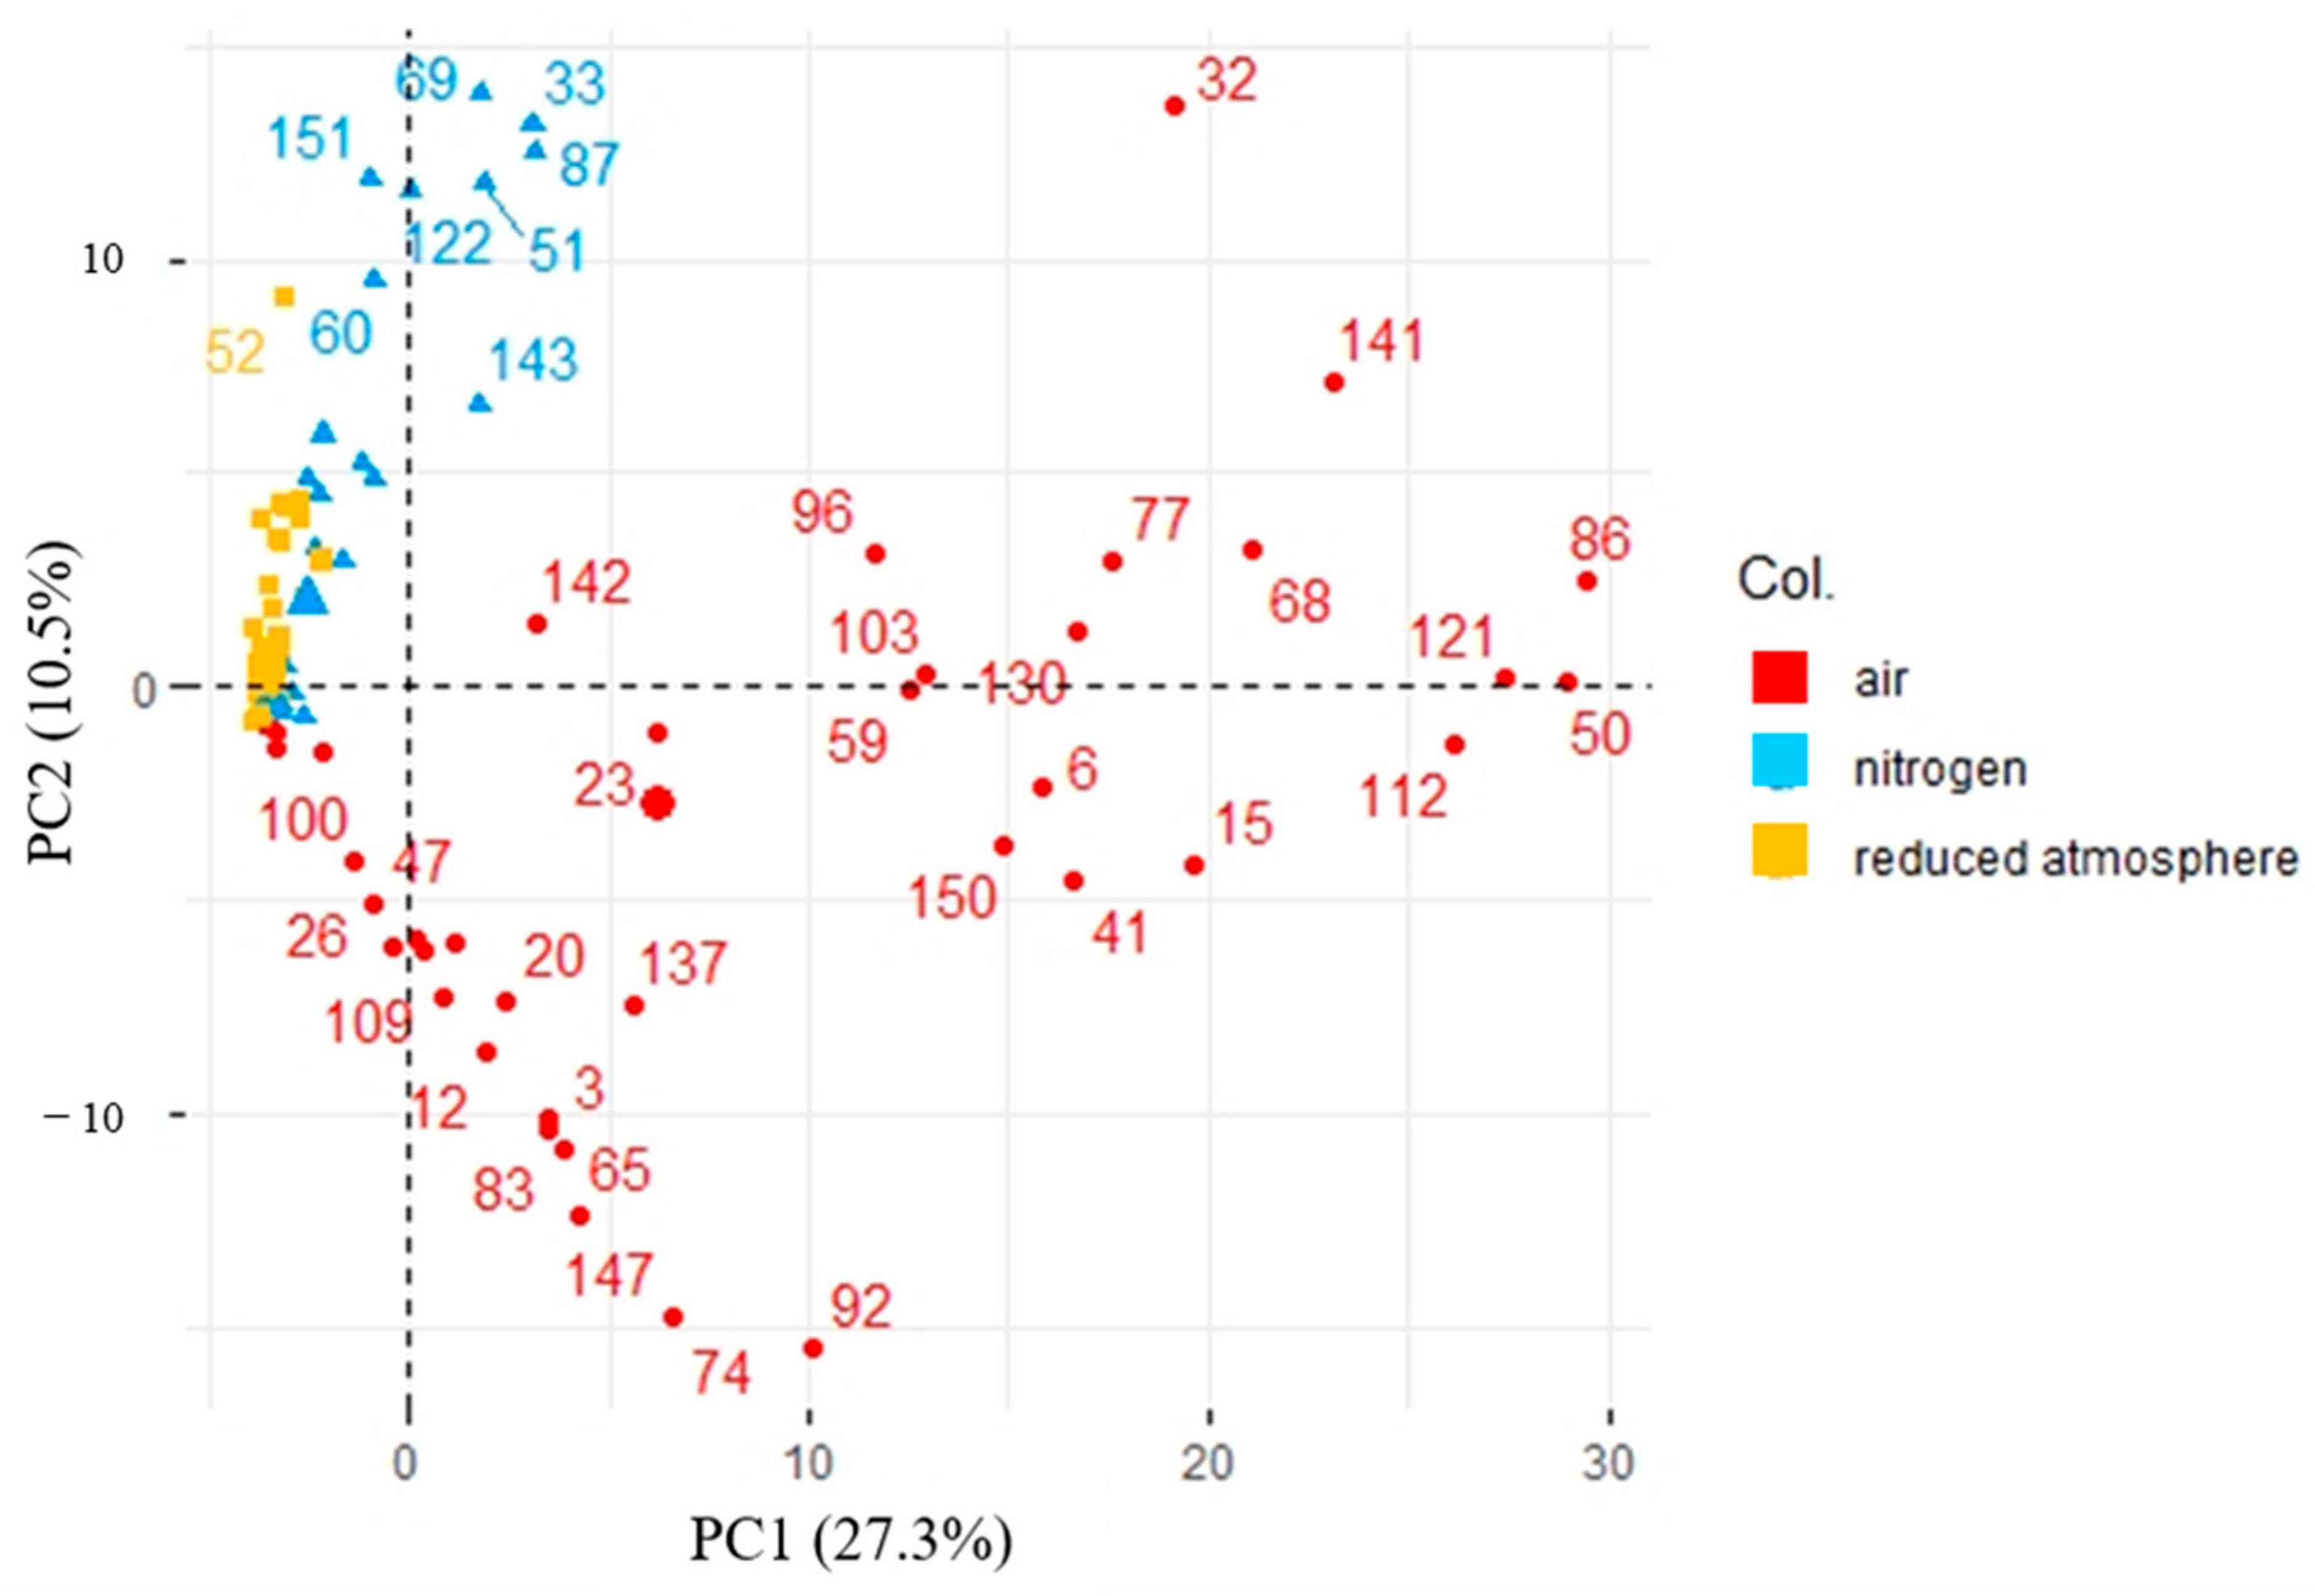
| PC1 | PC2 | ||
|---|---|---|---|
| VOC Considered | Correlation | VOC Considered | Correlation |
| undecane | 0.96 | 3-phenylpropanenitrile | 0.69 |
| heptanal | 0.95 | Pyridin-2-amine | 0.63 |
| butylbenzene | 0.94 | 3-methyl-1H-pyrrole | 0.63 |
| decanal | 0.94 | 2,5-dimethyl-1H-pyrrole | 0.63 |
| octanal | 0.94 | 2-phenylacetonitrile | 0.62 |
| propylbenzene | 0.92 | 2,5-dimethylpyridine | 0.60 |
| (E)-oct-2-enal | 0.92 | 2,3,4-trimethyl-1H-pyrrole | 0.56 |
| tridecane | 0.92 | 1-phenylpropan-2-one | 0.55 |
| pentylbenzene | 0.90 | 2-methyl-1H-pyrrole | 0.54 |
| non-1-ene | 0.89 | 4-ethyl-2-methyl-1H-pyrrole | 0.52 |
Disclaimer/Publisher’s Note: The statements, opinions and data contained in all publications are solely those of the individual author(s) and contributor(s) and not of MDPI and/or the editor(s). MDPI and/or the editor(s) disclaim responsibility for any injury to people or property resulting from any ideas, methods, instructions or products referred to in the content. |
© 2023 by the authors. Licensee MDPI, Basel, Switzerland. This article is an open access article distributed under the terms and conditions of the Creative Commons Attribution (CC BY) license (https://creativecommons.org/licenses/by/4.0/).
Share and Cite
Burgeon, C.; Markey, A.; Brostaux, Y.; Fauconnier, M.-L. Modifying Headspace Sampling Environment Improves Detection of Boar Taint Compounds in Pork Fat Samples. Chemosensors 2023, 11, 551. https://doi.org/10.3390/chemosensors11110551
Burgeon C, Markey A, Brostaux Y, Fauconnier M-L. Modifying Headspace Sampling Environment Improves Detection of Boar Taint Compounds in Pork Fat Samples. Chemosensors. 2023; 11(11):551. https://doi.org/10.3390/chemosensors11110551
Chicago/Turabian StyleBurgeon, Clément, Alice Markey, Yves Brostaux, and Marie-Laure Fauconnier. 2023. "Modifying Headspace Sampling Environment Improves Detection of Boar Taint Compounds in Pork Fat Samples" Chemosensors 11, no. 11: 551. https://doi.org/10.3390/chemosensors11110551
APA StyleBurgeon, C., Markey, A., Brostaux, Y., & Fauconnier, M.-L. (2023). Modifying Headspace Sampling Environment Improves Detection of Boar Taint Compounds in Pork Fat Samples. Chemosensors, 11(11), 551. https://doi.org/10.3390/chemosensors11110551