Article

Electrochemical Sensor Based on Spent Coffee Grounds Hydrochar and Metal Nanoparticles for Simultaneous Detection of Emerging Contaminants in Natural Water

by
Francisco Contini Barreto
1,
Erika Yukie Ito
1,
Naelle Kita Mounienguet
1,
Letícia Dal’ Evedove Soares
1,
Jie Yang
2,
Quan (Sophia) He
3 and
Ivana Cesarino
1,*
1
School of Agriculture, São Paulo State University (UNESP), Botucatu 18610-034, SP, Brazil
2
Institute of Oceanography, College of Geography and Oceanography, Minjiang University, Fuzhou 350108, China
3
Faculty of Agriculture, Dalhousie University, Truro, NS B2N 5E3, Canada
*
Author to whom correspondence should be addressed.
Chemosensors 2023, 11(11), 562; https://doi.org/10.3390/chemosensors11110562
Submission received: 18 September 2023 / Revised: 8 November 2023 / Accepted: 9 November 2023 / Published: 11 November 2023

Abstract

:
This research describes the modification of a glassy carbon electrode with spent coffee grounds hydrochar (HDC) and copper nanoparticles (CuNPs) for the simultaneous determination of hydroxychloroquine sulfate (HCS) and bisphenol A (BPA). Scanning electron microscopy, EDS and cyclic voltammetry were used to characterize the nanocomposite. The analytical parameters were optimized and the sensing platform was applied for the determination of HCS and BPA using square-wave voltammetry (SWV). For HCS, the linear range was from 1.0 μmol L−1 to 50 μmol L−1, with an LOD and LOQ of 0.46 and 1.53 μmol L−1, respectively. For BPA, the linear range was from 0.5 μmol L−1 to 10 μmol L−1, with an LOD and LOQ of 0.31 μmol L−1 and 1.06 μmol L−1, respectively. Finally, the developed electrochemical sensor was applied for the quantification of the emerging contaminants in natural water, with recoveries between 94.8% and 106.8% for HCS and 99.6% and 105.2% for BPA. Therefore, HDC-CuNPs demonstrated themselves to be a good alternative as a sustainable and cheaper material for application in electroanalyses.

1. Introduction

With the development of technology, human-made substances have been largely incorporated into industrial products, with little understanding of the consequences for decades. Many of these synthetic chemicals are found in water bodies, coming from the residual waste of several areas of industry [1,2]. Nowadays, numerous hazards for the environment and human health caused by such contaminants have been described, but there is no effective treatment to eliminate them [3]. The plastics industry significantly contributes to this type of pollution due to the growth of market consumption [4]. Most goods sold have plastic packages that, once thrown away, turn into microplastics [2,5,6]. Bisphenol-A is a chemical associated with microplastics, currently known as a potential carcinogen and a contributor to endocrine disorders [7]. Along with untreated plastic contaminants, pharmaceutical products are a concern for ecosystems and the quality of potable water. Since drugs are not totally absorbed by organisms, the urine and feces of patients go into the waters carrying excreted remainders or incompletely metabolized parts of such chemicals [8]. That is the case for chloroquine and hydroxychloroquine, which were increasingly used during the COVID-19 pandemic. [8] While their beneficial combat to SARS-CoV-2 is still unsure, these medicals have been found in water and—similarly to bisphenol-A—have shown dangerous effects on both the environment and human health [8,9].
Both bisphenol A and chloroquine are chemical compounds of interest in various fields, and their detection can be carried out through specific analytical methods. Due to the increasing detection of BPA and chloroquine residues in water, several analysis methods have been developed. Among them, chromatographic methods such as Gas Chromatography (GC) and High-Performance Liquid Chromatography (HPLC) are noteworthy [10]. When combined with detectors like UV–visible or fluorescence, these methods allow for the separation and quantification of analytes. Mass spectrometry (LC-MS and GC-MS), coupled with chromatography, is also a powerful tool for accurate detection during analysis [10,11]. Electroanalytical techniques such as voltammetry and potentiometry, utilizing the electrochemical properties of compounds, can also be considered as an alternative for analyses [12]. The choice of analytical method depends on the sample’s characteristics, detection needs and the limitations of available instruments. Conventional methods, while effective, have shown limitations, especially when it comes to field analyses. Besides being costly, detection using these methods can be time-consuming, susceptible to interference and subject to contamination risks during different stages of sample treatment [11,13]. Electroanalytical methods, employing voltammetric techniques, offer a better analytical alternative due to their high sensitivity and specificity, enabling detection at low concentrations, rapid analysis times, low cost and smaller instrument size. Thus, chemically modified surface sensors can amplify a signal, provide sensitivity in various environments and samples and have greater biological compatibility [14,15].
Hydrochars are carbon-based materials resulting from hydrothermal carbonization (HTC), a thermochemical process that converts biomass to this product using water at temperatures between 100 and 375 °C as a reaction medium under autogenous pressure [16,17]. In recent decades, this material has attracted significant attention due to its feedstock being abundantly available, renewable and inexpensive [18]. Although hydrochar has a low surface area and porosity, it can be activated and functionalized by several modification methods, such as CO2 treatment, the use of KOH or sulfonation with concentrated H2SO4 to improve its physicochemical properties [18,19,20,21]. Therefore, this carbonaceous material has a wide range of applications, having been used in wastewater treatment [22], the removal of heavy metals [18,23], soil amendment [24,25] and energy production [18,25,26]. However, despite the growing interest in hydrochar and its applications, very few studies involving its use in electrochemical sensing have been reported in the literature [27].
Metallic nanoparticles (MNPs), such as gold, silver, copper, antimony and palladium, are widely used as modifiers in electrochemical sensors due to their high surface area, good conductivity, high chemical stability and enhancement of mass transport [28,29]. Furthermore, copper is notably a metal that is easier to manage and cheaper compared to gold and silver [30], which makes its use quite attractive, and it has been successfully applied in the analysis of dopamine [30], escitalopram [30], chloroquine [9], fluoxetine [31] and isotretinoin [32].
Within this context, a nanocomposite based in hydrochar and copper nanoparticles was synthesized for the simultaneous determination of hydroxychloroquine sulfate and bisphenol A. This work provides a sustainable option for the study of emerging contaminants through the use of spent coffee grounds as a carbon source for the confection of the sensors. The proposed electrode was modified and successfully applied for the simultaneous determination of an antimalarial drug and an endocrine disruptor in natural water.

2. Materials and Methods

2.1. Instrumentation

A potentiostat (PGSTAT-128N Autolab Electrochemical System, Utrecht, The Netherlands) and NOVA 2.1 software (Metrohm, Utrecht, The Netherlands) were applied in the voltammetric experiments (square-wave voltammetry (SWV)), in a conventional three-electrode glass electrochemical cell. The working electrodes used in the experiments were of three types, differing only on their modified surfaces: glassy carbon (GC) (diameter = 2 mm ± 0.1 mm), hydrochar (HDC) and hydrochar with copper nanoparticles (HDC-CuNPs). The auxiliary electrode was a platinum plate, and the reference electrode was Ag/AgCl/KCl (3.0 mol L−1).
The nanoparticles were characterized morphologically using scanning electron microscopy (SEM) equipment from IQ-UNESP Araraquara, Brazil.

2.2. Solutions and Reagents

All the solutions prepared for this work used ultrapure water (Millipore Milli-Q system with resistivity ≥ 18.2 MΩ cm), and the reagents were of analytical grade (they were not purified before being applied in the experiments). CuCl2 (≥99.0%), bisphenol-A (≥98.0%), hydroxychloroquine sulfate (≥98.0%), copper standard, mercury standard, methomyl (≥98.0%), sodium dodecyl sulfate (≥99.0%), sodium borohydride (≥98.0%), ethanol (≥99.5%), alumina (0.3 µm) (≥99.0%), potassium phosphate monobasic (≥99.0%) and sodium phosphate dibasic (≥99.0%) were obtained from Sigma-Aldrich (São Paulo, Brazil).

2.3. Synthesis of the Hydrochar

Wet spent coffee grounds (SCGs) were collected from Tim Hortons, Truro, Canada, and oven dried at 105 °C for 24 h. The dried SCGs and distilled water were mixed in a ratio of 1:8 and loaded into a 100 mL high-temperature/pressure reactor (Parr 4580, Moline, Il, USA). The reactor was tightly sealed and purged with pure N2 for 2–3 min to replace the air in it. Then, the vent was closed, and N2 was added to create an initial pressure of 20 bar. The reactor was then heated to 300 °C and held at this temperature for 60 min. When the reaction was completed, the reactor was cooled to room temperature, and the gaseous products were released into a fume hood, followed by transferring the solid–liquid mixture to a beaker. The solid product was separated from the mixture via vacuum separation and placed in an oven at 105 °C overnight, resulting in a dried solid product, namely hydrochar.

2.4. Synthesis of the Hydrochar and Copper Nanoparticle Composites

In a clean beaker, 20 mg of hydrochar was combined with 20 mL of pure ethanol. The mixture was placed in a benchtop ultrasonic bath for 30 min with sodium dodecyl sulfate in a 10:4 proportion. Next, 16 mg of sodium borohydride was added, and the suspension was again placed in the ultrasonic bath for 30 min. After this step, copper chloride (CuCl2) was introduced in a ratio of 30% (m/m) relative to hydrochar weight, then diluted in ethanol. In order to incorporate copper nanoparticles into the hydrochar’s structures, the CuCl2 solution was added while continuously stirred at a rate of one drop per second. Following this procedure, the solution was sonicated for 30 min and subsequently centrifuged for an additional 5 min, with the aim of separating suspended particles. After separation, the material underwent a cleaning process using ethanol.
Before utilizing the composite to modify the electrodes, the suspension was placed in a tip sonicator for 10 min to achieve a uniform solution.

2.5. Electrode Preparation

Firstly, the surface of the glassy carbon (GC) electrodes was polished with polystyrene with silicon carbide sandpaper and a 0.5 μmol L−1 aqueous alumina suspension until a mirrored surface was obtained. After this step, they were placed in a beaker with ethanol and put in an ultrasonic bath for 5 min, and then this same process was conducted in ultrapure water. After being polished, cleaned and dried at room temperature, the GC electrodes were modified by drop casting 10 μL of composite suspension (HDC-CuNPs or HDC) on their surfaces. Lastly, they were dried at 60 °C in an oven and taken out for the electrochemical procedures.

2.6. Sample Preparation and Analysis of HCS and BPA in Natural Water

Natural water samples were collected at Municipal Park in Botucatu, São Paulo, Brazil. Then, 1 mL of the collected sample without any treatment was added to an electrochemical cell with 19 mL of 0.2 mol L−1 of phosphate buffer solution (PBS) at a pH of 6.0. In order to simulate contamination with HCS and BPA, the standard solution of these compounds was combined with the voltammetric cell previously prepared. The quantitative analysis of HCS and BPA was performed simultaneously using a standard addition method, which consisted of adding 2.5 µmol L−1 of each contaminant to the stock solution and three successive aliquots of these standard solutions (three additions of 0.5 µmol L−1 of each analyte successively).

3. Results

3.1. Morphological and Electrochemical Characterization of the Nanocomposites

The HDC and HDC-CuNPs were morphologically characterized by using scanning electron microscopy (SEM) in order to analyze the microstructural changes. As shown in Figure 1A, the HDC material exhibits porous, rough and irregular surface morphology, having a honeycomb-like structure with microstructural fragmentation [33,34]. Hydrochars are generally amorphous materials with a low degree of crystallinity [35]. Furthermore, pore formation on its surface is related to reaction time and temperature, and high temperatures are expected to cause an expansion of pores [33]. In addition, these pores’ features can be useful for other applications, such as the removal of contaminants [33,34]. Figure 1B shows the HDC-CuNPs nanocomposite. Copper nanoparticles can be observed on the HDC surfaces, with diameters between 29 and 98 nm (Figure 1C), providing evidence of the material’s modification. An EDS spectrum was used to confirm the presence of Cu in the material, and as can be seen, this element was incorporated into the hydrochar.
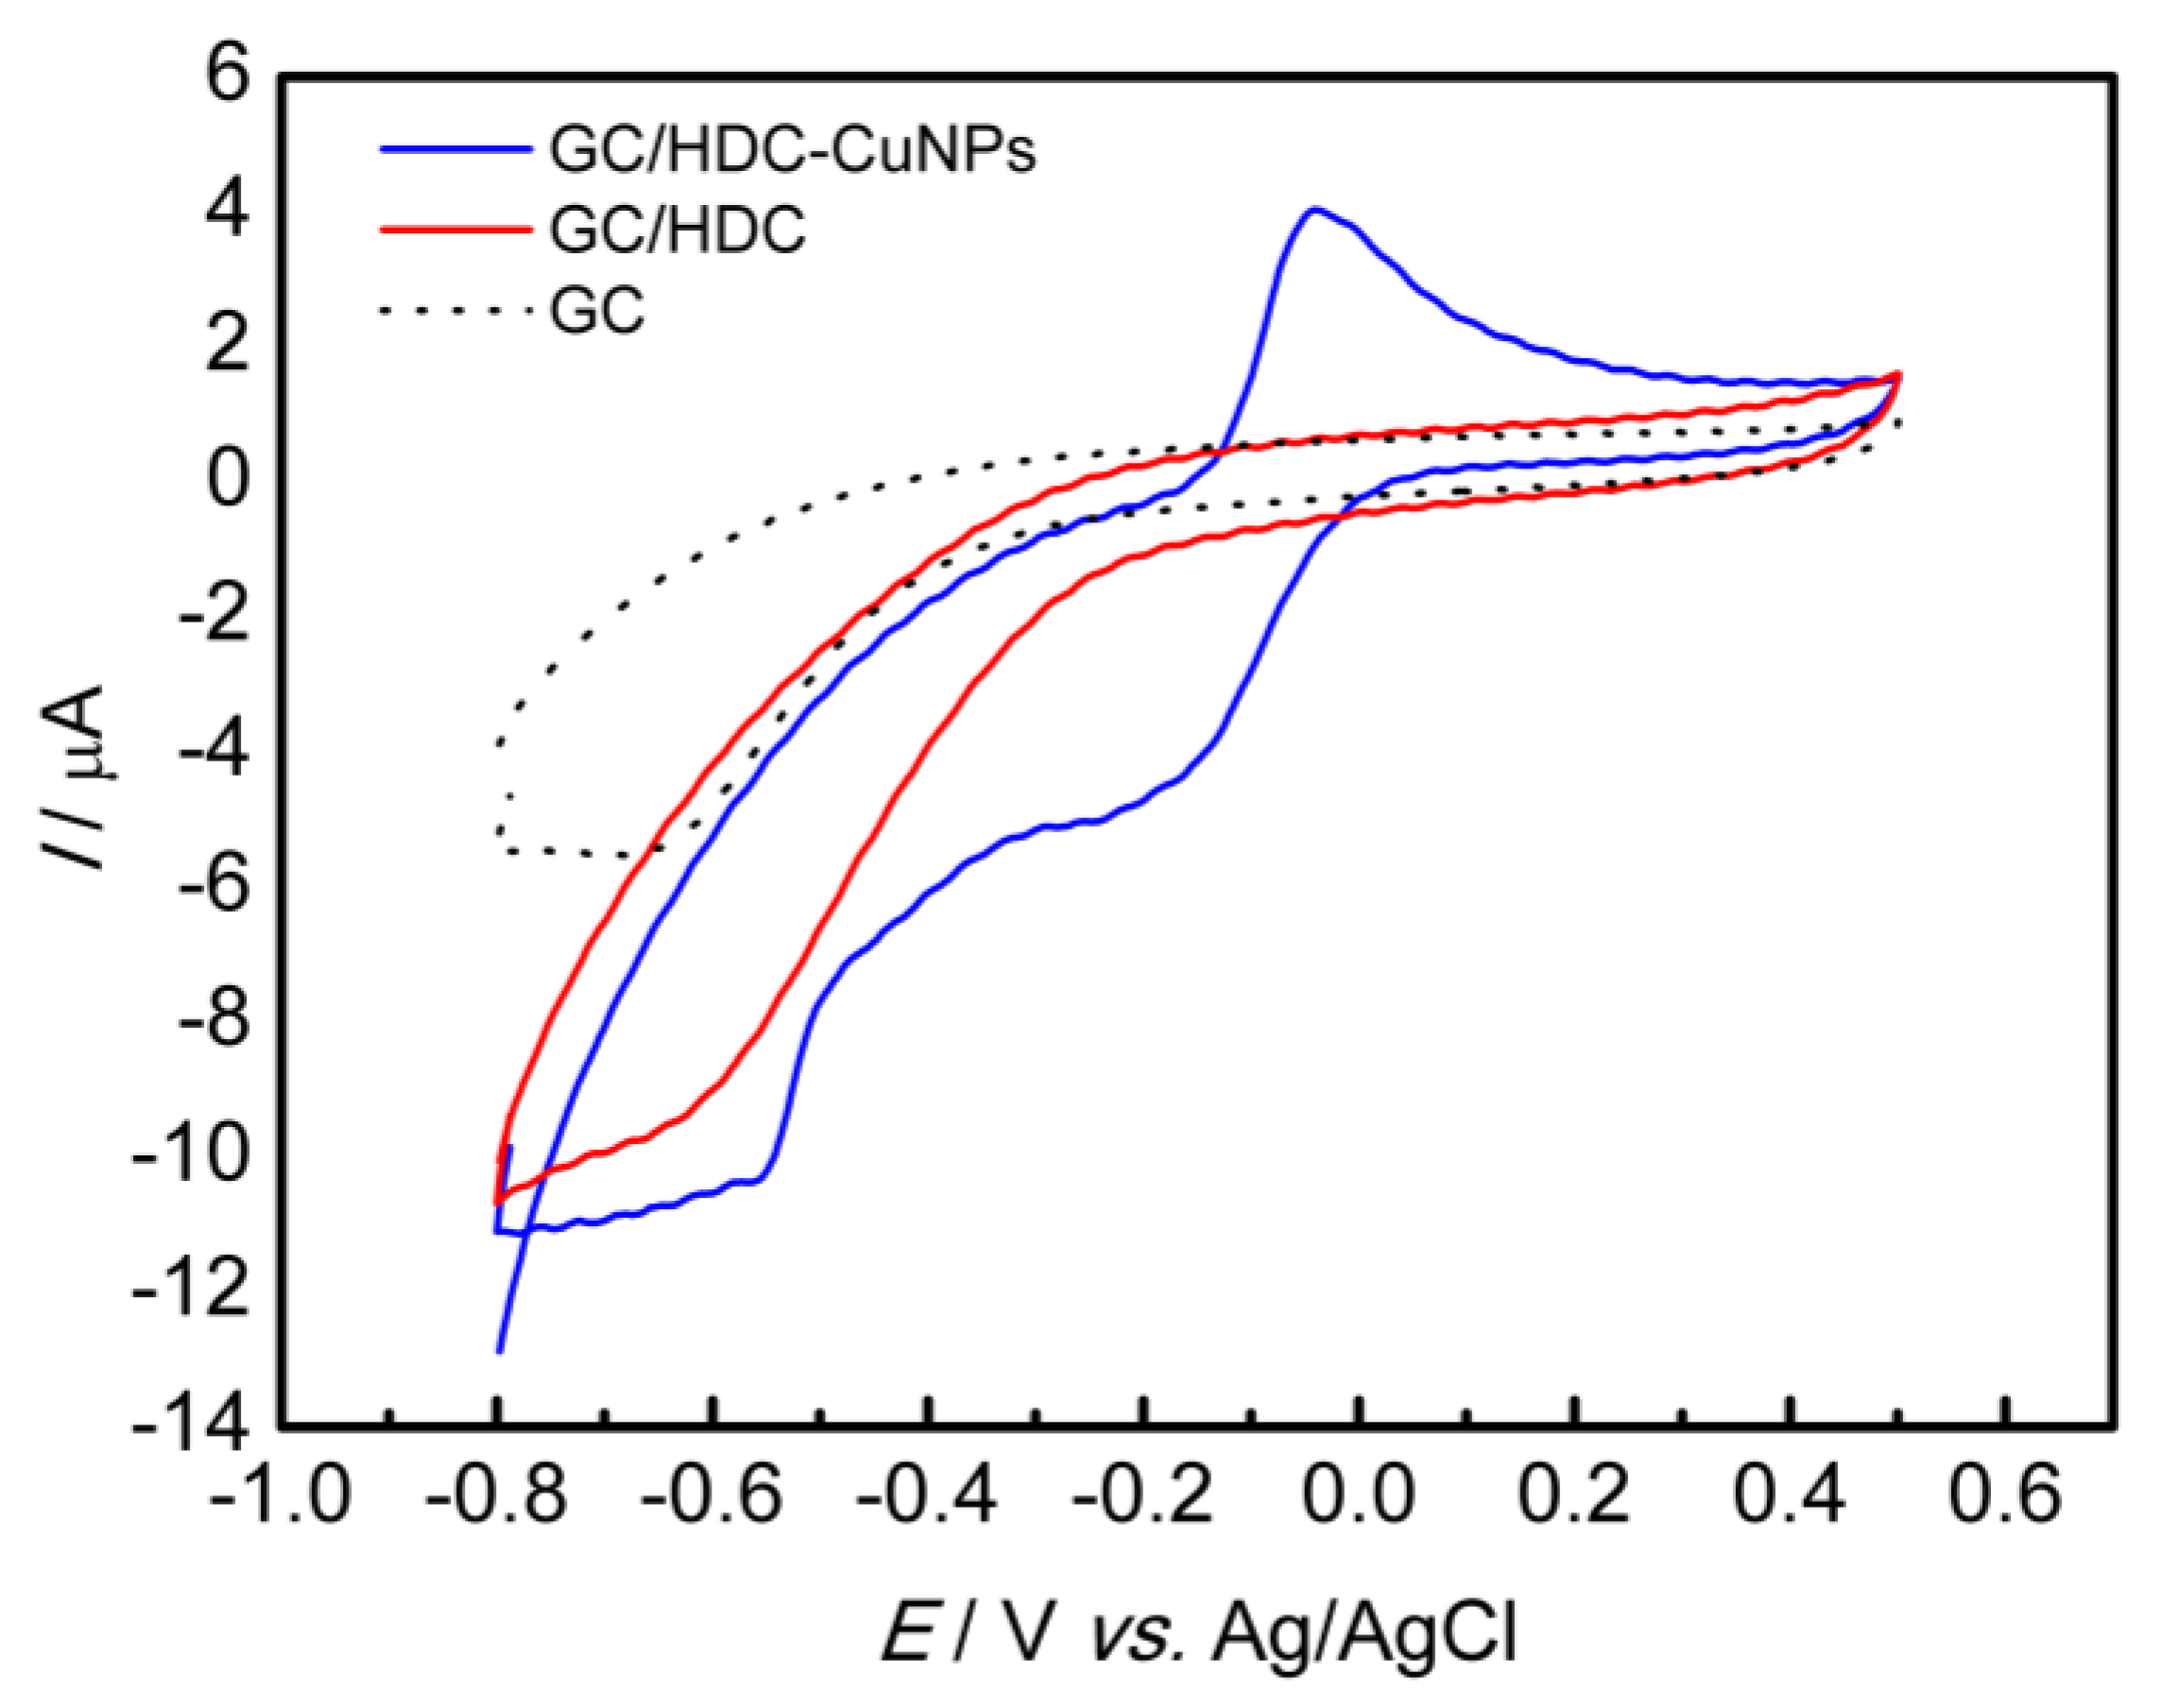
The electrochemical analysis of the GC/HDC-CuNPs electrode was conducted using cyclic voltammetry (CV) in a buffered solution of 0.2 mol L−1 of PBS with a pH of 7.0. The scan rate was 50 mV s−1, and the potential was in the range of 0.5 V to −0.8 V (Figure 2). In the cyclic voltammogram of the GC/HDC-CuNPs electrode, one can observe oxidation-reduction reactions, which are marked by defined peaks. These peaks align with the oxidation (Cu0 to Cu2+) and reduction (Cu2+ to Cu0) reactions of the copper, thus affirming the integration of nanoparticles into the material. The detected peaks in this experiment are in line with findings reported in prior published research [9].

3.2. Evaluation of Different Working Electrodes in Presence of a Redox Probe

CV with a scan rate of 50 mV s−1 in a 5.0 × 10⁻³ mol L−1 ferricyanide/ferrocyanide redox probe and 0.2 mol L−1 of PBS with a pH of 7.4 was performed to study the GC/HDC-CuNPs electrode’s synergetic effect compared with the GC/HDC electrode without modification with nanoparticles and the GC electrode without any modification. The nanocomposite efficiency regarding conductivity was evaluated, and, as can be seen in Figure 3, the GC/HDC-CuNPs working electrode showed the highest peak currents and reversibility of the system compared to the other electrodes used in this experiment. Therefore, the incorporation of copper nanoparticles into the HDC provided a better electrochemical response, as can be seen from the values of currents and peak potentials shown in Table 1, and was applied to subsequent experiments.

3.3. Electrochemical Oxidation of the HCS and BPA on the Nanocomposite

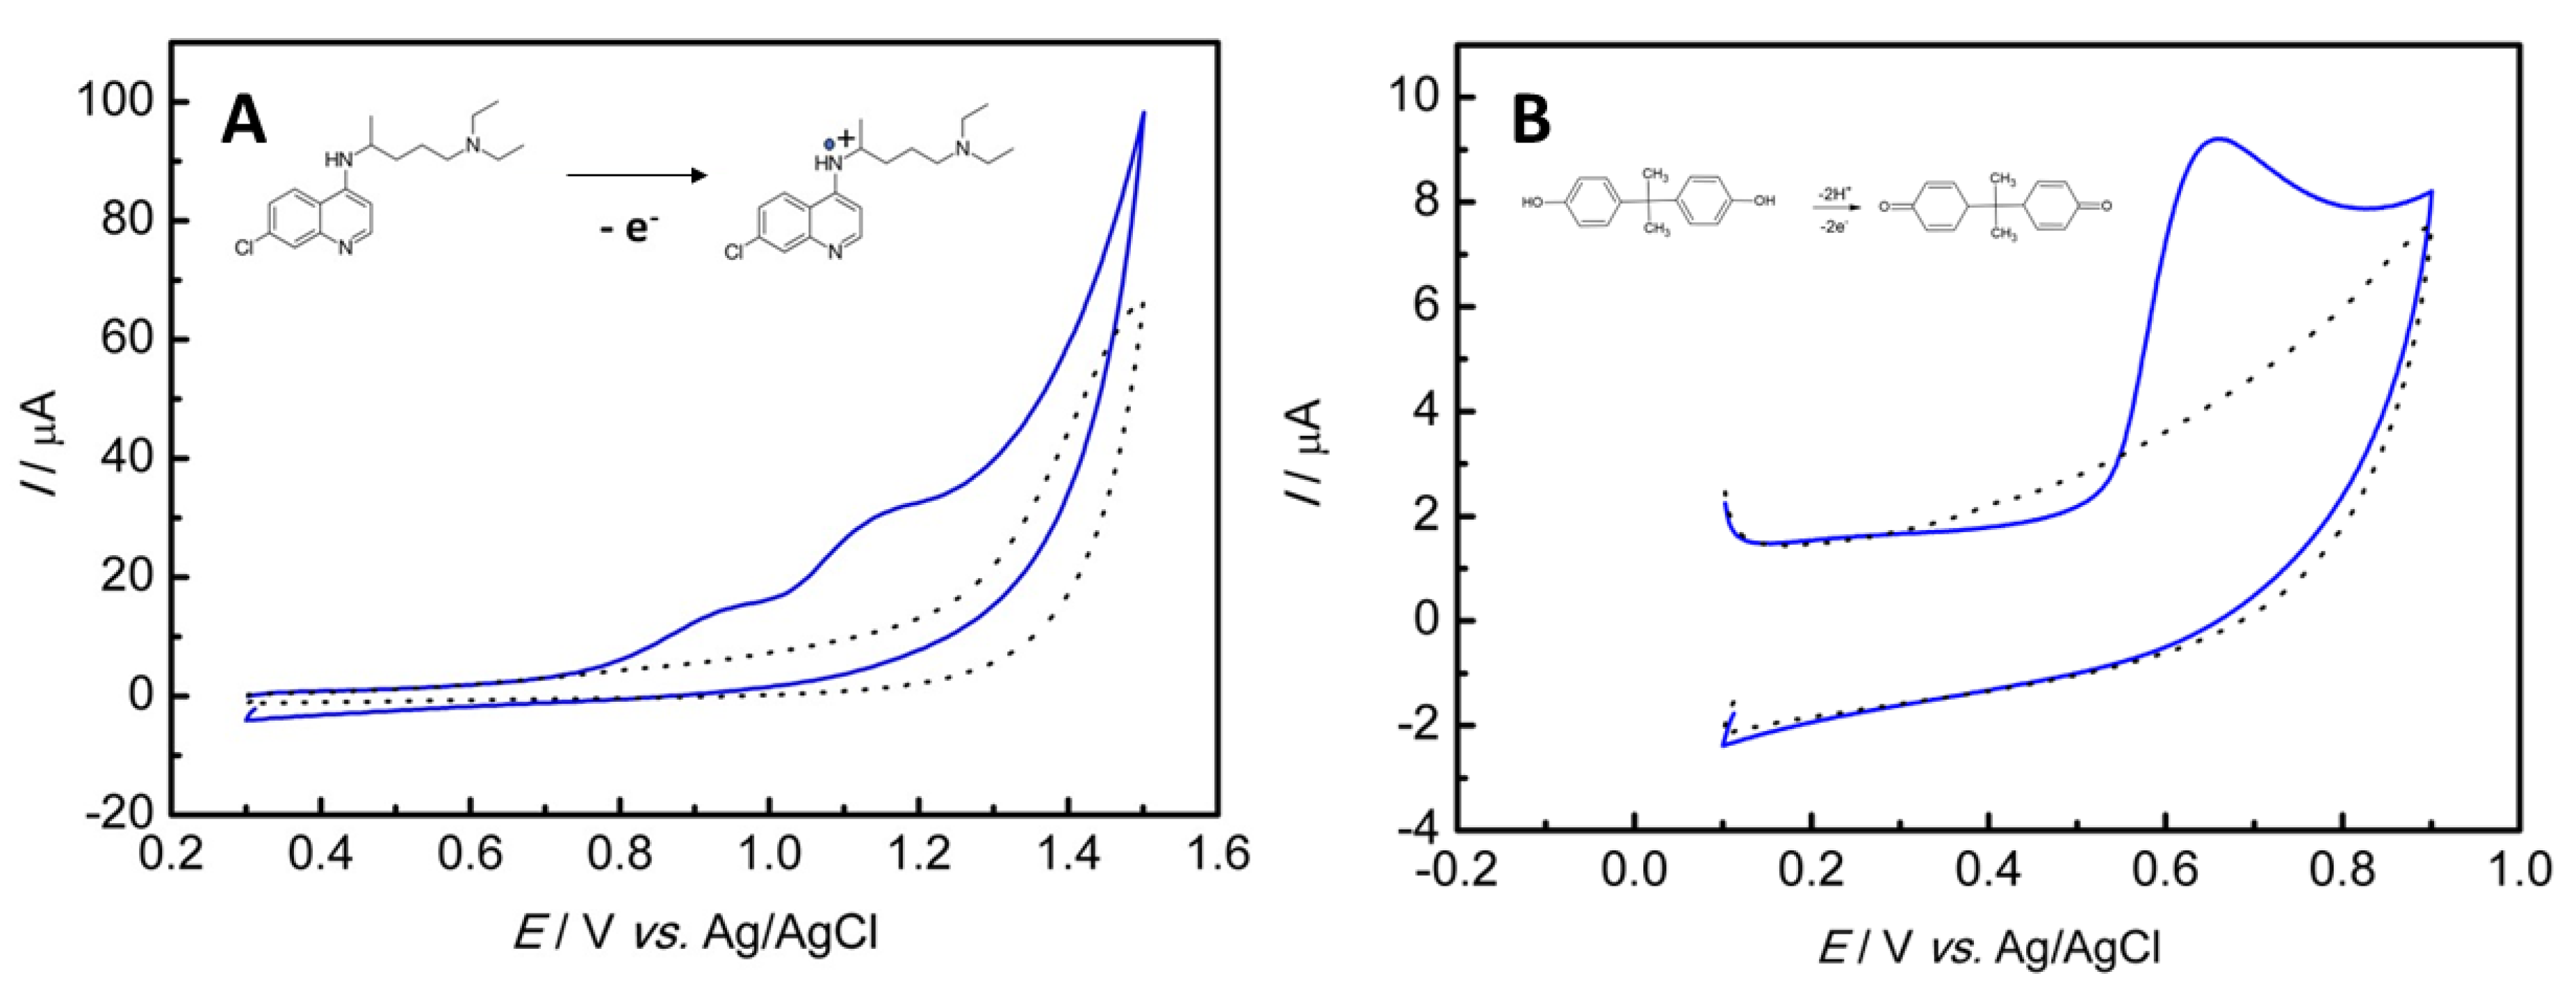
The electrochemical oxidation of HCS and BPA on the GC/HDC-CuNPs electrode was conducted in 0.2 mol L−1 of PBS with a pH of 7.0 using CV with a scan rate of 50 mV s−1. In Figure 4A, no oxidation processes (dotted line) can be observed in the absence of HCS. However, after the introduction of 100 μmol L−1 of HCS, two peaks appear [9]: an anodic peak at +0.93 V vs. Ag/AgCl and another at +1.14 V vs. Ag/AgCl. This oxidation is related to the N-heterocyclic nitrogen of the aminoquinoline portion and the nitrogen of the alkylaminoside group [9]. It is important to note that for a more precise analytical interpretation of the anodic peaks, it is advisable to use the second peak, as it is more prominent and therefore provides greater definition.
As for BPA (Figure 4B), the curve exhibits an oxidation peak at +0.64 V versus Ag/AgCl. The oxidation mechanism involves two protons and two electrons [36]. However, the absence of reduction peaks during the cathodic potential scan for BPA indicates an irreversible oxidation reaction.

3.4. Optimization of Parameters

Some electrochemical parameters were optimized for the voltammetry analysis of HCS and BPA according to Table 2.
In order to optimize the oxidation process of HCS, firstly, the concentrations of HDC-CuNPs composite were investigated using square-wave voltammetry (SWV), with 0.2 mol L−1 of PBS at a pH of 7.0, a scan rate of 125 mVs−1, an amplitude of 20 mV and a potential range from +0.7 to +1.5 V. The different concentrations of this composite were evaluated due to the fact that it has been reported in the literature that the concentrations of composite on the electrode surfaces interfere with the sensitivity of the sensor in the analysis of molecules and a large amount of the modifier material can block blinding sites [4]. Therefore, as can be seen in Table 2, the best concentration used for the electrode modification was 1.00 mg/mL of HDC-CuNPs.
Copper ratios of 20% to 40% CuCl2 were evaluated in relation to the HDC used to produce the HDC-CuNPs composites. The 40% ratio was the one that showed the better results, so it was used for the subsequent experiments.
After obtaining the optimum concentration of the composite as well as the copper ratios, the dependence of the peak current of the HCS at different pHs was analyzed using SWV with PBS of a varying pH from 5.0 to 9.0, a scan rate of 125 mVs−1, an amplitude of 20 mV and a frequency of 25 Hz. As can be observed in Table 2, the best pH used to analyze the HCS was 5.0, with the highest anodic peak current obtained. Then, this pH was adopted for the following analysis.
The influence of SWV parameters was also investigated. The original configuration of SWV used for the analysis was a step potential of 0.005 V, an amplitude of 0.02 V, a frequency of 25 Hz and a scan rate of 125 mVs−1. Initially, the frequency was varied from 20 to 45 Hz while maintaining the original values of the other parameters. The best result was observed at 40 Hz. Then, the amplitude was varied from 0.01 to 0.05 V, while keeping the other parameters constant; the best result was obtained at 0.05 V. The same procedure was conducted to find the best step potential, which ranged from 0.001 to 0.007 V, giving the best result at 0.007 V.
All the procedures described for the optimization of the HCS analysis were also carried out to optimize the oxidation process of BPA. Then, as can be seen in Table 2, the best conditions were found to be 1.00 mg/mL of HDC-CuNPs; a copper ratio of 40%; a pH of 6.0; a frequency of 40 Hz; a modulation amplitude of 0.05 V; and a step potential of 0.007 V.

3.5. Analytical Characteristics

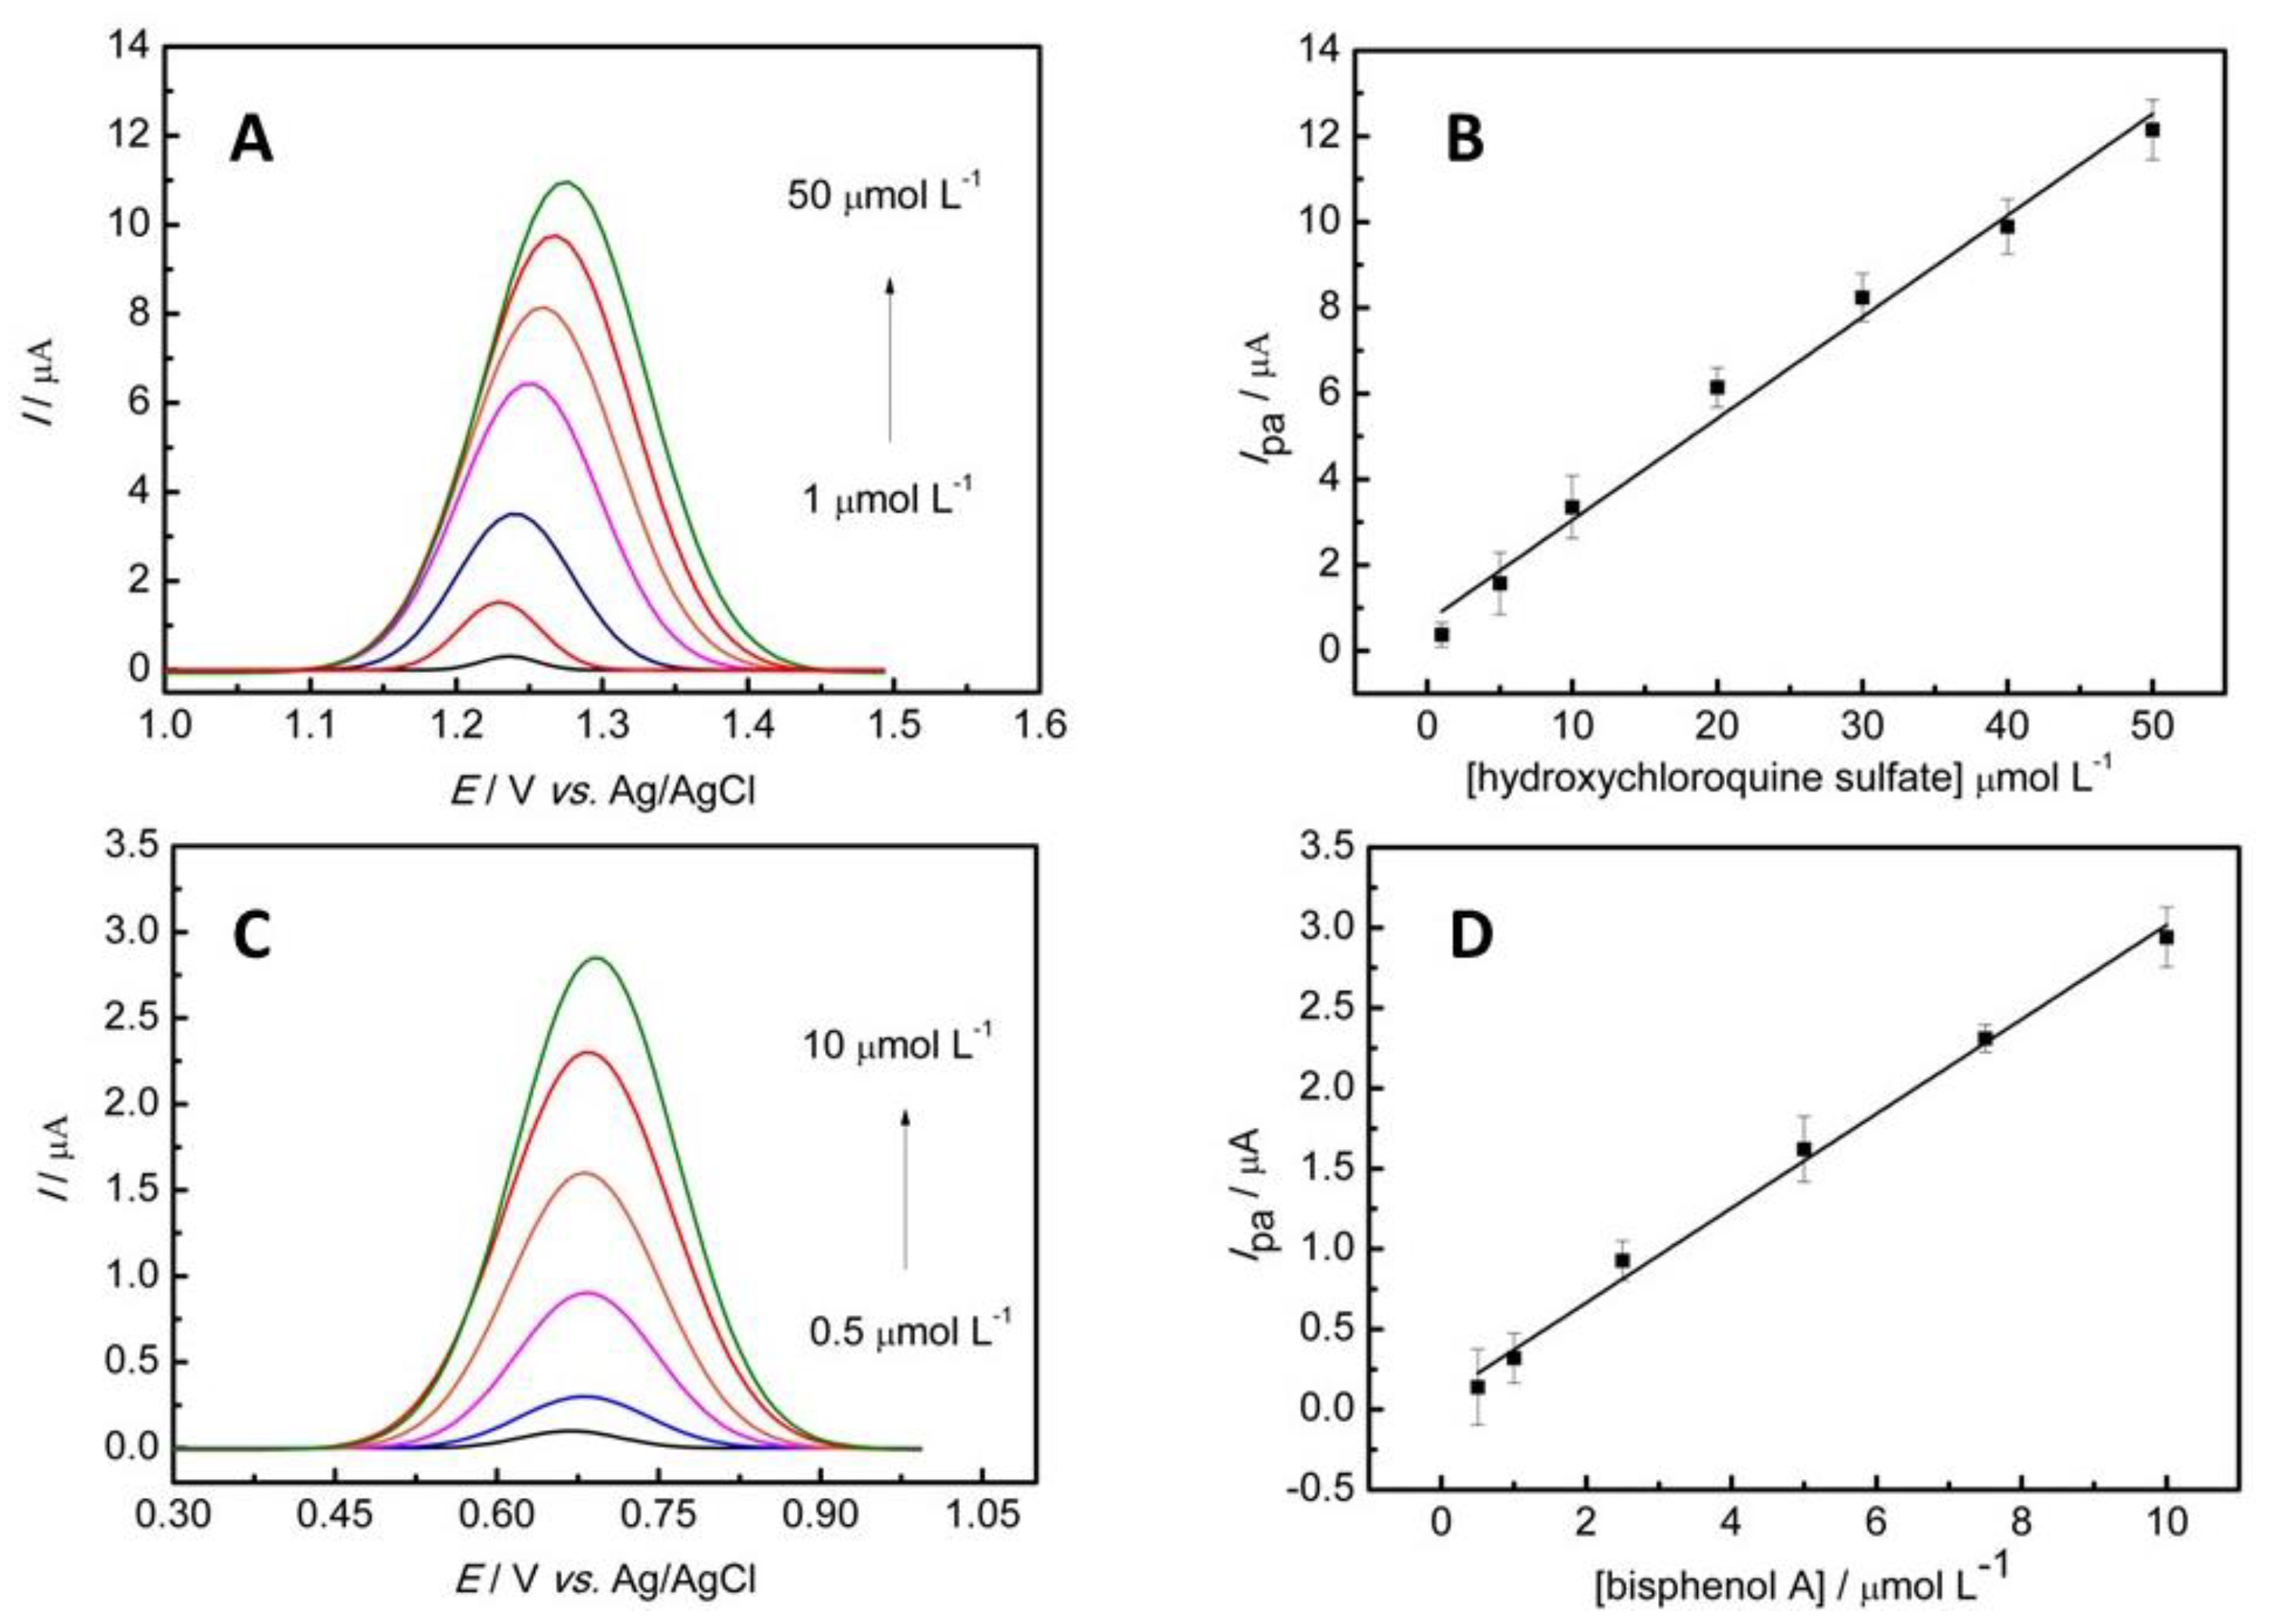
The linearity intervals, limit of detection and quantification were obtained by plotting an analytical curve. SWV was applied with the optimized parameters described in Table 2. The anodic peak currents were plotted with the respective concentration of HCS and BPA. Figure 5 is a graph presenting a linear range between a concentration of 1.0 and 50.0 μmol L−1 of HCS (Figure 5A,B) and 0.5 and 10.0 μmol L−1 of BPA (Figure 5C,D) following the equations:
Ipa (µA) = 0.7 ± 0.2 (µA) + 0.24 ± 0.01 (µA/µmol L−1) × Chydroxychloroquine sulfate (µmol L−1)
Ipa (µA) = 0.08 ± 0.02 (µA) + 0.30 ± 0.01 (µA/µmol L−1) × Cbisphenol A (μmol L−1)
Equations (1) and (2) present a coefficient of determination (R2) of 0.983 and 0.993, respectively. Limits of detection and quantification of 0.46 and 1.53 μmol L−1, respectively, for HCS were obtained, and 0.31 μmol L−1 and 1.06 μmol L−1, respectively, for BPA were calculated. The calculations were made following the recommendations of IUPAC, using a 3σ/slope ratio and a 10σ/slope ratio for the detection and quantification limits, where σ is the standard deviation of the mean value for 10 voltammograms of the blank. To perform a repeatability test, the electrochemical measurements with HCS and BPA were performed though 10 measurements via SWV with 10 µmol L−1 of each contaminant separately, obtaining a value of 3.9% and 8.3% for HCS and BPA, respectively. A reproducibility test was also carried out with HCS and BPA. It was performed in triplicate with three different modified electrodes, obtaining a value of 7.9% for HCS and 9.6% for BPA.
The electrochemical sensor developed for the determination of HCS obtained a wide linear range when compared with other sensors used to determine antimalarial drugs (Table 3) [37,38,39,40]. This characteristic is important because it is useful for the analysis of a large range of concentration values. Besides the linear range, the LOD was lower than an electrochemical sensor produced with a highly regarded material such as carbon nanotubes [38]. Another advantage that can be pointed out in relation to other sensors is the use of renewable and less toxic materials, such as a hydrochar produced from spent coffee grounds and copper nanoparticles. The HDC-CuNPs sensor is also cheaper than sensors produced with noble materials such as gold [39] and doped diamond [40]. In relation to BPA (Table 4), the sensor presented a lower LOD than many sensors reported in the literature [41,42,43,44], even those produced with more recognized and noble materials such as carbon nanotubes, graphene and silver [42,43]. The linear range was not as wide as some works [42,43], but it was similar to others [41,44] and could determine a good range of concentrations.

3.6. Simultaneous Determination of HCS and BPA in Natural Water

The GC/HDC-CuNPs electrode was applied for the quantification of hydroxychloroquine sulfate and bisphenol A simultaneously in the natural water samples. The quantification was performed in triplicate using the standard addition method. The Section 2.6 describes the preparation of the samples and the electrochemical cell. Three additions of a known concentration of HCS and BPA (0.5, 1.0 and 1.5 μmol L−1) were applied to 2.5 μmol L−1 of each contaminant. The SWV voltammograms obtained for the study are presented in Figure 6. The results for the detection of HCS and BPA are listed in Table 5. The HCS had a mean concentration of 2.53 ± 0.12 μmol L−1 and recoveries between 94.8% and 106.8%, while the BPA had a mean concentration of 2.57 ± 0.06 μmol L−1 and recoveries between 99.6% and 105.2%. The results demonstrate that the GC/HDC-CuNPs electrode could be a great alternative for the determination of emerging contaminants such as HCS and BPA in natural waters in terms of its sustainability, price, low toxicity and efficiency.

3.7. Simultaneous Determination of HCS and BPA in Natural Water in the Presence of Other Analytes

The influence of some inorganic and organic contaminants on the anodic peak of the hydrochar-based sensor in the presence of HCS and BPA was studied. Mercury and copper are heavy metals known for their toxicity even at low concentrations, and they are usually found in water matrices [45,46]. In addition, these heavy metals can form complexes with organic ligands present in the water that can interfere in the analysis of the studied molecules [47,48,49,50]. Methomyl is a carbamate pesticide, and depending on its concentration, it can be mortal to mammals [51]. Therefore, these contaminants were used to study their interference in the simultaneous determination of HCS and BPA in natural water. An electrochemical cell was prepared according to Section 2.6, and then, after the blank, the visualization of the anodic peak of 2.0 µmol L−1 of HCS and BPA was performed. Concentrations of 1.0, 2.0 and 4.0 µmol L−1 of the interferents were added to the electrochemical cell, and the anodic peak was analyzed. The results can be seen in Table 6. All contaminants (in addition to natural water components) interfered by increasing the HCS signal, but it was not by more than 10% of the original signal, even in the highest concentration of the contaminants added. In relation to BPA, the interferents reduced its signal, but in all the cases studied, more than 82% of the signal was recovered. In this work, it was observed that BPA tends to adsorb on the working electrode, and this characteristic may also be the reason for a lower signal recovery after many measurements.

4. Conclusions

A glassy carbon electrode was modified with a spent coffee grounds hydrochar and copper nanoparticles for the simultaneous determination of hydroxychloroquine sulfate and bisphenol A. The nanocomposite was characterized using scanning electron microscopy, EDS and cyclic voltammetry, which indicated the morphology and the modification into the hydrochar.
The parameters were optimized in order to generate a better response in the determination of the analytes, improving the sensitivity of the study. The LOD and LOQ obtained were 0.46 and 1.53 μmol L−1 for the HCS and 0.31 μmol L−1 and 1.06 μmol L−1 for the BPA, respectively, with a linear range from 1.0 to 50.0 μmol L−1 for HCS and from 0.5 to 10.0 μmol L−1 for BPA.
A GC/HDC-CuNPs sensor was applied in the simultaneous determination of HCS and BPA in natural water samples, with recoveries between 94.8% and 106.8% for HCS and 99.6% and 105.2% for BPA. Finally, a study with interferents was carried out using natural water with organic and inorganic contaminants. The use of a hydrochar-based sensor was demonstrated to be a good alternative for monitoring the levels of emerging contaminants using a sustainable and cheap material.

Author Contributions

Conceptualization, F.C.B., Q.H. and I.C.; methodology, F.C.B., E.Y.I., N.K.M., L.D.E.S., J.Y. and Q.H.; investigation, F.C.B., E.Y.I., N.K.M., L.D.E.S. and J.Y.; writing—original draft preparation, F.C.B., E.Y.I., N.K.M., L.D.E.S. and Q.H.; writing—review and editing, I.C. and J.Y.; supervision, I.C.; project administration, I.C.; funding acquisition, Q.H. and I.C. All authors have read and agreed to the published version of the manuscript.

Funding

This research received funding from FAPESP (2022/03762-8 and 2022/03334-6) and from the National Sciences and Engineering Research Council Discovery, Canada (grant number NSERC ALLRP 571708-21).

Institutional Review Board Statement

Not applicable.

Informed Consent Statement

Not applicable.

Data Availability Statement

Data are available from the authors on reasonable request.

Conflicts of Interest

The authors declare no conflict of interest.

References

  1. Shahid, M.K.; Kashif, A.; Fuwad, A.; Choi, Y. Current Advances in Treatment Technologies for Removal of Emerging Contaminants from Water—A Critical Review. Coord. Chem. Rev. 2021, 442, 213993. [Google Scholar] [CrossRef]
  2. Montagner, C.; Sodré, F.; Acayaba, R.; Vidal, C.; Campestrini, I.; Locatelli, M.; Pescara, I.; Albuquerque, A.; Umbuzeiro, G.; Jardim, W. Ten Years-Snapshot of the Occurrence of Emerging Contaminants in Drinking, Surface and Ground Waters and Wastewaters from São Paulo State, Brazil. J. Braz. Chem. Soc. 2018, 30, 614–632. [Google Scholar] [CrossRef]
  3. Cheng, N.; Wang, B.; Wu, P.; Lee, X.; Xing, Y.; Chen, M.; Gao, B. Adsorption of Emerging Contaminants from Water and Wastewater by Modified Biochar: A Review. Environ. Pollut. 2021, 273, 116448. [Google Scholar] [CrossRef] [PubMed]
  4. He, Q.G.; Huang, C.Y.; Chang, H.; Nie, L.B. Progress in Recycling of Plastic Packaging Wastes. Adv. Mater. Res. 2013, 660, 90–96. [Google Scholar] [CrossRef]
  5. Romanó de Orte, M.; Clowez, S.; Caldeira, K. Response of Bleached and Symbiotic Sea Anemones to Plastic Microfiber Exposure. Environ. Pollut. 2019, 249, 512–517. [Google Scholar] [CrossRef]
  6. Turra, A.; Manzano, A.B.; Dias, R.J.S.; Mahiques, M.M.; Barbosa, L.; Balthazar-Silva, D.; Moreira, F.T. Three-Dimensional Distribution of Plastic Pellets in Sandy Beaches: Shifting Paradigms. Sci. Rep. 2014, 4, 4435. [Google Scholar] [CrossRef]
  7. Kim, H.; Ji, K. Effects of Tetramethyl Bisphenol F on Thyroid and Growth Hormone-Related Endocrine Systems in Zebrafish Larvae. Ecotoxicol. Environ. Saf. 2022, 237, 113516. [Google Scholar] [CrossRef]
  8. Hu, S.; Fang, S.; Zhao, J.; Wang, G.; Qi, W.; Zhang, G.; Huang, C.; Qu, J.; Liu, H. Toxicity Evaluation and Effect-Based Identification of Chlorine Disinfection Products of the Anti-COVID-19 Drug Chloroquine Phosphate. Environ. Sci. Technol. 2023, 57, 7913–7923. [Google Scholar] [CrossRef]
  9. Barreto, F.C.; da Silva, M.K.L.; Cesarino, I. Copper Nanoparticles and Reduced Graphene Oxide as an Electrode Modifier for the Development of an Electrochemical Sensing Platform for Chloroquine Phosphate Determination. Nanomaterials 2023, 13, 1436. [Google Scholar] [CrossRef]
  10. Ballesteros-Gómez, A.; Rubio, S.; Pérez-Bendito, D. Analytical Methods for the Determination of Bisphenol A in Food. J. Chromatogr. A 2009, 1216, 449–469. [Google Scholar] [CrossRef]
  11. Ragavan, K.V.; Rastogi, N.K.; Thakur, M.S. Sensors and Biosensors for Analysis of Bisphenol-A. TrAC Trends Anal. Chem. 2013, 52, 248–260. [Google Scholar] [CrossRef]
  12. Galli, A.; De Souza, D.; Garbellini, G.S.; Coutinho, C.F.B.; Mazo, L.H.; Avaca, L.A.; Machado, S.A.S. Utilização de técnicas eletroanalíticas na determinação de pesticidas em alimentos. Quím. Nova 2006, 29, 105–112. [Google Scholar] [CrossRef]
  13. Rahman, M.M.; Ahmed, J.; Asiri, A.M.; Alfaifi, S.Y. Ultra-Sensitive, Selective and Rapid Carcinogenic Bisphenol A Contaminant Determination Using Low-Dimensional Facile Binary Mg-SnO2 Doped Microcube by Potential Electro-Analytical Technique for the Safety of Environment. J. Ind. Eng. Chem. 2022, 109, 147–154. [Google Scholar] [CrossRef]
  14. Thevenot, D.R.; Toth, K.; Durst, R.A.; Wilson, G.S. Electrochemical Biosensors: Recommended Definitions and Classification. Biosens. Bioelectron. 2001, 16, 121–131. [Google Scholar] [CrossRef] [PubMed]
  15. Yin, H.; Zhou, Y.; Ai, S.; Han, R.; Tang, T.; Zhu, L. Electrochemical Behavior of Bisphenol A at Glassy Carbon Electrode Modified with Gold Nanoparticles, Silk Fibroin, and PAMAM Dendrimers. Microchim. Acta 2010, 170, 99–105. [Google Scholar] [CrossRef]
  16. Yang, J.; Zhao, Z.; Hu, Y.; Lord, A.; Cesarino, I.; Goonetilleke, A.; He, Q. Exploring the Properties and Potential Uses of Biocarbon from Spent Coffee Grounds: A Comparative Look at Dry and Wet Processing Methods. Processes 2023, 11, 2099. [Google Scholar] [CrossRef]
  17. Santos Santana, M.; Pereira Alves, R.; da Silva Borges, W.M.; Francisquini, E.; Guerreiro, M.C. Hydrochar Production from Defective Coffee Beans by Hydrothermal Carbonization. Bioresour. Technol. 2020, 300, 122653. [Google Scholar] [CrossRef]
  18. Masoumi, S.; Borugadda, V.B.; Nanda, S.; Dalai, A.K. Hydrochar: A Review on Its Production Technologies and Applications. Catalysts 2021, 11, 939. [Google Scholar] [CrossRef]
  19. Cao, X.; Sun, S.; Sun, R. Application of Biochar-Based Catalysts in Biomass Upgrading: A Review. RSC Adv. 2017, 7, 48793–48805. [Google Scholar] [CrossRef]
  20. Diaz, E.; Sanchis, I.; Coronella, C.J.; Mohedano, A.F. Activated Carbons from Hydrothermal Carbonization and Chemical Activation of Olive Stones: Application in Sulfamethoxazole Adsorption. Resources 2022, 11, 43. [Google Scholar] [CrossRef]
  21. Shen, R.; Lu, J.; Yao, Z.; Zhao, L.; Wu, Y. The Hydrochar Activation and Biocrude Upgrading from Hydrothermal Treatment of Lignocellulosic Biomass. Bioresour. Technol. 2021, 342, 125914. [Google Scholar] [CrossRef] [PubMed]
  22. Azzaz, A.A.; Khiari, B.; Jellali, S.; Ghimbeu, C.M.; Jeguirim, M. Hydrochars Production, Characterization and Application for Wastewater Treatment: A Review. Renew. Sustain. Energy Rev. 2020, 127, 109882. [Google Scholar] [CrossRef]
  23. Zhang, Y.; Wan, Y.; Zheng, Y.; Yang, Y.; Huang, J.; Chen, H.; Quan, G.; Gao, B. Potassium Permanganate Modification of Hydrochar Enhances Sorption of Pb(II), Cu(II), and Cd(II). Bioresour. Technol. 2023, 386, 129482. [Google Scholar] [CrossRef] [PubMed]
  24. Zhang, X.; Zhang, L.; Li, A. Hydrothermal Co-Carbonization of Sewage Sludge and Pinewood Sawdust for Nutrient-Rich Hydrochar Production: Synergistic Effects and Products Characterization. J. Environ. Manag. 2017, 201, 52–62. [Google Scholar] [CrossRef]
  25. Ahmad, S.; Zhu, X.; Wei, X.; Zhang, S. Characterization and Potential Applications of Hydrochars Derived from P- and N-Enriched Agricultural and Antibiotic Residues via Microwave-Assisted Hydrothermal Conversion. Energy Fuels 2020, 34, 11154–11164. [Google Scholar] [CrossRef]
  26. Wang, T.; Zhai, Y.; Zhu, Y.; Gan, X.; Zheng, L.; Peng, C.; Wang, B.; Li, C.; Zeng, G. Evaluation of the Clean Characteristics and Combustion Behavior of Hydrochar Derived from Food Waste towards Solid Biofuel Production. Bioresour. Technol. 2018, 266, 275–283. [Google Scholar] [CrossRef]
  27. Espro, C.; Satira, A.; Mauriello, F.; Anajafi, Z.; Moulaee, K.; Iannazzo, D.; Neri, G. Orange Peels-Derived Hydrochar for Chemical Sensing Applications. Sens. Actuators B Chem. 2021, 341, 130016. [Google Scholar] [CrossRef]
  28. Welch, C.M.; Compton, R.G. The Use of Nanoparticles in Electroanalysis: A Review. Anal. Bioanal. Chem. 2006, 384, 601–619. [Google Scholar] [CrossRef]
  29. Barreto, F.C.; Silva, M.K.L.; Cesarino, I. An Electrochemical Sensor Based on Reduced Graphene Oxide and Copper Nanoparticles for Monitoring Estriol Levels in Water Samples after Bioremediation. Chemosensors 2022, 10, 395. [Google Scholar] [CrossRef]
  30. Trindade, C.M.B.; Silva, M.K.L.; Cesarino, I. Copper Nanostructures Anchored on Renewable Carbon as Electrochemical Platform for the Detection of Dopamine, Fluoxetine and Escitalopram. Sens. Actuators Rep. 2022, 4, 100107. [Google Scholar] [CrossRef]
  31. Melaré, A.G.; Barreto, F.C.; Silva, M.K.L.; Simões, R.P.; Cesarino, I. Determination of Fluoxetine in Weight Loss Herbal Medicine Using an Electrochemical Sensor Based on RGO-CuNPs. Molecules 2023, 28, 6361. [Google Scholar] [CrossRef] [PubMed]
  32. Fernandes, V.Q.; Silva, M.K.L.; Cesarino, I. Determination of Isotretinoin (13-Cis-Retinoic Acid) Using a Sensor Based on Reduced Graphene Oxide Modified with Copper Nanoparticles. J. Electroanal. Chem. 2020, 856, 113692. [Google Scholar] [CrossRef]
  33. Venkatesan, S.; Baloch, H.A.; Jamro, I.A.; Rafique, N. Evaluation of the Production of Hydrochar from Spent Coffee Grounds under Different Operating Conditions. J. Water Process Eng. 2022, 49, 103037. [Google Scholar] [CrossRef]
  34. Afolabi, O.O.D.; Sohail, M.; Cheng, Y.-L. Optimisation and Characterisation of Hydrochar Production from Spent Coffee Grounds by Hydrothermal Carbonisation. Renew. Energy 2020, 147, 1380–1391. [Google Scholar] [CrossRef]
  35. Çalışkan, M.; Akay, S.; Kayan, B.; Baran, T.; Kalderis, D. Preparation and Application of a Hydrochar-Based Palladium Nanocatalyst for the Reduction of Nitroarenes. Molecules 2021, 26, 6859. [Google Scholar] [CrossRef]
  36. Ianesko, F.; Alves de Lima, C.; Antoniazzi, C.; Santana, E.R.; Piovesan, J.V.; Spinelli, A.; Galli, A.; Guimarães de Castro, E. Simultaneous Electrochemical Determination of Hydroquinone and Bisphenol A Using a Carbon Paste Electrode Modified with Silver Nanoparticles. Electroanalysis 2018, 30, 1946–1955. [Google Scholar] [CrossRef]
  37. Silva, M.K.L.; Sousa, G.S.; Simoes, R.P.; Cesarino, I. Fabrication of Paper-Based Analytical Devices Using a PLA 3D-Printed Stencil for Electrochemical Determination of Chloroquine and Escitalopram. J. Solid. State Electrochem. 2022, 26, 581–586. [Google Scholar] [CrossRef]
  38. Pushpanjali, P.A.; Manjunatha, J.G.; Hareesha, N.; Girish, T.; Al-Kahtani, A.A.; Tighezza, A.M.; Ataollahi, N. Electrocatalytic Determination of Hydroxychloroquine Using Sodium Dodecyl Sulphate Modified Carbon Nanotube Paste Electrode. Top. Catal. 2022. [Google Scholar] [CrossRef]
  39. George, J.M.; Mathew, B. Cyclodextrin-Mediated Gold Nanoparticles as Multisensing Probe for the Selective Detection of Hydroxychloroquine Drug. Korean J. Chem. Eng. 2021, 38, 624–634. [Google Scholar] [CrossRef]
  40. Deroco, P.B.; Vicentini, F.C.; Oliveira, G.G.; Rocha-Filho, R.C.; Fatibello-Filho, O. Square-Wave Voltammetric Determination of Hydroxychloroquine in Pharmaceutical and Synthetic Urine Samples Using a Cathodically Pretreated Boron-Doped Diamond Electrode. J. Electroanal. Chem. 2014, 719, 19–23. [Google Scholar] [CrossRef]
  41. Rajendran, J.; Kannan, T.S.; Dhanasekaran, L.S.; Murugan, P.; Atchudan, R.; ALOthman, Z.A.; Ouladsmane, M.; Sundramoorthy, A.K. Preparation of 2D Graphene/MXene Nanocomposite for the Electrochemical Determination of Hazardous Bisphenol A in Plastic Products. Chemosphere 2022, 287, 132106. [Google Scholar] [CrossRef]
  42. Wang, X.; Li, M.; Wu, M.; Shi, Y.; Yang, J.; Shan, J.; Liu, L. Simultaneous Determination of Bisphenol A and Bisphenol S Using Multi-Walled Carbon Nanotubes Modified Electrode. Int. J. Electrochem. Sci. 2018, 13, 11906–11922. [Google Scholar] [CrossRef]
  43. Li, Y.; Wang, H.; Yan, B.; Zhang, H. An Electrochemical Sensor for the Determination of Bisphenol A Using Glassy Carbon Electrode Modified with Reduced Graphene Oxide-Silver/Poly-l-Lysine Nanocomposites. J. Electroanal. Chem. 2017, 805, 39–46. [Google Scholar] [CrossRef]
  44. Özcan, L.; Altuntaş, M.; Büyüksağiş, A.; Türk, H.; Yurdakal, S. Electrochemical Determination of Bisphenol A with Pencil Graphite Electrodes Modified with Co(II), Ni(II), Cu(II) and Fe(II) Phthalocyaninetetrasulfonates. Anal. Sci. 2016, 32, 881–886. [Google Scholar] [CrossRef]
  45. Mirzaei Karazan, Z.; Roushani, M. Electrochemical Determination of Mercury Ions in Different Food Samples Using Glassy Carbon Electrode Modified with Poly (Crocin). Microchem. J. 2023, 195, 109402. [Google Scholar] [CrossRef]
  46. Song, X.; Zhong, H.; Li, X.; Yu, R.; Chen, M.; Liu, J.; Cheng, Z.; Qian, H. Noncovalent Assembly of Non-Metallic Porphyrin on Graphene Oxide Nanosheets and Its Application for Simultaneous Determination of Cu2+ and Pb2+ in Real Water. J. Electroanal. Chem. 2023, 946, 117748. [Google Scholar] [CrossRef]
  47. Ostroushko, A.A.; Russkikh, O.V. Oxide material synthesis by combustion of organic-inorganic compositions. Nanosyst. Phys. Chem. Math. 2017, 8, 476–502. [Google Scholar] [CrossRef]
  48. Fleischmann, M.; Pletcher, D.; Race, G.M. The Electrochemical Oxidation of The Mercury(II)-Propene Complex. Electroanal. Chem. Interfacial Electrochem. 1969, 23, 369–374. [Google Scholar] [CrossRef]
  49. Nestke, S.; Ronge, E.; Siewert, I. Electrochemical water oxidation using a copper complex. Dalton Trans. 2018, 47, 10737. [Google Scholar] [CrossRef]
  50. Bond, A.M.; Colton, R.; Hollenkamp, A.F.; Hoskins, B.F.; McGregor, K. Voltammetric, coulometric, mercury-199 NMR, and other studies characterizing new and unusual mercury complexes produced by electrochemical oxidation of mercury(II) diethyldithiocarbamate. Crystal and molecular structure of octakis(N,N-diethyldithiocarbamato)pentamercury(II) perchlorate. J. Am. Chem. Soc. 1987, 109, 1969–1980. [Google Scholar] [CrossRef]
  51. Costa, D.J.E.; Santos, J.C.S.; Sanches-Brandão, F.A.C.; Ribeiro, W.F.; Salazar-Banda, G.R.; Araujo, M.C.U. Boron-Doped Diamond Electrode Acting as a Voltammetric Sensor for the Detection of Methomyl Pesticide. J. Electroanal. Chem. 2017, 789, 100–107. [Google Scholar] [CrossRef]
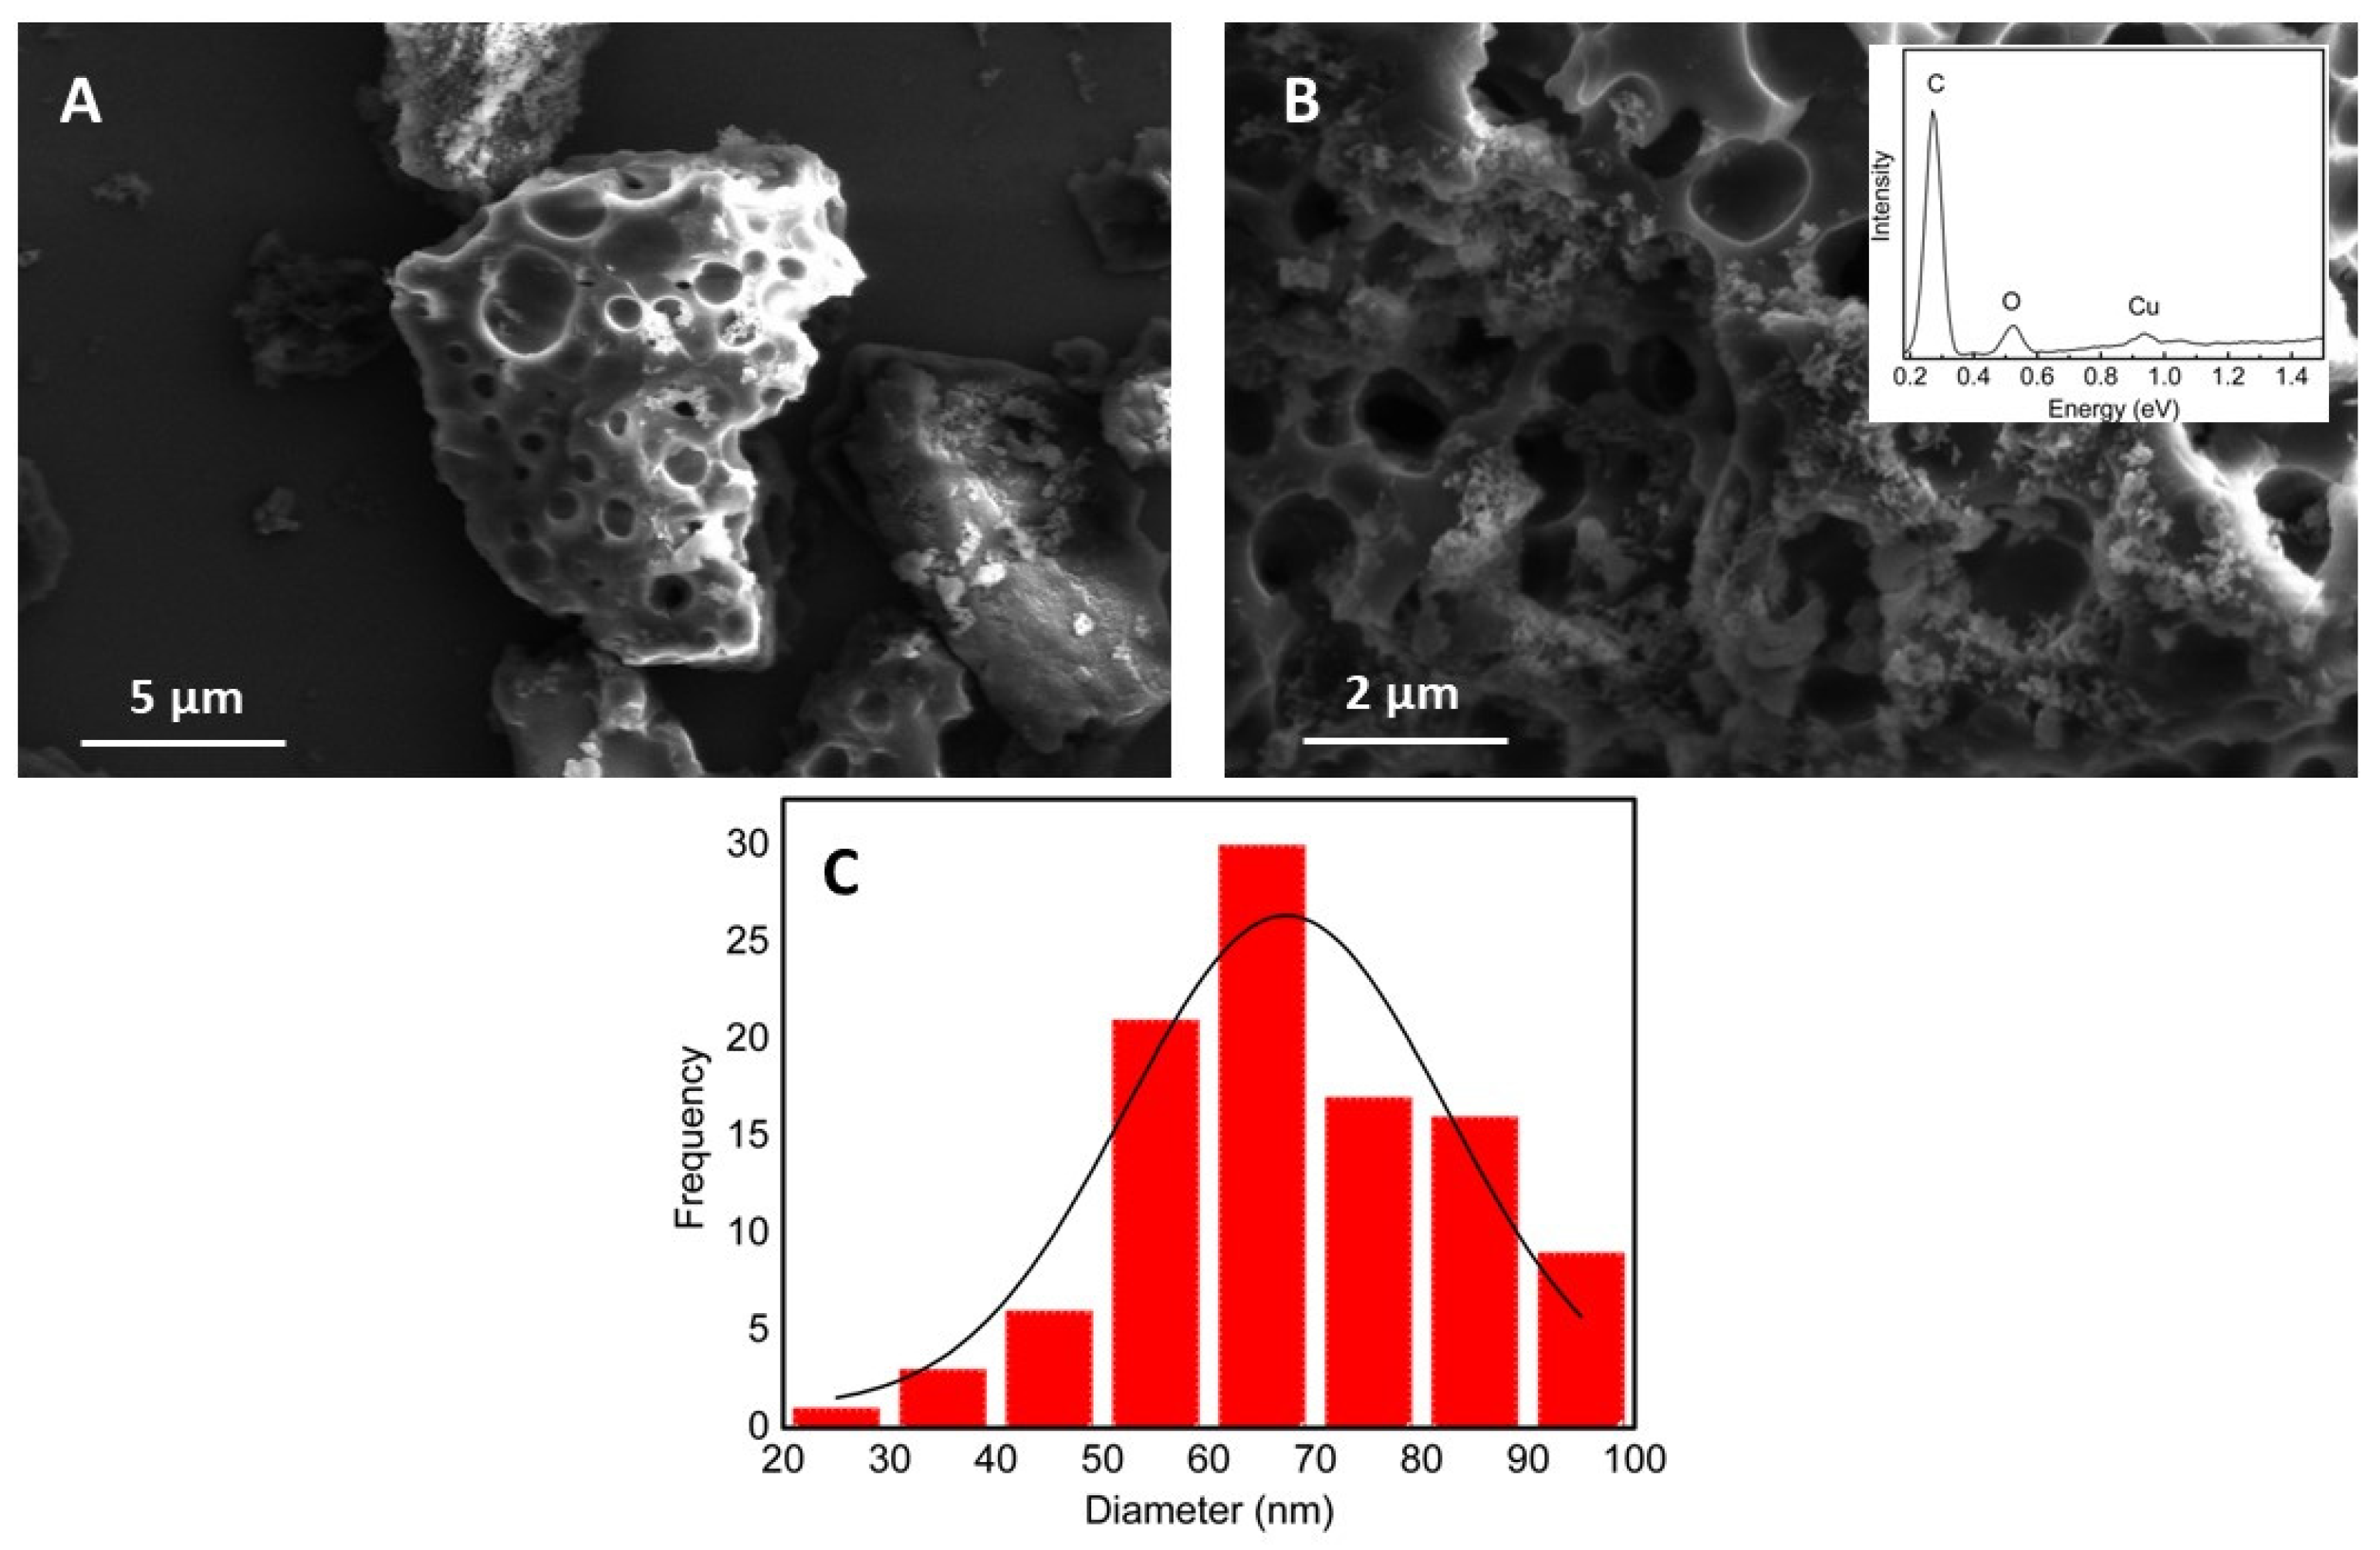
Figure 1. SEM images of (A) hydrochar (HDC); (B) hydrochar modified with copper nanoparticles (HDC-CuNPs) (inset: EDS spectrum) and (C) the diameters of the copper nanoparticles.
Chemosensors 11 00562 g001
Figure 2. Electrochemical characterization through CV with scan rate of 50 mV s−1 for the GC, GC/HDC and GC/HDC-CuNPs electrodes in 0.2 mol L−1 of PBS with a pH of 7.0.
Chemosensors 11 00562 g002
Figure 3. Evaluation of different working electrodes via CV with scan rate of 50 mV s−1 in 0.2 mol L−1 of PBS with a pH of 7.4, containing 5.0 × 10⁻³ mol L−1 potassium ferricyanide/ferrocyanide.
Chemosensors 11 00562 g003
Figure 4. (A) CV recorded in the presence of 100 μmol L−1 of HCS (blue line) and in the absence of HCS (dotted line) in 0.2 mol L−1 of PBS with a pH of 7.0 at a scan rate of 50 mV s−1 (inset: the mechanism of oxidation of the molecule). (B) CV recorded in the presence of 100 μmol L−1 of BPA (blue line) and in the absence of the BPA (dotted line) in 0.2 mol L−1 of PBS with a pH of 7.0 at scan rate of 50 mV s−1 (inset: mechanism of oxidation of the molecule).
Chemosensors 11 00562 g004
Figure 5. (A) SWV in 0.2 mol L−1 of PBS at a pH of 5.0 in the presence of HCS with a concentration varying from 1.0 to 50 μmol L−1. (B) Linear relationship of anodic peak currents as a function of HCS concentration. (C) SWV in 0.2 mol L−1 of PBS at a pH of 6.0 in the presence of BPA with a concentration varying from 0.5 to 10 μmol L−1. (D) Linear relationship of anodic peak currents as a function of BPA concentration.
Chemosensors 11 00562 g005
Figure 6. SWV carried out in 0.2 mol L−1 of PBS at a pH of 6.0 with the sample (red line) (2.5 µmol L−1 of each analyte), the three additions of known concentrations of the standard of the contaminants (additions of 0.5 µmol L−1) and the blank (dotted line). The first peak refers to BPA and the second one refers to HCS. (Inset: linear relationship of anodic peak currents as a function of contaminants concentrations).
Chemosensors 11 00562 g006
Table 1. Electrochemical parameters obtained from CV recorded using different working electrodes in the presence of a ferricyanide/ferrocyanide redox probe (0.2 mol L−1 of PBS with a pH of 7.4 and 5.0 × 10⁻³ mol L−1 potassium ferricyanide/ferrocyanide).
Modified ElectrodeEpa (mV)Epc (mV)Ep (mV)Ipa (µA)Ipc (µA)Ipa/Ipc
GC500749369.24−65.961.05
GC/HDC3967931786.93−72.261.20
GC/HDC-CuNPs31818912999.57−98.291.01
Table 2. Parameters optimized for the voltammetry analysis of HCS and BPA with the proposed electrode, an HDC-CuNPs electrode.
ParametersOptimization RangeHCS—Optimized ValuesBPA—Optimized Values
HDC-CuNPs concentration (mg/mL)0.02–1.001.001.00
Cu/HDC proportion in the synthesis (%)20–404040
Frequency (Hz)20–454040
Modulation Amplitude (V)0.01–0.050.050.05
Step Potential (V)0.001–0.0070.0070.007
pH5–956
Table 3. Comparison of different working electrodes for the determination of antimalarial drugs.
ElectrodeMethodLinear Range (μmol L−1)LOD (μmol L−1)Ref
ePADsDPV5–754.0[37]
SDSMCNTPECV10–400.85[38]
β-CD-AuNPDPV0.01–0.050.00085[39]
BDDSWV0.1–1.90.06[40]
HDC-CuNPsSWV1–500.46This work
Table 4. Comparison of different working electrodes for the analysis of BPA.
ElectrodeMethodLinear Range (μmol L−1)LOD (μmol L−1)Ref
Gr/MXene/GCEDPV1–100.35[41]
MWCNT/GCEDPV2–300.51[42]
RGO-Ag/PLL/GCEDPV1–800.54[43]
CoPCTSDPV0.5–100.43[44]
HDC-CuNPsSWV0.5–100.31This work
Table 5. Results of the simultaneous quantification of 2.5 µmol L−1 of HCS and 2.5 µmol L−1 of BPA in natural water samples using 0.2 mol L−1 of PBS at a pH of 6.0.
RepetitionHCS (μmol L−1)BPA (μmol L−1)HCS—Relative Errors (%)BPA—Relative Errors (%)
12.372.49−5.2−0.4
22.542.571.62.8
32.672.636.85.2
Mean ± SD2.53 ± 0.122.56 ± 0.06--
Table 6. Effect of Cu(II), Hg(II) and methomyl on the anodic peak of 2.0 µmol L−1 of HCS and BPA by SWV in 0.2 mol L−1 of PBS at a pH of 6.0.
InterferentConcentration (µmol L−1)% HCS Signal% BPA Signal
Cu(II)1104.096.2
2106.988.1
4109.384.4
Hg(II)1102.297.2
2104.194.2
4105.384.5
Methomyl1101.090.6
2102.284.7
4103.682.7
Disclaimer/Publisher’s Note: The statements, opinions and data contained in all publications are solely those of the individual author(s) and contributor(s) and not of MDPI and/or the editor(s). MDPI and/or the editor(s) disclaim responsibility for any injury to people or property resulting from any ideas, methods, instructions or products referred to in the content.