Abstract
Nanomaterial-based humidity sensors hold great promise for water vapor detection because of their high sensitivity and fast response/recovery. However, the condensation of water in nanomaterial films remains unclear from a physicochemical perspective. Herein, the condensation of water vapor in silica nanoparticle films was physicochemically analyzed to bridge the abovementioned gap. The morphology of surface-adsorbed water molecules was characterized using infrared absorption spectroscopy and soft X-ray absorption spectroscopy, and the effect of RH on the amount of adsorbed water was observed using a quartz crystal microbalance. The adsorbed water was found to exist in liquid- and ice-like states, which contributed to high and low conductivity, respectively. The large change in film impedance above 80% RH was ascribed to the condensation of water between the nanoparticles. Moreover, RH alteration resulted in a colorimetric change in the film’s interference fringe. The obtained insights were used to construct a portable device with response and recovery times suitable for the real-time monitoring of water vapor. Thus, this study clarifies the structure of water adsorbed on nanomaterial surfaces and, hence, the action mechanism of the corresponding nanoparticle-based sensors, inspiring further research on the application of various nanomaterials to vapor sensing.
1. Introduction
In the field of improving industrial, agricultural, and human activities, much attention has been drawn to the monitoring of water evaporation dynamics, which typically involves the real-time detection of moisture [1]. The performance of humidity sensors, e.g., their responsiveness to water vapor, can be enhanced through the use of humidity-sensitive nanomaterials [2,3,4,5], particularly in the form of films with large surface-to-volume ratios. Among the several types of humidity sensors, impedance-type ones are easily incorporated into conventional electronic circuits and have therefore been most widely studied and used in portable devices [6,7,8,9,10,11,12]. In our previous studies, insulator nanoparticles were used as humidity-sensitive materials to fabricate sensors exhibiting rapid exponential impedance changes in response to humidity variation [13,14]. This sensing mechanism was appropriate to detect high humid air because a high impedance ratio regarding high (95%) versus low (40%) humidity (Zhigh/Zlow = 102 using 1 Hz ac voltage [14]) was obtained. However, the physicochemical origin of this dependence has not yet been elucidated experimentally. Proton hopping through water layers on nanomaterials was suggested to become dominant at high humidity [7,8,9], although the detailed chemical morphology of water in such layers has not been studied.
Capillary condensation is an important phenomenon affecting the behavior of nanomaterial-based humidity sensors. According to the theory of capillary effects (Kelvin equation), water droplets can form between particles with sizes of several nanometers in air with <100% relative humidity (RH) [5,15,16,17]. For example, Baumgartner et al. demonstrated the presence of capillary-condensed water in mesoporous silica with pore diameters of 5–13 nm using infrared (IR) spectroscopy [18]. Cappelli et al. described the operation of semiconductor TiO2 nanoparticle-based humidity sensors by examining water adsorption on the nanoparticle surface with the capillary effect [19]. Asay et al. examined the effect of environmental humidity on the formation of water layers on flat silicon oxide surfaces using IR spectroscopy [20,21,22], revealing that ice-like structures with approximately three molecular layers were produced below 30% RH, whereas a liquid-like structure began to form for RH above 60%. Seo et al. showed that the electrical conductivity of flat silicon oxide substrates was dependent on the phase of the water layers and used this dependence to rapidly detect humid breath air [23]. In our previous work, movable water molecules began to adsorb on the flat surface of a galvanic action-based humidity sensor for RH concentrations higher than 60% RH [12]. The abovementioned insights can help us better understand the behavior of nanomaterials exposed to humid air and improve moisture gas detection.
Herein, to shed light on the detailed chemical morphology of water adsorbed on insulator nanomaterials, we investigated the condensation of water vapor in nanoparticle films by physicochemical methods. The presence and structure of capillary-condensed water in these films were evaluated using Fourier-transform infrared (FT-IR) spectroscopy and soft X-ray absorption spectroscopy (XAS) in ambient air and in dry He gas. A quartz crystal microbalance (QCM) and impedance analysis were used to evaluate the effects of humidity on the mass of adsorbed water and film impedance, respectively. Moreover, we examined the evolution of the film surface with the change in impedance to correlate impedance variation with water condensation in the film, and simultaneously reveal the dynamics of the condensation in real time. Cappelli et al. investigated a physicochemical sensing mechanism of semiconductor TiO2 nanoparticle-based humidity sensors using QCM [19]. In this study, we used an insulator SiO2 nanoparticle-based humidity sensor to focus on the effect of capillary-condensed water. Proton hopping in physisorbed water and condensed water was elucidated since the current through the SiO2 nanoparticles was negligible. The simultaneous observation of sensor output and optical surface imaging proved to be useful for determining the relationship between impedance change and macroscopic water condensation [12]. Finally, we constructed a nanofilm-based system for detecting water vapor in real time, demonstrating that its response and recovery times allowed for rapid vapor detection.
2. Materials and Methods
2.1. Theory
Figure 1a illustrates the response of a humidity sensor to an increase in RH and its subsequent recovery upon the restoration of the initial conditions. The response time (t90) is defined as the time required to reach 90% of the total sensor output after the RH increases [4], and the recovery time (t10) is defined as the time required for the output to drop by 90% upon the restoration of the original RH.
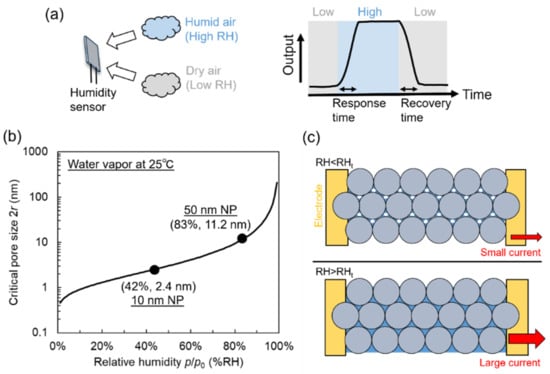
Figure 1.
(a) Response and recovery of humidity sensor. (b) Theoretical relationship between pore size of nanoporous material and relative humidity (RH) corresponding to onset of water vapor condensation at 25 °C. (c) Illustration of water vapor condensation in nanoparticle array between two electrodes. At RH < threshold RH (RHt), voids between nanoparticles are partially filled, and condensation occurs at points where nanoparticles contact each other. At RH > RHt, voids are fully filled with condensed water.
In this study, we pay attention to the condensed water in the nanoparticle film and investigate the electrical conductivity of the water directly. In the field of humidity sensors, semiconductor nanoparticles such as TiO2 [19,24,25] and SnO2 [26] are widely used. This solution uses an electronic modulation of adsorbed molecular water on the semiconductors, which is used to detect low humidity. In this case, it is difficult to separate the conduction of the condensed water from that of semiconductor nanoparticles. Since the semiconductor gives sufficient conduction, the electrical conduction of the condensed water is unseparated. To see the effect of the capillary condensed water on conductivity, we chose a nonporous insulator nanoparticle thin film as a humidity-sensitive material. This solution allows us to see the electrical conductivity of the condensed water directly.
According to the Kelvin equation, nanopore capillaries become spontaneously filled with condensed water at RH < 100% [15,17,27] when the following condition is satisfied:
Here, p is the partial pressure of water vapor, p0 is the pressure of water vapor at saturation at temperature T, γ is the surface tension of liquid water at temperature T (72.0 mN/m at 25 °C), Vm is the molar volume of water (1.8 × 10⁻⁵ m3/mol), θ is the contact angle of water on the nanopore material, R is the universal gas constant (8.31 J/(K mol)), and r is the radius of the meniscus curvature. At T = 25 °C and θ = 0° (highly hydrophilic nanopores), the equation is reduced to:
If the pore size is assumed to be roughly two times r, the critical pore size providing condensation equals −2.1 × 10⁻⁹/ln(p/p0). Figure 1b shows the dependence of the critical pore size (2r) on relative humidity (p/p0) at 25 °C and presents the threshold humidity (RHt) at which capillary condensation occurs in nanoscale voids.
Another key parameter is the nanoparticle diameter D. According to Hudson [28], simple trigonometric analysis suggests that vapor condensation occurs at a critical meniscus radius rc of 0.22475 (D/2) for the closest hexagonal packing model and at 0.4142 (D/2) for the cubic packing model. For a nanoparticle film with D = 50 nm, rc roughly ranges from 5.6 to 10.4 nm, i.e., the critical pore size equals 11.2–20.8 nm in the ideal case and is expected to be randomly distributed in this range in the case of a real nanoparticle film. According to Figure 1b, a critical pore size of 11.2 nm corresponds to RHt = 83%. At RH < 83%, the condensation of water vapor occurs only at points where nanoparticles contact each other [29]. The nanoscale voids are partially filled with small liquid clusters. In this case, no large current is expected to flow between the electrodes upon the application of a bias voltage. On the contrary, the voids are completely filled with condensed water at RH > 83%. At this point, conductance is expected to sharply increase because of ion conduction through the condensate. This phenomenon is similar to the percolation of conductive filaments in conductive and insulator composites [30]. Figure 1c illustrates condensation in nanoparticle films. For a nanoparticle film with D = 10 nm, the critical pore size is 2.4–4.2 nm. For a pore size of 2.4 nm, water vapor condensation is expected to start at RHt = 42%.
2.2. Experimental Methods
In the present study, we adopted a nonporous silica nanoparticle as an insulating structure to condense water vapor. A colloidal solution of silica nanoparticles (50 nm diameter particle: Sigma-Aldrich (St. Louis, MO, USA) and 10 nm diameter particle: Micromod Partikel Technology, Rostock, Germany) was diluted in ethanol (Fujifilm, Tokyo, Japan), with a proportion 10 times higher, and filtered through a syringeless filter with a pore size of 0.45 μm (Whatman, Maidstone, UK) to remove agglomerated particles. For IR spectroscopy and XAS measurements, a dispersion of 10 nm nanoparticles was spin-coated on a gold-coated silicon substrate to increase the amount of condensed water on the surface. Since the spectroscopic measurements were carried out under constant humidity, hysteresis effect was not discussed in these results. For impedance measurements, it was important to consider the hysteresis effect on humidity changes. In our previous work [14], we found that the hysteresis effect in the 50 nm nanoparticle device was smaller than that in the 10 nm one. Thus, we used 50 nm nanoparticles coated over interdigitated electrodes for the impedance measurement.
FT-IR absorption spectra were recorded under ambient conditions (25.5 °C and 50% RH) using a FT-IR microscope (LUMOS, Bruker, Billerica, MA, USA) in reflection mode. The IR path was dehumidified using molecular sieves to prevent absorption loss due to ambient vapor. The acquired spectra were deconvoluted using the Gaussian function fit implemented in OriginPro 2023 software (Version 10.0.0.154, OriginLab).
The presence of water molecules on the nanoparticle film was further confirmed by soft XAS, which can detect surface adsorbates with high sensitivity, as the escape depth of excited electrons is of the order of several nanometers. XAS measurements were performed in vacuum (~10−6 Pa) and He gas (ambient pressure, G1 purity) using a BL19B beamline at the Photon Factory of KEK (Tsukuba, Japan). Incident X-rays were generated using synchrotron radiation. An APPLE-II-type undulator (2.5 GeV maximum electron energy) with a variable included angle Monk-Gillieson monochromator and varied-line-spacing gratings was used. The beam size was approximately 200 μm × 50 μm. The beam intensity was 2.4 × 10¹¹ photons/s at 400 eV. Measurements were conducted in fluorescence mode using a silicon drift detector (SDD with C2 window, Amptek, Bedford, MA, USA) placed at an angle of 45° relative to the incident beam. A SiN window was placed between the beamline and the measurement chamber. Acquisition was performed within an energy range of 520–560 eV using an energy step of 0.1 eV and a dwell time of 0.5 s.
To correlate the film impedance with the amount of adsorbed water, we used QCM and impedance sensors (Figure 2a,b). The abovementioned solution was spin-coated on (i) a bare QCM sensor (SEN-20E-H-10, TAMADEVICE Co., Ltd; resonant frequency = 20 MHz, diameter = 8 mm) and on (ii) interdigitated gold electrodes on a thermally oxidized silicon substrate. The interdigitated electrodes were designed and fabricated using standard photolithographic techniques. The impedance sensor size was 10 mm × 10 mm, and the insulating oxide layer on the substrate had a thickness of 1 μm. The line spacing of the interdigitated electrode was 10–20 μm. Figure 2c shows an optical microscopy image of the top surface of the impedance sensor. As the nanoparticle film had a thickness smaller than 1 μm, it was almost transparent to visible light. Optical reflection at the interface (air/nanoparticle film/bulk SiO2) resulted in the emergence of interference fringe, which was an important feature for determining the presence of condensed water between the nanoparticles. Figure 2d shows a cross-sectional image of the silica film on the silicon substrate, revealing that the nanoparticles (D = 50 nm) were randomly packed.
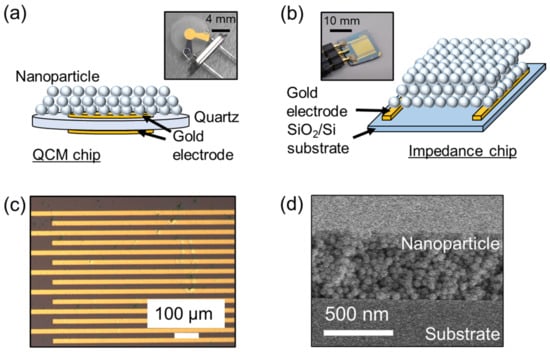
Figure 2.
Schematic illustration of (a) quartz crystal microbalance (QCM) and (b) impedance sensors. (c) Optical microscopy image of impedance sensor surface. (d) Cross-sectional scanning electron microscopy image of thin silica nanoparticle film on silicon substrate.
We carried out the evaluation of the sensor response to humidity changes in an environment-controlled chamber (SH-222, ESPEC, Osaka, Japan). The resonant frequency shift of the QCM sensor was measured by a portable measurement system (THQ-100P-SW, TAMADEVICE Co., Ltd, Kawasaki, Japan). The sampling time of the frequency was 1 s. The impedance of the nanoparticle films was monitored by an LCR meter (ZM 2376, NF Instruments, Yokohama, Japan) controlled by LabVIEW software (National Instruments, Austin, TX, USA). The amplitude and frequency of the applied voltage were 1.0 V and 0.2–10 kHz, respectively. A portable measurement system with an impedance-type sensor was developed for rapid vapor detection. The system with a portable data logger (MetaWearC, MbientLab, San Francisco, CA, USA) and a voltage divider comprising a resistor (10 or 100 MΩ) remotely monitored the changes in the film resistance via a custom-made Android API.
Simultaneous monitoring of the sensor surface and impedance was performed as follows. The impedance sensor was mounted on an aluminum block cooled using a chiller (UC180, Solid-State Cooling Systems, Wappingers Falls, NY, USA), and placed under an optical microscope (VHX-7000, Keyence, Osaka, Japan). The environmental humidity on the surface was adjusted by controlling the temperature of the sensor using a thermo-controller. The temperature and RH of the ambient air were 23–24 °C and 30%, respectively, corresponding to a dew point of 3–4 °C. Once the temperature of the sensor decreased to 3 °C, the effective environmental humidity around the sensor surface increased to 100% RH. During cooling, the sensor surface was observed by the optical microscope, and the voltage was recorded by the portable measurement system as explained above.
For the demonstration of water vapor detection, we used water vapor naturally generated from liquid water in a beaker. The impedance sensor was intermittently exposed to the water vapor to obtain the transient sensor response in voltage. The sensor position was mechanically controlled by a solenoid-based linear actuator. The height of the sensor over the beaker was 2 cm from the edge. The water was mildly warmed at 60 °C to generate vapor. The temperature and relative humidity in the ambient air were 24 °C and 54%, respectively.
3. Results and Discussion
3.1. IR Spectroscopy and XAS Measurements
The critical pore size of the 10 nm silica nanoparticle film was 2.4 nm. Hence, at 50% RH, the voids of this film were expected to be filled with capillary condensed water, as shown in Figure 1b. To prove the applicability of the Kelvin equation to our nanoparticle film, we recorded its IR absorption spectrum. The IR absorption spectrum of the 10 nm silica nanoparticle film on the gold surface (Figure 3a) featured water-related peaks at 1645 (bending mode) and 3400 cm−1 (symmetric and asymmetric modes) [22,29]. Previous studies have shown that the broad O–H stretching band at 3000–3700 cm−1 can be deconvoluted into the peaks of liquid-like (around 3400 cm−1) and ice-like (around 3200 cm−1) water [20,21,31,32,33]. The difference between these forms can be explained by the strength of hydrogen bonding between their water molecules, which is larger for ice-like water [22]. The broad peak around 3400 cm−1 in Figure 3b has a shape different from that of the bulk water peak (dotted line). Moreover, compared to that of bulk water, the peak was shifted to lower wavenumbers, indicating that the condensate formed in the nanoparticle film may have a larger content of ice-like water and thus implies the presence of more ordered water molecules on the film surface [22].
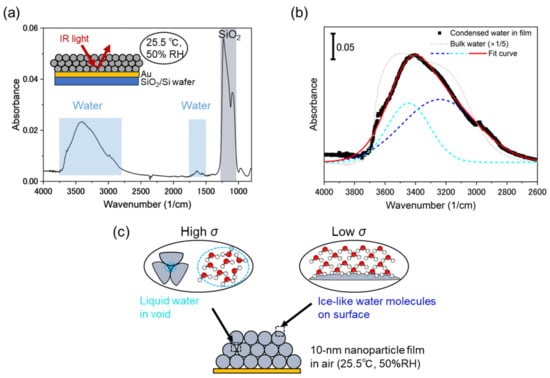
Figure 3.
(a) Infrared absorption spectrum of 10 nm silica nanoparticle film recorded in air at 25.5 °C and 50% RH. (b) Results of water peak deconvolution. Black dots, dashed lines, red solid line, and dotted line represent experimental data, deconvoluted peaks, deconvoluted peak sum, and bulk water peak (downscaled five-fold), respectively. (c) Illustration of liquid and ice-like water between nanoparticles.
The electrical conductivity of the nanoparticle film (σ) is determined by the number of charge carriers and their mobility in transfer channels. Figure 3c illustrates the proposed conformation of water molecules in the nanoparticle film. The presence of the liquid-like water peak (3445 cm−1) suggested that water condensation occurred in the voids between the nanoparticles. Liquid-like water is well suited for the transfer of hydronium (H3O+) and hydroxide (OH−) ions, thus providing high conductivity [34,35]. The elevated number of ions involved in charge transport can also account for high conductivity. When liquid clusters are macroscopically connected between the electrodes (Figure 1c), a sufficient current is obtained in response to the applied voltage. Therefore, condensed water causes a large change in sensor impedance. In contrast, water molecules physisorbed on the surface (up to three monolayers [20]) has an ice-like structure (3240 cm−1): the water molecules are weakly hydrogen-bonded each other. The first layer of the water molecules is also bonded to the silicon oxides. In this case, proton transfer through the water molecular network (Grotthuss mechanism) plays a major role in electrical conduction [34,36,37,38]. Given the limitations of this transfer pathway and the small number of free protons, ice-like water contributes to small σ.
Figure 4a shows the oxygen K-edge spectrum of the 10 nm nanoparticle film recorded in He gas. The strong peak at 537–538 eV was ascribed to oxygen in silica nanoparticles, while the weak peak at 534 eV was attributed to oxygen in water molecules. Notably, the latter peak was located at a lower energy than that of bulk water (535 eV [39,40,41]), which indicates that several molecular water layers with an ice-like structure were still present in an atmosphere of dry He gas. On the contrary, no peak of water molecules physisorbed on the surface was observed in vacuum (10−6 Pa), as these molecules were forcibly removed by vacuum pumping. The thermogravimetric analysis of Zhuravlev showed that water multilayers on a silica surface can be transformed into a single molecular layer by vacuuming at 25 °C [42]. Thus, chemisorbed water molecules possibly remained on the surface in vacuum. Figure 4b illustrates the abovementioned results.
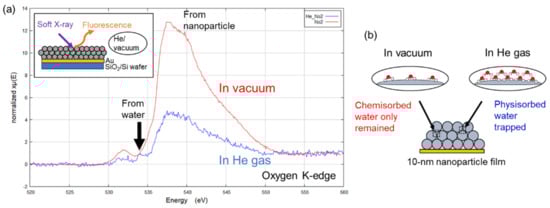
Figure 4.
(a) Oxygen K-edge X-ray absorption spectra of 10 nm silica nanoparticle film recorded in He gas (blue) and under vacuum (red). (b) Schematic illustration of water physisorbed in void space between nanoparticles under vacuum and in He gas.
3.2. QCM and Electrical Sensor Measurements
Figure 5a shows the frequency shift (Δf) of the QCM sensor in response to a change in RH from 35% to 95% and then back to 35% in steps of 5%. The mass of water adsorbed on quartz (Δm) was calculated using the Sauerbrey theory as
where A is the area of the sensor surface, and f0 is the resonant frequency of quartz [11,43]. In this study, A equaled 0.196 cm2 (5 mm disk), and f0 equaled 20 MHz (Δm/Δf = 0.22 ng/Hz). The mass of the sensing film was estimated to be 400 ng according to the change in the QCM frequency before and after the film deposition. Figure 5b shows Δm as a function of RH together with the corresponding fit with a quadratic function, revealing that this function well modeled the evolution of Δm. The ratio of the adsorbed water to the sensing film was roughly 0.5 at 80% RH and 0.8 at 95%RH.
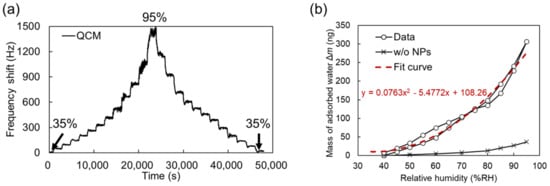
Figure 5.
(a) Dynamic frequency shift of QCM sensor upon RH change from 35% to 95% and back to 35%. (b) Mass of adsorbed water as a function of RH for QCM sensors coated and not coated with 50 nm nanoparticles. Red dashed line presents quadratic fit for nanoparticle-coated sensor.
According to other literature measuring nanoparticle-based sensors by QCM, the QCM sensor response as a function of humidity typically showed two regimes: linear response in lower humidity and exponential increase in higher humidity [19,33]. In Figure 5b, the threshold relative humidity in the transition is around 60% RH. From the Kelvin equation in Figure 1b, the void between the nanoparticles was filled with the condensed water at 83% RH. This indicates that the large increase in mass above 75% RH can be attributed to the capillary condensation in the void and physisorbed water molecular networks are formed. It should be noted that a chemisorption of water molecules on SiO2 nanoparticles occurred in lower humidity than 60%RH because a detectable current due to proton conduction through the molecules was not observed as shown later. The mass increase observed for the QCM sensor without nanoparticles (control) at any given RH was roughly nine times lower than that observed for the sensor coated with the 50 nm nanoparticle film.
Figure 6a shows the dependence of the sensor impedance on frequency at different RH. The impedance in the lower-frequency region decreased with increasing RH. This indicates that the adsorption of water molecules reduced the impedance. The impedance at a lower frequency than 10 Hz in 60% RH is attributed to the proton transfer, which corresponds to the resistive component of the impedance. As increasing the humidity, the resistive component of the impedance was reduced, and the plateau plots were extended to a higher frequency region. Considering the impedance as a function of frequency, we used impedance at 5 Hz to detect water vapor in the nanoparticle film. In this frequency, a resistive component was dominant on the electrical conduction. We noted that a detectable current due to proton conduction was not observed in lower than 60% RH: a physiosorbed molecular network over the nanoparticles was too thin to transfer mobile protons.
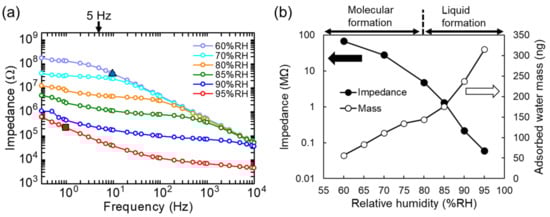
Figure 6.
(a) Impedance as a function of frequency at different RH. Dotted line represents inverse relationship between impedance and frequency. (b) Effects of RH on mass of water adsorbed on nanoparticle film and impedance at 5 Hz.
According to the work of Cappelli [19], the electrical model for nanoparticle films in humid environments ideally includes three capacitance components: non-ideal capacitance in electrode/film interface (CE), nanoparticle-film capacitance (CF), and fixed parasitic capacitance (Cp). In this work, the effects of CE and Cp appear as follows.
The impedance dominated by CE is observed in the plot of 95% RH around 1 Hz. The value of the capacitance is 800 nF using the equation C = 1/2πfZ where the impedance Z is 200 kΩ at f = 1 Hz at 95% RH (noted by the square in Figure 6a). The electrode surface under the nanoparticles S is approximately 0.10 cm2. If we assume that the relative permittivity ϵ of water is 80 and the vacuum permittivity ϵ0 is 8.85 × 10⁻¹⁴ F/cm, we roughly estimate the thickness of the electric double layer d = ϵϵ0S/C = 8.9 × 10⁻⁷ cm = 8.9 nm. The effect of the capacitance is dependent on humidity and the capacitance gradually decreases (i.e., impedance increases) as the humidity is reduced. Thus, it is reasonable that the origin of CE is the electrical double-layer capacitance formed by a thin film of condensed water.
The impedance at a higher frequency than 10 Hz in 60% RH is due to Cp. The origin of the parasitic capacitance is the silicon substrate. The top electrode area including pad electrodes S is approximately 0.12 cm2. The thickness of the thermally oxidized silicon in the substrate d is 10−4 cm (=1 μm). A silicon layer used in the base of the substrate works as the other side of the electrode. The relative permittivity of SiO2 ϵ is 3.9 and the vacuum one ϵ0 is 8.85 × 10⁻¹⁴ F/cm. According to the calculation of a capacitance in a parallel plate (C = ϵϵ0S/d), we obtain C = 0.4 nF. When we assume the ac frequency is 10 Hz, the impedance due to C is 40 MΩ. This value corresponds to the triangle in Figure 6a on the curve. Since the capacitance is not dependent on humidity, we conclude that this capacitance is parasitic, not an electric double layer one.
Figure 6b shows the effects of RH on impedance at 5 Hz (filled circles) and the mass of adsorbed water (open circles), revealing that impedance exponentially decreased from 28 MΩ at 70% RH to 0.06 MΩ at 95% RH. As in the case of the QCM sensor, condensed water contributed to an increase in electrical conductivity at over 80% RH. The change in impedance at smaller than 80% RH was mainly ascribed to the molecular layers of ice-like water formed on the nanoparticles. Notably, the electrical conductivity of liquid water is three orders of magnitude larger than that of ice-like water because of the higher mobile ion concentration of the former [44]. It should be noted that the impedance at lower than 60% RH is much larger than 100 MΩ because the water molecular layers are too thin for protons to percolate in. In this study, we focus on the formation of the water molecular network.
3.3. Water Vapor Detection by Portable System
Figure 7a shows the circuit of the portable system used for rapid water vapor detection. Here, a 100 MΩ resistor was serially connected to the sensor, and the partial voltage at the midpoint was monitored using the GPIO pin of the portable data logger. Figure 7b shows the effects of RH on the GPIO output, revealing that the developed system was well suited for the detection of highly humid air. When the sensor resistance is much larger than 100 MΩ (RH < 60% in this device), the circuit shows a constant value of approximately zero of the GPIO output.
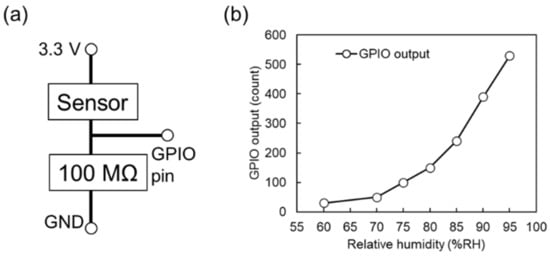
Figure 7.
(a) Circuit design of portable system used to monitor water vapor. (b) Effects of RH on GPIO output.
Subsequently, we tested the ability of our portable system to monitor water condensation in ambient air. Figure 8a shows the effects of RH alteration on the GPIO output. RH was varied in the range (70–95%) where the sensor had sufficient sensitivity. With increasing RH, the resistance of the sensor decreased, and the sensor output therefore increased. Figure 8b shows the optical images of the sensor surface captured at different RH. According to the Kelvin equation (Figure 1b), water molecules were physisorbed on the nanoparticle surface at 70% RH, and liquid water formed by capillary condensation inside the voids between the nanoparticles at above 80% RH. Notably, no macroscopic water droplets were detected across the electrodes (10–20 μm). After dehumidification to 25% RH, the condensed water re-evaporated, and the sensor output recovered to its initial state. Figure 9a–c show the optical images of the sensor surface captured at 70, 95 and 100% RH. At 100% RH (saturation), the condensed water could be macroscopically formed as dew droplets on the nanoparticle film. The line and spacing of the electrodes were 20 μm in this case. When the water droplets grew over the size, the resistance largely decreased to 105 Ω. The size of the water droplets in Figure 9c is approximately 10 to 20 μm, which can be observable in the optical microscope. It should be noted that the photo in Figure 9c is the snapshot of the growing water droplets. If we wait for a long time at 100% RH, the droplets are gradually coalesced, and the surface will be covered with a large amount of water.
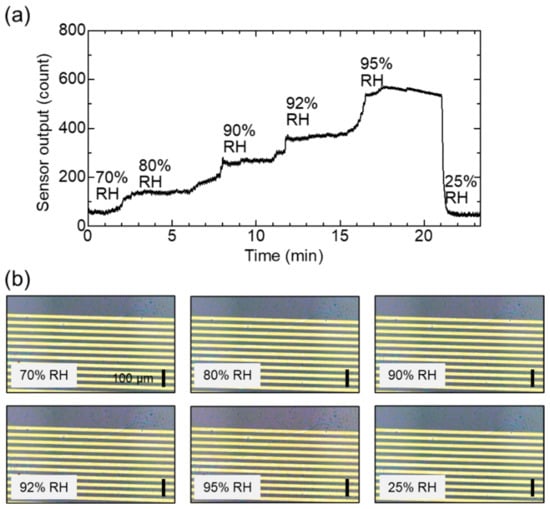
Figure 8.
Simultaneous monitoring of sensor output and surface. (a) Change in sensor output in response to humidity changes over 50 nm nanoparticle surface. (b) Optical microscopy images of sensor surface captured during humidification and dehumidification. The scale bar is 100 μm.
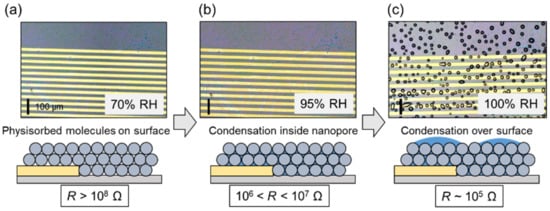
Figure 9.
Monitoring of macroscopic water condensation. Optical microscopy images of nanoparticle surface at (a) 70, (b) 95, and (c) 100% RH and illustration of condensation on film surface. The scale bar is 100 μm.
Owing to the emergence of interference fringe, the visible color in Figure 8b changed with increasing humidity, which was qualitatively explained by considering the change in the refractive index. The refractive index of a composite of multiple materials is defined by the composition ratio γ and component refractive indices n. In a nanoparticle film, the total refractive index depends on the composition of voids between nanoparticles. When the voids are filled with liquid water, the refractive index increases because of the exchange of air (n = 1) for water (n = 1.33). This mechanism forms the basis of a method previously proposed for the colorimetric detection of humidity changes [4,45,46]. The abovementioned result indicates that our system allows for humidity sensing based on both optical and electrical measurements.
Finally, we carried out a feasible study to evaluate the sensor response to water vapor. Water vapor (i.e., 100% of relative humidity) was naturally generated from liquid water as well as wet materials. Figure 10a shows a photograph of the portable system used for detecting water vapor. The sensor with the portable logger was intermittently exposed to water vapor generated from water in a beaker as shown in Figure 10b. Water vapor was cyclically applied to the sensor for ~1 s. In this experiment, the sensor detected water vapor (nearly 100% RH) and relatively dry ambient air (54%RH) alternately. A 10 MΩ resistor was used for monitoring the sensor output. In Figure 10c, the sensor output voltage rapidly changed during response and recovery. The response (t90) and recovery (t10) times were determined as described in Section 2.1 and equaled 0.17 s on average, with the corresponding histogram shown in Figure 10d. In Figure 5 and Figure 8, the sensor response includes an environmental humidity change over the sensor surface (extrinsic response time [47,48]) as well as an intrinsic sensor response (resistance change by the environmental humidity change). The response time corresponds to the intrinsic response because humid air is directly applied to the sensor surface. The extrinsic response time is ideally negligible. The limitation of this demonstration is that we could not control humidity of air. Evaluation of response time depending on humidity of air is in our future study. We only did the calculation of the Kelvin equation and the porosity in the nanoparticle film has not been investigated experimentally. The evaluation of the porosity is important to support our discussion in further study.
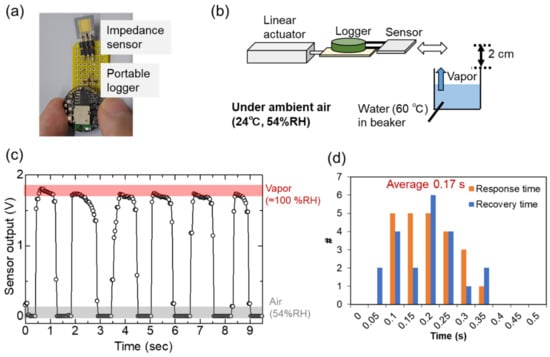
Figure 10.
Demonstration of water vapor detection. (a) Portable water vapor monitor. (b) Schematic of the measurement. (c) Cyclic response of sensor to water vapor. (d) Histogram of response and recovery times determined by analyzing responses to water vapor.
4. Conclusions
The condensation of water vapor in silica nanoparticle films was physicochemically analyzed to shed light on the chemical morphology of water adsorbed on nanomaterials in nanoparticle-based impedance-type sensors. By using IR and XAS, we found that water vapor in the air was capillary-condensed in the voids between 10 nm nanoparticles at 50% RH, and residual ice-like water was detected on the nanoparticles in an atmosphere of He, whereas no ice-like water layers remained present after exposure to vacuum. The value of RH was correlated with the mass of water adsorbed on the nanoparticle film, and a large change in film impedance was observed above 80% RH, which was ascribed to vapor condensation. The continuous optical observation of the nanoparticle film surface revealed a colorimetric change in the interference fringe with increasing humidity in the near-surface region. A portable sensor featuring a silica nanoparticle film was designed to detect water vapor. The response/recovery times (0.17 s each) were sufficiently small for the real-time monitoring of water vapor in automated systems. Thus, this study bridges an important knowledge gap, revealing the importance of the capillary condensation of water vapor for the operation of nanoparticle-based sensors, and is expected to inspire further research on the application of various nanomaterials to vapor sensing.
Author Contributions
Conceptualization, S.K., J.K., S.Y. and H.M.; investigation, S.K., J.K. and S.Y.; resources, S.K., J.K. and S.Y.; writing—original draft preparation, S.K.; writing—review and editing, J.K., S.Y. and H.M. All authors have read and agreed to the published version of the manuscript.
Funding
This research was supported by the TIA Collaborative Research Program and KAKENHI (Grant No. 18KK0141) from the Japan Society for the Promotion of Science (JSPS).
Institutional Review Board Statement
Not applicable.
Informed Consent Statement
Not applicable.
Data Availability Statement
The data presented in this study are available upon request from the corresponding author.
Acknowledgments
The authors thank K. Hirayama for assistance with the real-time imaging of the sensor surface during the humidification process. This study was approved by the Photon Factory (Approval Nos. 2022PF-G001 and 2023PF-G005).
Conflicts of Interest
The authors declare no conflict of interest.
References
- Bi, H.; Yin, K.; Xie, X.; Ji, J.; Wan, S.; Sun, L.; Terrones, M.; Dresselhaus, M.S. Ultrahigh humidity sensitivity of graphene oxide. Sci. Rep. 2013, 3, 2714. [Google Scholar] [CrossRef]
- Borini, S.; White, R.; Wei, D.; Astley, M.; Haque, S.; Spigone, E.; Harris, N.; Kivioja, J.; Ryhänen, T. Ultrafast Graphene Oxide Humidity Sensors. ACS Nano 2013, 7, 11166–11173. [Google Scholar] [CrossRef] [PubMed]
- Zhang, D.; Zong, X.; Wu, Z.; Zhang, Y. Hierarchical Self-Assembled SnS2 Nanoflower/Zn2SnO4 Hollow Sphere Nanohybrid for Humidity-Sensing Applications. ACS Appl. Mater. Interfaces 2018, 10, 32631–32639. [Google Scholar] [CrossRef] [PubMed]
- Kano, S.; Jarulertwathana, N.; Mohd-Noor, S.; Hyun, J.; Asahara, R.; Mekaru, H. Respiratory Monitoring by Ultrafast Humidity Sensors with Nanomaterials: A Review. Sensors 2022, 22, 1251. [Google Scholar] [CrossRef] [PubMed]
- Farahani, H.; Wagiran, R.; Hamidon, M.N. Humidity sensors principle, mechanism, and fabrication technologies: A comprehensive review. Sensors 2014, 14, 7881–7939. [Google Scholar] [CrossRef]
- Cai, J.; Lv, C.; Aoyagi, E.; Ogawa, S.; Watanabe, A. Laser Direct Writing of a High-Performance All-Graphene Humidity Sensor Working in a Novel Sensing Mode for Portable Electronics. ACS Appl. Mater. Interfaces 2018, 10, 23987–23996. [Google Scholar] [CrossRef]
- Choi, S.; Yu, H.; Jang, J.; Kim, M.-H.; Kim, S.; Jeong, H.S.; Kim, I.-D. Nitrogen-Doped Single Graphene Fiber with Platinum Water Dissociation Catalyst for Wearable Humidity Sensor. Small 2018, 14, 1703934. [Google Scholar] [CrossRef]
- An, H.; Habib, T.; Shah, S.; Gao, H.; Patel, A.; Echols, I.; Zhao, X.; Radovic, M.; Green, M.J.; Lutkenhaus, J.L. Water Sorption in MXene/Polyelectrolyte Multilayers for Ultrafast Humidity Sensing. ACS Appl. Nano Mater. 2019, 2, 948–955. [Google Scholar] [CrossRef]
- Li, B.; Tian, Q.; Su, H.; Wang, X.; Wang, T.; Zhang, D. High sensitivity portable capacitive humidity sensor based on In2O3 nanocubes-decorated GO nanosheets and its wearable application in respiration detection. Sens. Actuators B Chem. 2019, 299, 126973. [Google Scholar] [CrossRef]
- Zhou, C.; Zhang, X.; Tang, N.; Fang, Y.; Zhang, H.; Duan, X. Rapid response flexible humidity sensor for respiration monitoring using nano-confined strategy. Nanotechnology 2020, 31, 125302. [Google Scholar] [CrossRef]
- Mekawy, M.; Noguchi, H.; Kawakita, J. Quantitative and qualitative studies for real monitoring of interfacial molecular water. J. Colloid Interface Sci. 2022, 613, 311–319. [Google Scholar] [CrossRef] [PubMed]
- Kubota, Y.; Mishra, V.L.; Ando, T.; Sakamoto, Y.; Kawakita, J. Micro/nano galvanic-coupled arrays for early and initial detection and prediction of dew condensation. Sens. Actuators A Phys. 2020, 303, 111838. [Google Scholar] [CrossRef]
- Kano, S.; Mekaru, H. Nonporous Inorganic Nanoparticle-Based Humidity Sensor: Evaluation of Humidity Hysteresis and Response Time. Sensors 2020, 20, 3858. [Google Scholar] [CrossRef] [PubMed]
- Kano, S.; Mekaru, H. Capillary-condensed water in nonporous nanoparticle films evaluated by impedance analysis for nanoparticle devices. Nanotechnology 2020, 31, 455701. [Google Scholar] [CrossRef]
- Fisher, L.R.; Gamble, R.A.; Middlehurst, J. The Kelvin equation and the capillary condensation of water. Nature 1981, 290, 575–576. [Google Scholar] [CrossRef]
- Fisher, L.R.; Israelachvili, J.N. Direct experimental verification of the Kelvin equation for capillary condensation. Nature 1979, 277, 548–549. [Google Scholar] [CrossRef]
- Yang, Q.; Sun, P.Z.; Fumagalli, L.; Stebunov, Y.V.; Haigh, S.J.; Zhou, Z.W.; Grigorieva, I.V.; Wang, F.C.; Geim, A.K. Capillary condensation under atomic-scale confinement. Nature 2020, 588, 250–253. [Google Scholar] [CrossRef]
- Baumgartner, B.; Hayden, J.; Loizillon, J.; Steinbacher, S.; Grosso, D.; Lendl, B. Pore Size-Dependent Structure of Confined Water in Mesoporous Silica Films from Water Adsorption/Desorption Using ATR-FTIR Spectroscopy. Langmuir 2019, 35, 11986–11994. [Google Scholar] [CrossRef]
- Cappelli, I.; Fort, A.; Lo Grasso, A.; Panzardi, E.; Mugnaini, M.; Vignoli, V. RH sensing by means of TiO2 nanoparticles: A comparison among different sensing techniques based on modeling and chemical/physical interpretation. Chemosensors 2020, 8, 89. [Google Scholar] [CrossRef]
- Asay, D.B.; Kim, S.H. Evolution of the Adsorbed Water Layer Structure on Silicon Oxide at Room Temperature. J. Phys. Chem. B 2005, 109, 16760–16763. [Google Scholar] [CrossRef]
- Asay, D.B.; Barnette, A.L.; Kim, S.H. Effects of surface chemistry on structure and thermodynamics of water layers at solid-vapor interfaces. J. Phys. Chem. C 2009, 113, 2128–2133. [Google Scholar] [CrossRef]
- Chen, L.; He, X.; Liu, H.; Qian, L.; Kim, S.H. Water Adsorption on Hydrophilic and Hydrophobic Surfaces of Silicon. J. Phys. Chem. C 2018, 122, 11385–11391. [Google Scholar] [CrossRef]
- Seo, M.-H.; Yang, H.-H.; Choi, K.-W.; Lee, J.-S.; Yoon, J.-B. A simple breathing rate-sensing method exploiting a temporarily condensed water layer formed on an oxidized surface. Appl. Phys. Lett. 2015, 106, 053701. [Google Scholar] [CrossRef]
- Su, P.G.; Huang, L.N. Humidity sensors based on TiO2 nanoparticles/polypyrrole composite thin films. Sens. Actuators B Chem. 2007, 123, 501–507. [Google Scholar] [CrossRef]
- Garcia-Belmonte, G.; Kytin, V.; Dittrlch, T.; Bisquert, J. Effect of humidity on the ac conductivity of nanoporous TiO2. J. Appl. Phys. 2003, 94, 5261–5264. [Google Scholar] [CrossRef]
- Kuang, Q.; Lao, C.; Wang, Z.L.; Xie, Z.; Zheng, L. High-Sensitivity Humidity Sensor Based on a Single SnO2 Nanowire. J. Am. Chem. Soc. 2007, 129, 6070–6071. [Google Scholar] [CrossRef]
- Seiyama, T.; Yamazoe, N.; Arai, H. Ceramic humidity sensors. Sens. Actuators 1983, 4, 85–96. [Google Scholar] [CrossRef]
- Hudson, D.R. Density and packing in an aggregate of mixed spheres. J. Appl. Phys. 1949, 20, 154–162. [Google Scholar] [CrossRef]
- Delenne, J.; Richefeu, V.; Radjai, F. Liquid clustering and capillary pressure in granular media. J. Fluid Mech. 2015, 762, R5. [Google Scholar] [CrossRef]
- Last, B.J.; Thouless, D.J. Percolation theory and electrical conductivity. Phys. Rev. Lett. 1971, 27, 1719–1721. [Google Scholar] [CrossRef]
- Ewing, G.E. Ambient thin film water on insulator surfaces. Chem. Rev. 2006, 106, 1511–1526. [Google Scholar] [CrossRef] [PubMed]
- Brubach, J.B.; Mermet, A.; Filabozzi, A.; Gerschel, A.; Lairez, D.; Krafft, M.P.; Roy, P. Dependence of water dynamics upon confinement size. J. Phys. Chem. B 2001, 105, 430–435. [Google Scholar] [CrossRef]
- Torun, B.; Kunze, C.; Zhang, C.; Kühne, T.D.; Grundmeier, G. Study of water adsorption and capillary bridge formation for SiO2 nanoparticle layers by means of a combined in situ FT-IR reflection spectroscopy and QCM-D set-up. Phys. Chem. Chem. Phys. 2014, 16, 7377–7384. [Google Scholar] [CrossRef] [PubMed]
- Kreuer, K.D. Proton conductivity: Materials and applications. Chem. Mater. 1996, 8, 610–641. [Google Scholar] [CrossRef]
- Hassanali, A.; Giberti, F.; Cuny, J.; Kühne, T.D.; Parrinello, M. Proton transfer through the water gossamer. Proc. Natl. Acad. Sci. USA 2013, 110, 13723–13728. [Google Scholar] [CrossRef]
- Agmon, N. The Grotthuss mechanism. Chem. Phys. Lett. 1995, 244, 456–462. [Google Scholar] [CrossRef]
- Chen, Z.; Lu, C. Humidity Sensors: A Review of Materials and Mechanisms. Sens. Lett. 2005, 3, 274–295. [Google Scholar] [CrossRef]
- Kano, S.; Mekaru, H. Proton transport over nanoparticle surface in insulating nanoparticle film-based humidity sensor. Jpn. J. Appl. Phys. 2022, 61, SE1011. [Google Scholar] [CrossRef]
- Fransson, T.; Harada, Y.; Kosugi, N.; Besley, N.A.; Winter, B.; Rehr, J.J.; Pettersson, L.G.M.; Nilsson, A. X-ray and Electron Spectroscopy of Water. Chem. Rev. 2016, 116, 7551–7569. [Google Scholar] [CrossRef]
- Sellberg, J.A.; Kaya, S.; Segtnan, V.H.; Chen, C.; Tyliszczak, T.; Ogasawara, H.; Nordlund, D.; Pettersson, L.G.M.; Nilsson, A. Comparison of X-ray absorption spectra between water and ice: New ice data with low pre-edge absorption cross-section. J. Chem. Phys. 2014, 141, 034507. [Google Scholar] [CrossRef]
- Petit, T.; Yuzawa, H.; Nagasaka, M.; Yamanoi, R.; Osawa, E.; Kosugi, N.; Aziz, E.F. Probing Interfacial Water on Nanodiamonds in Colloidal Dispersion. J. Phys. Chem. Lett. 2015, 6, 2909–2912. [Google Scholar] [CrossRef] [PubMed]
- Zhuravlev, L.T. The surface chemistry of amorphous silica. Colloids Surf. A Physicochem. Eng. Asp. 2000, 173, 1–38. [Google Scholar] [CrossRef]
- Yao, Y.; Chen, X.; Guo, H.; Wu, Z. Graphene oxide thin film coated quartz crystal microbalance for humidity detection. Appl. Surf. Sci. 2011, 257, 7778–7782. [Google Scholar] [CrossRef]
- Hakimian, A.; Mohebinia, M.; Nazari, M.; Davoodabadi, A.; Nazifi, S.; Huang, Z.; Bao, J.; Ghasemi, H. Freezing of few nanometers water droplets. Nat. Commun. 2021, 12, 6973. [Google Scholar] [CrossRef]
- Mohd-Noor, S.; Jang, H.; Baek, K.; Pei, Y.-R.; Alam, A.-M.; Kim, Y.H.; Kim, I.S.; Choy, J.-H.; Hyun, J.K. Ultrafast humidity-responsive structural colors from disordered nanoporous titania microspheres. J. Mater. Chem. A 2019, 7, 10561–10571. [Google Scholar] [CrossRef]
- Kim, S.; Han, S.G.; Koh, Y.G.; Lee, H.; Lee, W. Colorimetric humidity sensor using inverse opal photonic gel in hydrophilic ionic liquid. Sensors 2018, 18, 1357. [Google Scholar] [CrossRef]
- Ménil, F.; Susbielles, M.; Debéda, H.; Lucat, C.; Tardy, P. Evidence of a correlation between the non-linearity of chemical sensors and the asymmetry of their response and recovery curves. Sens. Actuators B Chem. 2005, 106, 407–423. [Google Scholar] [CrossRef]
- Steele, J.J.; Taschuk, M.T.; Brett, M.J. Response time of nanostructured relative humidity sensors. Sens. Actuators B Chem. 2009, 140, 610–615. [Google Scholar] [CrossRef]
Disclaimer/Publisher’s Note: The statements, opinions and data contained in all publications are solely those of the individual author(s) and contributor(s) and not of MDPI and/or the editor(s). MDPI and/or the editor(s) disclaim responsibility for any injury to people or property resulting from any ideas, methods, instructions or products referred to in the content. |
© 2023 by the authors. Licensee MDPI, Basel, Switzerland. This article is an open access article distributed under the terms and conditions of the Creative Commons Attribution (CC BY) license (https://creativecommons.org/licenses/by/4.0/).