Abstract
Solid-state chemiresistive gas sensors have attracted a lot of researchers’ attention during the last half-century thanks to their ability to detect different gases with high sensitivity, low power consumption, low cost, and high portability. Among the most promising sensitive materials, carbon nanotubes (CNTs) have attracted a lot of interest due to their large active surface area (in the range of 50–1400 m2/g, depending on their composition) and the fact that they can operate at room temperature. In this study, single-walled carbon nanotube (SWCNT)-based sensing films were prepared and deposited by spray deposition for the fabrication of gas sensors. For the deposition, various SWCNTs were prepared in deionized water with the addition of specific surfactants, i.e., carboxymethyl cellulose (CMC) and sodium dodecyl sulfate (SDS), which act as dispersing agents to create a suitable ink for deposition. This study aims to elucidate the possible differences in the sensing performance of the fabricated devices due to the use of the two different surfactants. To achieve this goal, all the devices were tested versus ethanol (C2H5OH), carbon monoxide (CO), nitrogen dioxide (NO2), and ammonia (NH3). The produced devices demonstrated high selectivity towards NH3 and NO2. The different sensors, prepared with different deposition thicknesses (from 0.51 nm to 18.41 nm), were tested in dry and wet conditions (40% humidity), highlighting an enhanced response as a function of relative humidity. In addition, sensor performance was evaluated at different working temperatures, showing the best performance when heated up to 150 °C. The best sensing conditions we found were against NO2, sensors with 10 layers of deposition and an operating temperature of 150 °C; in this condition, sensors showed high responses compared those found in the literature (62.5%—SDS-based and 78.6%—CMC-based). Finally, cross-sensitivity measurements showed how the produced sensors are good candidates for the practical and selective detection of NO2, even in the presence of the most important interfering gases identified, i.e., NH3.
1. Introduction
The existence of various harmful and polluting gases, including carbon monoxide (CO), carbon dioxide (CO2), ammonia (NH3), nitrogen oxide (NOx), sulfur oxide (SO2), and hydrogen (H2), has led to the development of advanced systems of gasses detection. Gas molecules are traditionally detected using gas chromatography (GC) [1] coupled to mass spectrometry (GC-MS) [2], atomic emission detection (AED) [3], and Fourier transmission infrared spectroscopy (FTIR) [4] methods, which provide accuracy, reliability, and high sensitivity [1]. However, these instruments are typically bulky, consume high power, and generally require time-consuming analyses and qualified experts for their operation and maintenance. To overcome these limitations, high-performance gas sensors are emerging as valuable alternatives to these techniques, especially in terms of the so-called “4S” rule, referring to sensitivity, selectivity to target gases, the speed of response/recovery, as well as chemical and signal stability [5]. In general, gas sensors can be classified into several main categories based on their transduction mechanisms, with some examples including surface acoustic wave (SAW) [6], electrochemical [7], catalytic [8], optical [9], quartz microbalance (QMB) [10], and chemiresistive gas sensors [11,12]. The latter group is considered an extremely attractive candidate, especially thanks to its fast response, low production cost, portability, and ease of use. In fact, chemiresistive gas sensors are employed in many fields of applications, including precision farming, the quality control of foods and beverages, the screening of clinical pathologies, and environmental protection for public safety [13,14]. The detection mechanism of chemiresistive gas sensors is based on the different interactions between a target gas (adsorbate) and the sensor surface (adsorbent), resulting in a change in the physical and/or chemical properties of the sensing layer [15,16]. In particular, the change in resistance, in the presence of different gases, is an intrinsic property of the sensing material [17].
Among the different types of sensing layers, nanostructured materials including nanowires, nanobelts, nanotubes, nanorods, and nanofibers have shown superior features such as a high surface area and stability, leading to improved sensing quality in relation to bulk materials [18,19,20,21].
An extremely promising category of nanomaterials is constituted by carbon nanotubes (CNTs), which are a graphene derivatives employed in many research fields since their discovery [22,23]. To date, different approaches can be utilized to produce CNTs, such as chemical vapor deposition (CVD), plasma-enhanced chemical vapor deposition (PECVD), laser ablation plasma-based synthesis, arc discharge evaporation, and thermal synthesis process [24]. Additionally, different types of CNTs can be synthesized i.e., single-walled carbon nanotubes (SWCNTs), double-walled carbon nanotubes (DWCNTs), and multi-walled carbon nanotubes (MWCNTs) [25,26].
SWCNTs, in particular, possess numerous attractive characteristics such as a large active surface area (range of 50–1400 m2/g depending on their composition), excellent mechanical properties, high thermal and electrical conductivities (typically 2000–6000 W/m K and 104–105 S/cm), good heat conductance, and exceptional thermal and chemical stability with appealing functionalization capability [27,28,29,30]. According to the chirality, SWCNTs can present metallic or semiconducting behaviors [31]. SWCNTs have been widely investigated for gas sensing because of their sensitivity, room temperature (RT) operation, and low limit of detection (LOD), within the ppb range (e.g., Li et al. showed a LOD of 44 ppb for NO2 [32]). Under ambient conditions, SWCNTs can be used to identify small concentrations of target molecules, resulting in high sensitivity. With regards to the sensing mechanism of SWCNT-based chemiresistive sensors, the main operating principle relies on the charge transfer that takes place between the SWCNTs and the target molecules that accept (e.g., NO2 and O2) or donate (e.g., NH3) electrons when adsorbed to the active material [33,34]. To improve the desorption process and therefore the dynamism of revelation, the thermo-activation of the sensing material is typically performed [35]. SWCNT-based chemiresistive gas sensors have shown good sensitivity to NH3, NO2, volatile organic compounds (VOCs), and humidity [36,37,38].
All these properties make SWCNTs good candidates as sensing materials and have already found potential use in many applications [39,40].
To perform a good deposition, SWCNTs are usually dispersed in a solvent (e.g., water and organic solvents). The SWCNT dispersion is commonly deposited by dip coating, spraying, and spinning on the active area [41,42,43].
However, when dispersed in a solvent, SWCNTs typically tend to bundle because of the strong π–π bonding and van der Waals forces. This is a drawback in the process of the fabrication of SWCNT-based film since, in water, they form agglomerates, leading to the deposition of non-homogeneous films. Different techniques are employed to de-bundle the aqueous dispersion of SWCNTs. One of the main techniques used for this purpose is the use of surfactants. Sodium dodecyl sulfate (SDS), sodium dodecylbenzene sulfate (SDBS), sodium cholate (SC), and dimethylformamide (DMF) are examples of various surfactants and organic solvents that can be employed to de-bundle SWCNT aggregates. In this framework, carboxymethyl cellulose (CMC) is a common cellulose derivative that is employed in a variety of applications since it is safe, biodegradable, biocompatible, and hydrosoluble. As a result, CMC stands out as an excellent candidate for SWCNT suspension [44]. On the other hand, SDS is an optimal competitor for the suspension of SWCNTs. Indeed, the presence of SDS reduces the tension surface of the water solution, and the electrostatic repulsion between SWCNTs and the hydrophilic sulfate group of SDS makes it a strong stabilizing agent for the suspension of SWCNT [45].
In this study, we focused our efforts on the detection of NH3 and NO2 gas molecules with SWCNT-based chemiresistive gas sensors. SWCNT dispersions were developed by using either CMC or SDS as dispersing agents in order to study the influence of surfactants on the SWCNT sensing performance. After spray deposition, the gas sensing properties of the devices towards different gases were investigated. First, the devices were tested in dry and wet air and different concentrations of target gases were used to identify the best possible working environment. Then, the sensors were tested on the target gases (NO2 and NH3) at different operating temperatures. The concentration of the target gas was set according to the corresponding threshold limit value (TLV), i.e., 0.2 ppm for NO2 and 25 ppm for NH3. Finally, the cross-sensitivity test was conducted to investigate the behavior of SWCNTs in complex mixtures. In the optimal-testing conditions, we recorded response values of 62.5% (SDS-based sensors) and 78.6% (CMC-based sensors) for exposure to 2 ppm NO2 (40 RH% and 150 °C). Several studies were focused on the detection of NH3 and NO2 molecules using the SWCNTs as the sensing material [38,46]. To the best of our knowledge, this is the first comparison that investigates the role of surfactants in the detection of NH3 and NO2 molecules using an MEMS-fabricated gas sensor platform and that takes into account the cross-sensitivity between the two target gas.
2. Materials and Methods
2.1. Fabrication of Microheater Chemiresistive Gas Sensing Platform
In this study, a micro-heater platform was used for gas measurement purposes. Details on the microfabrication process were previously reported [11,47]. The device includes a low-stress suspended membrane on a silicon substrate, composed of a stack of SiO2/Si3N4/SiO2 (silicon dioxide–silicon nitride–silicon dioxide), which enables low power consumption during the device heating. On the membrane, two interdigitated electrodes and a heater, separated by a layer of dielectric material, were present. Both the electrodes and the heater were made of titanium (Ti) and platinum (Pt), with thicknesses of 10 nm and 120 nm, respectively. The size of the final gas sensor substrate was and it was connected to a TO-39 (a holder enabling integration with electronics) through ball bonding (Figure 1).
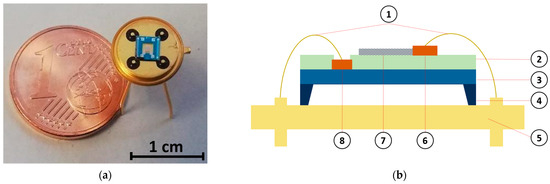
Figure 1.
Single-walled carbon nanotube (SWCNT)-based chemiresistive gas sensor. (a) Photograph image of the final device. (b) Device schematic showing the different layers composing the device: (1) electrical connections, (2) inter-metal dielectric, (3) SiO2/Si3N4/SiO2 (silicon dioxide–silicon nitride–silicon dioxide) membrane, (4) bulk silicon, (5) TO-39 holder, (6) Ti/Pt electrodes, (7) sensing material (SWCNT), and (8) Ti/Pt heater.
2.2. Preparation of SWCNT Dispersions
To disperse the SWCNTs (P3-SWCNT, Carbon Solutions, Inc., Riverside, CA, USA) in water, two different surfactants were used, i.e., CMC and SDS. They were used to disperse and untangle the SWCNT bundles. An already published procedure was used for the dispersions of SWCNTs with the two different surfactants [48].
For the CMC-SWCNT dispersions, as a first step, 0.5% wt of CMC was added to deionized (DI) water, as reported in [49,50]. A 0.05% wt concentration of SWCNTs was then mixed with the already prepared CMC stock solution. Using a horn sonicator probe (Fisherbrand FB-505), the CMC-SWCNT-based dispersion was homogenized for 25 min, alternating 50% and 30% of the power in 5 min cycles.
The resulting dispersion was centrifuged (Thermo Scientific SL 16, equipped with an F15-6 rotor, Waltham, MA, USA) for 100 min at a rotation speed of 13,000 rpm. The same procedure reported for CMC-SWCNT dispersion was used also for the dispersion of SDS-SWCNTs.
2.3. SWCNT Spray Deposition on Chemiresistive Gas Sensing Platform
SWCNTs were deposited on the microheater-based chemiresistive platform by spray deposition. For the deposition, an automated spray system (Nordson E4 EFD, UK) was used. The spray system was composed of an industrial air atomizing spray valve connected to an automated motion platform and a hot plate. For all the deposition procedures, the sample-to-nozzle distance was kept constant, whereas the hot plate temperature was kept at 70 °C to evaporate the solvent [51,52]. The previously prepared SWCNT dispersions were diluted in ratio of 1:15 in water and spray-deposited on top of the micro-heater-based silicon substrates in an intermediate spraying regime. To confine the spray deposition in the area on the interdigitated electrodes, a shadow mask was used.
A well-dispersed and high-quality residual-free SWCNT network was required for optimal charge conduction in gas sensors. To investigate the effect of different dispersants on the properties of SWCNT films and hence on their gas sensing performance, the same spray procedure was replicated for the dispersion of both CMC-SWCNTs and SDS-SWCNTs. Additionally, to obtain a better understanding of the sensing mechanism of ultra-thin SWCNT films, different film thicknesses were used, and then their sensing efficiencies were compared.
During the post-treatment, the surfactants which were used to prepare the SWCNT dispersions were removed from the deposited thin films, hence changing the film behavior from insulating to conductive.
For this purpose, as per the procedure reported by A. Abdellah et al. [53], CMC-SWCNT samples were placed in diluted nitric acid solution (HNO3—2.9 M) overnight (for ≥12 h) at room temperature. For the subsequent complete removal of the surfactant, the samples were placed in DI water for 10 min and were then annealed at 100 °C for 60 min [54]. The samples which were prepared with SDS-SWCNT dispersions were placed in DI water for 10 min under atmospheric conditions, and then annealed at 100 °C for 10 min [51]. With both surfactants, four different sensors were made with depositions of 10, 50, 100, and 150 layers, where a layer was defined as a single spray deposition.
2.4. SWCNT Material Characterization
Scanning electron microscopy (SEM) was carried out using a Jeol JSM-7401F equipped with a Bruker EDX detector to perform morphological analyses. In order to achieve the highest image quality, the working distance was changed within a range of 2–3 mm.
To analyze the morphology of the SWCNT thin films, a core atomic force microscope (AFM) from NanoSurf AG (Liestal, Switzerland) was used.
A four-point probe station was used for the characterization of the electrical proprieties of various SWCNT films.
More specifically, the characterization process was carried out using Karl Suss Manual probing station PM8 (SUSS MicroTec Semiconductor, Garching, Germany), equipped with a 4156C precision semiconductor parameter analyzer (Agilent Technologies, Santa Clara, CA, USA).
The Kratos AXIS UltraDLD instrument (Kratos Analytical, Manchester, UK) was used for the X-ray photoelectron spectroscopy (XPS) measurements. The instrument included a monochromatic Al Kα (1486.6 eV) X-ray source and a hemispherical analyzer. For the measurements, both the two surfactant-based SWCNT dispersions were spray-deposited on glass substrates with a different number of deposition layers. For all the samples, the survey and the high-resolution scans of the Na 1s, C 1s, and O 1s core levels were collected. XPS quantification was performed using the instrument sensitivity factors and the high-resolution scans. Charge compensation was achieved using a neutralizer and all the core levels were referenced to the C-C/C-H component in C 1s at 285.0 eV. All the XPS data were analyzed using the software described in [55].
2.5. Gas Measurement Setup
The as-prepared devices were then characterized in a customized gas chamber. A schematic diagram of the apparatus is depicted in Figure 2. In order to measure the sensor performances under different environmental conditions, the electrical measurements of the sensors were performed in a dedicated gas setup composed of gas cylinders, mass flow controllers, a sealed gas chamber where the devices were placed, and an electronic system for the signal read-out. With this setup, it was possible to flow a combination of carrier gases (synthetic air—80% N2; 20% O2) and target gases, which are useful in order to characterize the sensing performance of the devices in a controlled environment. For all the different tests, the total flux was kept constant at 200 sccm. Mass flow controllers were used to control the gas concentration in the gas chamber. The target gases used for this investigation were C2H5OH (ethanol), CO, NO2, and NH3. The sensor response was characterized by exposing the sample to various concentrations of the test gases, and the conductance of the films was constantly recorded through the electronic interface to the data acquisition system. The humidity level was controlled by passing an additional dry airline through a bubbler, filled with deionized water. The relative humidity in the gas chamber was measured by the SHTC3 (Sensirion) digital humidity sensor (1.0% accuracy) [47].
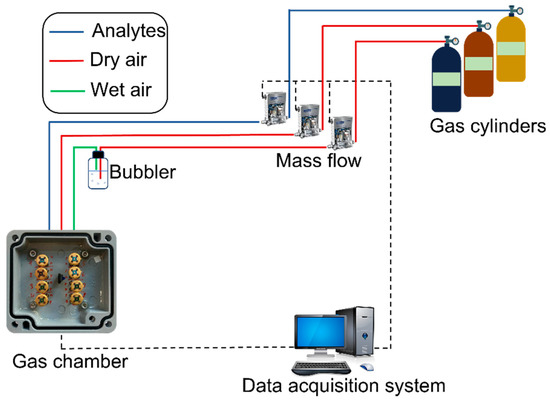
Figure 2.
Schematic representation of the experimental gas sensor testing setup.
3. Results and Discussion
3.1. SWCNT Film Characterization
The morphology, composition, and electrical proprieties were characterized by SEM, AFM, XPS, and a four-point probe station.
The SEM was used to examine the morphology of the pristine SWCNT powder, as shown in Figure 3. The SEM images of SWCNTs were obtained at various magnifications. The individual tube lengths ranged from 0.5 to 3 µm and showed an average diameter of 1.4 nm. The SWCNTs tended to occur as bundles with lengths of 1–5 µm and average diameters of 2–10 nm.
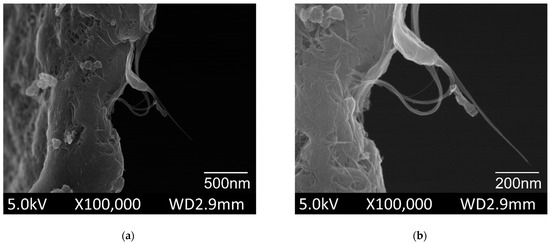
Figure 3.
Scanning electron microscopy (SEM) images of the pristine single wallet carbon nanotubes (commercial powder) (a) overview of the bundles; (b) magnification of the single tube.
The morphological characterization of the sprayed layers of CMC- and SDS-based dispersions over glass substrates was performed by AFM imaging, to evaluate the quality and homogeneity of the sprayed layers. As shown in Figure 4 and Figure 5, the concentration of the SWCNTs increased as a consequence of the number of layers increases. The bright dots visible in both figures could be surfactant residuals over the SWCNT surface. Homogeneity obtained in the deposition confirms that spray deposition was an ideal technique for obtaining the excellent deposition of SWCNTs, as also reported by Shkodra et al. [56].
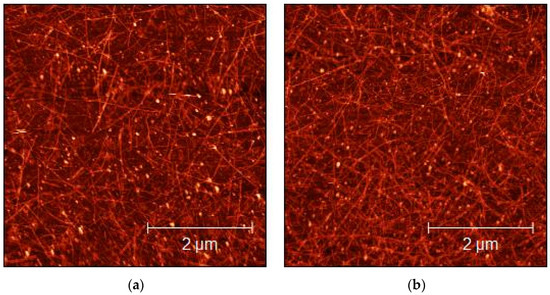
Figure 4.
AFM micrograph of 1:15 diluted CMC-SWCNT-sprayed dispersions on glass substrates: (a) 10 layers; (b) 50 layers.
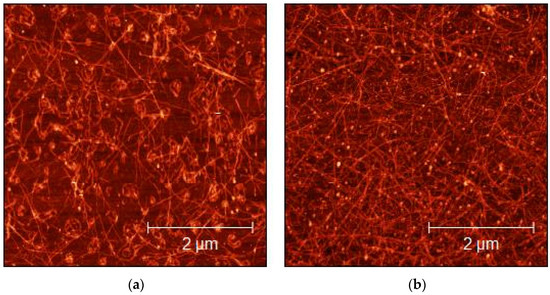
Figure 5.
AFM micrograph of 1:15 diluted SDS-SWCNT-sprayed dispersions on glass substrates: (a) 10 layers; (b) 50 layers.
To understand the chemical composition of spray-deposited films XPS analysis, which revealed the presence of sodium, oxygen, carbon, and silicon in both CMC-SWCNT and SDS-SWCNT samples (see Table 1) was performed. While the presence of Si was due to the use of quartz as a substrate for the characterization of SWCNT-based films, Na was a residue of the surfactants used to disperse the SWCNTs in water. Both CMC and SDS molecules contained Na, and its presence, albeit at a low atomic concentration (≤3%), showed that the washing step following the deposition of the SWCNT-based dispersions did not completely remove the surfactant used from the SWCNT sensing layers.

Table 1.
Quantitative elemental composition (at%) of the CMC-SWCNT (150 layers) and CMC-SDS (150 layers) films, obtained from XPS characterization.
XPS analysis showed that the elemental composition of the samples did not change significantly by changing the type of surfactant (Figure 6 and Table 1). Figure 6a,b also show the presence of specific functional groups (i.e., -C-OH, -C-O-O-, and -C=O) for both the CMC- and SDS-based films. This can be partially justified by the datasheet of the commercial SWCNTs (P3-SWCNTs) [57]; the powder was indeed purified with HNO3 and contained 1.0–3.0 % atomic% carboxylic acid. However, an increase in the -C-OH, -C-O-O-, and -C=O components for the SWCNT-CMC films compared to the SDS-SWCNT ones is shown (Figure 6a,b) [58]. The oxidation state of the SWCNTs with CMC probably increased due to the use of HNO3 during the washing treatment of the deposited layers, which allowed the surfactant to be coarsely removed from the sensing material, but at the same time, it acted as an oxidizing agent towards the SWCNTs [59].
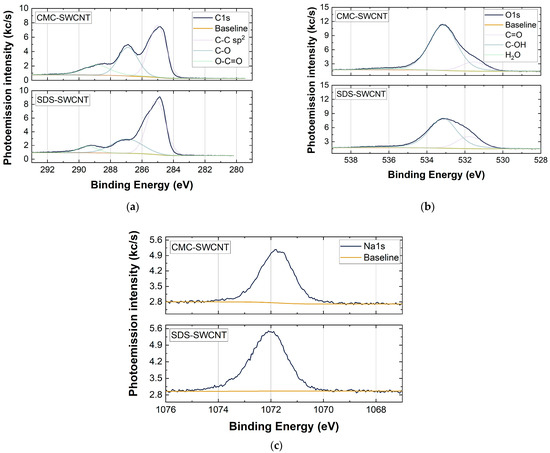
Figure 6.
XPS analysis in high-resolution scan that shows the elemental composition of the samples. The analyses refer to (a) C 1s, (b) O 1s, and (c) Na 1s core levels for the CMC-SWCNT (150 layers) and SDS-SWCNT (150 layers) samples.
XPS analysis was also used to calculate the average deposition thickness of the sprayed films by analyzing the attenuation of the photoemission intensity of the Si 2p peak relative to the quartz substrate, due to the presence of the SWCNT overlayer [60,61,62]. More specifically, we used the following equation to calculate the thicknesses of the films [60]:
where d is the thickness of the SWCNT layer; λSWCNTs is the effective attenuation length (EAL) of electrons for the SWCNT layer; I0 is the Si 2p emission intensity related to the blank quartz, not covered by the SWCNT layer; and I is the intensity of Si 2p photoelectron emission of quartz for CMC-SWCNT and SDS-SWCNT samples [60]. Since a λ value for SWCNT layers was not available in the literature, the EAL of graphene was taken into account, which could be assumed, with a good approximation, to be similar to SWCNTs [62]. As a matter of fact, in both CMC-SWCNT and SDS-SWCNT layers, the higher number of layers deposited through spray deposition resulted in a higher film thickness (Table 2). Considering the same number of layers deposited, CMC-SWCNTs were thicker than SDS-SWCNT films. This meant that during the SDS-based dispersion, more bundles of materials remained undispersed by the horn sonicator. As a result, there were more nanotubes that were not separated during the centrifugation step, leading to a lower concentration of CNTs in the dispersion. Therefore, we can assume better dispersive capabilities of CMC than SDS, which results in a faster deposition rate of CMC-SWCNT dispersions than SDS-SWCNT dispersions [51].
Table 2.
Estimated average thicknesses of the CMC-SWCNT and SDS-SWCNT films in relation to the number of layers deposited, calculated using the effective attenuation length (EAL) method on the XPS data collected.
Electrical conductivity measurements of the matrix were performed to evaluate the change in resistance according to the number of deposited layers, as shown in Figure 7. This trend highlights the typical trend of the different fillings of SWCNT films, which can be explained by the percolation theory. The percolation theory explains how the different charge transfer paths created within a non-continuous film of conducting or semiconducting materials (i.e., SWCNTs) are responsible for the final resistance of the film [63,64]. The theory is presented by:
where σ is the electrical conductivity film, σ0 is the electrical conductivity of the filler, p is the weight percentage of the filler, pc is the critical percentage of the filler (defined as the percolation threshold), and t is the critical exponent.
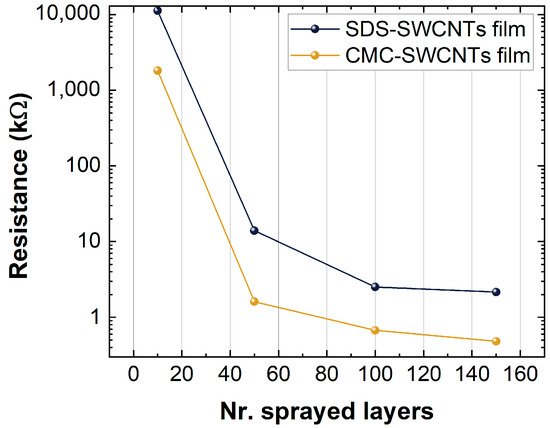
Figure 7.
Resistance values versus numbers of layers of the sprayed SDS-SWCNT film and the CMC-SWCNT film.
Indeed, as shown in Figure 7, there was a decrease in the resistance when the number of layers and deposition layers increased (increased nest filling of nanotubes); when the concentration of the filling approached the percolation threshold, the differences in resistance between the different depositions were low.
Figure 7 shows the film resistance of the CMC-based sensors and the SDS-based sensors. CMC-based sensors show a lower resistance than SDS-based ones, a result that is in accordance with the differences in thickness identified by XPS analysis. Further, the oxidation state of the SWCNTs was higher on CMC-SWCNT than SDS-based films, due to the increased concentration of -COOH groups and the p-type nature of deposited SWCNT films, resulted in further motivations to lower the resistance for CMC-SWCNT devices. Indeed, the -COOH is an electron attractor group which increases the number of holes on the SWCNTs. Since holes are the charge carriers for p-type semiconductors, the film resistance decreased, as shown in Figure 7.
3.2. Gas Sensing Performance
Regarding chemiresistive gas sensor devices, one of the most important parameters to take into account is selectivity, i.e., the ability of a sensor to respond preferentially to one chemical specie in the presence of other species. In this study, the electrical activity of the devices was tested towards CO, C2H5OH, NO2, and NH3. However, all the sensors tested did not respond to the exposure of CO and C2H5OH. We supposed this was because the high response we found with NO2 and NH3 was due to the strong interaction between SWCNTs and nitrogen molecules.
A standard measurement cycle consisted of the sensor becoming exposed to the target gas (20 min) followed by a recovery cycle, during which the target gas was removed from the chamber using the carrier gas flux, and consequently the resistance of the sensor came back to the baseline.
Since the SWCNT films act as p-type semiconductors, the responses to reducing and oxidizing agents can be calculated as:
where is the resistance of the film in air and is the resistance of the film upon exposure to the target gas.
The sensing material (i.e., SWCNT films) was found to be selective only toward NO2 and NH3. For this, the following analysis will be addressed to test the sensor’s performance with only NO2 and NH3.
Figure 8 shows the behavior of the SWCNT-based sensors when they were exposed to oxidizing (NO2) and reducing gases (NH3). In particular, the graphs show the change in the resistance when the sensors were exposed to 3 ppm of NO2 and 25 ppm of NH3. As expected, exposure to NO2 caused a decrease in the sensor resistance, while exposure to NH3 caused an increase in the resistance.
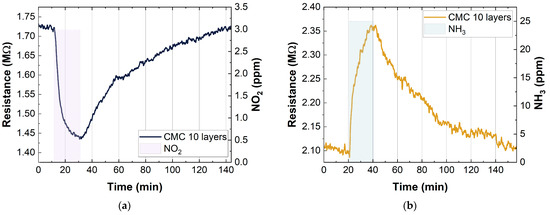
Figure 8.
Example of resistance change in CMC-SWCNT-based (p-type semiconductors) gas sensors to (a) 3 ppm NO2 and (b) 25 ppm NH3.
3.2.1. CMC-SWCNT and SDS-SWCNT Responses to NO2 and NH3 in Dry Conditions
To understand the different interactions of the CMC-based sensors and the SDS-based sensors with the two different gases, they were exposed to 1, 3, 5, and 10 ppm NO2 and 5, 15, 25, and 50 ppm NH3 at RT in dry conditions. This test was carried out with all the different depositions in order to understand the influence of deposition thickness on the sensing behavior.
Figure 9 clearly shows marked differences in the response of the various devices. As described above, considering the different deposition thicknesses, it is evident that sensors with 10 deposition layers have a greater response to the two different gases. This behavior is due to two main factors. The first is because the sensors with 10 layers of deposition are at the percolation threshold and, for this, the resistivity on the network significantly changes in response to any perturbation. The second is because a lower deposition thickness allows the exposure of a large surface area, therefore increasing the possible interactions with different gases [65]. For these reasons, the 10 layer-based gas sensors showed a high response compared to the others. Due to their high response, the subsequent analyses were only carried out on sensors with 10 layers of deposition. Figure 9 also shows some differences between the different surfactants used. In particular, SDS-based sensors showed a higher response vs. NO2 compared to CMC-based sensors (10 layers, 50 ppm NO2) (CMC sensor response: 14.1% and SDS sensor response: 19.5%), while an opposite trend is shown vs. NH3 (10 layers, 50 ppm NO2) (CMC sensor response: 13.1% and SDS sensor response: 7.8%). The differences found will be analyzed in Section 3.3.
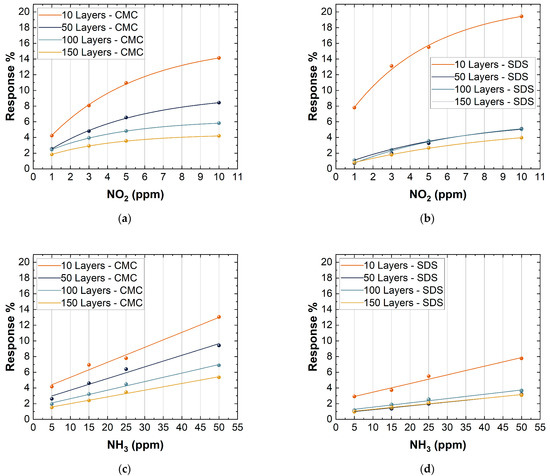
Figure 9.
Response to 1, 3, 5, and 10 ppm NO2 of: (a) CMC-based sensors with 10, 50, 100, 150 layers; (b) SDS-based sensors with 10, 50, 100, and 150 layers. Response to 5, 15, 25, and 50 ppm NH3 of: (c) CMC-based sensors with 10, 50, 100, and 150 layers; (d) SDS-based sensors with 10, 50, 100, and 150 layers.
3.2.2. Effect of the Relative Humidity (RH%) on the Sensor Response
In order to evaluate the effect of relative humidity on the SWCNT-based sensors, they were exposed to different concentrations of NO2 (1, 3, 5, and 10 ppm) and NH3 (5, 15, 25, and 50 ppm) at two different relative humidity (RH%) values. Humidity played an important role in sensing mechanisms because water molecules were adsorbed onto the sensing material and changed interactions with target gases.
The RH% was fixed at 0% in the first test and at 40% in the second test. As reported in Figure 10, all the sensors showed an increase in the response when the humidity increased.
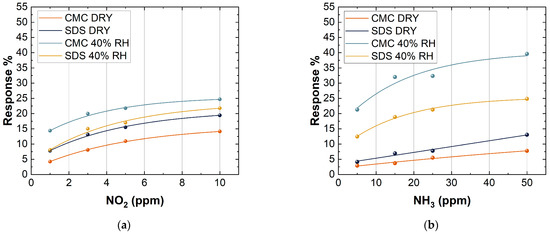
Figure 10.
Response of 10 layers of CMC- and SDS-based sensors to the exposure of (a) 1, 3, 5, and 50 ppm NO2; (b) 5, 15, 25, and 50 ppm NH3, both in dry conditions and at 40% RH.
The presence of water molecules improved the response of SWCNT-based sensors when they were exposed to NO2. The presence of water on the surface of SWCNTs may increase the interaction towards NO2 and NH3 due to the possible creation of hydrogen bonds with the gas target, resulting in an increase in the SWCNT sensing response. This was a very impressive achievement, owing to the fact that standard metal oxide semiconductor sensors usually show a dramatic decrease in the sensing response towards target gases in the presence of humidity, which strongly limits their sensitivity in real-life applications [66,67].
A higher increase in the response of CMC-based sensors towards NO2 in wet conditions may be attributed to the higher concentration of -COOH groups on the SWCNT surfaces of CMC-based samples than SDS ones. Indeed, a more oxidized surface strongly interacts with water molecules. As a consequence, the high charge separation between N and O atoms allowed NO2 to form hydrogen bonds with water.
Figure 10 also shows that there was a difference in the response between CMC-based sensors and SDS-based sensors when they were exposed to two different gases. CMC-based sensors showed a better response than SDS-based sensors when they were exposed to NH3. An inverse trend can be seen in the case of exposure to NO2. This behavior can be explained because the CMC-based sensors, inversely to others, due to the presence of -COOH groups, have a higher number of holes, thus promoting the reaction with a reducing gas such as NH3. In addition, at room temperature, there is a copresence of NO2 and its dimer (N2O4), which has a high solubility constant in water, further increasing the interaction between CMC-based sensors and NO2 [68]. Concerning NH3, a greater increase in response for the SDS-based sensors compared CMC-based ones is probably due to the lowest interaction of the SDS-based sensors with water molecules that might create a dynamic competitive reaction mechanism between H2O and NH3 on the surface of SWCNTs, increasing the response towards this target gas [69].
3.2.3. Effect of the Temperature on the Sensor Response
Despite the greatest response of SWCNT sensors at RT, the following section is focused on evaluating the effect of temperature on the SWCNT gas sensor performances. For this comparison, some tests were carried out both at room temperature and at a working temperature of 150 °C. The temperature of 150 °C was chosen according to Zhang et al. [35], where the best sensitivity of SWCNT-based gas sensors was obtained. However, the temperature used in the tests was lower considering the temperature typically used for metal oxide gas sensors (300–450 °C), i.e., the most used chemiresistive gas sensing material [70].
Figure 11 shows the response of CMC- and SDS-based sensors, with 10 layers of deposition, at two different temperatures. For these tests, the relative humidity was kept constant at 40% and the sensors were exposed to 2 ppm of NO2 and 25 ppm of NH3 for 20 min. As can be observed, all the sensors showed a better recovery to the baseline by increasing the working temperature (Figure 11 and Table 3). In particular, the recovery time values in Table 3 were calculated as the time needed by the sensors to reach a value of 1/e of the sensing response. A value of 1/e was chosen based on a first-order exponential decay, in which the mean lifetime () is equal to the opposite of the decay rate (λ) [71].
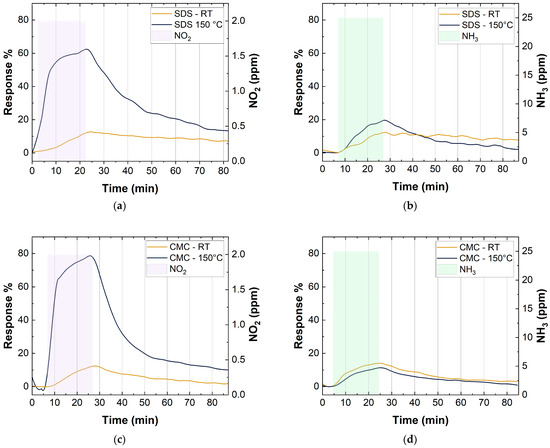
Figure 11.
(a) SDS-SWCNT response at RT and 150 °C to 2 ppm NO2; (b) SDS-SWCNT response at RT and 150 °C to 25 ppm NO2; (c) CMC-SWCNT response at RT and 150 °C to 2 ppm NO2; (d) CMC-SWCNT response at RT and 150 °C to 25 ppm NO2.
Table 3.
Time of recovery needed to reach the value of 1/e of the maximum response of 10 layers of CMC- and SDS-based sensors to the exposure of 2 ppm of NO2 and 25 ppm of NH3 at RT and at 150 °C.
Both SDS- and CMC-based sensors showed a significant improvement, of about five-fold, in the response towards NO2. In contrast, there were no great variations in the responses to NH3 by increasing the working temperature. In particular, Figure 11 shows a small decrease in the response for the CMC-based sensor and a small increase for the SDS-based sensor. The different changes in sensor responses towards NO2 and NH3, at different working temperatures, could be explained by considering the reaction mechanism of NO2 and NH3 on the SWCNT surface (Section 3.3).
Moreover, at room temperature, NO2 coexisted with its dimer in a reversible equilibrium, which can be described through the following equation: . The molecules of N2O4 had a lower electron transfer capacity to SWCNTs than NO2, so a low response was observed at room temperature. When the temperature increased, the equilibrium shifted towards NO2 (), increasing the sensing response of the devices [68].
At the temperature of 150 °C with an exposure of 2 ppm of NO2 and 40 RH%, SWCNTs achieved the best sensing condition (response of 62.5% for SDS-based sensors with 10 layers and 78.6% for CMC-based sensors with 10 layers), i.e., much higher than those reported in the literature for similar sensors (Table 4).
Table 4.
Overview of sensing performance of SWCNT-based gas sensors towards different target gasses.
3.2.4. Cross-Sensitivity Characterization
Figure 12 shows the cross-sensitivity test for the CMC-based sensor (10 layers), in the co-presence of NH3 (10 ppm) and NO2 (10 ppm) at 40% RH. We only reported the CMC-based sensor response, since the trend was similar to the SDS-based one. This test was carried out both at room temperature and at 150 °C. As mentioned above, the response of all the SWCNTs improved for the exposure to NO2 when the sensors were heated up. Conversely, there was an opposite trend when the sensor was exposed to NH3. This trend can also be seen in the measurements of cross-sensitivity. Figure 12 shows that when the sensor was exposed to the gas mixture (NO2 10 ppm and NH3 10 ppm) at RT, both gases influenced the sensor signal. On the other hand, when the sensor was thermally activated at 150 °C, the sensing response of the device only depended on NO2. This behavior shows that the selectivity of SWCNT-based sensors towards NO2 significantly improves when the sensors are heated, opening up a potential application of this device for the selective detection of this pollutant gas.
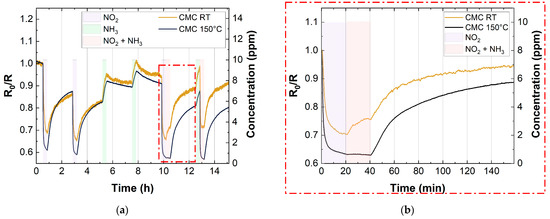
Figure 12.
(a) Cross-sensitivity of 10 layers CMC-based sensor with 10 ppm NO2 and 10 ppm NH3 at RT (yellow curve) and 150 °C (blue curve); (b) magnification that shows the increase in selectivity of SWCNT-based gas sensors vs. NO2 at 150 °C.
3.3. Sensing Mechanism
The several measurements carried out in the previous sections have shown the different sensor responses of CMC-SWCNT and SDS-SWCNT sensors towards NO2 and NH3. A possible performance interpretation of the electrical response of SWCNT films to NO2 and NH3 could be made in terms of molecular adsorption, considering the p-type character of the SWCNTs employed.
Concerning the NO2 response of all the SWCNTs tested sensors, we observed a decrease in the sensing film resistance. This behavior can be explained by the NO2 oxidizing character. Indeed, when the NO2 molecule was adsorbed on the surface of the SWCNT, a charge transfer took place from the SWCNTs to the NO2. The charge transfer is most likely a partial charge transfer from the SWCNT to NO2 of for each gas molecule adsorbed, as reported in [77]. So, to be fair, the delocalized partial charge should be represented as δ+–δ−, as reported in Equation (4). Due to the p-type character of SWCNT films, the increase in the hole concentration caused a decrease in the sensing film resistance (Figure 8a).
Regarding the sensing mechanism between SWCNTs and NO2, we can summarize the main reactions as follows (Equation (4)):
Figure 11a,c show that the sensing response of SWCNT-based sensors toward NO2 was strongly improved at the operating temperature of 150 °C, compared to measurements at room temperature (Table 3). We can describe this effect considering two different aspects. The former concerns the competitive adsorption of O2 and NO2. When the sensors are exposed to air, O2 is adsorbed on the surface of SWCNTs [78]:
The adsorption of NO2 takes place on the same active sites of O2. When the working temperature is increased, there is a high decrease in the concentration of oxygen adsorbed on the sensing material surface [79]. Therefore, considering the lower activation energy of NO2 (18.6 Kcal/mol [80]) adsorption compared to O2 (19 Kcal/mol [81]), an increased NO2 response at 150 °C can be expected [82]. For the second aspect we should consider that, at room temperature, NO2 coexists with its dimer in a reversible equilibrium, as described in the following equation: . The molecules of N2O4 have a lower electron transfer capacity to SWCNTs than NO2. When the temperature is increased, the equilibrium shifts towards NO2 (), increasing the sensing response of the devices compared to the measurements at room temperature [68].
An opposite trend is shown by the exposure of SWCNTs to NH3. Indeed, NH3 behaves, in this case, as a reducing agent. Indeed, NH3 donates electrons to the SWCNT when adsorbed on its surface, resulting in an increase in the SWCNT film resistance (Figure 8b). Furthermore, in this case, the charge transfer concerns a partial charge, which is about [77]. Unlike the case of NO2, the response to NH3 appears to be independent of working temperature (Figure 11b,d), which indicates that the detection mechanism might be the same at RT and at 150 °C. The possible sensing mechanism is reported in Equation (6):
All the sensors tested showed a better sensing performance toward NO2 vs. NH3 (Table 3). This is probably due to the adsorption energy of NO2 being greater than that of NH3 molecules on the surface of SWCNTs, owing to the different bond lengths between SWCNT-NO2 and SWCNT-NH3 [83]. In particular, in their first principle investigation, Tabtimsai et al. found a bond length of 2.804 Å between SWCNTs and NO2 and a bond length of 3.415 Å between SWCNTs and NH3 [83]. They also reported the adsorption energies between the two gases and the SWCNTs, calculated as Eads = Egas/SWCNTs − (Egas + ESWCNTs). The adsorption energy was −0.19 Kcal/mol and −3.21 Kcal/mol for SWCNT-NH3 and SWCNT-NO2, respectively. A shorter bond length and higher negative adsorption energy involve a greater interaction and charge transfer between SWCNTs and NO2 with respect to NH3. This behavior might explain the higher sensitivity and response of all the SWCNT sensors toward NO2 vs. NH3.
4. Conclusions
In this study, CMC and SDS surfactants were used as dispersing agents for the preparation of high-quality dispersions of SWCNTs. The dispersions were used as a sensing material for the fabricated gas sensors. We investigated the effect of the surfactants on the electrical response of gas sensors toward NO2 and NH3. All the steps involved in the SWCNT film fabrication were performed entirely in ambient conditions. Several techniques were used for morphological analysis including SEM, AFM, and XPS analysis, followed by electrical characterization. XPS analysis showed a higher oxidized surface for CMC-based sensors vs. SDS-based ones, due to the different washing treatments carried out to remove surfactant residuals from the devices. In particular, oxidation variations were attributable to the presence of a higher concentration of -COOH groups on the surface of CMC-SWCNTs vs. SDS-SWCNTs.
For the detection of oxidizing and reducing target gases, different types of sensors were tested according to the different deposition layers of SWCNTs. The sensors fabricated with the optimal number of layers were tested with exposure to NO2 and NH3.
SWCNT films are p-type materials, and, as can be expected, there was a decrease in the resistance of the sensors when they were exposed to NO2 (oxidizing gas) and an increase in the resistance with the exposure of the sensors to NH3 (reducing gas). Deposition thicknesses strongly influenced the sensing performance of SWCNT sensors with both surfactants tested, where the thinner the deposition the higher the sensing responses vs. the target gases. The results show different response intensities when the sensors were exposed to NH3 and NO2, probably due to the different adsorption energies between the SWCNTs and the two different gases. Indeed, SWCNT films showed higher responses vs. NO2 than NH3 for all the sensors in dry conditions. This trend reflected the same pattern of interactions that one would theoretically expect.
The most relevant differences between the two classes of sensors based on the two different surfactants were attributable to the different surface oxidation of the SWCNTs.
The effects of relative humidity and temperature on the behavior of the SWCNT-based sensors were also evaluated. Even if all the sensors also showed good performances at RT, they showed improved sensing performances at a working temperature of 150 °C, a temperature much lower compared with the temperature needed by metal oxide gas sensors. Humidity also played an important role in increasing the performances of the sensors; they also showed the highest responses by raising the relative humidity to 40%.
In the optimal-testing conditions (NO2 as the target gas, 10 layers of deposition, and an operating temperature of 150 °C), the sensors showed responses of 62.5% (SDS-based sensors) and 78.6% (CMC-based sensors) that were higher than those reported in the literature for similar SWCNT-based gas sensors (Table 4).
Eventually, cross-sensitivity characterization highlighted that, by working at a specific activation temperature in wet air, it is possible to strongly improve the selectivity of SWCNT sensors towards NO2, which opens up the potential use of this device for the detection of NO2 in real-life applications.
Author Contributions
Conceptualization, P.L., L.P. and A.G.; investigation, A.O., A.M., D.N., M.A.C.A., L.V., B.S., M.P., S.K. and A.G.; data curation, A.O., A.M. and L.V.; writing—original draft preparation, A.O. and A.M.; writing—review and editing, M.V., A.G., L.P., L.V., E.A., M.A.C.A., P.T., B.S., M.P., P.L. and S.K.; supervision, L.P., A.G. and P.L.; funding acquisition, L.P., A.G. and P.L. All authors have read and agreed to the published version of the manuscript.
Funding
This research received no external funding.
Institutional Review Board Statement
Not applicable.
Informed Consent Statement
Not applicable.
Data Availability Statement
Not applicable.
Acknowledgments
The authors express their appreciation to Michele Fedrizzi for his excellent technical assistance in carrying out the SEM measurements.
Conflicts of Interest
The authors declare no conflict of interest.
References
- Santos, F.J.; Galceran, M.T. The Application of Gas Chromatography to Environmental Analysis. Trends Anal. Chem. 2002, 21, 672–685. [Google Scholar] [CrossRef]
- Rajawat, J.; Jhingan, G. Mass Spectroscopy. In Data Processing Handbook for Complex Biological Data Sources; Elsevier: Amsterdam, The Netherlands, 2019; pp. 1–20. ISBN 978-0-12-816548-5. [Google Scholar]
- van Stee, L.L.P.; Brinkman, U.A.T.; Bagheri, H. Gas Chromatography with Atomic Emission Detection: A Powerful Technique. Trends Anal. Chem. 2002, 21, 618–626. [Google Scholar] [CrossRef]
- Ng, L.M.; Simmons, R. Infrared Spectroscopy. Anal. Chem. 1999, 71, 343–350. [Google Scholar] [CrossRef] [PubMed]
- Zhou, T.; Zhang, T. Recent Progress of Nanostructured Sensing Materials from 0D to 3D: Overview of Structure–Property-Application Relationship for Gas Sensors. Small Methods 2021, 5, 2100515. [Google Scholar] [CrossRef]
- Jakubik, W.P. Surface Acoustic Wave-Based Gas Sensors. Thin Solid Film. 2011, 520, 986–993. [Google Scholar] [CrossRef]
- Tierney, M.J.; Kim, H.O.L. Electrochemical Gas Sensor with Extremely Fast Response Times. Anal. Chem. 1993, 65, 3435–3440. [Google Scholar] [CrossRef]
- Brauns, E.; Morsbach, E.; Kunz, S.; Bäumer, M.; Lang, W. A Fast and Sensitive Catalytic Gas Sensors for Hydrogen Detection Based on Stabilized Nanoparticles as Catalytic Layer. Sens. Actuators B Chem. 2014, 193, 895–903. [Google Scholar] [CrossRef]
- Bogue, R. Detecting Gases with Light: A Review of Optical Gas Sensor Technologies. Sens. Rev. 2015, 35, 133–140. [Google Scholar] [CrossRef]
- Vashist, S.K.; Vashist, P. Recent Advances in Quartz Crystal Microbalance-Based Sensors. J. Sens. 2011, 2011, 1–13. [Google Scholar] [CrossRef]
- Gaiardo, A.; Novel, D.; Scattolo, E.; Crivellari, M.; Picciotto, A.; Ficorella, F.; Iacob, E.; Bucciarelli, A.; Petti, L.; Lugli, P.; et al. Optimization of a Low-Power Chemoresistive Gas Sensor: Predictive Thermal Modelling and Mechanical Failure Analysis. Sensors 2021, 21, 783. [Google Scholar] [CrossRef]
- Valt, M.; Caporali, M.; Fabbri, B.; Gaiardo, A.; Krik, S.; Iacob, E.; Vanzetti, L.; Malagù, C.; Banchelli, M.; D’Andrea, C.; et al. Air Stable Nickel-Decorated Black Phosphorus and Its Room-Temperature Chemiresistive Gas Sensor Capabilities. ACS Appl. Mater. Interfaces 2021, 13, 44711–44722. [Google Scholar] [CrossRef]
- Gregis, G.; Sanchez, J.-B.; Bezverkhyy, I.; Guy, W.; Berger, F.; Fierro, V.; Bellat, J.-P.; Celzard, A. Detection and Quantification of Lung Cancer Biomarkers by a Micro-Analytical Device Using a Single Metal Oxide-Based Gas Sensor. Sens. Actuators B Chem. 2018, 255, 391–400. [Google Scholar] [CrossRef]
- Fabbri, B.; Valt, M.; Parretta, C.; Gherardi, S.; Gaiardo, A.; Malagù, C.; Mantovani, F.; Strati, V.; Guidi, V. Correlation of Gaseous Emissions to Water Stress in Tomato and Maize Crops: From Field to Laboratory and Back. Sens. Actuators B Chem. 2020, 303, 127227. [Google Scholar] [CrossRef]
- Gaiardo, A.; Bellutti, P.; Fabbri, B.; Gherardi, S.; Giberti, A.; Guidi, V.; Landini, N.; Malagù, C.; Pepponi, G.; Valt, M.; et al. Chemoresistive Gas Sensor Based on SiC Thick Film: Possible Distinctive Sensing Properties Between H2S and SO2. Procedia Eng. 2016, 168, 276–279. [Google Scholar] [CrossRef]
- Gomri, S.; Seguin, J.-L.; Guerin, J.; Aguir, K. Adsorption–Desorption Noise in Gas Sensors: Modelling Using Langmuir and Wolkenstein Models for Adsorption. Sens. Actuators B Chem. 2006, 114, 451–459. [Google Scholar] [CrossRef]
- Jian, Y.; Hu, W.; Zhao, Z.; Cheng, P.; Haick, H.; Yao, M.; Wu, W. Gas Sensors Based on Chemi-Resistive Hybrid Functional Nanomaterials. Nano-Micro Lett. 2020, 12, 71. [Google Scholar] [CrossRef]
- Chen, M.; Wang, Z.; Han, D.; Gu, F.; Guo, G. Porous ZnO Polygonal Nanoflakes: Synthesis, Use in High-Sensitivity NO2 Gas Sensor, and Proposed Mechanism of Gas Sensing. J. Phys. Chem. C 2011, 115, 12763–12773. [Google Scholar] [CrossRef]
- Chowdhury, N.K.; Bhowmik, B. Micro/Nanostructured Gas Sensors: The Physics behind the Nanostructure Growth, Sensing and Selectivity Mechanisms. Nanoscale Adv. 2021, 3, 73–93. [Google Scholar] [CrossRef]
- Gaiardo, A.; Zonta, G.; Gherardi, S.; Malagù, C.; Fabbri, B.; Valt, M.; Vanzetti, L.; Landini, N.; Casotti, D.; Cruciani, G.; et al. Nanostructured SmFeO3 Gas Sensors: Investigation of the Gas Sensing Performance Reproducibility for Colorectal Cancer Screening. Sensors 2020, 20, 5910. [Google Scholar] [CrossRef]
- Chen, X.; Wong, C.K.Y.; Yuan, C.A.; Zhang, G. Nanowire-Based Gas Sensors. Sens. Actuators B Chem. 2013, 177, 178–195. [Google Scholar] [CrossRef]
- Valt, M.; Fabbri, B.; Gaiardo, A.; Gherardi, S.; Casotti, D.; Cruciani, G.; Pepponi, G.; Vanzetti, L.; Iacob, E.; Malagù, C.; et al. Aza-Crown-Ether Functionalized Graphene Oxide for Gas Sensing and Cation Trapping Applications. Mater. Res. Express 2019, 6, 075603. [Google Scholar] [CrossRef]
- Iijima, S. Helical Microtubules of Graphitic Carbon. Nature 1991, 354, 56–58. [Google Scholar] [CrossRef]
- Mubarak, N.M.; Abdullah, E.C.; Jayakumar, N.S.; Sahu, J.N. An Overview on Methods for the Production of Carbon Nanotubes. J. Ind. Eng. Chem. 2014, 20, 1186–1197. [Google Scholar] [CrossRef]
- Iijima, S.; Ichihashi, T. Single-Shell Carbon Nanotubes of 1-Nm Diameter. Nature 1993, 363, 603–605. [Google Scholar] [CrossRef]
- Bethune, D.S.; Kiang, C.H.; de Vries, M.S.; Gorman, G.; Savoy, R.; Vazquez, J.; Beyers, R. Cobalt-Catalysed Growth of Carbon Nanotubes with Single-Atomic-Layer Walls. Nature 1993, 363, 605–607. [Google Scholar] [CrossRef]
- Birch, M.E.; Ruda-Eberenz, T.A.; Chai, M.; Andrews, R.; Randal, L. Hatfield Properties That Influence the Specific Surface Areas of Carbon Nanotubes and Nanofibers. Ann. Occup. Hyg. 2013, 57, 1148–1166. [Google Scholar] [CrossRef]
- Kumanek, B.; Janas, D. Thermal Conductivity of Carbon Nanotube Networks: A Review. J. Mater. Sci. 2019, 54, 7397–7427. [Google Scholar] [CrossRef]
- Niyogi, S.; Hamon, M.A.; Hu, H.; Zhao, B.; Bhowmik, P.; Sen, R.; Itkis, M.E.; Haddon, R.C. Chemistry of Single-Walled Carbon Nanotubes. Acc. Chem. Res. 2002, 35, 1105–1113. [Google Scholar] [CrossRef]
- Dresselhaus, M.S.; Dresselhaus, G.; Charlier, J.C.; Hernández, E. Electronic, Thermal and Mechanical Properties of Carbon Nanotubes. Philos. Trans. R. Soc. Lond. Ser. Math. Phys. Eng. Sci. 2004, 362, 2065–2098. [Google Scholar] [CrossRef]
- Miyata, Y.; Yanagi, K.; Maniwa, Y.; Kataura, H. Optical Evaluation of the Metal-to-Semiconductor Ratio of Single-Wall Carbon Nanotubes. J. Phys. Chem. C 2008, 112, 13187–13191. [Google Scholar] [CrossRef]
- Li, J.; Lu, Y.; Ye, Q.; Cinke, M.; Han, J.; Meyyappan, M. Carbon Nanotube Sensors for Gas and Organic Vapor Detection. Nano Lett. 2003, 3, 929–933. [Google Scholar] [CrossRef]
- Peng, N.; Zhang, Q.; Chow, C.L.; Tan, O.K.; Marzari, N. Sensing Mechanisms for Carbon Nanotube Based NH3 Gas Detection. Nano Lett. 2009, 9, 1626–1630. [Google Scholar] [CrossRef]
- Ricca, A.; Bauschlicher, C.W. The Adsorption of NO2 on (9,0) and (10,0) Carbon Nanotubes. Chem. Phys. 2006, 323, 511–518. [Google Scholar] [CrossRef]
- Naje, A.N.; Ibraheem, R.R.; Ibrahim, F.T. Parametric Analysis of NO2 Gas Sensor Based on Carbon Nanotubes. Photonic Sens. 2016, 6, 153–157. [Google Scholar] [CrossRef]
- Pati, R.; Zhang, Y.; Nayak, S.K.; Ajayan, P.M. Effect of H2O Adsorption on Electron Transport in a Carbon Nanotube. Appl. Phys. Lett. 2002, 81, 2638–2640. [Google Scholar] [CrossRef]
- Ueda, T.; Katsuki, S.; Takahashi, K.; Narges, H.A.; Ikegami, T.; Mitsugi, F. Fabrication and Characterization of Carbon Nanotube Based High Sensitive Gas Sensors Operable at Room Temperature. Diam. Relat. Mater. 2008, 17, 1586–1589. [Google Scholar] [CrossRef]
- Lee, S.W.; Lee, W.; Hong, Y.; Lee, G.; Yoon, D.S. Recent Advances in Carbon Material-Based NO2 Gas Sensors. Sens. Actuators B Chem. 2018, 255, 1788–1804. [Google Scholar] [CrossRef]
- Wiegleb, G.; Heitbaum, J. Semiconductor Gas Sensor for Detecting NO and CO Traces in Ambient Air of Road Traffic. Sens. Actuators B Chem. 1994, 17, 93–99. [Google Scholar] [CrossRef]
- Aasi, A.; Aasi, E.; Mehdi Aghaei, S.; Panchapakesan, B. CNT Biodevices for Early Liver Cancer Diagnosis Based on Biomarkers Detection—A Promising Platform. J. Mol. Graph. Model. 2022, 114, 108208. [Google Scholar] [CrossRef]
- Holzinger, M.; Baur, J.; Haddad, R.; Wang, X.; Cosnier, S. Multiple Functionalization of Single-Walled Carbon Nanotubes by Dip Coating. Chem Commun. 2011, 47, 2450–2452. [Google Scholar] [CrossRef]
- Luo, S.; Liu, T. SWCNT/Graphite Nanoplatelet Hybrid Thin Films for Self-Temperature-Compensated, Highly Sensitive, and Extensible Piezoresistive Sensors. Adv. Mater. 2013, 25, 5650–5657. [Google Scholar] [CrossRef] [PubMed]
- Wei, B.-Y.; Hsu, M.-C.; Su, P.-G.; Lin, H.-M.; Wu, R.-J.; Lai, H.-J. A Novel SnO2 Gas Sensor Doped with Carbon Nanotubes Operating at Room Temperature. Sens. Actuators B Chem. 2004, 101, 81–89. [Google Scholar] [CrossRef]
- Miyashiro, D.; Hamano, R.; Umemura, K. A Review of Applications Using Mixed Materials of Cellulose, Nanocellulose and Carbon Nanotubes. Nanomaterials 2020, 10, 186. [Google Scholar] [CrossRef] [PubMed]
- Jiang, L.; Gao, L.; Sun, J. Production of Aqueous Colloidal Dispersions of Carbon Nanotubes. J. Colloid Interface Sci. 2003, 260, 89–94. [Google Scholar] [CrossRef]
- Quang, N.H.; Van Trinh, M.; Lee, B.-H.; Huh, J.-S. Effect of NH3 Gas on the Electrical Properties of Single-Walled Carbon Nanotube Bundles. Sens. Actuators B Chem. 2006, 113, 341–346. [Google Scholar] [CrossRef]
- Bagolini, A.; Gaiardo, A.; Crivellari, M.; Demenev, E.; Bartali, R.; Picciotto, A.; Valt, M.; Ficorella, F.; Guidi, V.; Bellutti, P. Development of MEMS MOS Gas Sensors with CMOS Compatible PECVD Inter-Metal Passivation. Sens. Actuators B Chem. 2019, 292, 225–232. [Google Scholar] [CrossRef]
- Shkodra, B.; Petrelli, M.; Costa Angeli, M.; Sarwar Inam, A.; Avancini, E.; Munzenrieder, N.; Lugli, P.; Petti, L. Flexible Carbon Nanotube-Based Electrolyte-Gated Field-Effect Transistor for Spermidine Detection. In Proceedings of the 2021 IEEE International Conference on Flexible and Printable Sensors and Systems (FLEPS), Manchester, UK, 20 June 2021; pp. 1–4. [Google Scholar]
- Falco, A.; Cinà, L.; Scarpa, G.; Lugli, P.; Abdellah, A. Fully-Sprayed and Flexible Organic Photodiodes with Transparent Carbon Nanotube Electrodes. ACS Appl. Mater. Interfaces 2014, 6, 10593–10601. [Google Scholar] [CrossRef]
- Falco, A.; Romero, F.J.; Loghin, F.C.; Lyuleeva, A.; Becherer, M.; Lugli, P.; Morales, D.P.; Rodriguez, N.; Salmerón, J.F.; Rivadeneyra, A. Printed and Flexible Microheaters Based on Carbon Nanotubes. Nanomaterials 2020, 10, 1879. [Google Scholar] [CrossRef]
- Abdelhalim, A.; Abdellah, A.; Scarpa, G.; Lugli, P. Fabrication of Carbon Nanotube Thin Films on Flexible Substrates by Spray Deposition and Transfer Printing. Carbon 2013, 61, 72–79. [Google Scholar] [CrossRef]
- Loghin, F.; Colasanti, S.; Weise, A.; Falco, A.; Abdelhalim, A.; Lugli, P.; Abdellah, A. Scalable Spray Deposition Process for Highly Uniform and Reproducible CNT-TFTs. Flex. Print. Electron. 2016, 1, 045002. [Google Scholar] [CrossRef]
- Abdellah, A.; Abdelhalim, A.; Horn, M.; Scarpa, G.; Lugli, P. Scalable Spray Deposition Process for High-Performance Carbon Nanotube Gas Sensors. IEEE Trans. Nanotechnol. 2013, 12, 174–181. [Google Scholar] [CrossRef]
- Loghin, F.; Rivadeneyra, A.; Becherer, M.; Lugli, P.; Bobinger, M. A Facile and Efficient Protocol for Preparing Residual-Free Single-Walled Carbon Nanotube Films for Stable Sensing Applications. Nanomaterials 2019, 9, 471. [Google Scholar] [CrossRef]
- Speranza, G.; Canteri, R. RxpsG a New Open Project for Photoelectron and Electron Spectroscopy Data Processing. SoftwareX 2019, 10, 100282. [Google Scholar] [CrossRef]
- Shkodra, B.; Petrelli, M.; Costa Angeli, M.A.; Garoli, D.; Nakatsuka, N.; Lugli, P.; Petti, L. Electrolyte-Gated Carbon Nanotube Field-Effect Transistor-Based Biosensors: Principles and Applications. Appl. Phys. Rev. 2021, 8, 041325. [Google Scholar] [CrossRef]
- Carbon Solutions, Inc. Available online: https://carbonsolution.com/products/p3-swn (accessed on 9 January 2023).
- Pacheco, F.G.; Cotta, A.A.C.; Gorgulho, H.F.; Santos, A.P.; Macedo, W.A.A.; Furtado, C.A. Comparative Temporal Analysis of Multiwalled Carbon Nanotube Oxidation Reactions: Evaluating Chemical Modifications on True Nanotube Surface. Appl. Surf. Sci. 2015, 357, 1015–1023. [Google Scholar] [CrossRef]
- Rosca, I.D.; Watari, F.; Uo, M.; Akasaka, T. Oxidation of Multiwalled Carbon Nanotubes by Nitric Acid. Carbon 2005, 43, 3124–3131. [Google Scholar] [CrossRef]
- Walton, J.; Alexander, M.R.; Fairley, N.; Roach, P.; Shard, A.G. Film Thickness Measurement and Contamination Layer Correction for Quantitative XPS: Contamination Layer Correction. Surf. Interface Anal. 2016, 48, 164–172. [Google Scholar] [CrossRef]
- Zemlyanov, D.Y.; Jespersen, M.; Zakharov, D.N.; Hu, J.; Paul, R.; Kumar, A.; Pacley, S.; Glavin, N.; Saenz, D.; Smith, K.C.; et al. Versatile Technique for Assessing Thickness of 2D Layered Materials by XPS. Nanotechnology 2018, 29, 115705. [Google Scholar] [CrossRef]
- Amjadipour, M.; MacLeod, J.; Lipton-Duffin, J.; Tadich, A.; Boeckl, J.J.; Iacopi, F.; Motta, N. Electron Effective Attenuation Length in Epitaxial Graphene on SiC. Nanotechnology 2019, 30, 025704. [Google Scholar] [CrossRef]
- Dang, W.; Vinciguerra, V.; Lorenzelli, L.; Dahiya, R. Printable Stretchable Interconnects. Flex. Print. Electron. 2017, 2, 013003. [Google Scholar] [CrossRef]
- Costa Angeli, M.A.; Ciocca, M.; Petti, L.; Lugli, P. Advances in Printing Technologies for Soft Robotics Devices Applications. In Advances in Chemical Engineering; Elsevier: Amsterdam, The Netherlands, 2021; Volume 57, pp. 45–89. ISBN 978-0-12-820646-1. [Google Scholar]
- Yuan, W.; Shi, G. Graphene-Based Gas Sensors. J. Mater. Chem. A 2013, 1, 10078. [Google Scholar] [CrossRef]
- Hosseini, Z.S.; Zad, A.I.; Mortezaali, A. Room Temperature H2S Gas Sensor Based on Rather Aligned ZnO Nanorods with Flower-like Structures. Sens. Actuators B Chem. 2015, 207, 865–871. [Google Scholar] [CrossRef]
- Zhu, L.; Zeng, W. Room-Temperature Gas Sensing of ZnO-Based Gas Sensor: A Review. Sens. Actuators Phys. 2017, 267, 242–261. [Google Scholar] [CrossRef]
- Santucci, S.; Picozzi, S.; Di Gregorio, F.; Lozzi, L.; Cantalini, C.; Valentini, L.; Kenny, J.M.; Delley, B. NO2 and CO Gas Adsorption on Carbon Nanotubes: Experiment and Theory. J. Chem. Phys. 2003, 119, 10904–10910. [Google Scholar] [CrossRef]
- Zahab, A.; Spina, L.; Poncharal, P.; Marlière, C. Water-Vapor Effect on the Electrical Conductivity of a Single-Walled Carbon Nanotube Mat. Phys. Rev. B 2000, 62, 10000–10003. [Google Scholar] [CrossRef]
- Barsan, N.; Schweizer-Berberich, M.; Göpel†, W. Fundamental and Practical Aspects in the Design of Nanoscaled SnO2 Gas Sensors: A Status Report. Fresenius J. Anal. Chem. 1999, 365, 287–304. [Google Scholar] [CrossRef]
- Charlton, J.L.; Henry, B.R. A Simple Method for the Determination of Phosphorescence Decay Rates. J. Chem. Educ. 1974, 51, 753. [Google Scholar] [CrossRef]
- Dasari, B.S.; Taube, W.R.; Agarwal, P.B.; Rajput, M.; Kumar, A.; Akhtar, J. Room Temperature Single Walled Carbon Nanotubes (SWCNT) Chemiresistive Ammonia Gas Sensor. Sens. Transducers 2015, 190, 8. [Google Scholar]
- Teerapanich, P.; Myint, M.T.Z.; Joseph, C.M.; Hornyak, G.L.; Dutta, J. Development and Improvement of Carbon Nanotube-Based Ammonia Gas Sensors Using Ink-Jet Printed Interdigitated Electrodes. IEEE Trans. Nanotechnol. 2013, 12, 255–262. [Google Scholar] [CrossRef]
- Kumar, S.; Pavelyev, V.; Mishra, P.; Tripathi, N. Thin Film Chemiresistive Gas Sensor on Single-Walled Carbon Nanotubes-Functionalized with Polyethylenimine (PEI) for NO2 Gas Sensing. Bull. Mater. Sci. 2020, 43, 61. [Google Scholar] [CrossRef]
- Ueda, T.; Bhuiyan, M.M.H.; Norimatsu, H.; Katsuki, S.; Ikegami, T.; Mitsugi, F. Development of Carbon Nanotube-Based Gas Sensors for NOx Gas Detection Working at Low Temperature. Phys. Low-Dimens. Syst. Nanostruct. 2008, 40, 2272–2277. [Google Scholar] [CrossRef]
- Hur, J.; Park, S.; Kim, J.H.; Cho, J.Y.; Kwon, B.; Lee, J.H.; Bae, G.Y.; Kim, H.; Han, J.T.; Lee, W.H. Ultrasensitive, Transparent, Flexible, and Ecofriendly NO2 Gas Sensors Enabled by Oxidized Single-Walled Carbon Nanotube Bundles on Cellulose with Engineered Surface Roughness. ACS Sustain. Chem. Eng. 2022, 10, 3227–3235. [Google Scholar] [CrossRef]
- Azizi, K.; Karimpanah, M. Computational Study of Al- or P-Doped Single-Walled Carbon Nanotubes as NH3 and NO2 Sensors. Appl. Surf. Sci. 2013, 285, 102–109. [Google Scholar] [CrossRef]
- Choi, S.-W.; Kim, J.; Byun, Y.T. Highly Sensitive and Selective NO2 Detection by Pt Nanoparticles-Decorated Single-Walled Carbon Nanotubes and the Underlying Sensing Mechanism. Sens. Actuators B Chem. 2017, 238, 1032–1042. [Google Scholar] [CrossRef]
- Rafati, A.A.; Hashemianzadeh, S.M.; Nojini, Z.B.; Naghshineh, N. Canonical Monte Carlo Simulation of Adsorption of O2 and N2 Mixture on Single Walled Carbon Nanotube at Different Temperatures and Pressures. J. Comput. Chem. 2010, 31, 1443–1449. [Google Scholar] [CrossRef]
- Kong, J.; Franklin, N.R.; Zhou, C.; Chapline, M.G.; Peng, S.; Cho, K.; Dai, H. Nanotube Molecular Wires as Chemical Sensors. Science 2000, 287, 622–625. [Google Scholar] [CrossRef]
- Silva-Tapia, A.B.; García-Carmona, X.; Radovic, L.R. Similarities and Differences in O2 Chemisorption on Graphene Nanoribbon vs. Carbon Nanotube. Carbon 2012, 50, 1152–1162. [Google Scholar] [CrossRef]
- Tammanoon, N.; Wisitsoraat, A.; Sriprachuabwong, C.; Phokharatkul, D.; Tuantranont, A.; Phanichphant, S.; Liewhiran, C. Ultrasensitive NO2 Sensor Based on Ohmic Metal–Semiconductor Interfaces of Electrolytically Exfoliated Graphene/Flame-Spray-Made SnO2 Nanoparticles Composite Operating at Low Temperatures. ACS Appl. Mater. Interfaces 2015, 7, 24338–24352. [Google Scholar] [CrossRef]
- Tabtimsai, C.; Wanno, B.; Utairueng, A.; Promchamorn, P.; Kumsuwan, U. First Principles Investigation of NH3 and NO2 Adsorption on Transition Metal-Doped Single-Walled Carbon Nanotubes. J. Electron. Mater. 2019, 48, 7226–7238. [Google Scholar] [CrossRef]


Disclaimer/Publisher’s Note: The statements, opinions and data contained in all publications are solely those of the individual author(s) and contributor(s) and not of MDPI and/or the editor(s). MDPI and/or the editor(s) disclaim responsibility for any injury to people or property resulting from any ideas, methods, instructions or products referred to in the content. |
© 2023 by the authors. Licensee MDPI, Basel, Switzerland. This article is an open access article distributed under the terms and conditions of the Creative Commons Attribution (CC BY) license (https://creativecommons.org/licenses/by/4.0/).