Abstract
Since the increase in the emission of various Volatiles Organic Compounds, gas and formaldehyde gas have had a harmful effect on the human body, and gas sensors that can measure those gases were fabricated in this study. After Pt coating was performed on the alumina substrate, Zn seed layers were fabricated. Nanostructures were formed through sonochemical synthesis by varying the ratio of ZnO and TiO2. Thereafter, the reactivity and recovery properties were compared and evaluated according to the concentrations of formaldehyde and toluene gas. The ZnO(99%)-TiO2(1%) gas sensor showed meaningful selectivity of about 40% or more at a concentration ranging from 5 to 20 ppm (high concentration) of formaldehyde and toluene gas, and showed a low selectivity of about 5% or more for a concentration ranging from 0.1 to 1 ppm (low concentration) of formaldehyde and toluene gas. This sensor can be optimized to have a meaningful selectivity of formaldehyde gas compared to other Volatiles Organic Compounds gases by optimizing the ZnO-TiO2 nanostructure.
1. Introduction
Since the Industrial Revolution, economic growth around the world has developed remarkably, and Korea has also achieved much economic growth. As a result, not only industrial development but also improvement of life such as food, clothing, and shelter followed. Old residential areas were remodeled, and new buildings were built on empty land. However, various compounds that are volatilized or generated from preservatives, paints, and building materials used inside and outside during the construction process quickly pollute the indoor air and cause harmful reactions to the human body. A gas sensor that can detect toxic gas is needed [1,2,3,4].
Among many types of toxic gases, Volatiles Organic Compounds gas is emitted the most during the first 6 months after a building is constructed and contains carcinogens. At this time, the most representative carcinogen and the cause of sick house syndrome is formaldehyde gas, which is easily volatilized into the atmosphere and has a harmful effect. In the measurement of volatile organic compound gases, it is difficult for humans to distinguish them, such as odors, so it is necessary to develop a sensor and a system that can measure these gases, and many studies are being conducted [5,6,7,8].
Depending on the type of gas sensor, it is possible to measure various toxic or explosive gases. As such, there are various types depending on their use and principle. Generally, depending on the sensing method, these include the semiconductor gas sensor (p-type semiconductor sensor, n-type semiconductor sensor), the electrochemical gas sensor, the thermal conduction gas sensor, and the infrared absorption scattering type, which is classified as a gas sensor, etc. [9,10,11].
The semiconductor gas sensor, which has been actively researched recently, measures the reactivity by changing the conductivity of metal oxides (ZnO, SnO, WO3, TiO2, etc.). In the case of ZnO, the general lattice constants are a = 3.250 Å, c = 5.206 Å, and the value of c/a is 1.60, which is slightly smaller than the ideal Wurtzite structure ratio of 1.633. In addition, ZnO is a material with a wide band gap (band gap energy of 3.37 eV) and has excellent thermal and chemical stability, high exciton binding energy (60 meV), and unique electrical and photoelectric properties. Since ZnO has a higher exciton binding energy than thermal energy (26 meV) at room temperature, it can be said to be the most suitable material for a UV laser device. Research on the optical properties of ZnO is mainly conducted through photoluminescence studies using a He-Cd laser (λ = 325 nm) or electron beam. Generally, ZnO has two main emission peaks. One is the near band-edge emission peak in the ultraviolet region around 380 nm due to the free exciton emission of ZnO, and the other is the deep level emission in the visible region due to defects mainly found in the region around 500~700 nm. This is caused by exciton recombination of ZnO and internal defects such as oxygen vacancy, Zn interstitial, and Zn vacancy. Due to these characteristics, the generally used ZnO-based gas sensor shows high stability and sensitivity at high temperatures and is widely used because it uses low-cost raw materials and is suitable for miniaturization [12,13,14,15,16].
There are various methods for synthesizing nanostructures, which are generally divided into vapor phase synthesis (chemical vapor deposition, organometallic chemical vapor deposition, pulsed laser deposition, etc.) and liquid phase synthesis (hydrothermal synthesis, ultrasonic chemical synthesis, etc.) [17,18,19,20]. In this study, the nanostructure of ZnO-TiO2 was synthesized through sonochemical synthesis. The advantages of the sonochemical synthesis method are the room temperature, the atmospheric pressure process, simple equipment, economical process, short reaction time, and high yield, and the disadvantage is the lack of information about the metal oxide substrate. Sonochemical synthesis proceeds through the cavitation effect. The cavitation effect occurs when ultrasonic waves pass through a medium. When ultrasonic waves pass through a medium, compression and expansion are repeated. That is, when ultrasonic waves pass through a liquid, the distance between liquid molecules as a medium repeat expansion and contraction by cycles of compression and expansion of ultrasonic waves. Due to the expansion and contraction, a large negative pressure is applied to the liquid, so that the distance between the liquid molecules becomes larger than the critical distance, and the bonds between the molecules are broken and empty spaces are created. A cavitation bubble is created by the empty space, and the cavitation bubble grows by the vaporized gas from the liquid while compressing and expanding repeatedly. The cavitation bubble that has grown to an unstable size collapses and releases energy [21].
At this time, it is generated and grown by pressure in the process of expansion, and when it exceeds the grain boundary size, it collapses in the process of compression.
In this study, a sensor part and a heater part were fabricated on both sides of an alumina substrate, a Pt and Zn seed layer was placed on the sensor part, and a ZnO- TiO2-based nanostructure sensor was fabricated by adjusting the ratio of ZnO and TiO2 using an ultrasonic chemical synthesis method. The prepared ZnO-TiO2 gas sensor was tested for sensitivity to formaldehyde gas according to the sensor operating temperature and reaction gas concentration, and the sensitivity at specific concentrations of formaldehyde and toluene gas was compared and observed. Through this, we investigated the differences and advantages and disadvantages of each sensor.
2. Materials and Methods
2.1. Sensor Fabrication
Au was coated on the front part of the 3.78 mm × 4.5 mm × 0.3 mm sensor, and Pt was coated on the rear part of the heater part. The configuration diagram of the sensor board is shown in Figure 1.
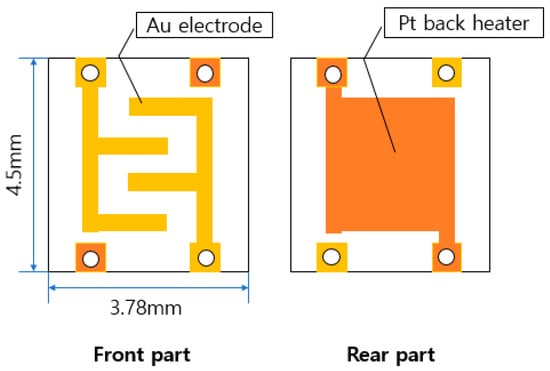
Figure 1.
Schematic diagram of the entire sensor board.
2.2. ZnO-TiO2 Composite Gas Sensor Nanostructure Fabrication
The ZnO-TiO2 gas sensor was fabricated as follows, based on the ZnO gas sensor fabricated through the conventional sonochemical synthesis method (Figure 2). Three processes were performed: pre-processing, sonochemical synthesis, and post-processing. In the pre-treatment process, Pt was deposited on the front side of the alumina substrate by using an ion coating machine for 20 mA, 60 s, and then, using sputtering equipment, power: 50 W, working pressure: 3 mtorr, Ar: 40 sccm, deposition time: 15 min. It was deposited to a thickness of 1000 Å and annealed at 600 °C for 1 h to form ZnO seeds on the deposited Zn layer. For sonochemical synthesis, two solutions of titanium isopropoxide solution (Titanium isopropoxide in 100 mL of isopropanol) and zinc acetate solution (2.2 g Zinc acetate to 12 mL of deionized water) were mixed and stirred for about 10 min. At this time, aqueous solutions of ZnO(90%)-TiO2(10%), ZnO(95%)-TiO2(5%), ZnO(99%)-TiO2(1%), and ZnO(100%)-TiO2(0%) were prepared (Table 1). After that, the sensor was fixed in the prepared aqueous solution and ultrasonicated for 15 min (pulse on 4 s-off 5 s). After that, 50 mL of NaOH (1.355 mol/L) were slowly added and the same ultrasonic treatment was performed for 20 min [22,23]. After the sonication was finished, the washing was carried out carefully to remove foreign substances, and then as a treatment process, annealing was performed at 450 °C for 2 h. After the post-processing process was completed, the gas sensor connected the heater part and the electrode part to the measuring equipment.
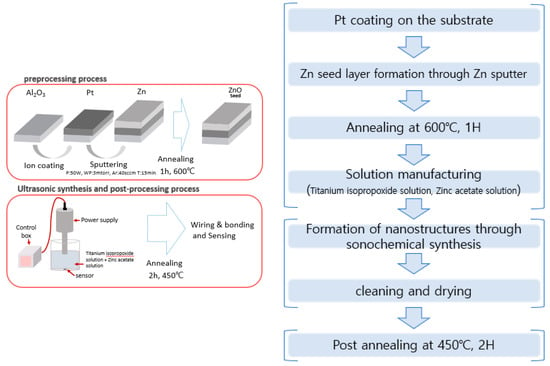
Figure 2.
The overall experimental process.

Table 1.
ZnO-TiO2 gas sensor conditions.
The ultrasonic device used in this study was a 750 W model (Sonic&Materials Inc., Newtown, CT, USA), the size of the tip of the ultrasonic device was 1/2 inch, and the ultrasonic frequency was 20 kHz.
2.3. Sensitivity Measurement of Gas Sensors
The measuring equipment used in this experiment consisted of power supply, Mass Flow Controller (MFC), Data Acquisition board (DAQ), test chamber, air gas, and target gas. To measure the reactivity and recovery of the sensor, the electrode part and the heater part were combined in the test chamber. After that, the temperature (250 °C) of the sensor was set by applying a constant voltage through the power supply. When voltage was applied, air gas was injected for 1 to 2 h to stabilize the sensor temperature to make the environment of the test chamber an air condition. After that, target gas was injected into the stabilized test chamber, and the amount of change measured in Data Acquisition board (DAQ) was observed through a program made with LABVIEW.
The sensitivity value was calculated as follows. The sensor resistance value (Ra) in the air condition and the sensor resistance value (Rg) changed in the target gas condition were calculated as the rate of change with respect to the sensor resistance value (Ra) in the air condition [24,25].
S(%) = ((Rg − Ra)/(Ra)) * 100
Figure 3 shows the experimental process to evaluate the sensitivity and recovery characteristics of the sensor. Before measuring the sensitivity, apply a voltage suitable for the temperature of 250 °C and then stabilize it in air condition for 1~2 h. Reactivity was measured by introducing target gas for 5 min, and recovery was measured by introducing air gas for 10 min.
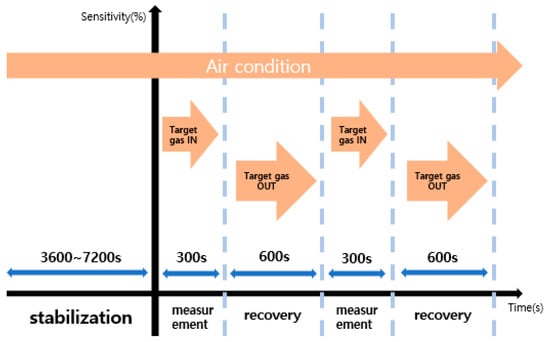
Figure 3.
Gas sensor sensitivity evaluation in progress.
2.4. Characteristics and Principles of Gas Sensors
In this study, a semiconductor gas sensor was fabricated based on ZnO-TiO2. In a semiconductor gas sensor, when a specific gas contacts the surface of the metal oxide, the electrical resistance value changes. Since the gas sensor operates by heating through the application of a voltage, the semiconductor material used must be stable at a high temperature.
The sensing principle of the semiconductor gas sensor uses non-stoichiometry, which is a characteristic of semiconductors. There are three types of defects in crystal imperfection: interstitial, vacancy, and substitutional imperfections. Interstitial refers to the presence of extra atoms between the lattices, vacancy refers to the absence of atoms at some positions, and substitutional refers to the substitution of atoms with valences different from those of the constituents.
The metal oxide used in this study contained oxygen vacancies (Vo), that is, it lacked some oxygen atoms, corresponding to vacancies. When thermal energy is applied, an oxygen vacancy exhibits n-type semiconductor characteristics in which electrons move beyond the conduction band (Ec) and react. The number and mobility of electrons that cross the conduction band vary with applied temperature, affecting the amount of adsorption and desorption of gas by changing the electrical conductivity. This phenomenon shows the sensitivity and resilience of the semiconductor gas sensor to a specific gas. The detection process of Volatile Organic Compounds reacting on the surface of the metal oxide semiconductor gas sensor is as follows [26]:
The organic compound gas undergoes an oxidation reaction on the surface of the sensing film, and as a result, the depletion layer formed by the adsorption of oxygen () on the surface of the metal oxide semiconductor is reduced, resulting in an increase in electrical conductivity. Therefore, the sensitivity of the semiconductor sensor is determined by the amount of negatively charged adsorbed oxygen () adsorbed on the surface of the metal oxide semiconductor. There are many electrons that can move freely when thermal energy is applied in the particles of metal oxide. When oxygen gas is adsorbed here, free electrons are captured by the oxygen gas on the surface of the particle. Then, a potential barrier is formed at the particle interface of the metal acid solution, and the electrical conductivity between the particles is lowered. Since reducing or combustible gases are oxidized in contact with oxygen gas, the presence of these gases removes oxygen gas adsorbed on the surface of ZnO, and free electrons captured by oxygen gas enter the ZnO particles, lowering the potential barrier, thereby reducing the electric potential between particles, and thus increasing conductivity. That is, the adsorption and desorption of oxygen gas determines the sensitivity characteristics of the sensor. Since the specific surface area of the metal oxide needs to be changed in order to change the amount of oxygen adsorption, the contact with the gas is changed according to the nanostructure of each manufactured sensor, and thus the response characteristics can be changed.
3. Results and Discussion
3.1. Structural Analysis of ZnO-TiO2 Composite Gas Sensor
3.1.1. Surface Analysis of ZnO-TiO2 Composite Gas Sensor Using FE-First
The surface of the ZnO(90%)-TiO2(10%) gas sensor fabricated through sonochemical synthesis was analyzed by FE-SEM (Field Emission Scanning Electron Microscopy, Hitachi, SU8230, Japan).
ZnO(90%)-TiO2(10%), ZnO(95%)-TiO2(5%), ZnO(99%)-TiO2(1%), and ZnO(100%)-TiO2(0%) (in Figure 4) was produced with an energy amount of about 30,000 J of ultrasonic treatment, and ZnO (in Figure 5) was a surface made using zinc nitrate hydrate. The amount of energy of ultrasonic treatment was 50,000 J and 200,000 J, respectively. In the case of the ZnO surface using zinc nitrate hydrate, it can be confirmed that nanostructures in the form of particles were formed when sonicated with an energy of 50,000 J, and nanostructures in the form of rods were formed when sonicated with an energy of 200,000 J. On the other hand, in the case of ZnO-TiO2 with a small amount of energy of 30,000 J applied during ultrasonic treatment, particle, thorn, and rods were found to be complex regardless of the ratio of ZnO-TiO2. As the ratio of TiO2 is lower, the particle shape is reduced, and the thorn and rods shape are increased. The sonochemical synthesis method used in this experiment can form various nanostructures on the surface with less energy than the previous sonochemical synthesis method using zinc nitrate hydrate.
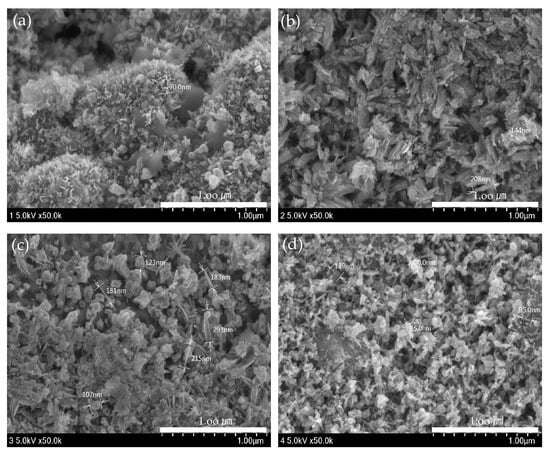
Figure 4.
ZnO-TiO2 surface observed by FE-SEM. (a) ZnO(90%)-TiO2(10%) (b) ZnO(95%)-TiO2(5%) (c) ZnO(99%)-TiO2(1%) (d) ZnO(100%)-TiO2(0%).
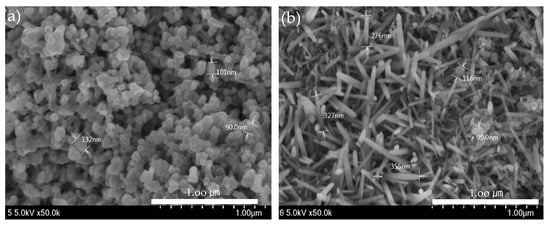
Figure 5.
ZnO surface (50,000 J) observed by FE-SEM (a) 50,000 J (b) 200,000 J.
3.1.2. Component Analysis of ZnO-TiO2 Composite Gas Sensor Using XRD
Figure 6 shows the composition and structure of a ZnO-TiO2 composite gas sensor made through sonochemical synthesis through X-ray diffractometer (Panalytical, Empyrean, UK). The growth plane directions of ZnO were measured to be (100), (002), (103), (200), and (110), (002), (121), and (311) for TiO2. Although there was a difference in the size of the peaks in the four samples, it was confirmed that they showed a similar growth direction.
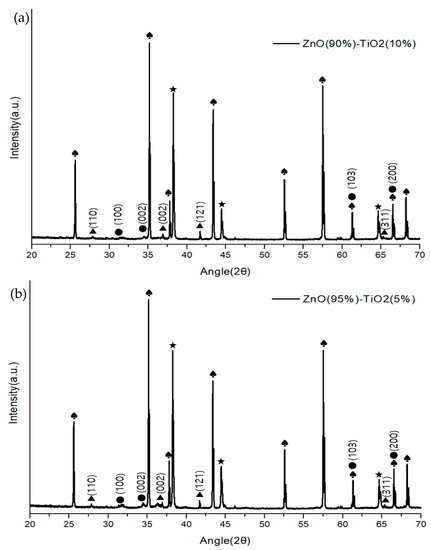
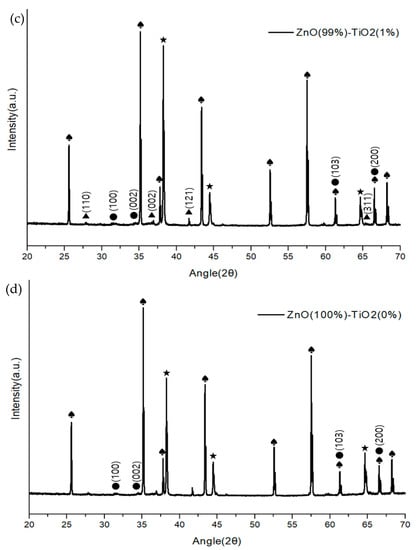
Figure 6.
XRD analysis of ZnO-TiO2 gas sensor (♠: Al2O3 ★: Au ●: ZnO ▲: TiO2). (a) ZnO(90%)-TiO2(10%) (b) ZnO(95%)-TiO2(5%) (c) ZnO(99%)-TiO2(1%) (d) ZnO(100%)-TiO2(0%).
3.2. Evaluation of Sensitivity Characteristics of ZnO-TiO2 Composite Gas Sensor Schemes
3.2.1. Evaluation of Sensitivity and Recovery According to the Ratio of TiO2 to Formaldehyde Gas
Figure 7 and Figure 8 shows Sample A (ZnO(90%)-TiO2(10%)), Sample B (ZnO(95%)-TiO2(5%)), Sample C (ZnO(99%)-TiO2(1%)), and Sample D (ZnO(100%)-TiO2(0%)) at high concentrations (5, 10, 20 ppm) and at low concentrations (0.1, 0.5, 1 ppm) show the sensitivity and recovery. In all four samples, the lower the concentration of the target gas (formaldehyde gas), the lower the sensitivity. In the case of Sample A, at 20 ppm, it showed a sensitivity of about 70%, but at 5 and 10 ppm, it showed a sensitivity of about 30% or less. At 0.1, 0.5, and 1 ppm, the sensitivity value was about 10% or less. In the case of Sample B, it showed a sensitivity of about 90% at 20 ppm, and a sensitivity of 70–80% at 5 and 10 ppm. At 0.5 and 1 ppm, the sensitivity value was about 30%, and at 0.1 ppm, the sensitivity value was about 10%. Compared to Sample A, Sample B showed a higher overall sensitivity value, and the sensitivity difference between 0.5, 1 ppm, and 0.1 ppm was shown at low concentrations. In the case of Sample C, sensitivity values such as those of Sample B are shown at 5, 10, and 20 ppm. However, it has a sensitivity value of about 30% at 1 ppm, about 20% at 0.5 ppm, and about 10% at 0.1 ppm, and the sensitivity difference gradually appears at low concentrations, unlike samples A and B. In the case of Sample D, sensitivity values of about 80% were exhibited at 20 ppm, and sensitivity values of about 60% and 70% were exhibited at 5 and 10 ppm. At 0.1, 0.5, and 1 ppm, similar sensitivity values to those of Sample C were shown, but at lower concentrations than Sample C, the sensitivity values were about 10% higher or higher.
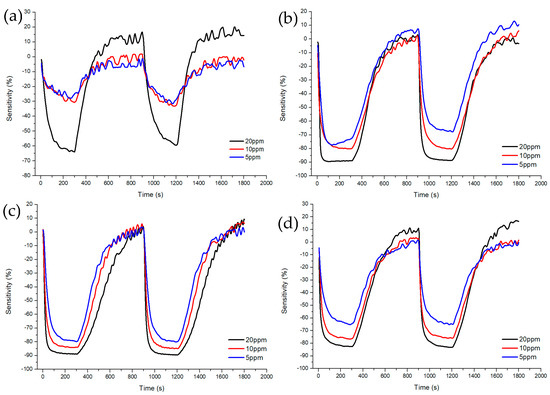
Figure 7.
Characteristics of sensitivity and recovery rate of ZnO-TiO2 gas sensor for high concentration (5~20 ppm) formaldehyde gas. (a) ZnO(90%)-TiO2(10%) (b) ZnO(95%)-TiO2(5%) (c) ZnO(99%)-TiO2(1%) (d) ZnO(100%)-TiO2(0%).
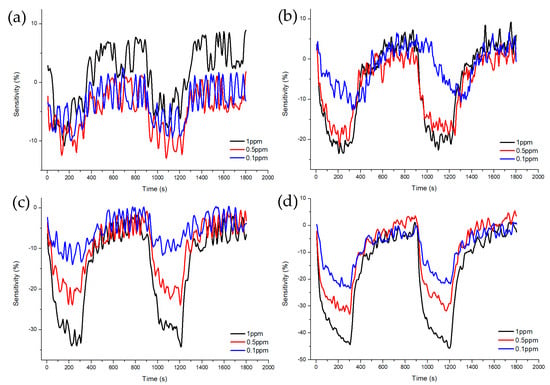
Figure 8.
Characteristics of sensitivity and recovery rate of ZnO-TiO2 gas sensor for lower concentration (1~0.1 ppm) formaldehyde gas. (a) ZnO(90%)-TiO2(10%) (b) ZnO(95%)-TiO2(5%) (c) ZnO(99%)-TiO2(1%) (d) ZnO(100%)-TiO2(0%).
At high concentrations (5, 10, 20 ppm), all four samples showed a similar pattern, but only Sample A showed low sensitivity at 5 and 10 ppm. At low concentrations (0.1, 0.5, 1 ppm), it can be clearly seen that the sensitivity of samples C and D decreased as the concentration decreased, so it can be said that it is suitable for differentiating by concentration. Therefore, it is advantageous to select samples C and D to have selectivity for each concentration of formaldehyde gas in all concentration ranges (Figure 9).
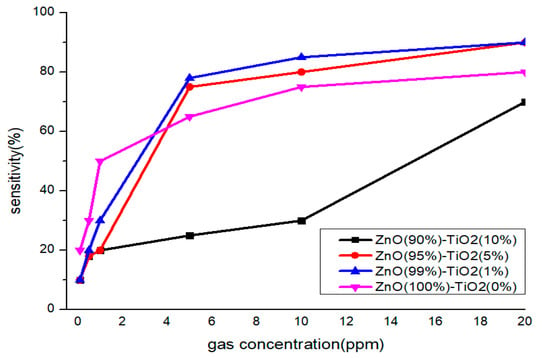
Figure 9.
Sensitivity characteristics by concentration of formaldehyde gas of gas sensor by TiO2 ratio.
After injecting the target gas for 5 min, air gas was introduced for 10 min to observe the recovery. As a result, it was confirmed that all samples exhibited about 100% recovery during the 10 min injection time. As a result of calculating the response time and recovery time of each sample, it was shown in Table 2 that, at high concentrations (5 to 20 ppm), sample B and C sensors showed fast response time and recovery times. At low concentrations (0.1~1 ppm), the Sample C sensor showed a fast response time and recovery time.
Table 2.
Summary of sensor characteristics for formaldehyde gas by sensor.
3.2.2. Comparison of the Difference in Sensitivity and Recovery According to the Ratio of TiO2 to Formaldehyde Gas and Toluene Gas
Figure 10 and Figure 11 shows Sample A (ZnO(90%)-TiO2(10%)), Sample B (ZnO(95%)-TiO2(5%)), Sample C (ZnO(99%)-TiO2(1%)), and Sample D (ZnO(100%)-TiO2(0%)) at 20 ppm and 0.1 ppm, showing the sensitivity and recovery. In the case of Sample A, at 20 ppm, a sensitivity value of about 20% higher in formaldehyde gas than in toluene gas, and a sensitivity value of about 3% higher at 0.1 ppm. In the case of Sample B, at 20 ppm, the sensitivity value was about 40% higher in the formaldehyde gas than in the toluene gas, and the sensitivity value was about 4% higher in the 0.1 ppm. In the case of Sample C, at 20 ppm, it showed a similar pattern to that of Sample B, and at 0.1 ppm, it showed about 5% higher sensitivity. In the case of Sample D, a sensitivity value of about 15% higher in formaldehyde gas than in toluene gas, and a sensitivity value of about 2–3% higher in 0.1 ppm.
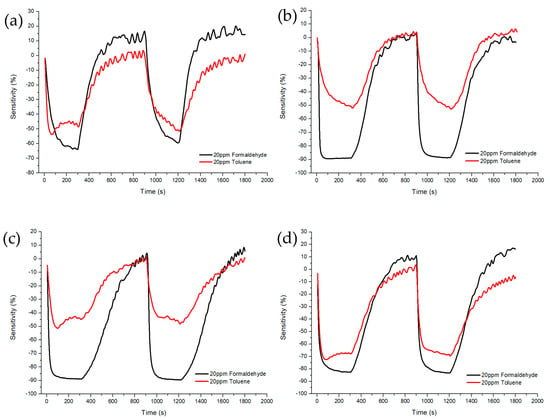
Figure 10.
Sensitivity and recovery characteristics according to concentration (20 ppm) of formaldehyde and toluene gas of ZnO-TiO2 gas sensor. (a) ZnO(90%)-TiO2 (10%) (b) ZnO (95%)-TiO2 (5%) (c) ZnO(99%)-TiO2 (1%) (d) ZnO (100%)-TiO2 (0%).
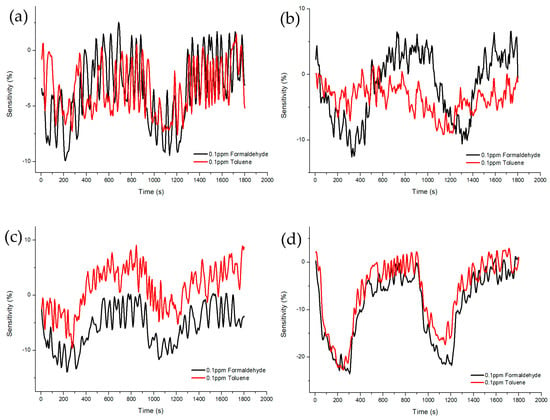
Figure 11.
Sensitivity and recovery characteristics according to concentration (0.1 ppm) of formaldehyde and toluene gas of ZnO-TiO2 gas sensor. (a) ZnO(90%)-TiO2(10%) (b) ZnO(95%)-TiO2(5%) (c) ZnO(99%)-TiO2(1%) (d) ZnO(100%)-TiO2(0%).
Samples B and C showed selectivity for formaldehyde gas and toluene gas at both 20 ppm and 0.1 ppm. It was confirmed that the sensitivity difference was high even at 20 ppm, and the sensitivity difference was higher than that of samples A and D, even at 0.1 ppm (Figure 12).
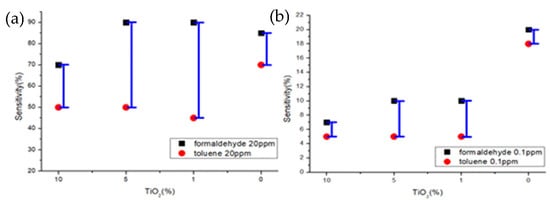
Figure 12.
Sensitivity characteristics of formaldehyde and toluene gas concentrations of gas sensor by TiO2 ratio (a) 20 ppm (b) 0.1 ppm.
After injecting the target gas for 5 min, air gas was introduced for 10 min to observe the recovery. As a result, it was confirmed that all samples exhibited about 100% recovery during the 10 min injection time.
4. Conclusions
In this study, a gas sensor was manufactured by synthesizing TiO2 with ZnO. At this time, the ratio of TiO2 was 10%, 5%, 1%, and 0%, and the sensor sensitivity to formaldehyde gas was compared. In addition, by comparing the sensitivity characteristics for formaldehyde and toluene gas, it was confirmed which ZnO-TiO2 gas sensor is more suitable.
- At high concentrations of formaldehyde gas (20, 10, 5 ppm), samples A, B, C, and D all showed similar patterns, and the lower the concentration, the lower the sensitivity. However, in Sample A, at 10 ppm and 5 ppm, aa sensitivity which was about 20–30% lower than the other samples was measured.
- At low concentrations of formaldehyde gas (1, 0.5, 0.1 ppm), the lower the concentration in samples C and D, the lower the sensitivity. Since this has selectivity for each formaldehyde gas concentration, samples C and D are more suitable as gas sensors than samples A and B in low concentration discrimination.
- When compared at 20 ppm of formaldehyde and toluene gas, the difference in sensitivity between samples A and D was about 15–20%, and the difference in sensitivity between samples B and C was about 40% or more. Samples B and C have selectivity for formaldehyde and toluene gas at 20 ppm standard and are more suitable as gas sensors.
- When compared at 0.1 ppm of formaldehyde and toluene gas, samples B and C showed a sensitivity difference of about 5% or more, and samples A and D showed almost no difference in sensitivity. Samples B and C have selectivity for formaldehyde and toluene gas at 0.1 ppm standard and are more suitable as gas sensors.
- When both the detection characteristics by formaldehyde gas concentration and the detection characteristics when comparing formaldehyde and toluene gas are considered, Sample C (ZnO(99%)-TiO2(1%)) showed the difference in sensitivity for each condition and showed the selectivity. When investigating the characteristics, it was confirmed that it is more suitable as a gas sensor than other samples.
As a result, the sensitivity was approximately 80 to 90% for high concentrations (5 to 20 ppm) of formaldehyde gas and approximately 20 to 30% for low concentrations (0.1 to 1 ppm). Compared to conventional ZnO nanostructured gas sensors, it exhibited high sensitivity even at low operating temperatures. In addition, it showed high sensitivity compared to other complex gas sensors. (Table 3.) It was confirmed that the reactivity was improved by appropriately controlling the ratio of ZnO and TiO2 and that it had selectivity according to the concentration. Likewise, it was confirmed to have selectivity to formaldehyde and toluene gas. Through these results, the possibility of a sensor having selectivity for a specific gas was confirmed. By adding various materials such as WO3 and SnO2 as well as ZnO and TiO2 in appropriate proportions, it was concluded that it would be possible to manufacture a sensor with improved sensitivity and selectivity to formaldehyde gas and other Volatiles Organic Compounds gases. The long-term stability characteristics and deterioration process of the sensor material due to corrosion by volatile substances will be evaluated through future research [27,28,29].
Table 3.
Formaldehyde gas sensitivity of ZnO-based gas sensor and TiO2 gas sensor with different morphologies.
Author Contributions
Conceptualization, J.-S.H.; investigation, J.P. and J.L.; writing—original draft preparation, J.P.; writing—review and editing, M.S.C. and J.-S.H.; supervision, J.-S.H. All authors have read and agreed to the published version of the manuscript.
Funding
This work was supported by “Human Resources Program in Energy Technology” of the Korea Institute of Energy Technology Evaluation and Planning (KETEP), financial resources were granted from the Ministry of Trade, Industry & Energy, Republic of Korea. (No. 20214000000200) and the National Research Foundation of Korea (NRF) grant funded by the Korean government (MSIT) (No. NRF-2021R1A5A8033165).
Institutional Review Board Statement
Not applicable.
Informed Consent Statement
Not applicable.
Data Availability Statement
The data that support the findings of this study are available from the corresponding authors upon request.
Conflicts of Interest
The authors declare no conflict of interest.
References
- Taurino, A.M.; Epifani, M.; Tocoli, T.; Iannotta, S.; Siciliano, P. Innovative aspecs in thin film technologies for nanostructured materials in gas sensor device. Thin Solid Film 2003, 436, 137–140. [Google Scholar] [CrossRef]
- Kim, Y.J.; Park, S.Y.; Lee, J.S.; Lee, S.H.; Woo, K.W.; Lee, S.H.; Lee, M.S. Low-temperature operation, high-sensitivity, high-selectivity NO2 gas sensor using SnO2 nanowires. J. Korean Soc. Sens. 2021, 30, 175–180. [Google Scholar]
- Saukko, S.; Lantto, V. Influence of electrode material on properties of SnO2-based gas gensor. Thin Solid Film 2003, 436, 52–63. [Google Scholar] [CrossRef]
- Wu, Q.; Lee, K.; Liu, C.C. Development of chemical sensor using microfabrication and micromachining techniques. Sens. Actuators B 1993, 14, 1–6. [Google Scholar] [CrossRef]
- Simon, I.; Barsan, N.; Bauer, M.; Weimar, U. Micromachined metal oxide gas sensors: Opportunities to improve sensor performance. Sens. Actuators B Chem. 2001, 73, 1–26. [Google Scholar] [CrossRef]
- Koh, Y.M.; Ahn, S.K.; Sung, M.K.; Lee, S.M.; Min, Y.S.; Oh, J.G.; Kim, Y.S. Measurement and evaluation of HCHO and VOCs emission characteristics of wallpaper for new apartment houses. J. Korean Soc. Living Environ. 2007, 14, 376–383. [Google Scholar]
- Horrillo, M.C.; Getierrez, J.; Sayago, I. Measurements of VOCs in soils through a tin oxide multisensor system. Sens. Actuators 1997, 43, 193. [Google Scholar] [CrossRef]
- Kim, M.K.; Park, Y.S.; Jeung, Y.J. A study on the measurement of VOCs and the effects of VOCs on the human body—Analysis of THMs in tap water in 6 major cities in Korea. Anal. Sci. 2000, 13, 55–65. [Google Scholar]
- Lee, K.H.; Lee, J.H. Special Feature: Latest Development Trends in Sensor Materials Research Trends for Indoor Air Quality Gas Sensors Using Oxide Semiconductors. Korean Ind. Chem. News 2020, 23, 32–41. [Google Scholar]
- Skoog, D.A. Principles of Instrumental Analysis; Saunders College Publishing: Mankato, MN, USA, 1985; pp. 315–361. [Google Scholar]
- Kim, J.O.; Kim, D.S.; Lee, W.S. A Comparison of Gas Sensor. In Proceedings of the Characteristic Comparison of Gas Sensors, Korean Society of Electronics Engineers Conference, Samseong-dong COEX, Seoul, Republic of Korea, 7–8 November 2016; pp. 2088–2091. [Google Scholar]
- Yamzoe, N. New approaches for improving semiconductor gas sensors. Sens. Actuators B 1991, 5, 7–19. [Google Scholar] [CrossRef]
- Tang, W.; Wang, J. Mechanism for toluene detection of flower-like ZnO sensors prepared by hydrothermal approach: Charge transfer. Sens. Actuators B Chem. 2015, 207, 66–73. [Google Scholar] [CrossRef]
- Savage, N.; Chwieroth, B.; Ginwalla, A.; Pattonm, B.; Akbar, S.; Dutta, D. Composite n-p semiconducting titanium oxided as gas sensors. Sens. Actuators B 2001, 79, 17–27. [Google Scholar] [CrossRef]
- Choi, D.H. ZnO-based Ethanol Gas Sensor. J. Sens. Sci. Technol. 2013, 22, 444–449. [Google Scholar] [CrossRef]
- Zhu, L.; Zeng, W. Room-temperature gas sensing of ZnO-based gas sensor: A review. Sens. Actuators A Phys. 2017, 267, 242–261. [Google Scholar] [CrossRef]
- Yang, P.; Yan, H.; Mao, S.; Russo, R.; Johnson, J.; Saykally, R.; Morris, N.; Pham, J.; He, R.; Choi, H.J. Controlled growth of ZnO nanowires and their optical properties. Adv. Funct. Mater. 2002, 12, 323. [Google Scholar] [CrossRef]
- Sun, Y.; Fuge, G.; Ashfold, M.N.R. Growth mechanisms for ZnO nanorods formed by pulsed laser deposition. Superlattices Microstruct. 2006, 39, 33. [Google Scholar] [CrossRef]
- Greene, L.E.; Law, M.; Goldberger, J.; Kim, F.; Johnson, J.C.; Zhang, Y.; Saykally, R.J.; Yang, P. Low temperature wafer—Scale production of ZnO nanowire arrays. Angew. Chem. Int. Ed. 2003, 42, 3031. [Google Scholar] [CrossRef] [PubMed]
- Li, Z.; Xiong, Y.; Xie, Y. Selected-control synthesis of ZnO nanowires and nanorods via a PEG-assisted route. Inorg. Chem. 2003, 42, 8105. [Google Scholar] [CrossRef]
- Birkin, P.R.; Power, J.F.; Leighton, T.G.; Vincü otte, A.M.L. Cathodic electrochemical detection of sonochemical radical products. Anal. Chem. 2002, 74, 2584. [Google Scholar] [CrossRef] [PubMed]
- Wattanawikkam, C.; Pecharapa, W. Synthesis and Characterization of Zn-Doped TiO2 Nanoparticles via Sonochemical Method. Integr. Ferroelectr. 2015, 165, 167–175. [Google Scholar] [CrossRef]
- Bhanvase, B.A.; Veer, A.; Shirsath, S.R.; Sonawane, S.H. Ultrasound assisted preparation, characterization and adsorption study of ternary chitosan-ZnO-TiO2 nanocomposite: Advantage over conventional method. Ultrason. Sonochemistry 2019, 52, 120–130. [Google Scholar] [CrossRef]
- Park, S.M.; Zang, S.L.; Huh, J.S. NO Sensing Characteristics of ZnO Nanorod Prepared by Ultrasound Radiation Method. Korean J. Mater. Res. 2008, 18, 367–372. [Google Scholar] [CrossRef]
- Kiyoshi, T. Sehwa. In Sensor Dictionary; Ryong, P., Ed.; Saehwa Publishing Company: Paju, Gyeonggi-do, Republic of Korea, 1998. [Google Scholar]
- Mason, T.J. An Introduction to the Uses of Power Ultrasound in Chemistry, in Sonochemistry; Oxford University Press: Oxford, UK, 1999; pp. 1–41. [Google Scholar]
- Kwon, D.H. Analysis of the Response Characteristics of Toluene Gas Sensors with a ZnO Nanorod Structure by a Heat Treatment Process. Sensors 2022, 22, 4125. [Google Scholar] [CrossRef] [PubMed]
- Manikandan, V.; Vigneselvan, S.; Iulian, P.; Rajaram, S.M.; Ajeet, S.; Kamil, S.; Chandrasekaran, J. Long-lasting stability and low-concentration SO2 gas detection aptitude of Sn-doped alumina sensors. Mater. Chem. Phys. 2022, 291, 126691. [Google Scholar]
- Lee, J.H.; Lim, S.H. Review on Sensor Technology to Detect Toxic Gases. J. Sens. Sci. Technol. 2015, 24, 311–318. [Google Scholar] [CrossRef]
- Yoon, J.H.; Lee, H.J.; Kim, J.S. Formaldehyde Gas-Sensing Characteristics of SnO2-ZnO Materials. Korean J. Met. Mater. 2009, 48, 169–174. [Google Scholar] [CrossRef]
- Chen, D.; Yuan, Y.J. Thin-Film Sensors for Detection of Formaldehyde: A Review. IEEE Sens. J. 2015, 15, 6749–6760. [Google Scholar] [CrossRef]


Disclaimer/Publisher’s Note: The statements, opinions and data contained in all publications are solely those of the individual author(s) and contributor(s) and not of MDPI and/or the editor(s). MDPI and/or the editor(s) disclaim responsibility for any injury to people or property resulting from any ideas, methods, instructions or products referred to in the content. |
© 2023 by the authors. Licensee MDPI, Basel, Switzerland. This article is an open access article distributed under the terms and conditions of the Creative Commons Attribution (CC BY) license (https://creativecommons.org/licenses/by/4.0/).