Abstract
In this work, we propose a potentiometric smart sensor for lithium detection in environmental samples based on a screen-printed cell. The graphite screen-printed electrode (GSPE) was first modified by gold and silver nanoparticles to increase the conductivity, and then by an ion-selective membrane, which was directly deposited onto the nanostructured electrode surface. The potentiometric cell, thanks to its small size, was integrated with a portable instrument connected to a smartphone for decentralized analysis. The developed sensor was used in drop- and microflow-configurations and showed a high sensitivity for lithium with a low detection limit (1.6 µM). It was also applied in the analysis of real samples from the industrial recycling of automotive batteries and complex matrices, such as contaminated soils.
1. Introduction
Over the past decades, the production and consumption of lithium have increased at an average of approximately 3% per annum. Lithium and its compounds indeed own a strategic importance as they have several industrial applications, among which the most well-known are lithium and lithium-ion batteries (LIBs). LIBs are the primary driving force in the increase of lithium production, as they offer a viable alternative to other rechargeable batteries in terms of costs, number of charge–discharge cycles, and high-performance results [1]. In addition, they have also become a promising option for the fueling of electrical vehicles (EVs) and the reduction of CO2 emissions, which is increasingly salient due to the societal awareness of climate change [2,3]. Consequently, the exploitation of mineral deposits to provide the raw material required by the LIBs market has been subjected to a rapid increase [4]. Recycling processes (e.g., hydrometallurgical separation) thus represent a sustainable option for the reintroduction of LIB compounds into the economic cycle, reducing both the need for primary raw materials, the generated byproducts, and the impact on the environment, including the health of fauna and flora [5,6,7]. However, only a few metals with high economic value are recycled from exhausted batteries as such approaches could involve complex processes. This is part of the reason why spent LIBs have been treated as waste ever since the first commercial cells hit the market in the early 1990s: it was often cheap enough to dump old batteries and mine the virgin material [8].
Considering what has just been discussed, the importance of developing a fast and cost-effective analytical technique to help increase both the efficiency of the recycling process and quality control in terms of environmental pollution becomes increasingly urgent.
From this perspective, electrochemical sensors like ion-selective electrodes (ISEs) are a promising alternative to most of the existing analytical techniques for lithium detection (e.g., inductively coupled plasma—ICP, atomic absorption spectroscopy—AAS, ionic chromatography—IC) for an accurate in situ monitoring and analysis [9,10], as they provide rapid results and are small and cost-effective. Lithium detection by potentiometric sensors has been accomplished through various approaches, including those that rely on crystalline membranes. Freitas et al. modified a carbon-paste electrode (CPE) with an aluminum-doped, spinel-type manganese oxide, retrieving a super-Nernstian response towards lithium [11]. Nel-lo et al. used two different solid-state electrolytes with a garnet-type crystal structure for lithium detection in molten Pb-Li alloys as the sensing element [12].
In the case of alkali metals, the coupling of electrochemical techniques to macrocyclic molecules (i.e., ionophores) can yield high sensitivity, reproducibility, low detection limits, and high selectivity due to the complementarity between the electrostatic properties of the macrocyclic cavity and those of the metal cation. Potentiometric ISEs based on an ionophore-containing membrane of polyvinyl chloride (PVC) have been developed for the detection of potassium and sodium ions [13,14]. Regarding lithium detection, the potentiometric approaches based on polymeric ion-selective membranes are reported in Table 1.

Table 1.
Lithium detection by potentiometric sensors based on a polymeric ionophore-containing membrane.
Portable devices can also be designed, taking advantage of the aforementioned characteristics, which could allow an accurate in situ detection of lithium, whether in hospitals remote locations, landfill sites, or offshore monitoring [19].
In fact, screen-printed cells (SPCs) opened new opportunities to apply electrochemical techniques for environmental in situ analyses, providing an analytical tool to satisfy the increasing demand of the rapid, sensitive, and selective determination of a wide range of analytes. The most attractive features of these transducers are undoubtedly their low cost and versatility [20]; moreover, to enhance their sensing performance, nano-modified electrode surfaces can be exploited to retrieve a specific electrochemical behavior depending solely on the nature of the modifier [21,22]. Moreover, SPCs integrated into flow injection analysis (FIA), batch injection analysis (BIA), and high-performance liquid chromatography (HPLC) have been adopted in a variety of analytical studies [23]. The combination of SPCs and flow systems increases the throughput of measurements, improves electrodes lifetime, and reduces reagent consumption and waste generation beyond simplifying and streamlining the analysis of the low volumes of samples, which is extremely critical for on-spot environmental analysis [24,25,26,27,28].
Motivated by the aforementioned reasons, the authors in this work propose a smart potentiometric solid-contact sensor for lithium detection based on silver and gold nanoparticles-modified graphite screen-printed electrodes ((Au&Ag)NPs/GSPEs) and a PVC-based ion-selective membrane. It is known that bimetallic nanoparticles possess excellent electrochemical properties due to synergistic and electronic effects: among them, the Ag-Au bimetallic catalysts have drawn much attention due to their electronic, optical, and catalytic properties which differ from those of individual mono metals [29]. To the best of our knowledge, only one example of a potentiometric screen-printed sensor based on platinum and gold nanostructures and a polymeric membrane for lithium detection in human perspiration was reported in the literature; this showed a slightly higher sensitivity but also a higher detection limit compared to our sensor, and it was not integrated with a microflow setup [30,31]. In our case, the use of silver nanoparticles coupled to gold ones enhanced the sensing performance of inexpensive graphite electrodes, lowering the production cost of the sensors with respect to the use of platinum. Moreover, the relative amounts of membrane-cocktail components, which were already known to work properly for lithium detection, were varied in order to improve the features of the sensor; finally, a study on the proper amount of the membrane cocktail to be deposited completes the optimization of the sensor. A good Nernstian response from the sensor (~58 mV/decade) was then retrieved; the selectivity was also thoroughly investigated. The developed sensors were ready to use and, in contrast to most of the reported ion-selective devices, no electrode conditioning was required before performing the measurements. This ion-selective solid-contact sensor was integrated into a smart setup comprising a pocket instrument connected to a smartphone to perform drop and microflow measurements for on-spot decentralized analysis. To assess the applicability of the developed device, lithium was also detected in waste liquids from an industrial recycling process of exhausted batteries and in contaminated soils, which, to the best of our knowledge, was not performed in any of the reported previous studies.
2. Materials and Methods
2.1. Chemicals
Tetrachloroauric acid (HAuCl4), silver nitrate (AgNO3), sulfuric acid 95–97% (H2SO4), sodium nitrate (NaNO3), potassium ferrocyanide K4[Fe(CN)6], potassium ferricyanide K3[Fe(CN)6], potassium chloride (KCl), 6,6-dibenzyl-1,4,8-11-tetraoxacyclotetradecane (lithium ionophore VI), potassium tetrakis (4-chlorophenyl) borate (K-TCPB), 2-nitrophenyl octyl ether (NPOE), polyvinyl chloride (PVC) high molecular weight, tetrahydrofuran (THF), lithium chloride (LiCl), magnesium chloride (MgCl2), ammonium chloride (NH4Cl), sodium chloride (NaCl), and calcium chloride (CaCl2) were purchased from Merck (Darmstadt, Germany). All solutions were prepared using MilliQ water (obtained from Milli-Q Water Purification System, Millipore, UK).
2.2. Instrumentation
Screen-printed electrochemical cells (SPCs) based on a graphite-working electrode, a graphite-counter electrode, and a silver pseudo-reference electrode (EcoBioServices srl, Sesto Fiorentino, Italy) were used for the electrochemical experiments. The open circuit potential (OCP) measurements were carried out at room temperature using Sensit Smart portable potentiostat/galvanostat (PalmSens BV, Houten, The Netherlands) connected to an Android© smartphone equipped with PSTouch software for data acquisition and elaboration. Potentiometric measurements were also performed with a commercial lithium ion-selective electrode (DX207-Li ISE half-cell electrode, ref. 51107673) and an Ag/AgCl reference electrode (pH electrode InLab reference, ref. 51343190) purchased from Mettler-Toledo S.p.A. (Milan, Italy). The peristaltic pump needed for flow measurements was purchased from Gilson Inc., USA. Dropsens wall-jet microflow cell (ref. DRP-FLWCL) was purchased from Metrohm (Milan, Italy). Scanning electron microscopy (SEM) analysis was carried out using a Gaia 3 microscope (Tescan a.s., Brno, Czech Republic). SEM images were acquired using an acceleration voltage of 5 kV for the bare-graphite electrodes and 20 kV for the nanostructured electrodes. Energy dispersive X-ray analysis (EDX) was performed to assess the elemental composition of the modified electrode surface.
2.3. Preparation of (Au&Ag)NPs-Modified Graphite Screen-Printed Electrodes
The surface of the graphite screen-printed electrode (GSPE) was modified with silver and gold bimetallic nanoparticles ((Au&Ag)NPs) using cyclic voltammetry (CV) to produce an enhancement of the electrochemical behavior of the GSPE. Firstly, 2.5 mM of AgNO3 in a 0.1 M NaNO3 solution was dropped onto the GSPE surface. The potential was cycled from −1.0 V to +0.5 V vs. Ag/AgCl pseudo-reference electrode for 10 times at a 50 mV/s scan rate. Successively, the AgNPs-modified GSPE was washed for three times with deionized water to remove the excess of free ions from the surface. A solution of 2.5 mM HAuCl4 in 0.5 M H2SO4 was dropped onto the AgNPs-modified graphite electrode. The potential was cycled from −0.2 V to +1.6 V vs. Ag/AgCl pseudo-reference electrode for 10 times at a 100 mV/s scan rate. The (Au&Ag)NPs/GSPE was then washed with deionized water for three times.
2.4. Study of the Electrochemical Performance of (Au&Ag)NPs-Modified Graphite Screen-Printed Electrodes
To gain insights into the electrochemical enhancement produced by the nanostructuration of the electrode surface, CV measurements were performed with the (Au&Ag)NPs/GSPE by dropping 50 μL of 5 mM [Fe(CN)6]−4/−3 as a redox-probe (equimolar mixture prepared in 0.1 M KCl) solution.
CV measurements were carried out in a range of potentials between −0.5 V and +1.0 V at different scan rates (25, 50, 100, 125, and 150 mV/s). The current peak height was taken as the electrochemical signal and plotted vs. the square root of the scan rate (V/s), and a linear behavior was retrieved. Then, the electroactive area was calculated from the angular coefficient of the obtained linear regression with the Randles–Sevcik equation [32]:
where n is the number of electrons transferred in the redox events, F is the Faraday constant (C/mol), A (cm2) is the electrode surface area, R is the gas constant (8.314 J/(mol·K)), Do (cm2/s) is the diffusion coefficient of the oxidized analyte, and C0 (mol/cm3) is the analyte bulk concentration. After each CV measurement, the SPCs were discarded.
SEM analysis was performed to assess the morphological characterization of the nanostructured GSPE surface. In particular, the morphology of the graphite electrode was investigated before and after the electrochemical nanostructuration of the substrate material.
2.5. Preparation of Solid-Contact Lithium Sensor
The lithium-selective membrane was realized using a cocktail consisting of 28% (w/w) PVC, 1% (w/w) lithium ionophore VI, 0.2% (w/w) K-TCPB, and 70.8% (w/w) NPOE for 100 mg of mixture dissolved in 1 mL of THF. The mixture was left to stir for 1 h with a magnetic stirrer. After this, 5 μL of this solution was drop-casted onto the (Au&Ag)NPs/GSPE. After completing the drop-casting procedure, the sensor was left to air-dry overnight in dark conditions to allow for the complete evaporation of the solvent.
2.6. Lithium Detection
The potentiometric cell was integrated into a smart setup where the portable Sensit Smart potentiostat was connected to a smartphone for OCP measurements, which were performed both in drop and in microflow configurations, without any conditioning of the sensor, for a total running time of 100 s each to assure a stable OCP response. Drop measurements were carried out by depositing 50 μL of standard solution onto the SPC, while flow measurements were performed using the wall-jet microflow cell with a flow rate of 0.2 mL/min. The response time was evaluated as the time required for the OCP to reach 90% of the maximum potential value [33]. The standard solutions were analyzed in the range of 10−5–10−1 M using a 0.05 M MgCl2 solution as the supporting electrolyte.
The schematic representation of lithium detection with the described microflow configuration is reported in Figure 1.
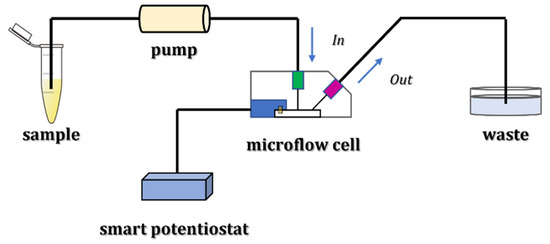
Figure 1.
Experimental setup for lithium detection using a microflow configuration.
After each set of measurements, the sensor was washed with a 0.05 M MgCl2 solution to keep the same experimental conditions for the subsequent measurements.
To obtain a calibration curve, OCP values were plotted vs. the logarithm of lithium concentration, and the experimental points were fitted with a linear regression. The detection limit was calculated according to Bakker & Pretsch [34]. Briefly, the potentiometric response is a linear function of the logarithm of the activity of lithium in solution, and its slope is described by the Nernst equation. Below the LOD, it has a constant value, which is ideally defined by the response of the sensor to another ion (i.e., the supporting electrolyte). The potentiometric LOD is then defined as the cross-section of the two linear parts of the response function.
The sensor was stored in dry and dark conditions between day-to-day measurements. In this way, the sensor could be used for at least ten calibrations with good reproducibility, as the relative standard deviation (RSD) was lower than 10%.
2.7. Fixed Interference Method (FIM)
The selectivity of the developed membrane was assessed by evaluating its selectivity coefficient toward potential interfering ions, such as potassium, sodium, ammonium, and calcium ions. OCP measurements were performed in solutions at a constant activity of the interfering ion (i.e., K+, Na+, NH4+, Ca+2), aB, and varying activity of the primary ion (i.e., Li+), aA. The measured potential values are plotted vs. the logarithm of the activity of a Li+ ion. The intersection of the extrapolated linear portions of this plot indicates the value of aA that is to be used to calculate KpotA,B from the following equation:
where both zA and zB (i.e., the charge of the ions) have the same sign [35].
2.8. Real Samples Analysis
Preliminary experiments to assess the determination of lithium ions in real samples by the developed sensor were also performed. The sensor’s response was determined by OCP measurements.
Samples deriving from an industrial process of recycling automotive batteries were diluted at a proper ratio (from 1:5 up to 1:200) in 0.05 M MgCl2 before the analysis with the standard addition method in drop and microflow configurations. Lithium concentration in the samples was then calculated by applying the following equation:
where Csample and Vsample are the concentration and the volume of the sample, Cstd and Vstd are the concentration (1 M) and the volume of the added lithium standard solution, respectively, S is the slope of the calibration curve, and ΔE is the potential variation due to the addition of the standard.
The application of the developed potentiometric platform for the analysis of lithium in complex matrices such as contaminated soils was also demonstrated. Soil samples (~1 g) were mixed with H2O2 and aqua regia (HCl/HNO3 3:1 v/v, ~18 g) and then loaded in a microwave oven. Initially, the samples were irradiated for 20 min, to raise their temperature from 20 °C to 200 °C. A maximum power of 1600 W then maintained the temperature constant at 200 °C for at least 3 h. The resulting suspension was then filtered and diluted as required in the supporting electrolyte, and the obtained solution was used for lithium-standards preparation. The results were then compared with those obtained by a commercial lithium ISE.
3. Results and Discussion
3.1. (Au&Ag)NPs Electrodeposition and CV Characterization
The electrochemical performance of graphite screen-printed electrodes (GSPEs) in terms of conductivity and electroactive surface area was enhanced by the electrodeposition of silver and gold nanoparticles ((Au&Ag)NPs) using cyclic voltammetry. Figure 2 shows the typical cyclic voltammograms recorded during the electrodeposition of AgNPs (a) and AuNPs (b), respectively. The deposition scans show that the current of all peaks appearing in the voltammograms increases with an increase in the number of cycles up to the 10th cycle. No significant difference was observed in the peak current if the number of cycles was increased from 10 to 20 in both cases. Therefore, 10 cycles were used in the following experiments for AgNPs and AuNPs electrodeposition.
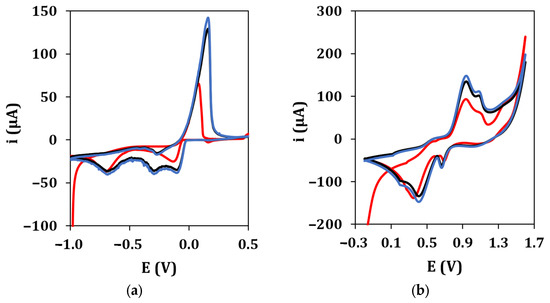
Figure 2.
(a) AgNPs electrodeposition from a 2.5 mM AgNO3 solution in 0.1 M NaNO3 (•: 1st cycle, •: 10th cycle, •: 20th cycle). Experimental conditions: potential range from −1.0 V to +0.5 V, 50 mV/s scan rate. (b) AuNPs electrodeposition from a 2.5 mM HAuCl4 solution in 0.5 M H2SO4 (•: 1st cycle, •: 10th cycle, •: 20th cycle). Experimental conditions: potential range from −0.2 V to +1.6 V, 100 mV/s scan rate.
After that, the electrochemical properties of the unmodified GSPEs and nanostructured GSPEs were characterized using the CV technique in presence of a 5 mM ([Fe(CN)6]−4/−3 redox probe (an equimolar solution in 0.1 M KCl) to assess the aforementioned enhancement of the electrochemical performance of the nanostructured electrodes. The electroactive area of the developed platform was calculated by applying the Randles–Sevcik equation to the angular coefficient of the linear regression obtained by plotting the anodic (ipa) and cathodic (ipc) current peak heights vs. the square root of the scan rate (Figure 3) for the bare (a) and nanoparticle-modified (b) electrodes.
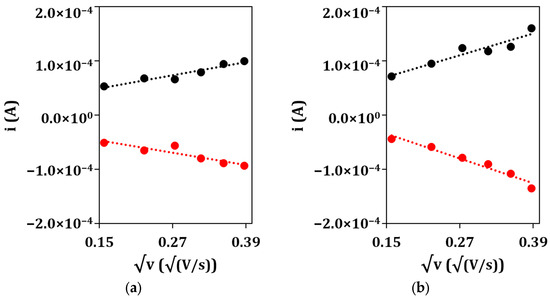
Figure 3.
Plots of anodic (•) and cathodic (•) peak currents vs. the square root of the scan rate for (a) bare GSPE and (b) (Au&Ag)NPs/GSPE.
The electroactive area values obtained for both platforms are reported in Table 2.
Table 2.
Electroactive-area values of unmodified GSPEs and (Au&Ag)NPs/GSPEs, as calculated from the cyclic voltammograms performed in [Fe(CN)6]−4/−3 redox probe.
From the obtained results, the electrodeposition of, first, silver and then gold nanoparticles causes an increase in the conductivity of the electrode surface, as noble metals were deposited onto the screen-printed graphite, and in its electroactive area, as the anodic and cathodic peak currents increase when passing from the bare GSPE to the nanostructured (Au&Ag)NPs/GSPE. This is also confirmed by the fact that the electroactive area values of the nanoparticle-modified electrodes are higher when compared to that of the bare graphite, even after taking into consideration their geometric area (7.1 mm2). From the point of view of potentiometric detection, the electrodeposited metal layer works as the solid contact between the membrane and the substrate electrode, assuring stable potential readings due to reversible charge transfer between the ionically conducting membrane and the electronically conducting support [36,37]. Moreover, an increase in the electroactive area could be helpful in the first place in anchoring the ion-selective membrane to the sensing surface, as the nanostructuration brought on by the electrodeposition of the metal nanoparticles could produce defects while anchoring points.
3.2. Morphological Characterization of the Nanostructured Surfaces
As shown in Figure 4, the morphology of GSPEs was investigated before (a) and after (b) the electrochemical nanostructuration of the substrate material with (Au&Ag)NPs.
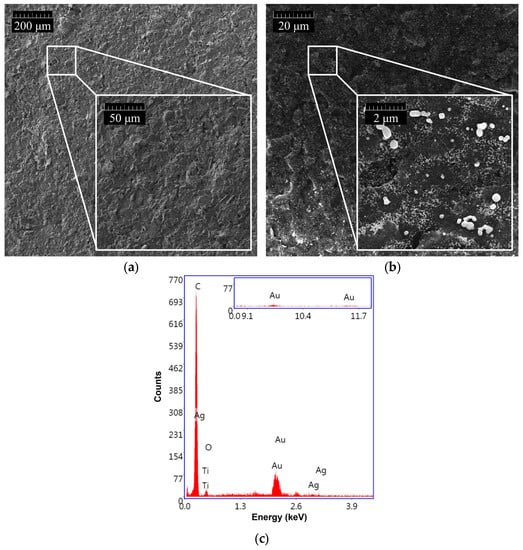
Figure 4.
SEM morphologies of (a) bare GSPE and (b) (Au&Ag)NPs-modified GSPE. (c) EDX spectrum of (Au&Ag)NPs/GSPE.
The presence of (Au&Ag)NPs with dimensions smaller than 100 nm, which are randomly distributed on the entire surface of the graphite screen-printed electrode, is visible. To assess the effective modification of the graphite surface, an EDX analysis of the nanostructured GSPEs was also carried out (Figure 4c). Three characteristic gold bands centered at 2.2, 9.7, and 11.5 keV, and two silver bands around 3.0 keV were found when the (Au&Ag)NPs-modified screen-printed electrodes were investigated, confirming the presence of gold and silver nanoparticles on the sensor surface.
3.3. Optimization of the Amount of Lithium Selective Membrane
The homogeneous coverage of the electrode surface with the ion-selective membrane is an important prerequisite to achieve an optimal sensor response. To identify the correct volume of the membrane cocktail to cast on the electrode surface, the responses of a batch of sensors towards lithium detection, each one obtained after having dropped a different volume of membrane solution, were evaluated. The linear regressions obtained for different amounts of the membrane cocktail are reported in Table 3.
Table 3.
Linear regressions obtained for lithium detection using sensors covered with different volumes of the ion-selective membrane cocktail (n = 5).
When the electrode surface was covered with 3 µL or 7 µL of the membrane solution, the sensor showed a non-Nernstian behavior. In addition, when 3 µL were used, the repeatability of the measurements among different electrodes was also poor, because the volume was not enough for a homogenous coverage of the electrode surface and for providing sufficient binding sites for lithium detection. When 7 µL were used, the response was slower due to the higher thickness, and lithium ions bound to the outer binding sites are likely too far from the sensing surface and cannot have any more influence on the signal itself. On the other hand, when the (Au&Ag)NPs/GSPE surface was covered with 5 µL of membrane solution, the sensor showed a Nernstian behavior and a good repeatability of the measurements. Therefore, the volume of 5 µL of membrane cocktail solution was selected for further experiments.
3.4. Optimization of the Supporting Electrolyte Concentration
To obtain a stable response of the sensor for lithium detection, a MgCl2 solution was used as the supporting electrolyte. The supporting electrolyte concentration was optimized by analyzing lithium standard solutions containing different concentrations of MgCl2 (0.01, 0.05, 0.1, 0.5 M).
The obtained calibration curves are shown in Figure 5.
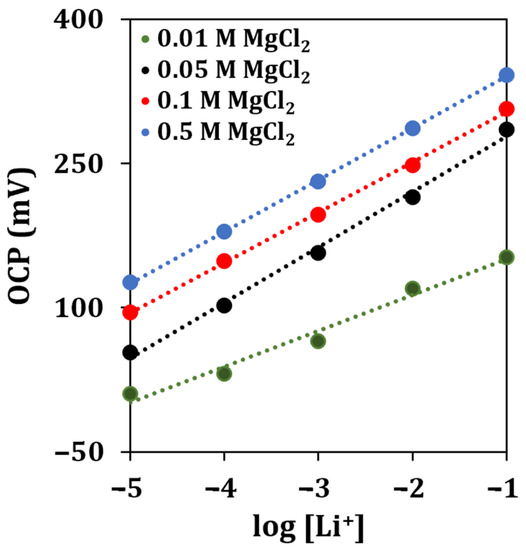
Figure 5.
Lithium calibration curves obtained with different concentrations of the supporting electrolyte solution by OCP measurements (n = 5).
The linear regressions obtained for different concentrations of the supporting electrolyte (MgCl2) are reported in Table 4.
Table 4.
Linear regressions obtained for lithium detection in standard solutions containing different concentrations of the supporting electrolyte (n = 5).
The highest sensitivity for lithium detection, almost approaching a Nernstian behavior, was retrieved when a concentration of 0.05 M of MgCl2 was used. Therefore, this concentration of supporting electrolyte solution was selected for all the subsequent experiments.
3.5. Lithium Detection in-Drop Configuration
Under optimized experimental conditions, lithium in-drop detection was performed by OCP measurements. The response time and stability of the signals were evaluated by recording the potential vs. the time during the analysis of solutions at different concentrations of lithium for a total running time of 100 s (Figure 6a). The OCP values measured in correspondence of a fixed time of 90 s for each of the analyzed lithium concentrations were plotted vs. the logarithm of lithium concentration, and a linear regression was used to fit the experimental points (Figure 6b).
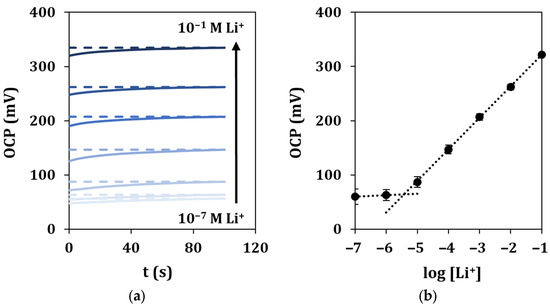
Figure 6.
In-drop lithium detection in standard solutions. (a) Recorded OCP signals vs. time for a total duration of 100 s, and (b) corresponding calibration curve. Each measurement was repeated at least 5 times using the same sensor.
It can be observed that the average response time for all the standard solutions is 45 s, calculated as reported in Section 2.6. A linear response was retrieved in the range 10−5–10−1 M, described by the equation y = (58 ± 3)x + (380 ± 7), with a good correlation coefficient (R2 = 0.9998). The limit of detection (LOD) was calculated as described in Section 2.6 and found equal to 1.6 µM. The repeatability of the sensor response was evaluated by multiple measurements of the calibration curve (n = 5), obtaining %RSD values lower than 4%. The same ion-selective cell was tested for a period of 48 h, and it showed a long lifetime. A loss of performance could be observed only after 36 h due to different events, such as the detachment of the membrane. Moreover, the sensor showed high working stability, as observed by the low potential drift (3 mV/h) obtained after 5 h of continuous OCP response when measuring a 0.1 M lithium solution. Lastly, the storage stability of the sensor was outstanding, as its analytical performance in terms of sensitivity remained almost constant for at least 1 month after preparation in dry and dark storage conditions at room temperature.
3.6. Interference Study
The most important characteristic of an ion-selective membrane is its response toward the ion of interest in the presence of other potentially interfering ions, which is measured in terms of the potentiometric selectivity coefficient (KpotA,B). Lithium calibration curves were carried out in presence of 50 mM of the interfering ion. The calculated values of log(KpotA,B), one for each interfering cation, are shown in Table 5.
Table 5.
The selectivity coefficients (log KpotA,B) of lithium sensors for different interfering ions obtained by fixed-interference method.
As it could be expected, the sensor showed the highest selectivity towards Ca+2, while the lowest coefficient values were those obtained for the smallest ions, namely, K+ and Na+, which have similar dimensions to Li+ ions, thus, resulting in a stronger interference.
3.7. Lithium Detection in Microflow Configuration
With the aim of developing a smart setup to be applied in environmental analysis for the continuous monitoring of lithium, the presented sensor was integrated into a microflow configuration comprising a peristaltic pump and a wall-jet flow cell. Standard solutions were pumped at different flow rates to evaluate the sensor response toward lithium detection.
The response time changed significantly depending on the flow rate. To assess the most suitable one, different flow rates were tested, and the response time was calculated as reported in Section 2.6. The obtained results are reported in Table 6.
Table 6.
Response time in respect of the flow rate for lithium detection ([Li+] = 0.01 M) with the microflow setup.
The optimal flow rate was 0.2 mL/min, as in this condition the sensor showed the fastest response time. The use of different flow rates resulted in higher response time values of about 10 min when using a flow rate of 0.10 mL/min and 5 min when using a flow rate of 0.40 mL/min. This was probably due to the fact that a higher flow rate does not allow the establishment of a proper binding equilibrium between lithium ions and the ion-selective membrane, thus, the sensor requires a longer time to detect lithium. On the other hand, a lower flow rate is likely insufficient for providing an efficient binding of lithium ions considering that, in the microflow analysis, the volume of lithium standard solutions which instantly comes into contact with the sensing surface is much smaller with respect to that used in the drop configuration.
A typical recording of the OCP with the microflow setup in the concentration range of 10−5–10−1 M of lithium ions, together with the relative calibration curve, is shown in Figure 7.
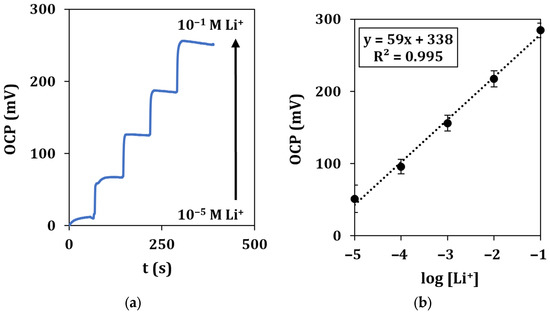
Figure 7.
Microflow lithium detection in standard solutions. (a) Recorded OCP signals vs. time for a total duration of 500 s at a flow rate of 0.2 mL/min and (b) corresponding calibration curve. Each measurement was repeated at least 5 times using the same sensor.
Calibration curves show a similar behavior with respect to drop measurement, as described by the equation y = (59 ± 5)x + (338 ± 10), with a LOD of 2.0 µM.
3.8. Sensor Application in Environmental Samples Analysis
Having verified the suitability of the sensor for detecting lithium in standard solutions, preliminary experiments on real industrial samples were then carried out.
Lithium was detected in several samples derived from an industrial process of recycling automotive batteries. The determination of the analyte was carried out by the standard addition method on the samples diluted to a proper ratio in the supporting electrolyte and by performing OCP measurements in drop and microflow configurations under the aforementioned optimized conditions. The results were compared with those obtained from the commercial ISE using batch measurements (Table 7).
Table 7.
Lithium concentrations determined in industrial samples from recycling automotive batteries. Each measurement was repeated at least 3 times using the same sensor. The samples were tested with the developed sensor through both drop measurement and the microflow setup; the results were compared with those obtained in batch with the commercial ISE.
As observed, the results obtained with the proposed method, both in drop and microflow configurations, partially overlap with those deriving from the commercial ISE analysis, demonstrating that the two methods have the same precision.
To reinforce the established applicability of the proposed method, lithium was also detected in a complex matrix obtained from soils, which could mimic those derived from grounds accidentally polluted by the byproducts of recycling processes. Given the complexity of the solution obtained from soil digestion, the dilution of the matrix was preliminarily optimized by performing potentiometric measurements with the commercial ISE (Table 8).
Table 8.
Lithium detection in contaminated soils at different dilutions. Each measurement was repeated at least 5 times with the commercial ISE.
As observed, the optimal dilution ratio was 1:100 since the slope of the corresponding calibration curve has the highest value. Thus, this dilution ratio was used for all the following experiments.
As soil usually contains an elevated amount of interfering ions such as sodium, potassium, and calcium [38], together with other potentially interfering species, the concentration of the supporting electrolyte was re-optimized. An imbalance in the ionic strength (with respect to that of standard solutions) could affect the stability, the reproducibility, and the sensitivity of the measurement. The resulting calibration curve is shown in Figure 8.
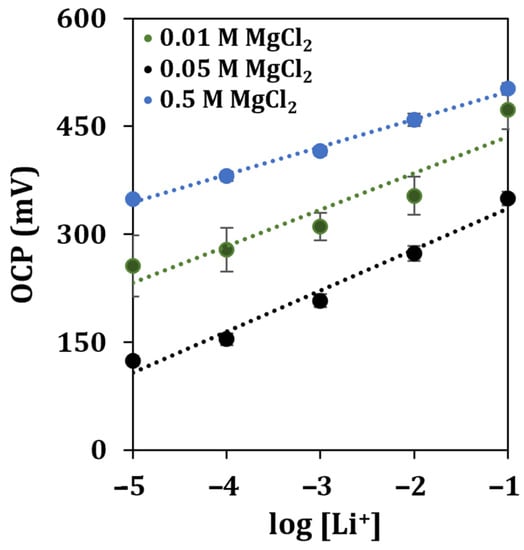
Figure 8.
Lithium detection in contaminated soils diluted at a 1:100 ratio in different concentrations of the supporting electrolyte. Each measurement was repeated at least 5 times using the same sensor.
It can be observed that the highest sensitivity was obtained using a solution of MgCl2 at a concentration of 0.05 M, while the highest R2 score was retrieved when the supporting electrolyte was 0.5 M. To evaluate the operability of the developed sensor once more, the soil sample was contaminated by spiking it with one of the byproducts of the industrial process of recycling batteries, obtaining a recovery of 81%.
Taking into account the good agreement between the results obtained with the proposed method and those deriving from the commercial ISE, it can be asserted that the developed sensor could be applied for lithium monitoring in industrial waste samples and contaminated soils.
4. Conclusions
In this paper, we developed a potentiometric smart sensor for lithium detection based on bimetallic nanoparticle-modified graphite screen-printed electrodes. Gold and silver nanoparticles were quickly deposited using cyclic voltammetry; the obtained platform was electrochemically and morphologically characterized, and the results were compared with the bare-graphite electrode. Increased conductivity and improved surface area were retrieved after the deposition of (Au&Ag)NPs. An appropriate amount of an optimized ion-selective membrane cocktail was then deposited directly onto the surface of the nanostructured graphite electrodes. Lithium was detected in standard solutions over a wide range (10−5–10−1 M) with low detection limits of 1.6 μM and 2.0 μM, both in-drop and with a microflow configuration, respectively. The selectivity towards lithium detection in the presence of interfering ions was also evaluated. The absence of the need for conditioning time for the developed sensor has many advantages for its application as a ready-to-use and disposable device for real-sample analysis. Real samples from an industrial process of recycling automotive batteries and a complex matrix deriving from contaminated soils were analyzed, and the results were in accordance with those provided by a commercial lithium selective electrode. The applicability of the proposed method was then reinforced, as lithium was also detected in a complex matrix obtained from contaminated soils. This kind of analysis highlights the importance of the use of screen-printed modified electrodes to monitor all the steps of the process and to assure a complete recovery of the battery materials.
Author Contributions
Conceptualization, I.A.V., G.S. and G.M.; methodology, I.A.V. and G.M.; investigation, I.A.V.; data curation, I.A.V. and G.S.; writing—original draft preparation, I.A.V.; writing—review and editing, I.A.V., G.S. and G.M.; supervision, G.M.; project administration, G.M.; funding acquisition, G.M. All authors have read and agreed to the published version of the manuscript.
Funding
This research was funded by Regione Toscana (grant number 3553.04032020.158000224) within the project RI.B.AT (Riciclo Integrato Batterie AutoTrazione) in the framework of POR FESR 2014/2020.
Institutional Review Board Statement
Not applicable.
Informed Consent Statement
Not applicable.
Data Availability Statement
No new data were created or analyzed in this study. Data sharing is not applicable to this article.
Conflicts of Interest
The authors declare no conflict of interest.
References
- Kennedy, B.; Patterson, D.; Camilleri, S. Use of lithium-ion batteries in electric vehicles. J. Power Sources 2000, 90, 156–162. [Google Scholar] [CrossRef]
- Velázquez-Martínez, O.; Valio, J.; Santasalo-Aarnio, A.; Reuter, M.; Serna-Guerrero, R. A Critical Review of Lithium-Ion Battery Recycling Processes from a Circular Economy Perspective. Batteries 2019, 5, 68. [Google Scholar] [CrossRef]
- Islam, M.T.; Iyer-Raniga, U. Lithium-Ion Battery Recycling in the Circular Economy: A Review. Recycling 2022, 7, 33. [Google Scholar] [CrossRef]
- Ambrose, H.; Kendall, A. Understanding the future of lithium: Part 1, resource model. J. Ind. Ecol. 2020, 24, 80–89. [Google Scholar] [CrossRef]
- Aral, H.; Vecchio-Sadus, A. Lithium: Environmental Pollution and Health Effects. In Encyclopedia of Environmental Health; Nriagu, J.O., Ed.; Elsevier B.V.: Amsterdam, The Netherlands, 2011; pp. 499–508. ISBN 978-0-444-52272-6. [Google Scholar]
- Wanger, T.C. The Lithium future-resources, recycling, and the environment. Conserv. Lett. 2011, 4, 202–206. [Google Scholar] [CrossRef]
- Mossali, E.; Picone, N.; Gentilini, L.; Rodrìguez, O.; Pérez, J.M.; Colledani, M. Lithium-ion batteries towards circular economy: A literature review of opportunities and issues of recycling treatments. J. Environ. Manag. 2020, 264, 110500–110511. [Google Scholar] [CrossRef]
- Ferrara, C.; Ruffo, R.; Quartarone, E.; Mustarelli, P. Circular Economy and the Fate of Lithium Batteries: Second Life and Recycling. Adv. Energy Sustain. Res. 2021, 2, 2100047–2100059. [Google Scholar] [CrossRef]
- Tavakolian-Ardakani, Z.; Hosu, O.; Cristea, C.; Mazloum-Ardakani, M.; Marrazza, G. Latest Trends in Electrochemical Sensors for Neurotransmitters: A Review. Sensors 2019, 19, 2037. [Google Scholar] [CrossRef]
- Suherman, A.L.; Rasche, B.; Godlewska, B.; Nicholas, P.; Herlihy, S.; Caiger, N.; Cowen, P.J.; Compton, R.G. Electrochemical Detection and Quantification of Lithium Ions in Authentic Human Saliva Using LiMn2O4-Modified Electrodes. ACS Sens. 2019, 4, 2497–2506. [Google Scholar] [CrossRef]
- Freitas, B.H.; Amaral, F.A.; Bocchi, N.; Teixeira, M.F.S. Study of the potentiometric response of the doped spinel Li1.05Al0.02Mn1.98O4 for the optimization of a selective lithium ion sensor. Electrochim. Acta 2010, 55, 5659–5664. [Google Scholar] [CrossRef]
- Nel-lo, M.; Ferrer, Ò.; Colominas, S.; Abellà, J. Lithium sensors based on Li6La3Ta1.5Y0.5O12 and Li6BaLa2Ta2O12 garnet electrolytes for molten lead alloys. Sens. Actuators B Chem. 2021, 339, 129831–129837. [Google Scholar] [CrossRef]
- Paczosa-Bator, B. All-solid-state selective electrodes using carbon black. Talanta 2012, 93, 424–427. [Google Scholar] [CrossRef]
- Mazzaracchio, V.; Serani, A.; Fiore, L.; Moscone, D.; Arduini, F. All-solid state ion-selective carbon black-modified printed electrode for sodium detection in sweat. Electrochim. Acta 2021, 394, 139050–139059. [Google Scholar] [CrossRef]
- Ermolenko, Y.; Yoshinobu, T.; Mourzina, Y.; Furuichi, K.; Levichev, S.; Vlasov, Y.; Schöning, M.J.; Iwasaki, H. Lithium sensor based on the laser scanning semiconductor transducer. Anal. Chim. Acta 2002, 459, 1–9. [Google Scholar] [CrossRef]
- Gupta, V.K.; Chandra, S.; Agarwal, S.; Lang, H. Lithium-selective potentiometric sensor based on a second generation carbosiloxane dendrimer. Sens. Actuators B Chem. 2005, 107, 762–767. [Google Scholar] [CrossRef]
- Coldur, F.; Andac, M. All-Solid-State Polyvinyl Chloride Membrane Lithium-Selective Electrode with Improved Selectivity and Its Application in Serum Lithium Assay. Sens. Lett. 2011, 9, 1738–1744. [Google Scholar] [CrossRef]
- Coldur, F.; Andac, M. A Flow-Injection Potentiometric System for Selective and Sensitive Determination of Serum Lithium Level. Electroanalysis 2013, 25, 732–740. [Google Scholar] [CrossRef]
- Kamenica, M.; Kothur, R.; Willows, A.; Patel, B.; Cragg, P. Lithium Ion Sensors. Sensors 2017, 17, 2430. [Google Scholar] [CrossRef]
- Li, M.; Li, Y.-T.; Li, D.-W.; Long, Y.-T. Recent developments and applications of screen-printed electrodes in environmental assays—A review. Anal. Chim. Acta 2012, 734, 31–44. [Google Scholar] [CrossRef]
- Cinti, S.; Arduini, F.; Carbone, M.; Sansone, L.; Cacciotti, I.; Moscone, D.; Palleschi, G. Screen-Printed Electrodes Modified with Carbon Nanomaterials: A Comparison among Carbon Black, Carbon Nanotubes and Graphene. Electroanalysis 2015, 27, 2230–2238. [Google Scholar] [CrossRef]
- Waheed, A.; Mansha, M.; Ullah, N. Nanomaterials-based electrochemical detection of heavy metals in water: Current status, challenges and future direction. TrAC Trends Anal. Chem. 2018, 105, 37–51. [Google Scholar] [CrossRef]
- Squissato, A.L.; Munoz, R.A.A.; Banks, C.E.; Richter, E.M. An Overview of Recent Electroanalytical Applications Utilizing Screen-Printed Electrodes Within Flow Systems. ChemElectroChem 2020, 7, 2211–2221. [Google Scholar] [CrossRef]
- Kanso, H.; González García, M.B.; Llano, L.F.; Ma, S.; Ludwig, R.; Fanjul Bolado, P.; Santos, D.H. Novel thin layer flow-cell screen-printed graphene electrode for enzymatic sensors. Biosens. Bioelectron. 2017, 93, 298–304. [Google Scholar] [CrossRef] [PubMed]
- Brownlee, B.J.; Bahari, M.; Harb, J.N.; Claussen, J.C.; Iverson, B.D. Electrochemical Glucose Sensors Enhanced by Methyl Viologen and Vertically Aligned Carbon Nanotube Channels. ACS Appl. Mater. Interfaces 2018, 10, 28351–28360. [Google Scholar] [CrossRef]
- Henríquez, C.; Cerdà, V. Construction of a New Flow-through Cell for Screen Printed Electrodes. Electroanalysis 2020, 32, 1323–1328. [Google Scholar] [CrossRef]
- Sarakhman, O.; Švorc, Ľ. A Review on Recent Advances in the Applications of Boron-Doped Diamond Electrochemical Sensors in Food Analysis. Crit. Rev. Anal. Chem. 2022, 52, 791–813. [Google Scholar] [CrossRef]
- Marzouk, S.A.M.; Alyammahi, A.R.; Fanjul-Bolado, P. Development and Characterization of Novel Flow Injection, Thin-Layer, and Batch Cells for Electroanalytical Applications Using Screen-Printed Electrodes. Anal. Chem. 2021, 93, 16690–16699. [Google Scholar] [CrossRef]
- Arvinte, A.; Crudu, I.-A.; Doroftei, F.; Timpu, D.; Pinteala, M. Electrochemical codeposition of silver-gold nanoparticles on CNT-based electrode and their performance in electrocatalysis of dopamine. J. Electroanal. Chem. 2018, 829, 184–193. [Google Scholar] [CrossRef]
- Criscuolo, F.; Taurino, I.; Stradolini, F.; Carrara, S.; De Micheli, G. Highly-stable Li+ ion-selective electrodes based on noble metal nanostructured layers as solid-contacts. Anal. Chim. Acta 2018, 1027, 22–32. [Google Scholar] [CrossRef]
- Criscuolo, F.; Taurino, I.; Carrara, S.; De Micheli, G. A novel electrochemical sensor for non-invasive monitoring of lithium levels in mood disorders. In Proceedings of the 2018 40th Annual International Conference of the IEEE Engineering in Medicine and Biology Society (EMBC), Honolulu, HI, USA, 18–21 July 2018; pp. 3825–3828. [Google Scholar]
- Elgrishi, N.; Rountree, K.J.; McCarthy, B.D.; Rountree, E.S.; Eisenhart, T.T.; Dempsey, J.L. A Practical Beginner’s Guide to Cyclic Voltammetry. J. Chem. Educ. 2018, 95, 197–206. [Google Scholar] [CrossRef]
- Maccà, C. Response time of ion-selective electrodes. Anal. Chim. Acta 2004, 512, 183–190. [Google Scholar] [CrossRef]
- Bakker, E.; Pretsch, E. Potentiometric sensors for trace-level analysis. TrAC Trends Anal. Chem. 2005, 24, 199–207. [Google Scholar] [CrossRef]
- Umezawa, Y.; Bühlmann, P.; Umezawa, K.; Tohda, K.; Amemiya, S. Potentiometric Selectivity Coefficients of Ion-Selective Electrodes. Part I. Inorganic Cations (Technical Report). Pure Appl. Chem. 2000, 72, 1851–2082. [Google Scholar] [CrossRef]
- Kałuża, D.; Michalska, A.; Maksymiuk, K. Solid-Contact Ion-Selective Electrodes Paving the Way for Improved Non-Zero Current Sensors: A Minireview. ChemElectroChem 2022, 9, e202100892. [Google Scholar] [CrossRef]
- Lyu, Y.; Gan, S.; Bao, Y.; Zhong, L.; Xu, J.; Wang, W.; Liu, Z.; Ma, Y.; Yang, G.; Niu, L. Solid-Contact Ion-Selective Electrodes: Response Mechanisms, Transducer Materials and Wearable Sensors. Membranes 2020, 10, 128. [Google Scholar] [CrossRef]
- Robinson, B.H.; Yalamanchali, R.; Reiser, R.; Dickinson, N.M. Lithium as an emerging environmental contaminant: Mobility in the soil-plant system. Chemosphere 2018, 197, 1–6. [Google Scholar] [CrossRef]


Disclaimer/Publisher’s Note: The statements, opinions and data contained in all publications are solely those of the individual author(s) and contributor(s) and not of MDPI and/or the editor(s). MDPI and/or the editor(s) disclaim responsibility for any injury to people or property resulting from any ideas, methods, instructions or products referred to in the content. |
© 2023 by the authors. Licensee MDPI, Basel, Switzerland. This article is an open access article distributed under the terms and conditions of the Creative Commons Attribution (CC BY) license (https://creativecommons.org/licenses/by/4.0/).