Article

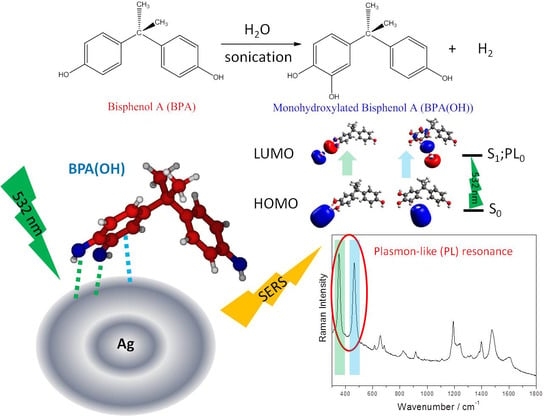
Sensing Bisphenol A by Means of Surface-Enhanced Raman Spectroscopy and DFT Calculations to Elucidate the Enhancement Mechanism That Dominates the Spectrum

by
Michele Lemos De Souza
1,†,
Samuel Valdivia
2,†,
Juan Carlos Otero
2 and
Isabel López-Tocón
2,*
1
Instituto de Ciências Exatas, Universidade Federal Fluminense, Volta Redonda, Rio de Janeiro 27213-145, Brazil
2
Andalucía Tech, Departamento de Química Física, Facultad de Ciencias, Universidad de Málaga, E-29071 Málaga, Spain
*
Author to whom correspondence should be addressed.
These authors contributed equally to this work.
Chemosensors 2023, 11(2), 78; https://doi.org/10.3390/chemosensors11020078
Submission received: 23 November 2022 / Revised: 13 January 2023 / Accepted: 18 January 2023 / Published: 20 January 2023
(This article belongs to the Special Issue Recent Trends in SERS: Sensing and DFT Application)

Abstract

:
Surface-Enhanced Raman Spectroscopy (SERS) was employed as a spectroscopic tool to detect Bisphenol A (BPA), a building block in polycarbonate and epoxy resins or an additive in other polymer plastics like PVC, which has an endocrine disruptor effect. Silver nanoparticles (AgNPs) synthesized by using different reducing agents such as hydroxylamine (Ag@HX), citrate (Ag@Cit), borohydride (Ag@BH), and β-cyclodextrin (Ag@βCD) were employed, aiming to select the best standard SERS substrate. The lowest limit of quantification was reached at a concentration of 0.01 mM (2.3 μg/mL) of a sonicated aqueous solution by using Ag@Cit NPs and identifying two enhanced bands recorded at about 350 and 460 cm−1. In order to gain insight into the nature of the enhanced bands, and therefore into which mechanism governs the SERS signal, electrochemical spectra recorded at different electrode potentials were acquired and TD-DFT calculations were applied to a neutral silver complex of BPA, Ag2-BPA, and to its monohydroxylated chemical specie, Ag2-BPA(OH), which is present in sonicated solution. The calculated electronic structure and the resonance Raman spectra point out that a surface plasmon-like resonance inside the silver cluster dominates the SERS spectrum corresponding to the physisorbed BPA(OH) species, a charge transfer enhancement mechanism or an intramolecular resonance transition localized in the phenolic framework was then discarded.

Graphical Abstract

1. Introduction

Bisphenol A (BPA) is an organic compound with two phenol functional groups. It is a difunctional building block (monomer) of many important plastics, mainly polycarbonate and epoxy resins [1], and an additive, a plasticizer-like, in PVC and polyurethane plastics, which are used in many daily consumer products such as toys, drinking or food containers, sports safety equipment, medical instruments, etc. BPA is also present in thermal paper such as shopping tickets, which is the main non-food source of human exposure. Due to its ability to bind to estrogen receptors, BPA is known as a potential endocrine disruptor [2,3], becoming not only an emerging pollutant in aqueous environments but also a human or food safety problem, as established by the World Health Organization [4], because of the possibility for BPA to migrate from food packaging into the food itself. For this reason, the detection of BPA at low concentration levels by analytical or spectroscopic methods and the sample pre-treatment are interesting issues for many researchers [5,6,7,8,9,10].
The analytical methods commonly used for sensing BPA, such as liquid chromatography [9], liquid chromatography-mass spectrometry [8], gas chromatography-mass spectrometry [10], capillary electrophoresis [11,12] and immunoassay [6,7], frequently need a sample treatment [9] to achieve the required sensitivity and selectivity, and they usually consist of several laborious and time-consuming steps. Sometimes, even the use of non-aqueous solution is necessary due to the poor solubility of BPA in water [13].
However, Surface-Enhanced Raman Spectroscopy (SERS) [14] is a spectroscopic technique that can be used as an analytical tool for the detection of pollutants and aromatic molecules [15,16] at trace level concentration because it has several advantages such as the enhancement of the Raman signal of the molecular probe in the vicinity of a nanometric roughed metal, its high molecular selectivity, no sample pre-treatment requirement [17,18], the detection of hydrophobic molecules in aqueous environment [19], and above all, its versatile ability to use different metallic substrates as a chemical sensor.
Improvements of SERS sensors have aroused interest in the last few decades regarding the detection sensitivity and research into functionalized metal nanoparticles (NPs) that circumvent the affinity of analytes for metallic surfaces [19,20,21,22,23,24]. Two main strategies are employed in the surface functionalization by using aptamers [22,23,24], short single-stranded DNA or RNA molecules that can selectively bind to a specific target, which are mostly employed in sensing BPA, and molecular hosts where a host–guest interaction is possible, such as calixarenes [25], viologen dications [19], and cyclodextrins [21], with the latter also being used for BPA detection. Due to the low solubility of BPA in water [13] and the weak affinity of phenolic molecules for the metallic surface, both strategies were mainly employed for SERS detection of BPA [21,22,23,24]. However, a direct detection of BPA making use of the most frequently synthesized AgNPs in the lab is not described in the literature.
In this work, standard AgNPs without surface functionalization were obtained by using different reducing agents such as hydroxylamine (Ag@HX), citrate (Ag@Cit), borohydride (Ag@BH), and β-cyclodextrin (Ag@βCD). These were employed for BPA detection by making use of the revealed evidence that BPA molecules become the monohydroxylated species, BPA(OH), under ultrasound bath exposition [26,27]. This fact allows the increase of its affinity for metallic surfaces [28,29], as happens in other molecules having the catechol group [20]. Thus, a sonicated aqueous solution of BPA was used to record the SERS spectra at different concentrations in order to establish the best SERS substrate recognizing the characteristic molecular vibrational bands at low concentrations. A striking feature is that the two strongest bands were recorded at about 350 and 460 cm−1, which are not recorded in the solid Raman of BPA and even in the SERS spectra obtained with a non-sonicated solution [21]. This fact could be related to the presence of the monohydroxilated species and the participation of the chemical enhancement mechanism to the SERS signal [14] that is responsible for the selective enhancement of particular bands [30,31]. This mechanism is similar to a resonant Raman process in which excited electronic states of different natures can be involved as, for example, a photoinduced metal-to-molecule charge-transfer (CT) process [32] or a resonant Raman process involving plasmon-like (PL) excitation inside the silver cluster [33], which is responsible for the selective enhancement of 8a and 9a modes in electrochemical SERS of pyridine [34], respectively, or even an intramolecular resonance transition localized in the aromatic framework resulting a surface-enhanced resonance Raman spectrum (SERRS) [31].
Thus, in order to get insight into the nature of the enhancement of these particular bands and which mechanism governs the SERS signal, electrochemical spectra were recorded at different electrode potentials, and TD-DFT calculations on isolated BPA and BPA(OH) and on their respective neutral surface complexes with two silver atoms, Ag2-BPA and Ag2-BPA(OH), were performed. In addition, two types of silver coordination environments were investigated through the oxygen atom or through the aromatic ring. DFT calculations are a useful tool for addressing the study of molecular conformations upon adsorption on metal surface, as shown in previous works [35,36]. Finally, a comparison between the calculated ordinary and resonance Raman spectra of these complexes and the SERS spectra was established.
In summary, the two main goals of this work are a direct BPA detection in a sonicated aqueous solution by using non-functionalized SERS substrates and the elucidation of the nature of the enhancement of the two strongest SERS bands recorded at a lower wavenumber region on the basis of a resonance Raman process making use of DFT calculations applied to a simple metal-adsorbate supermolecule.

2. Materials and Methods

2.1. Colloidal AgNPs Experiments

The colloid synthesis procedure used in the present work and their characterization by TEM and UV spectroscopy were described in detail elsewhere [37]. We follow the synthesis route published by other researchers [38,39,40] with some minor modifications related to the temperature, the time of magnetic stirring, and the dilution of the reactants in the case of Ag@βCD NPs. All information is displayed in ref. [37]. Table S1 briefly summarizes the main characteristics of the AgNPs synthesis. The colloids were stable for several weeks if stored under refrigeration.
A 0.1 M aqueous solution of BPA was prepared as a stock solution and it was sonicated at 25 °C for five minutes, favoring its dissolution. The SERS samples were obtained by adding sequentially 20 µL of 0.5 M Na2SO4 and 10 µL of BPA aqueous solution to 1000 µL of the AgNPs. Different concentrations of BPA were used to establish the minimum concentration that gives a SERS signal with a good signal/noise ratio. A standard quartz cuvette and a 532 nm exciting line were used in all measurements.

2.2. Electrochemical Experiments

The experimental procedure for obtaining electrochemical SERS spectra was described elsewhere [31]. Briefly, the homemade electrochemical cell is composed of three electrodes: a platinum counter electrode, an Ag/AgCl/KCl(sat.) reference electrode, and a pure silver working electrode. This latter was polished with 1.00 and 0.30 μm alumina (Buehler, Lake Blue, IL, USA) and electrochemically activated by using a 0.1 M aqueous solution of Na2SO4 and by initially maintaining the electrode potential at −0.5 V and subjecting it to seven pulses at +0.6 V for 2 s. A 0.1 M/1 mM sonicated aqueous solution of Na2SO4/BPA was employed to record SERS spectra.
An electrode potential range from 0.0 V up to −1.0 V was applied to record SERS spectra by using steps of −0.1 V. All spectra were obtained with an accumulation of 1 scan and 10 s exposure with the 785 nm exciting line. These parameters guarantee that the aromatic molecule BPA does not suffer damages or decomposition processes. SERS spectra were recorded twice for checking that the relative intensity of the bands and the spectrum profile remain almost constant. No significant fluctuations for a particular spectrum were detected.

2.3. Instrumentation

An Invia Qontor Raman Confocal System (Renishaw, Wotton-under-Edge, Gloucestershire, UK) coupled to a Leica Microscope Raman was employed to record SERS spectra. The measurements were performed in a macro configuration using an objective of 50× magnification with a focal distance of 30 mm (NA 0.17). The 2400 L/mm and 1200 L/mm holographic gratings were used at 532 and 785 nm exciting lines, respectively, with the spectral resolution set at ±2 cm−1. The spectral acquisition and manipulation were performed by using the Wire 2.0 software (Renishaw). The electrode potentials in the electrochemical experiments were controlled by a potentiostat model 600E (CH Instruments Inc., Austin, TX, USA). A Milli-Q system provided the ultrapure water (18.2 MΩ cm resistivity) used in all solutions.

2.4. Computational Details. Theoretical Resonance Raman Spectra

Density-Functional Theory (DFT) was employed for calculating the equilibrium structure and the vibrational wavenumbers of isolated molecules, BPA and BPA(OH), and their respective neutral silver complexes, Ag2-BPA and Ag2-BPA(OH). The long-range-corrected version of B3LYP using the Coulomb-attenuating method, CAM-B3LYP [41], together with the triple zeta basis set, def2-TZVPP [42], was chosen. This level of calculation takes into account the electronic correlation, an important factor in aromatic molecules with several benzenic rings [31,43] and, above all, in the silver complexes in which the number of electrons is increased. Additionally, the selected electronic basis set can be applied to light atoms as well as silver ones, allowing us to compare the results of the isolated molecules with those complexed. This level of calculation also reproduces the Raman spectra quite well in those aromatic systems that have several isolated or fused benzene rings [31,43]. In this case, the theoretical spectrum of BPA (Figure S1) is able to predict the intense Raman bands of the solid, although the relative intensity of the band recorded in the 1600 cm−1 region is not quite well reproduced.
A simple supermolecule model with two silver atoms, Ag2-BPA and Ag2-BPA(OH), was chosen, given that this neutral complex correlates quite well with the potential of zero charge of a polycrystalline silver electrode that it is close to −0.5 V [44]. Two types of silver coordination environments were investigated through the oxygen atom or through the aromatic ring. In the latter case, two possible orientations of silver atoms are considered, in the external or the internal aromatic ring face with respect to the cavity generated in its own structure by the two rotated phenolic planes.
The electronic structure of the silver complexes was calculated by Time-Dependent DFT (TD-DFT) method at the above-mentioned level of calculation. The computed force gradient for a particular electronic excited state allows us to compute the resonance Raman spectra by using the free code, FCclasses 3.0 [45], for vibronic calculations based on the harmonic approximation, on the vertical gradient model and on the Frank–Condon approach for the electric transition dipole moment [46].
Briefly, resonance Raman intensity of a mode p is calculated by applying the following time-independent expression implemented in the code FCclasses 3.0 [45]:
( d σ d Ω ) p = π 2 ε 0 2 ( υ ˜ i n υ ˜ p ) 4 45 a p 2 + 7 g p 2 + 5 d p 2 45
Being, ε 0 the vacuum permittivity, υ ˜ i n and υ ˜ p the wavenumbers of the incident radiation and of the vibrational normal mode p. The ap (mean isotropic polarizability), gp (symmetric anisotropic polarizability) and dp (antisymmetric anisotropic polarizability) are the so called polarizability invariants, which are functions of the transition polarizability tensor components between initial (i) and final (f) states, α ρ σ f i ( ρ , σ = x , y , z ) . This latter term, within the time-independent framework, can be calculated from the Kramers–Heisenberg–Dirac formula [47] that in the Frank–Condon approximation becomes:
α ρ σ f i = 1 [ μ ρ g k ( 0 ) μ σ k g ( 0 ) m n f , g | m k m k | n i , g ω k m , g i ω i n i γ k ]
Being , the Planck’s constant, μ ρ g k = k | μ ρ | g and μ σ k g = g | μ σ | k are the components (x, y, z) of the electric transition dipole moment between the electronic states g and k. | n f , g and | n i , g are the final and initial vibrational states of the electronic state g, respectively. | m k is the m vibrational state of the electronic state k, ω i n is the angular frequency of the incident radiation and γ k is the damping factor of the electronic state k. ω k m , g i is the angular frequency of the electronic states g and k and their respective vibrational states, ω k m , g i = ω k + ω υ m k ( ω g + ω υ i g ) and thus, the denominator is related with the energy difference corresponding to the vibronic transition. This treatment corresponds to the resonance contribution of Albrecht A term [48] and those states with large displacements along the normal coordinates should have the largest contribution to the Raman intensity because of this is proportional to functions of | α ρ σ f i | 2 .
All calculations were carried out with Gaussian16 program [49]. The geometry optimization, the vibrational modes and the molecular orbitals were visualized by using MOLDEN program [50] and all spectra were plotted using a gaussian function with a value of 10 as a Full Width at Half Maximum, FWHM = 10.0.

3. Results and Discussion

3.1. Standard AgNPs as a Chemical Sensor of BPA in a Sonicated Aqueous Solution

The SERS spectra recorded at different concentrations with the synthesized AgNPs (Figure 1) are striking because they seem to have no similarities with the solid Raman spectrum plotted at the bottom of the figure. It was not possible to record the Raman spectrum of an aqueous solution due to its poor solubility in water and weak Raman signal. Although four strong bands recorded at about 1616, 1113, 832, and 640 cm−1 and assigned to 8a, δ(CH) 1, and 6a modes [21] dominate the solid Raman spectrum, any of those were enhanced in SERS spectra. Only the 8a, 1, and 6a modes appear as weak broad bands in SERS with Ag@BH (Figure 1a) and Ag@Citr NPs (Figure 1c). No significant SERS enhancement or weak records were acquired by using the biggest AgNPs, that is, Ag@HX (Figure 1b) and Ag@βCD NPs (Figure 1d), while the most intense SERS signal for BPA was obtained by using smaller Ag@Citr NPs (Figure 1c), yielding a well-resolved spectrum. In this case, the SERS spectra are mainly characterized by two strong enhanced bands at about 350 and 460 cm−1, assigned to in-plane deformation of the C-OH bond and the butterfly motion, 16a mode, of the aromatic ring. The vectorial representation of these vibrational motions are shown in Figure S2. Other weak enhanced SERS bands are recorded at 1473, 1397, 1241, 1192, 913, and 655 cm−1, as shown in Figure 1c. This type of SERS spectrum is different from that recorded with a non-sonicated solution [21] where there are no bands in the 300–500 cm−1 wavenumber region. Thus, the enhancement of those two bands could be associated to the effect of sonication, yielding the presence of its monohydroxilated species in the bulk, and the chemical enhancement contribution to SERS signal, as will be shown below.
Besides, the identification of the two strong SERS bands recorded in the 300–500 cm−1 region allows the detection of the lowest concentration of 0.01 mM (2.3 μg/mL) by using Ag@Citr NPs. This limit of quantification was slightly higher than other limits of detection reported by other researchers using different analytical techniques [6,11,12] or a SERS technique with functionalized AgNPs [21,22,23,24], but it is about 22 times and twice lower than the tolerable daily intake (TDI) proposed by the EFSA (European Food Safety Agent) in 2012 and 2015 (50 μg/kg body weight/day [51] and 4 μg/kg body weight/day [52], respectively). Although, more recently, this TDI is reduced at 0.04 ngr/kg body weight/day in 2022 [50], this experimental procedure could be a direct, realible, and feasible option as a first step for sensing BPA in aquatic environments without needing to functionalize the NPs or to address special experimental conditions. On the other hand, those two bands show a weaker SERS intensity with Ag@βCD NPs than those recorded with Ag@BH NPs, but both types of AgNPs are able to detect the same concentration, 0.5 mM (114 μg/mL) giving a worse result than Ag@Citr NPs. Thus, the Ag@Citr NPs that show a small average diameter, 19 nm, are the best SERS substrate to detect sonicated BPA among the most common SERS substrates used in the lab. This fact also indicates that the strong SERS records are very sensitive to the size of the AgNPs, and thus, to their plasmonic characteristics.
It is likely that the good SERS signal observed with Ag@Citr NPs could be related to an increase of the number of hot spots generated by the saline aggregation effect, inducing a better effect of the localized surface plasmon resonance with the employed exciting wavelength than in other cases of NPs. Only Ag@Citr NPs combine a smaller average diameter (19 nm) and a nearer absorption band (408 nm) to exciting line (532 nm) than the other NPs, being for Ag@HX: 42 nm and 419 nm; for Ag@BH: 12 nm and 389 nm; and for Ag@βCD: 38 nm and 419 nm, respectively.

3.2. SERS Spectra of a Sonicated Aqueous Solution of BPA on Roughed Silver Electrode

To get insight into the nature of the enhancement of the two bands recorded in the 300–500 cm−1 region, SERS spectra recorded on nanostructured silver electrode were performed. Unlike colloidal SERS experiments, electrochemical ones allow control of the electrode potential, which can tune the excited electronic state [32] because the resonant process in this type of experiment is determined not only by the exciting wavelength, as in any electronic spectroscopy, but also by the potential electrode that modulates the Fermi level of the metal. Thus, the study of the dependence of SERS spectra with the electrode potential yields information on the electronic structure of the interface at a molecular level.
Similar spectra to those recorded with Ag@Citr NPs were obtained from 0.0 up to −0.3 V potential (Figure 2), characterized by two strong bands appearing in the 300–500 cm−1 region. From −0.4 V and on, all SERS spectra show the same profile and, although the above-mentioned bands are still identified, they become weaker, with the strongest band being recorded at about 830 cm−1 at a more negative electrode potential, −1.0 V.

3.3. DFT Calculations on Silver Coordination and Complexation Energy of the Ag2-BPA and Ag2-BPA(OH) Complexes

BPA structure is similar to that of the methane molecule, in which the hydrogen atoms are substituted by two methyl groups and two phenolic groups that are also rotated in respect to each other in opposite directions, with a dihedral angle of 52.6° at CAM-B3LYP/def2-TZVPP level (Figure S3a). No significant geometrical changes in the optimized structure for the monohydroxylated species BPA(OH) are calculated, neither in the bond distances and angles nor even in the dihedral angle, 52.1° (Figure S3b). This non planar geometrical disposition of the aromatic rings in BPA or BPA(OH) generates a small molecular cavity in where AgNPs could be approached to the aromatic rings.
Thus, two types of silver coordination environments, through the oxygen atoms or through one of the two differentiated faces of the aromatic ring, being an external or an internal coordination with respect to the cavity generated by the two rotated aromatic planes, were taken into account. The optimized structures of the Ag2-BPA and Ag2-BPA(OH) surface complexes reveal that there are no significant geometrical changes upon complexation (Figure S4 shows those complexes coordinated through oxygen atoms).
Table 1 collects the CAM-B3LYP/def2-TZVPP optimized structures of Ag2-BPA and Ag2-BPA(OH) complexes and their complexation energy corrected by using counterpoise (CP) method [53] and defined for an A-B dimer as:
Δ E f C P = E A B A B E A A B E B A B
This energy ranges from −8.41 to −6.71 Kcal/mol, with the most stable structure being that of the Ag2-BPA(OH) complex (−8.41 Kcal/mol) with a coordination through the oxygen atoms. Besides, the energy difference between two complexes of BPA with different coordination is small, about 1 Kcal/mol, as also happens for BPA(OH) complexes. These small values of the complexation energy are far away from the order of a chemical bond, indicating that the metal–molecule bond is weak and thus, these complexes can be considered as physisorbed systems. Due to the small energy difference between the complexes, the ordinary and resonance Raman spectra for all these types of silver coordination were calculated in order to establish which of them is able to predict the experimental features. This also provides information on the type of adsorbed chemical species, BPA or BPA(OH) and its molecular interaction center.

3.4. Insights into the Nature of SERS Enhancement by Analyzing TD-DFT Resonance Raman Spectra of Ag2-BPA and Ag2-BPA(OH) Complexes

TD-DFT calculations on the optimized silver complexes, Ag2-BPA and Ag2-BPA(OH), predict that the adsorption process provokes changes in the electronic structure of the isolated BPA and BPA(OH) chemical species, as shown in Tables S1–S3. The first electronic excited state is calculated at about 5 eV in both isolated species (Table S2) and corresponds to an HOMO–LUMO electronic transition, while a lower energy is calculated in their respective complexed compounds (Table S3), at about 3.20 eV, being almost reachable with the experimental exciting line of 532 nm (2.5 eV).
In the optimized Ag2-BPA(OH) complexes, the first electronic transition corresponds to a surface plasmon-like (PL0) resonant transition inside the silver cluster, as shown the HOMO–LUMO orbitals (Figure 3). The following electronic excited states show the same nature, that is, correspond to molecular orbitals of the metal cluster denoted as PL in Tables S3 and S4. However, two other types of electronic transition can be identified (Table S3), corresponding to a photoinduced charge transfer (CT) from the Fermi level of the metal (HOMO) to the vacant orbital of the molecule (LUMO + 1), called forward (F) transition, and calculated at 5.01 eV (S9(CT0F)) and 4.79 (S5(CT0F)) eV in the Ag2-BPA and Ag2-BPA(OH) complex coordinated through the oxygen atoms, respectively, while an intramolecular resonance transition localized in the phenolic framework is calculated at 5.08 eV and 5.04 eV, (S10(S1)) in both complexes. The molecular orbitals involved in these threee types of electronic transitions in the Ag2-BPA(OH) complex coordinated through oxygen atoms are plotted in Figure 3.
However, the CT0F electronic state seems to be sensitive to the coordination of silver atoms given that it moves down to lower energy, calculated at 3.9 eV in the Ag2-BPA(OH) and Ag2-BPA complexes coordinated through the aromatic ring (Table S4), being only upper 0.5 eV than the first PL0 state, while the intramolecular resonance transition (S1 state) remains at the same energy, about 5 eV. Additionally, the electronic structure with this type of coordination becomes a little bit more complex in which the excited electronic states have many contributions of different molecular orbitals, with even a reverse (R) molecule-to-metal charge transfer transition appearing, above all in an external face coordination. In any case, the enhancement of the two bands recorded in the 300–500 cm−1 wavenumber region could not be due to an intramolecular resonance transition, given that DFT calculations predict a higher energy transition for all complexes than the employed exciting line (532 nm).
Thus, only ordinary Raman spectra that give an idea of the adsorption effect, and the resonant Raman spectra to the first and second excited electronic state that are in the energy order of the exciting line, were calculated for all surface complexes. This allowed us to differentiate which type of chemical contribution could be involved in the selective enhancement of the bands, being due to the subtle effect of the adsorption on the electronic structure of the molecule or to the presence of resonant processes up to new excited metal-to-metal (PL) states or a charge transfer (CT) states of the surface complex.
Figure 4 and Figure 5 show the electrochemical SERS spectra recorded at 0.0 V at the bottom and the calculated ordinary (Figure 4a and Figure 5a) and resonance Raman spectra (Figure 4b and Figure 5b) of Ag2-BPA and Ag2-BPA(OH) complexes, respectively. None of the calculated ordinary Raman spectra of Ag2-BPA (Figure 4a) and Ag2-BPA(OH) (Figure 5a) complexes are able to reproduce the experimental behavior, given that all of them predict the enhancement of two bands recorded at about 1600 and 800 cm−1 and assigned to 8a and 1 modes, respectively, while these bands are very weak in the electrochemical or colloidal SERS spectra. Thus, the selective SERS enhancement due to the adsorption effect is discarded.
However, resonance Raman spectra to the first excited electronic state show a differentiated behavior depending on the metal coordination. In the case of silver complexes coordinated through oxygen atoms, only the Ag2-BPA(OH) complex (Figure 5b) predicts a strong band recorded at 348 cm−1 and assigned to the in-plane bending, deformation of the hydroxyl groups, while that calculated for the Ag2-BPA complex (Figure 4b) predicts an enhancement of the band calculated at 820 cm−1 and assigned to 1 mode, in disagreement with the experimental behaviour. This fact implies that not only do the monohydroxylated species exist in the sonicated solution, but also that there could be another type of interaction that would be responsible for the enhancement of the band recorded at about 470 cm−1. Because this enhanced band corresponds to an out-of-plane benzenic ring mode, a molecular adsorption through the aromatic ring should be investigated, with the two faces of the ring being differentiated. In this case, the calculated resonance Raman spectra of the Ag2-BPA complex with internal and external coordination (Figure 4b) predict a strong band at 435 cm−1, a wavenumber down-shifted about 30 cm−1 from the experimental value (465 cm−1). This feature, together with no enhancement prediction of the 350 cm−1 band, allows us to conclude that the BPA species is not present in the sonicated solution. However, the calculated resonance Raman spectra of the Ag2-BPA(OH) complex with an internal coordination (Figure 5b) predicts the most intense band at 478 cm−1, while the most intense band for an external coordination (Figure 5b) is calculated at about 1300 cm−1, not observed in the SERS experiments. Thus, BPA(OH) is the chemical species adsorbed in the metal surface and responsible for the two enhanced SERS bands at 348 and 478 cm−1 due to a plasmon-like resonance inside the silver cluster.
Additionally, in order to discard a metal-to-molecule charge transfer contribution to the SERS enhancement, the resonance Raman spectra to the second excited electronic state, CT0F state, were calculated, given that it is close in energy (about 3.8 eV) to the first excited state, PL0 state, (about 3.3 eV). These spectra are plotted in Figure S5. In this case, they predict an enhancement of the 1 and 8a modes being the most intense band recorded at 820 cm−1 (1 mode) for any metal coordination through the aromatic ring. This behavior is observed in the electrochemical experiments at more negative values of the electrode potential. For example, at −1.0 V the most intense band is recorded at 820 cm−1 and the above-mentioned enhanced bands, 348 and 478 cm−1, become weaker. This could be due to two effects, the electronic repulsion between the electron pair of oxygen atoms and the negative charge of the metal surface and the out-of-resonance to the first excited electronic state, being only able to reach the second excited state at a more negative electrode potential in a pre-resonance condition. Thus, a significant contribution of a CT mechanism could be present in SERS spectrum recorded at −1.0 V electrode potential.
In summary, BPA(OH) is the chemical species adsorbed on the silver surface and responsible for the two enhanced SERS bands at 348 and 478 cm−1 due to a plasmon-like resonance inside the silver cluster. When the electrode potential is at more negative values, for example, at −1.0 V, the most intense band is recorded at 820 cm−1 and the above-mentioned enhanced bands, 348 and 478 cm−1, become weaker. The experiment results agree with calculation of the resonance Raman spectra to the second excited electronic state, CT0F state, at which the most intense band is recorded at 820 cm−1.

4. Conclusions

Different colloidal AgNPs without surface functionalization were tested as SERS substrates for sensing BPA in a sonicated aqueous solution. The SERS spectra are characterized by two strong bands, recorded at about 350 and 460 cm−1 due to the presence of the monohydroxilated species, BPA(OH), generated in the sonication process. The use of the standard Ag@Citr NPs allows reaching the best limit of quantification (2.3 μg/mL) among other colloidal SERS substrates employed in this work, such as Ag@BH, Ag@HX, and Ag@βCD NPs. This is a simple and a direct experimental procedure able to detect BPA in aqueous environment with an amount two times lower than the tolerable daily intake (4 μg/kg body weight/day) proposed for the EFSA (European Food Safety Agent) in 2015.
Regarding the nature of the SERS enhancement, TD-DFT calculations on electronic structure of different Ag2-BPA and Ag2-BPA(OH) complexes and their respective calculated ordinary and resonance Raman spectra to the first excited electronic state point out that a surface plasmon-like resonance inside the silver cluster is responsible for the enhancement of the bands corresponding to the physisorbed BPA(OH) species, with a discarded charge transfer enhancement mechanism or an intramolecular resonance transition being localized in the phenolic framework or even an effect due to the molecular adsorption. In addition, the molecular interaction of BPA(OH) with metallic surface occurs through the two oxygen atoms as well as through the internal face of the aromatic ring. Once more, DFT calculations are a useful tool to analyze the SERS spectra, contributing to an elucidation of the enhancement mechanism involved in a SERS record. Additionally, a close relationship between SERS spectra and the electronic structure of the metal–adsorbate complex seems to be established.

Supplementary Materials

The following are available online at https://www.mdpi.com/article/10.3390/chemosensors11020078/s1, Table S1: Experimental conditions and characterization of the different AgNPs, Figure S1: Experimental Raman spectrum of the BPA solid and that theoretical at CAM-B3LYP/def2-TZVPP level of calculation. The calculated wavenumbers are not scaled, Figure S2: Vectorial representation of the vibrational motions corresponding to the two strongest SERS bands. Wavenumbers calculated at CAM-B3LYP/def2-TZVPP level, Figure S3: Optimized CAM-B3LYP/def2-TZVPP structures of isolated (a) BPA and (b) BPA(OH), Figure S4: Optimized CAM-B3LYP/def2-TZVPP structures of (a) Ag2-BPA and (b) Ag2-BPA(OH) complexes in which silver atoms are coordinated through the oxygen atoms, Table S2: TD-CAM-B3LYP/def2-TZVPP excitation energies (ΔE) and oscillator force (f) at the Franck-Condon point corresponding to the first ten singlets of isolated BPA and BPA(OH), Table S3: TD-CAM-B3LYP/def2-TZVPP excitation energies (ΔE) and oscillator force (f) at the Franck-Condon point corresponding to the first ten singlets of the different Ag2-BPA and Ag2-BPA(OH) complexes coordinated through the oxygen atoms and their corresponding charges transferred (Δq), Table S4: TD-CAM-B3LYP/def2-TZVPP excitation energies (ΔE) and oscillator force (f) at the Franck-Condon point corresponding to the first ten singlets of the different Ag2-BPA and Ag2-BPA(OH) complexes coordinated through one face of the aromatic ring and their corresponding charges transferred (Δq), Figure S5: CAM-B3LYP/def2-TZVPP resonance Raman spectra to the first charge transfer (CT) state of (a) Ag2-BPA and (b) Ag2-BPA(OH) complexes in which silver atoms are coordinated through internal and external ring face. The insets show the resonance Raman spectra to the first plasmon-like (PL) state. Reference [37] is cited in the supplementary materials.

Author Contributions

Conceptualization, I.L.-T.; formal analysis, I.L.-T.; investigation, M.L.D.S., S.V., I.L.-T. and J.C.O.; SERS experiments, M.L.D.S. and I.L.-T.; DFT calculations, S.V.; writing—original draft preparation, I.L.-T.; writing—review and editing, I.L.-T.; funding acquisition, J.C.O. and I.L.-T. All authors have read and agreed to the published version of the manuscript.

Funding

This research was funded by Junta de Andalucía/FEDER (UMA18-FEDERJA-049 and P18-RT-4592).

Institutional Review Board Statement

Not Applicable.

Informed Consent Statement

Not Applicable.

Data Availability Statement

Not Applicable.

Acknowledgments

The authors thank to the Supercomputing and Bioinnovation Center (University of Málaga) for computational resources and Rafael Larrosa for technical support.

Conflicts of Interest

The authors declare no conflict of interest.

References

  1. Vasiljevic, T.; Harner, T. Bisphenol A and Its Analogues in Outdoor and Indoor Air: Properties, Sources and Global Levels. Sci. Total Environ. 2021, 789, 148013. [Google Scholar] [CrossRef] [PubMed]
  2. Abraham, A.; Chakraborty, P. A Review on Sources and Health Impacts of Bisphenol A. Rev. Environ. Health 2020, 35, 201–210. [Google Scholar] [CrossRef] [PubMed]
  3. Hengstler, J.G.; Foth, H.; Gebel, T.; Kramer, P.J.; Lilienblum, W.; Schweinfurth, H.; Völkel, W.; Wollin, K.M.; Gundert-Remy, U. Critical Evaluation of Key Evidence on the Human Health Hazards of Exposure to Bisphenol A. Crit. Rev. Toxicol. 2011, 41, 263–291. [Google Scholar] [CrossRef] [PubMed] [Green Version]
  4. World Health Organization; FAO. Joint FAO/WHO Expert Meeting to Review Toxicological and Health Aspects of Bisphenol A. Final Report, Including Report of Stakeholder Meeting on Bisphenol A, 1–5 November 2010, Ottawa, Canada; World Health Organization: Geneva, Switzerland, 2011; Available online: https://apps.who.int/iris/handle/10665/44624 (accessed on 15 November 2022).
  5. Ragavan, K.V.; Rastogi, N.K.; Thakur, M.S. Sensors and Biosensors for Analysis of Bisphenol-A. TrAC Trends Analyt. Chem. 2013, 52, 248–260. [Google Scholar] [CrossRef]
  6. Sheng, W.; Duan, W.; Shi, Y.; Chang, Q.; Zhang, Y.; Lu, Y.; Wang, S. Sensitive Detection of Bisphenol A in Drinking Water and River Water Using an Upconversion Nanoparticles-Based Fluorescence Immunoassay in Combination with Magnetic Separation. Anal. Methods 2018, 10, 5313–5320. [Google Scholar] [CrossRef]
  7. Feng, Y.; Ning, B.; Su, P.; Wang, H.; Wang, C.; Chen, F.; Gao, Z. An Immunoassay for Bisphenol A Based on Direct Hapten Conjugation to the Polystyrene Surface of Microtiter Plates. Talanta 2009, 80, 803–808. [Google Scholar] [CrossRef]
  8. Ballesteros-Gómez, A.; Rubio, S.; Pérez-Bendito, D. Analytical Methods for the Determination of Bisphenol A in Food. J. Chromatogr. A 2009, 1216, 449–469. [Google Scholar] [CrossRef]
  9. Sun, F.; Kang, L.; Xiang, X.; Li, H.; Luo, X.; Luo, R.; Lu, C.; Peng, X. Recent Advances and Progress in the Detection of Bisphenol A. Anal. Bioanal. Chem. 2016, 408, 6913–6927. [Google Scholar] [CrossRef]
  10. Martín-Pozo, L.; Martín-Bueno, J.; Moscoso-Ruiz, I.; Zafra-Gómez, A. Methods of Bisphenol A Detection by Gas Chromatography and Mass Spectrometry (GC-Ms) in Human Breast Milk and Foodstuff. In Emerging Contaminants in the Environment: Challenges and Sustainable Practices; Sarma, H., Dominguez, D.C., Lee, W.Y., Eds.; Elsevier: Amsterdam, The Netherlands, 2022; Chapter 18; pp. 465–493. [Google Scholar] [CrossRef]
  11. Zhang, X.; Zhu, D.; Huang, C.; Sun, Y.; Lee, Y.I. Sensitive Detection of Bisphenol A in Complex Samples by In-Column Molecularly Imprinted Solid-Phase Extraction Coupled with Capillary Electrophoresis. Microchem. J. 2015, 121, 1–5. [Google Scholar] [CrossRef]
  12. Yahaya, N.; Huang, Z.; Yan, B.; Chen, D.D.Y. Capillary Electrophoresis–Mass Spectrometry Analysis of Bisphenol A and Its Analogues in Bottled Tea Beverages with Dynamic PH Focusing. Food Chem. 2022, 372, 131220. [Google Scholar] [CrossRef]
  13. Shareef, A.; Angove, M.J.; Wells, J.D.; Johnson, B.B. Aqueous Solubilities of Estrone, 17β-Estradiol, 17α-Ethynylestradiol, and Bisphenol A. J. Chem. Eng. Data 2006, 51, 879–881. [Google Scholar] [CrossRef]
  14. Aroca, R. Surface-Enhanced Vibrational Spectroscopy; John Wiley & Sons Ltd.: Chichester, UK, 2006. [Google Scholar]
  15. Pilot, R. SERS Detection of Food Contaminants by Means of Portable Raman Instruments. J. Raman Spectrosc. 2018, 49, 954–981. [Google Scholar] [CrossRef]
  16. Furini, L.N.; Constantino, C.J.L.; Sanchez-Cortes, S.; Otero, J.C.; López-Tocón, I. Adsorption of Carbendazim Pesticide on Plasmonic Nanoparticles Studied by Surface-Enhanced Raman Scattering. J. Colloid. Interface Sci. 2016, 465, 183–189. [Google Scholar] [CrossRef] [Green Version]
  17. López-Tocón, I.; Otero, J.C.; Arenas, J.F.; García-Ramos, J.V.; Sánchez-Cortés, S. Trace Detection of Triphenylene by Surface Enhanced Raman Spectroscopy Using Functionalized Silver Nanoparticles with Bis-Acridinium Lucigenine. Langmuir 2010, 26, 6977–6981. [Google Scholar] [CrossRef]
  18. Moskovits, M. Surface-Enhanced Raman Spectroscopy: A Brief Perspective. In Surface-Enhanced Raman Scattering. Topics in Applied Physics; Kneipp, K., Moskovits, M., Kneipp, H., Eds.; Springer: Berlin/Heidelberg, Germany, 2006; Volume 103, pp. 1–17. [Google Scholar] [CrossRef]
  19. López-Tocón, I.; Otero, J.C.; Arenas, J.F.; Garcia-Ramos, J.V.; Sanchez-Cortes, S. Multicomponent Direct Detection of Polycyclic Aromatic Hydrocarbons by Surface-Enhanced Raman Spectroscopy Using Silver Nanoparticles Functionalized with the Viologen Host Lucigenin. Anal. Chem. 2011, 83, 2518–2525. [Google Scholar] [CrossRef]
  20. de Bleye, C.; Dumont, E.; Hubert, C.; Sacré, P.Y.; Netchacovitch, L.; Chavez, P.F.; Hubert, P.; Ziemons, E. A Simple Approach for Ultrasensitive Detection of Bisphenols by Multiplexed Surface-Enhanced Raman Scattering. Anal. Chim. Acta 2015, 888, 118–125. [Google Scholar] [CrossRef]
  21. Roschi, E.; Gellini, C.; Ricci, M.; Sanchez-Cortes, S.; Focardi, C.; Neri, B.; Otero, J.C.; López-Tocón, I.; Smulevich, G.; Becucci, M. Surface-Enhanced Raman Spectroscopy for Bisphenols Detection: Toward a Better Understanding of the Analyte–Nanosystem Interactions. Nanomaterials 2021, 11, 881. [Google Scholar] [CrossRef]
  22. Wang, C.Y.; Zeng, Y.; Shen, A.G.; Hu, J.M. A Highly Sensitive SERS Probe for Bisphenol A Detection Based on Functionalized Au@Ag Nanoparticles. Anal. Methods 2018, 10, 5622–5628. [Google Scholar] [CrossRef]
  23. Lee, E.H.; Lee, S.K.; Kim, M.J.; Lee, S.W. Simple and Rapid Detection of Bisphenol A Using a Gold Nanoparticle-Based Colorimetric Aptasensor. Food Chem. 2019, 287, 205–213. [Google Scholar] [CrossRef]
  24. Liu, S.; Fu, Y.; Xiong, C.; Liu, Z.; Zheng, L.; Yan, F. Detection of Bisphenol A Using DNA-Functionalized Graphene Field Effect Transistors Integrated in Microfluidic Systems. ACS Appl. Mater. Interfaces 2018, 10, 23522–23528. [Google Scholar] [CrossRef]
  25. Guerrini, L.; Garcia-Ramos, J.V.; Domingo, C.; Sanchez-Cortes, S. Sensing Polycyclic Aromatic Hydrocarbons with Dithiocarbamate-Functionalized Ag Nanoparticles by Surface-Enhanced Raman Scattering. Anal. Chem. 2009, 81, 953–960. [Google Scholar] [CrossRef]
  26. Inoue, M.; Masuda, Y.; Okada, F.; Sakurai, A.; Takahashi, I.; Sakakibara, M. Degradation of Bisphenol A Using Sonochemical Reactions. Water Res. 2008, 42, 1379–1386. [Google Scholar] [CrossRef]
  27. Gültekin, I.; Ince, N.H. Ultrasonic Destruction of Bisphenol-A: The Operating Parameters. Ultrason. Sonochem. 2008, 15, 524–529. [Google Scholar] [CrossRef]
  28. Ye, X.; Zhou, X.; Needham, L.L.; Calafat, A.M. In-Vitro Oxidation of Bisphenol A: Is Bisphenol A Catechol a Suitable Biomarker for Human Exposure to Bisphenol A? Anal. Bioanal. Chem. 2011, 399, 1071–1079. [Google Scholar] [CrossRef]
  29. Guo, Z.; Feng, R. Ultrasonic Irradiation-Induced Degradation of Low-Concentration Bisphenol A in Aqueous Solution. J. Hazard. Mater. 2009, 163, 855–860. [Google Scholar] [CrossRef]
  30. López-Tocón, I.; Valdivia, S.; Soto, J.; Otero, J.C.; Muniz-Miranda, F.; Menziani, M.C.; Muniz-Miranda, M. A DFT Approach to the Surface-Enhanced Raman Scattering of 4-Cyanopyridine Adsorbed on Silver Nanoparticles. Nanomaterials 2019, 9, 1211. [Google Scholar] [CrossRef] [Green Version]
  31. López-Tocón, I.; Imbarack, E.; Soto, J.; Sanchez-Cortes, S.; Leyton, P.; Otero, J.C. Intramolecular and Metal-to-Molecule Charge Transfer Electronic Resonances in the Surface-Enhanced Raman Scattering of 1,4-Bis((E)-2-(Pyridin-4-Yl)Vinyl)Naphthalene. Molecules 2019, 24, 4622. [Google Scholar] [CrossRef] [Green Version]
  32. Avila, F.; Ruano, C.; Lopez-Tocon, I.; Arenas, J.F.; Soto, J.; Otero, J.C. How the Electrode Potential Controls the Selection Rules of the Charge Transfer Mechanism of SERS. Chem. Commun. 2011, 47, 4213–4215. [Google Scholar] [CrossRef]
  33. Román-Pérez, J.; López-Tocón, I.; Castro, J.L.; Arenas, J.F.; Soto, J.; Otero, J.C. The Electronic Structure of Metal–Molecule Hybrids in Charged Interfaces: Surface-Enhanced Raman Selection Rules Derived from Plasmon-like Resonances. Phys. Chem. Chem. Phys. 2014, 17, 2326–2329. [Google Scholar] [CrossRef]
  34. Arenas, J.F.; López Tocón, I.; Otero, J.C.; Marcos, J.I. Charge Transfer Processes in Surface-Enhanced Raman Scattering. Franck−Condon Active Vibrations of Pyridine. J. Phys. Chem. 1996, 100, 9254–9261. [Google Scholar] [CrossRef]
  35. Yao, G.; Zhai, Z.; Zhong, J.; Huang, Q. DFT and SERS Study of 15N Full-Labeled Adenine Adsorption on Silver and Gold Surfaces. J. Phys. Chem. C 2017, 121, 9869–9878. [Google Scholar] [CrossRef]
  36. Yao, G.; Huang, Q. DFT and SERS Study of l-Cysteine Adsorption on the Surface of Gold Nanoparticles. J. Phys. Chem. C 2018, 122, 15241–15251. [Google Scholar] [CrossRef]
  37. de Souza, M.L.; Otero, J.C.; López-Tocón, I. Comparative Performance of Citrate, Borohydride, Hydroxylamine and β-Cyclodextrin Silver Sols for Detecting Ibuprofen and Caffeine Pollutants by Means of Surface-Enhanced Raman Spectroscopy. Nanomaterials 2020, 10, 2339. [Google Scholar] [CrossRef] [PubMed]
  38. Cañamares, M.V.; Garcia-Ramos, J.V.; Gómez-Varga, J.D.; Domingo, C.; Sanchez-Cortes, S. Comparative Study of the Morphology, Aggregation, Adherence to Glass, and Surface-Enhanced Raman Scattering Activity of Silver Nanoparticles Prepared by Chemical Reduction of Ag+ Using Citrate and Hydroxylamine. Langmuir 2005, 21, 8546–8553. [Google Scholar] [CrossRef] [PubMed]
  39. Leopold, N.; Lendl, B. A New Method for Fast Preparation of Highly Surface-Enhanced Raman Scattering (SERS) Active Silver Colloids at Room Temperature by Reduction of Silver Nitrate with Hydroxylamine Hydrochloride. J. Phys. Chem. B 2003, 107, 5723–5727. [Google Scholar] [CrossRef]
  40. Pande, S.; Ghosh, S.K.; Praharaj, S.; Panigrahi, S.; Basu, S.; Jana, S.; Pal, A.; Tsukuda, T.; Pal, T. Synthesis of Normal and Inverted Gold−Silver Core−Shell Architectures in β-Cyclodextrin and Their Applications in SERS. J. Phys. Chem. C 2007, 111, 10806–10813. [Google Scholar] [CrossRef]
  41. Yanai, T.; Tew, D.P.; Handy, N.C. A New Hybrid Exchange–Correlation Functional Using the Coulomb-Attenuating Method (CAM-B3LYP). Chem. Phys. Lett. 2004, 393, 51–57. [Google Scholar] [CrossRef] [Green Version]
  42. Weigend, F. Accurate Coulomb-Fitting Basis Sets for H to Rn. Phys. Chem. Chem. Phys. 2006, 8, 1057–1065. [Google Scholar] [CrossRef]
  43. Soto, J.; Imbarack, E.; López-Tocón, I.; Sánchez-Cortés, S.; Otero, J.C.; Leyton, P. Application of Surface-Enhanced Resonance Raman Scattering (SERS) to the Study of Organic Functional Materials: Electronic Structure and Charge Transfer Properties of 9,10-Bis((E)-2-(Pyridin-4-Yl)Vinyl)Anthracene. RSC Adv. 2019, 9, 14511–14519. [Google Scholar] [CrossRef] [Green Version]
  44. Valdivia, S.; Avila, F.J.; Otero, J.C.; López-Tocón, I. Voltage Selection of Physisorbed or Chemisorbed 4-Cyanobenzoate on a Nanostructured Silver Electrode and the Dual Electronic Structure of Charged Metal–Molecule Hybrids. Appl. Surf. Sci. 2022, 579, 152071. [Google Scholar] [CrossRef]
  45. Santoro, F.; Cerezo, J. FCclasses 3.0, A Code for Vibronic Calculations. 2021. Available online: http://www.iccom.cnr.it/en/fcclasses (accessed on 25 April 2022).
  46. Santoro, F.; Improta, R.; Lami, A.; Bloino, J.; Barone, V. Effective method tocompute Frank_condon integrals for optical spectra of large molecules in solution. J. Chem. Phys. 2007, 126, 084509. [Google Scholar] [CrossRef] [PubMed]
  47. Dirac, P.A.M. The quantum theory of dispersion. Proc. Math. Phys. Eng. 1927, 114, 710–728. [Google Scholar] [CrossRef]
  48. Albretch, A.C. On the theory of Raman intensities. J. Chem. Phys. 1961, 34, 1476–1484. [Google Scholar] [CrossRef]
  49. Frisch, M.J.; Trucks, G.W.; Schlegel, H.B.; Scuseria, G.E.; Robb, M.A.; Cheeseman, J.R.; Scalmani, G.; Barone, V.; Petersson, G.A.; Nakatsuji, H. Gaussian 16; Gaussian, Inc.: Wallingford, CT, USA, 2016. [Google Scholar]
  50. Schaftenaar, G.; Noordik, J.H. Molden: A Pre- and Post-Processing Program for Molecular and Electronic Structures. J. Comput. Aided Mol. Des. 2000, 14, 123–134. [Google Scholar] [CrossRef]
  51. Geens, T.; Aerts, D.; Berthot, C.; Bourguignon, J.P.; Goeyens, L.; Lecomte, P.; Maghuin-Rogister, G.; Pironnet, A.M.; Pussemier, L.; Scippo, M.L.; et al. A Review of Dietary and Non-Dietary Exposure to Bisphenol-A. Food Chem. Toxicol. 2012, 50, 3725–3740. [Google Scholar] [CrossRef]
  52. EFSA. Bisphenol A: EFSA Draft Opinion Proposes Lowering the Tolerable Daily Intake; EFSA: Parma, Italy, 2021; Available online: https://www.efsa.europa.eu/en/news/bisphenol-efsa-draft-opinion-proposes-lowering-tolerable-daily-intake (accessed on 8 January 2023).
  53. Boys, S.F.; Bernardi, F. The Calculation of Small Molecular Interactions by the Differences of Separate Total Energies. Some Procedures with Reduced Errors. Mol. Phys. 1970, 19, 553–566. [Google Scholar] [CrossRef]
Figure 1. SERS spectra of BPA in a sonicated aqueous solution at different concentration using (a) Ag@BH; (b) Ag@HX; (c) Ag@Citr and (d) Ag@βCD NPs. Raman spectrum of solid at the bottom.
Chemosensors 11 00078 g001
Figure 2. Electrochemical SERS spectra of sonicated BPA/Na2SO4 (1 mM/0.1 M) aqueous solution at different electrode potentials using the 785 nm exciting line. Raman spectrum of solid at the bottom.
Chemosensors 11 00078 g002
Figure 3. Molecular orbitals of the three types of electronic transition in the Ag2-BPA(OH) complex coordinated through the oxygen atoms.
Chemosensors 11 00078 g003
Figure 4. Calculated (a) ordinary and (b) resonance Raman spectra of the Ag2-BPA complex with different silver coordination. SERS spectrum at 0.0 V is plotted at the bottom.
Chemosensors 11 00078 g004
Figure 5. Calculated (a) ordinary and (b) resonance Raman spectra of the Ag2-BPA(OH) complex with different silver coordination. SERS spectrum at 0.0 V is plotted at the bottom.
Chemosensors 11 00078 g005
Table 1. Optimized structures of Ag2-BPA and Ag2-BPA(OH) complexes and their complexation energy.
Coordination
Oxygen AtomsInternal FaceExternal Face
Ag2-BPAChemosensors 11 00078 i001Chemosensors 11 00078 i002Chemosensors 11 00078 i003
Δ E f C P (Kcal/mol)−6.40−7.27−6.71
Ag2-BPA(OH)Chemosensors 11 00078 i004Chemosensors 11 00078 i005Chemosensors 11 00078 i006
Δ E f C P (Kcal/mol)−8.41−7.08−7.00
Disclaimer/Publisher’s Note: The statements, opinions and data contained in all publications are solely those of the individual author(s) and contributor(s) and not of MDPI and/or the editor(s). MDPI and/or the editor(s) disclaim responsibility for any injury to people or property resulting from any ideas, methods, instructions or products referred to in the content.

