
Ultra-Low Detection of Perfluorooctanoic Acid Using a Novel Plasmonic Sensing Approach Combined with Molecularly Imprinted Polymers


 , and
, and 
Abstract
:1. Introduction
2. Materials and Methods
2.1. Chemicals
2.2. MIP and NIP Preparation
2.3. SPR–POF Probe
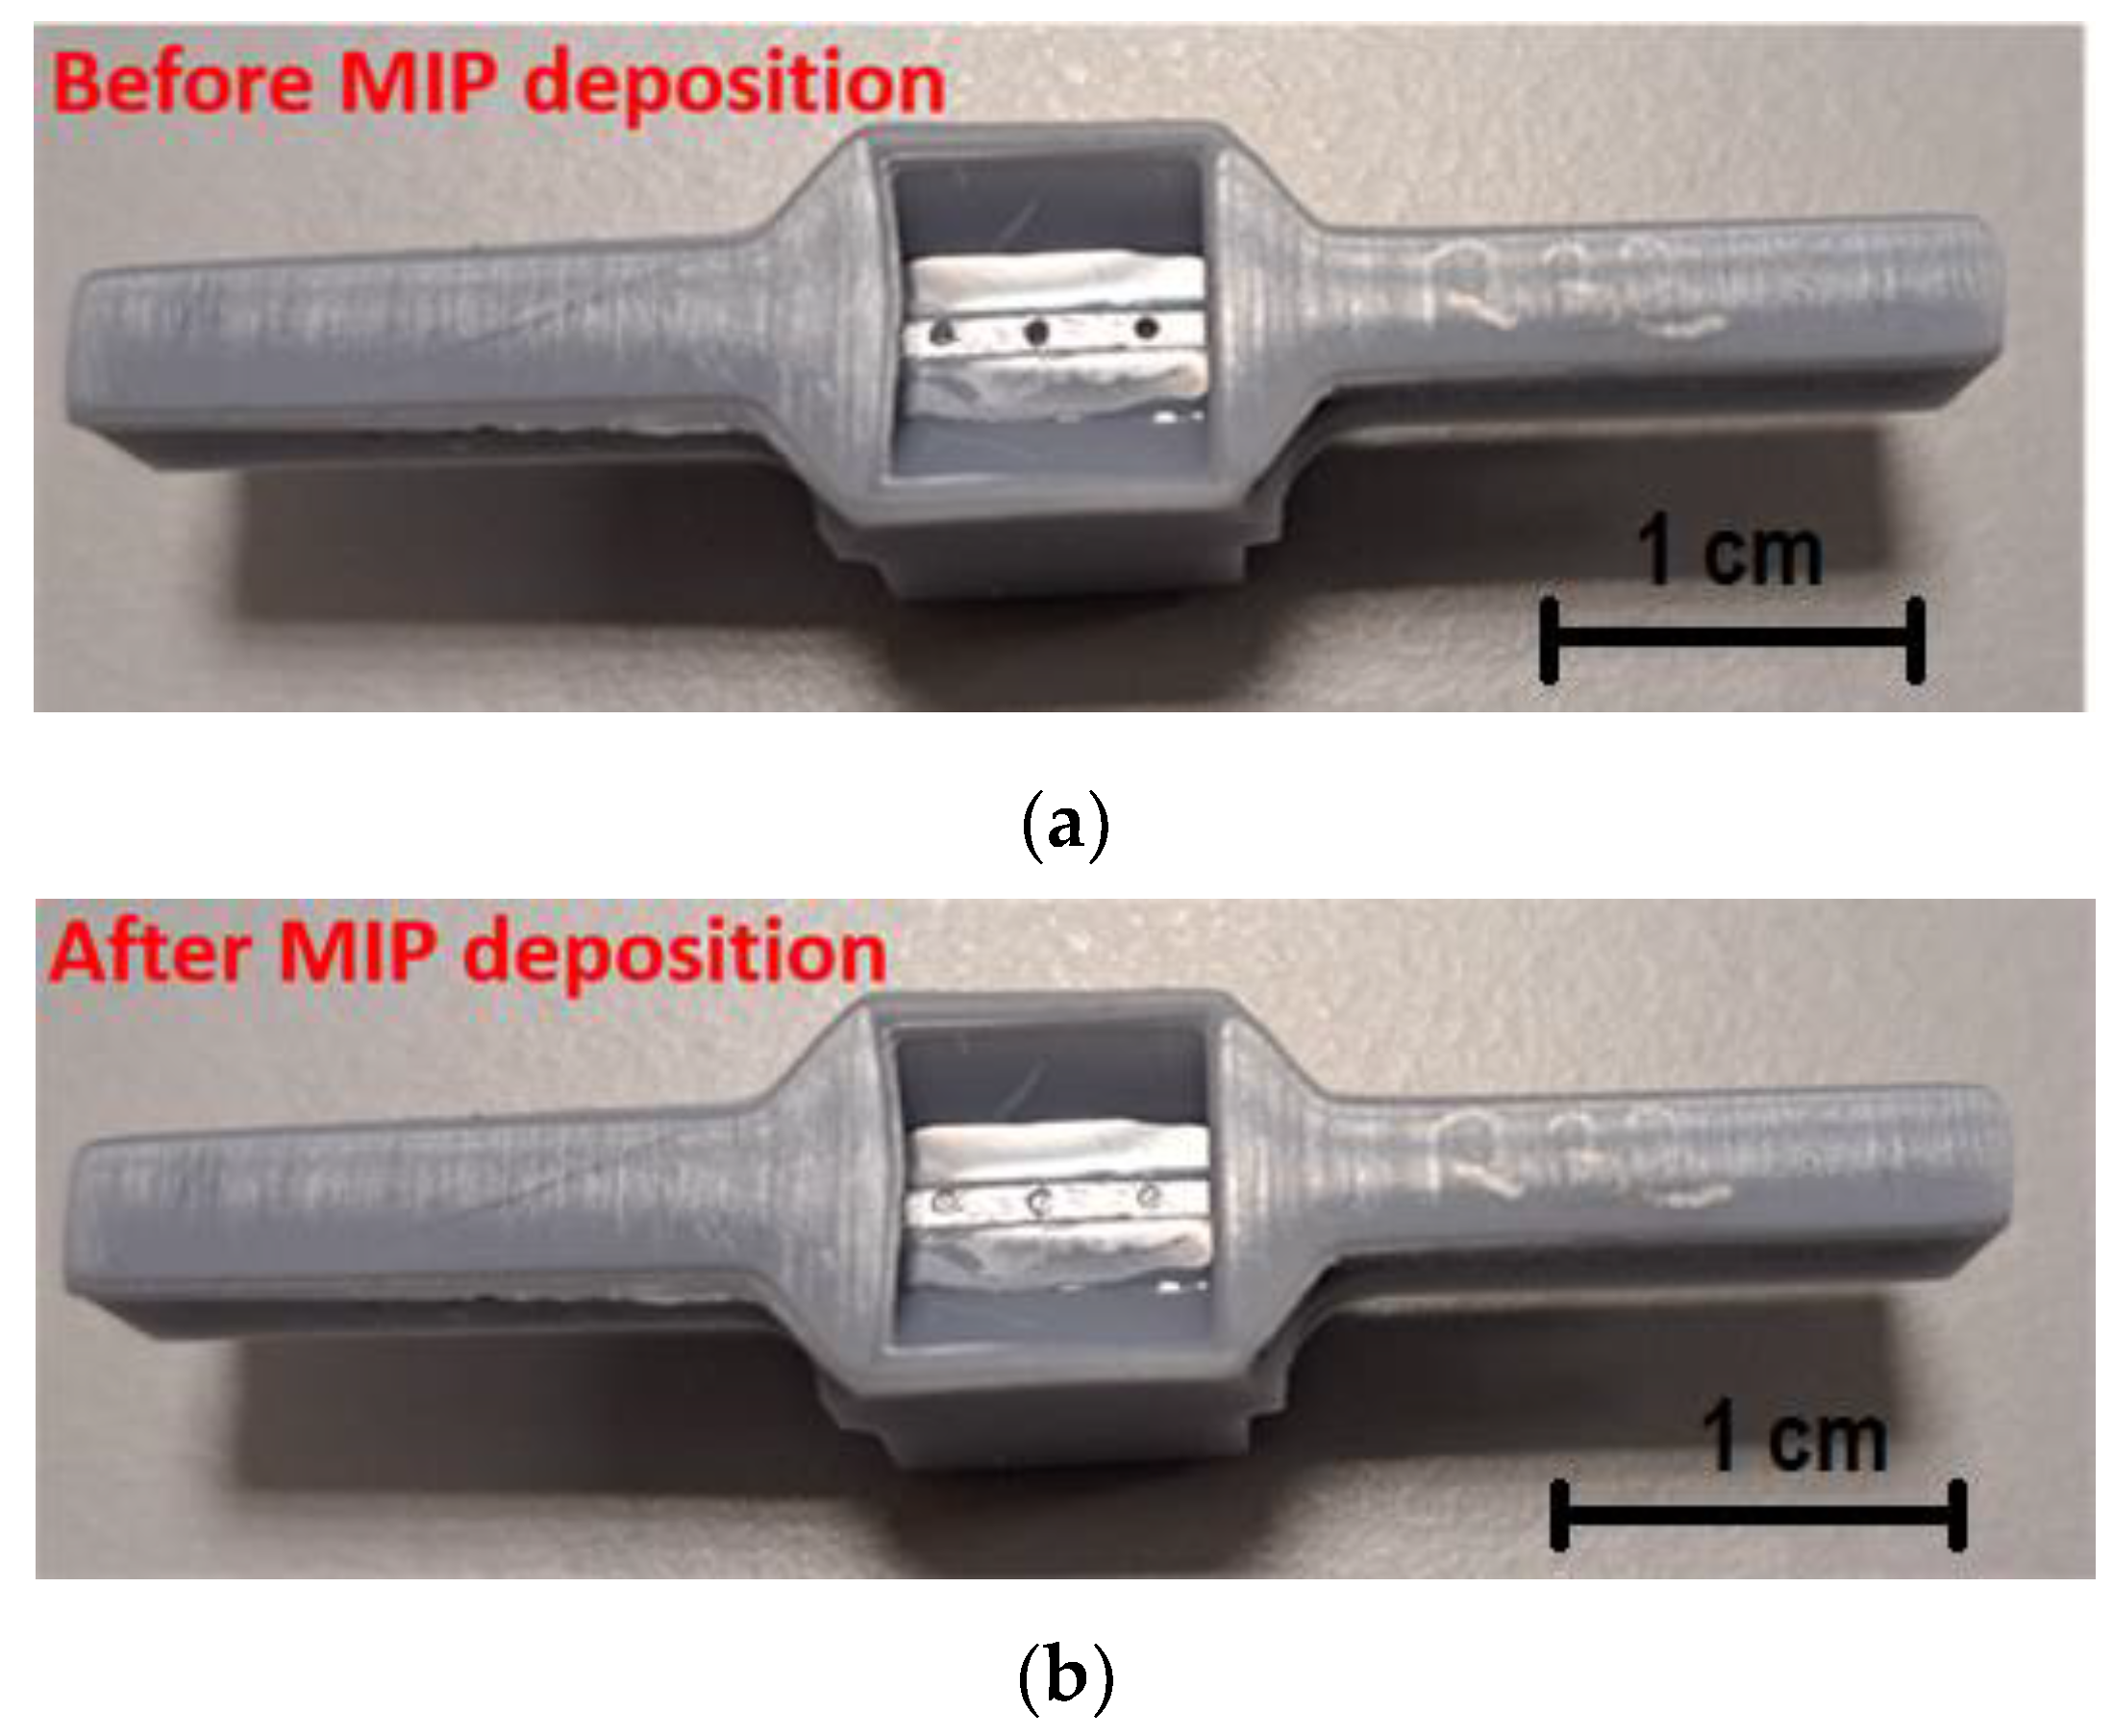
2.4. POF–Chemical Platform
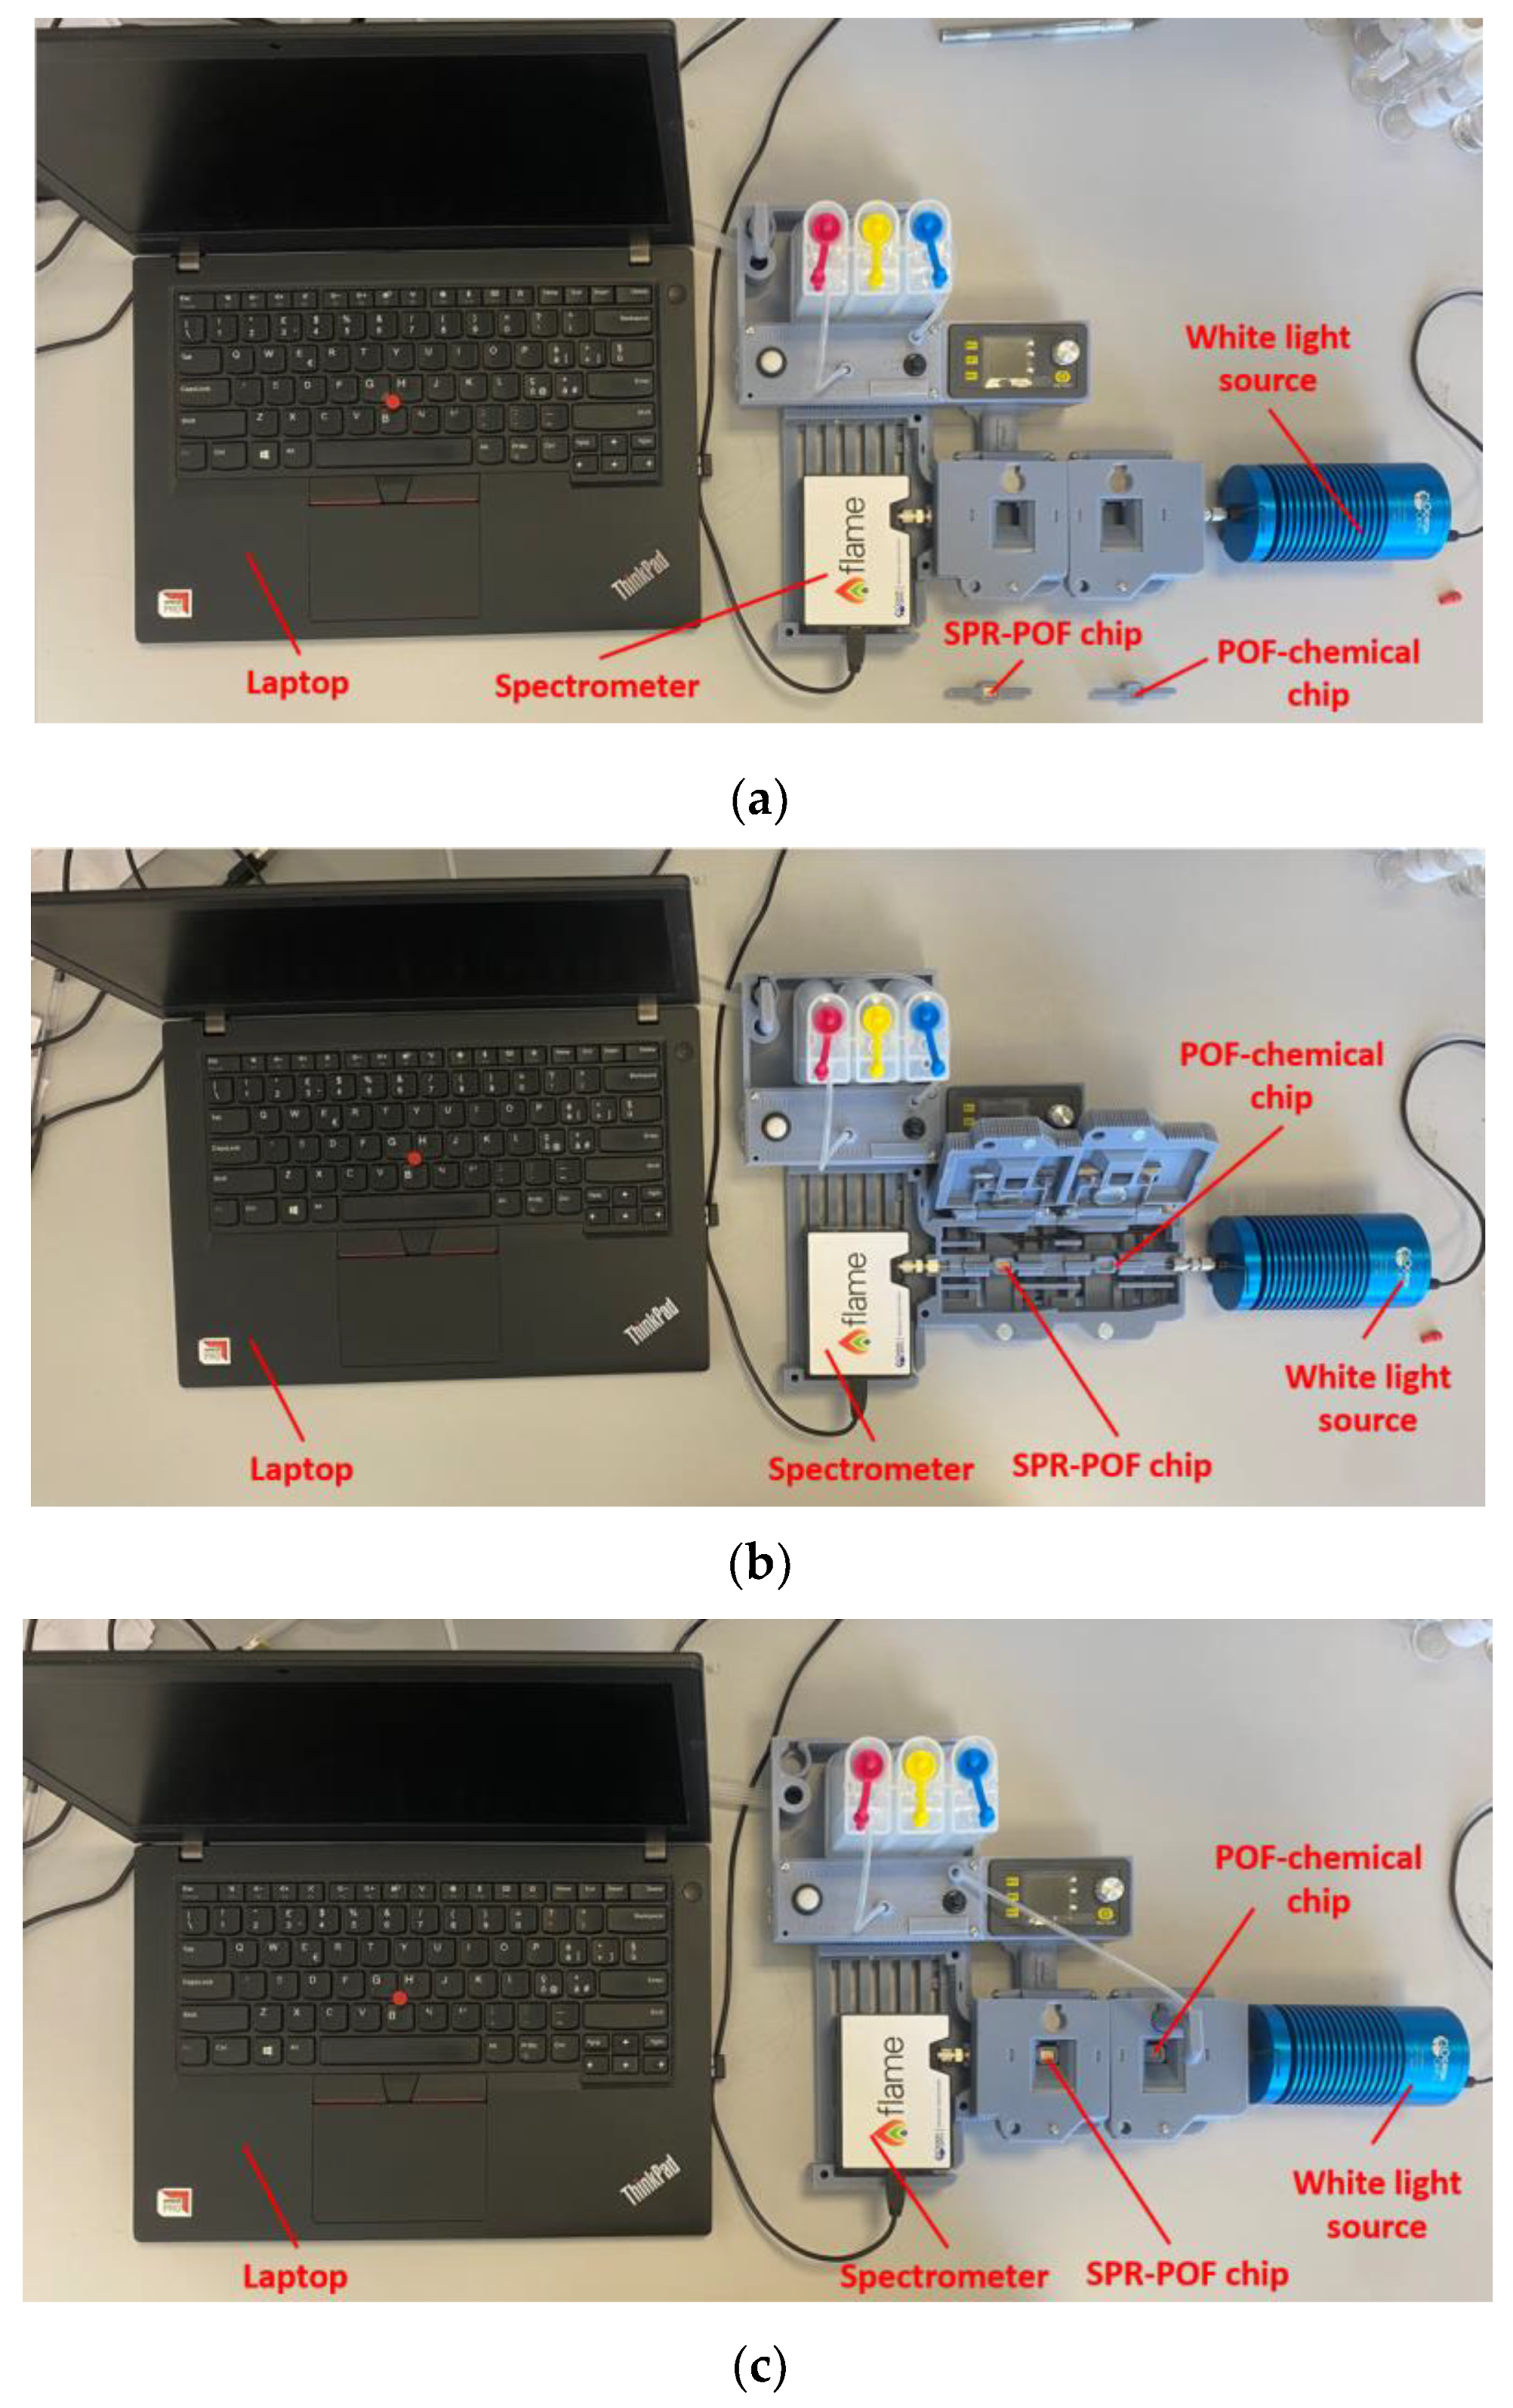
2.5. Experimental Setup
2.6. Sensing Principle and Experimental Procedure
3. Results and Discussion
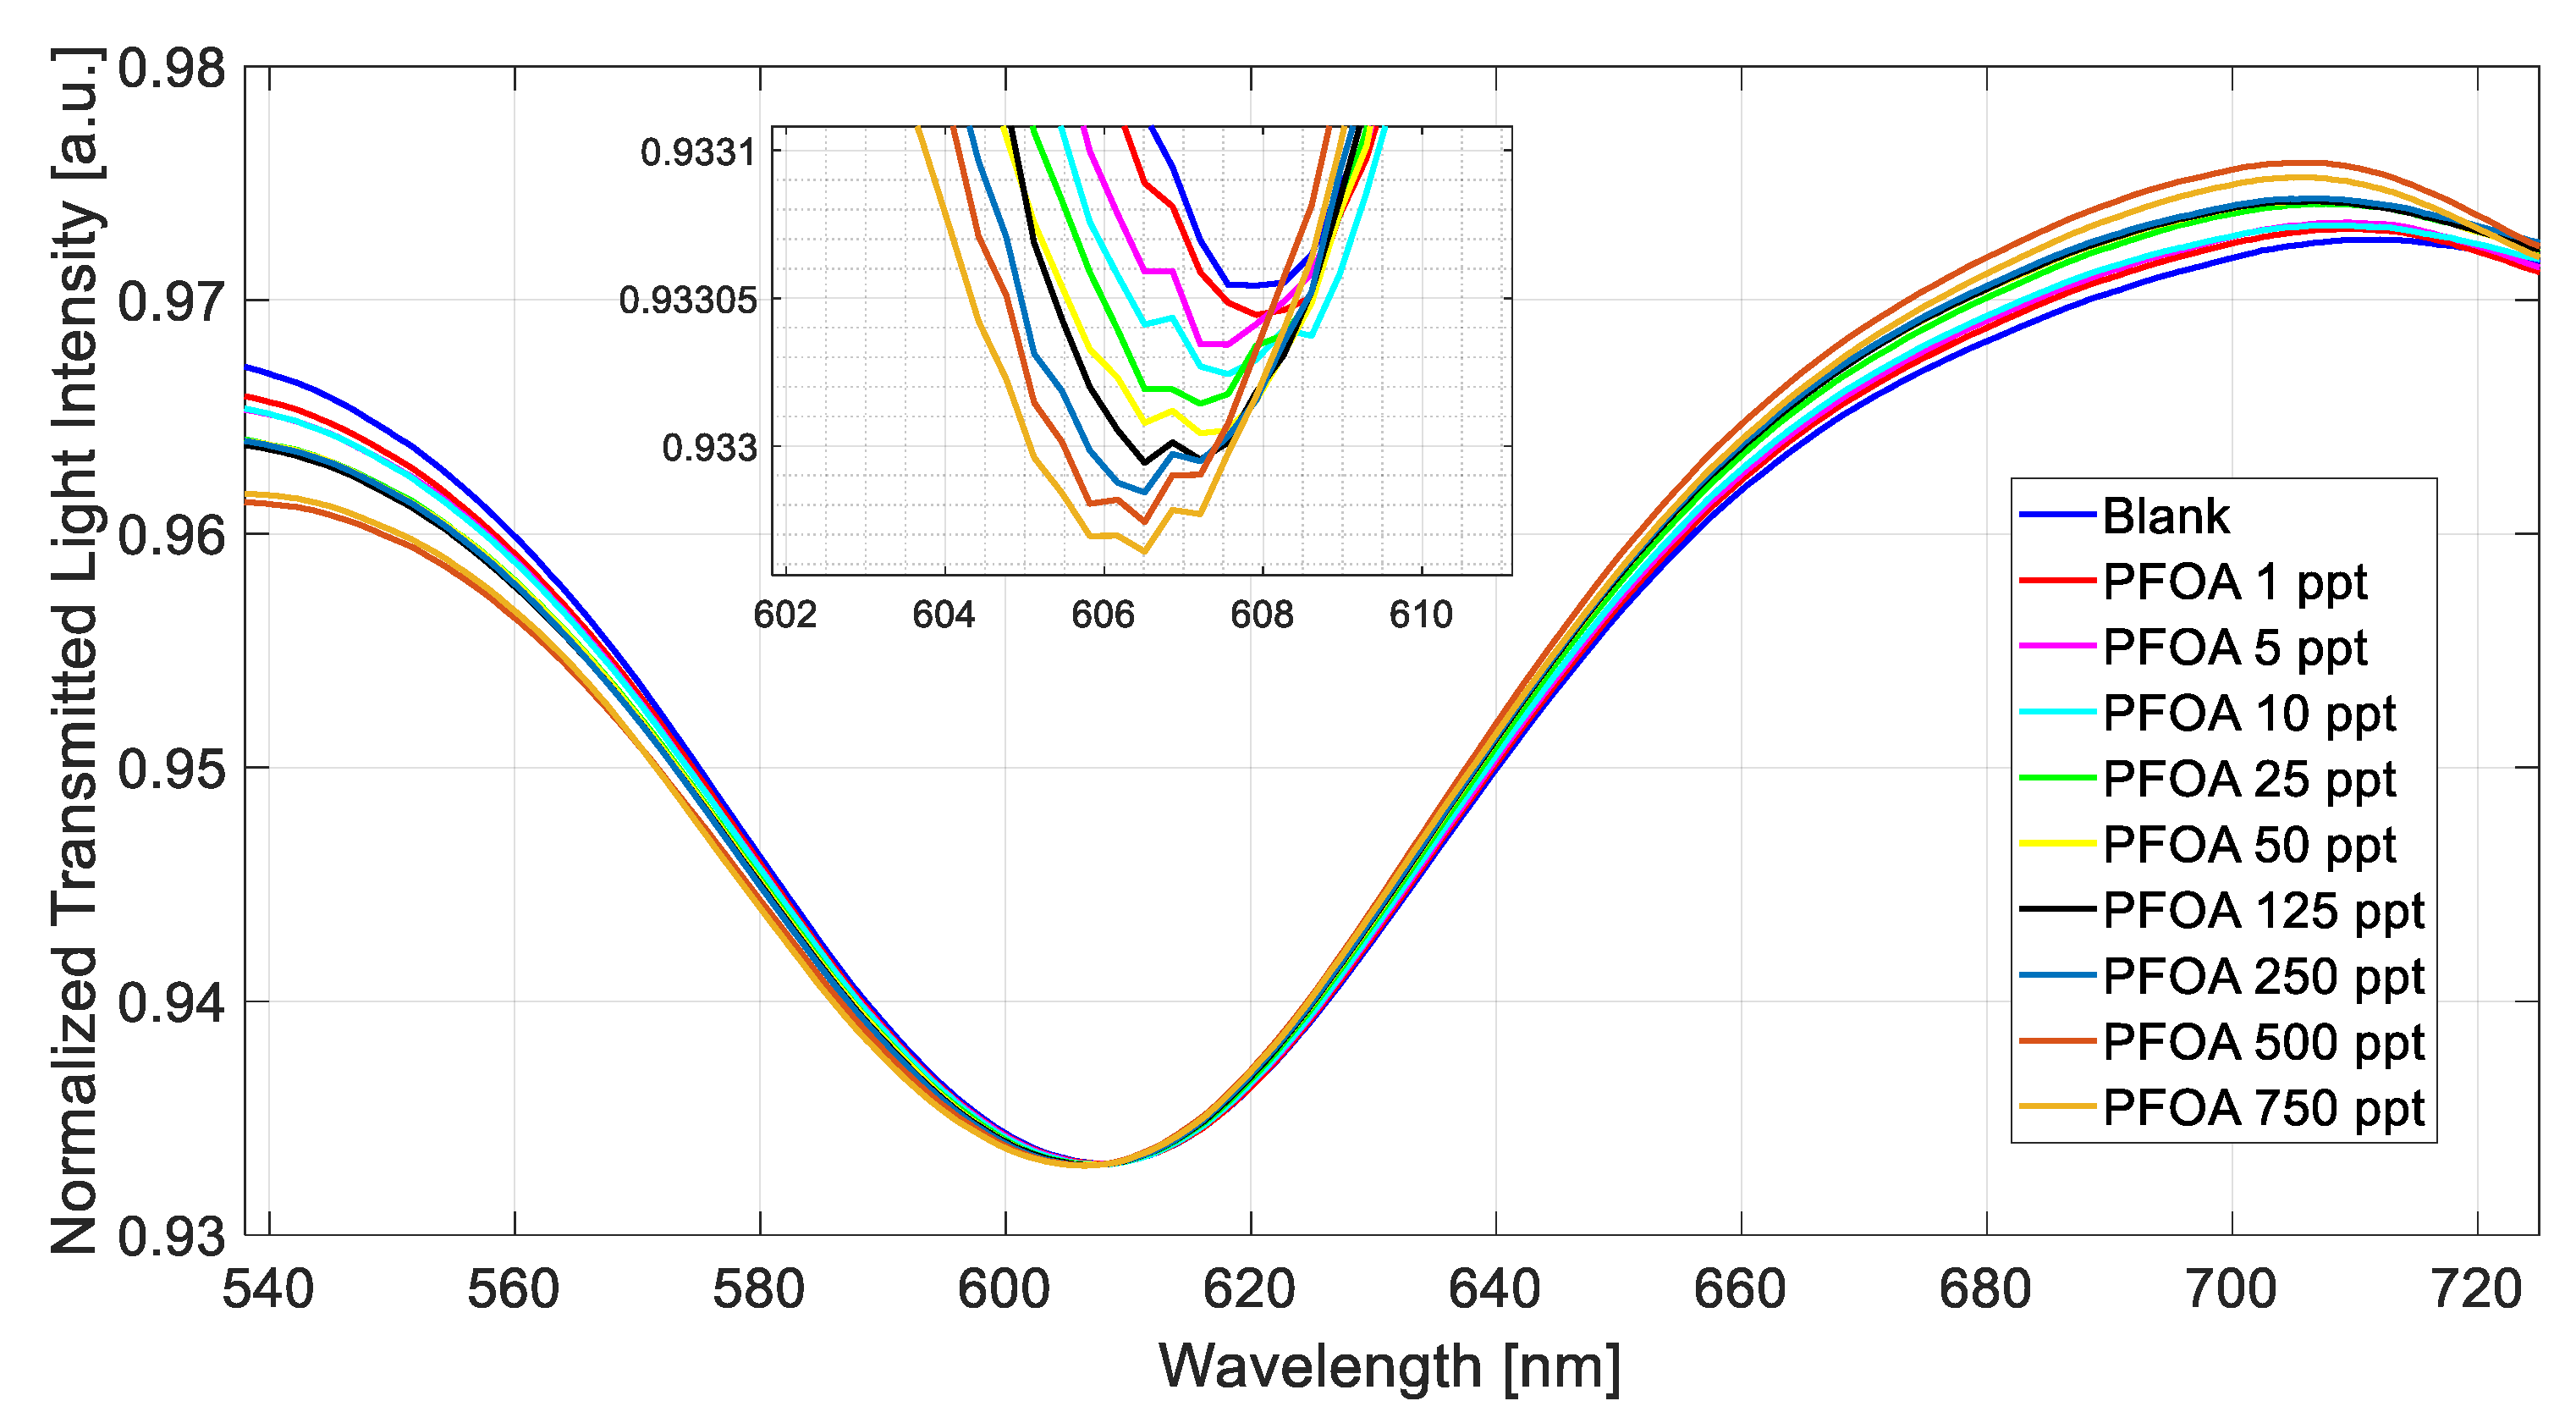
3.1. Preliminary Results in Milli-Q Water
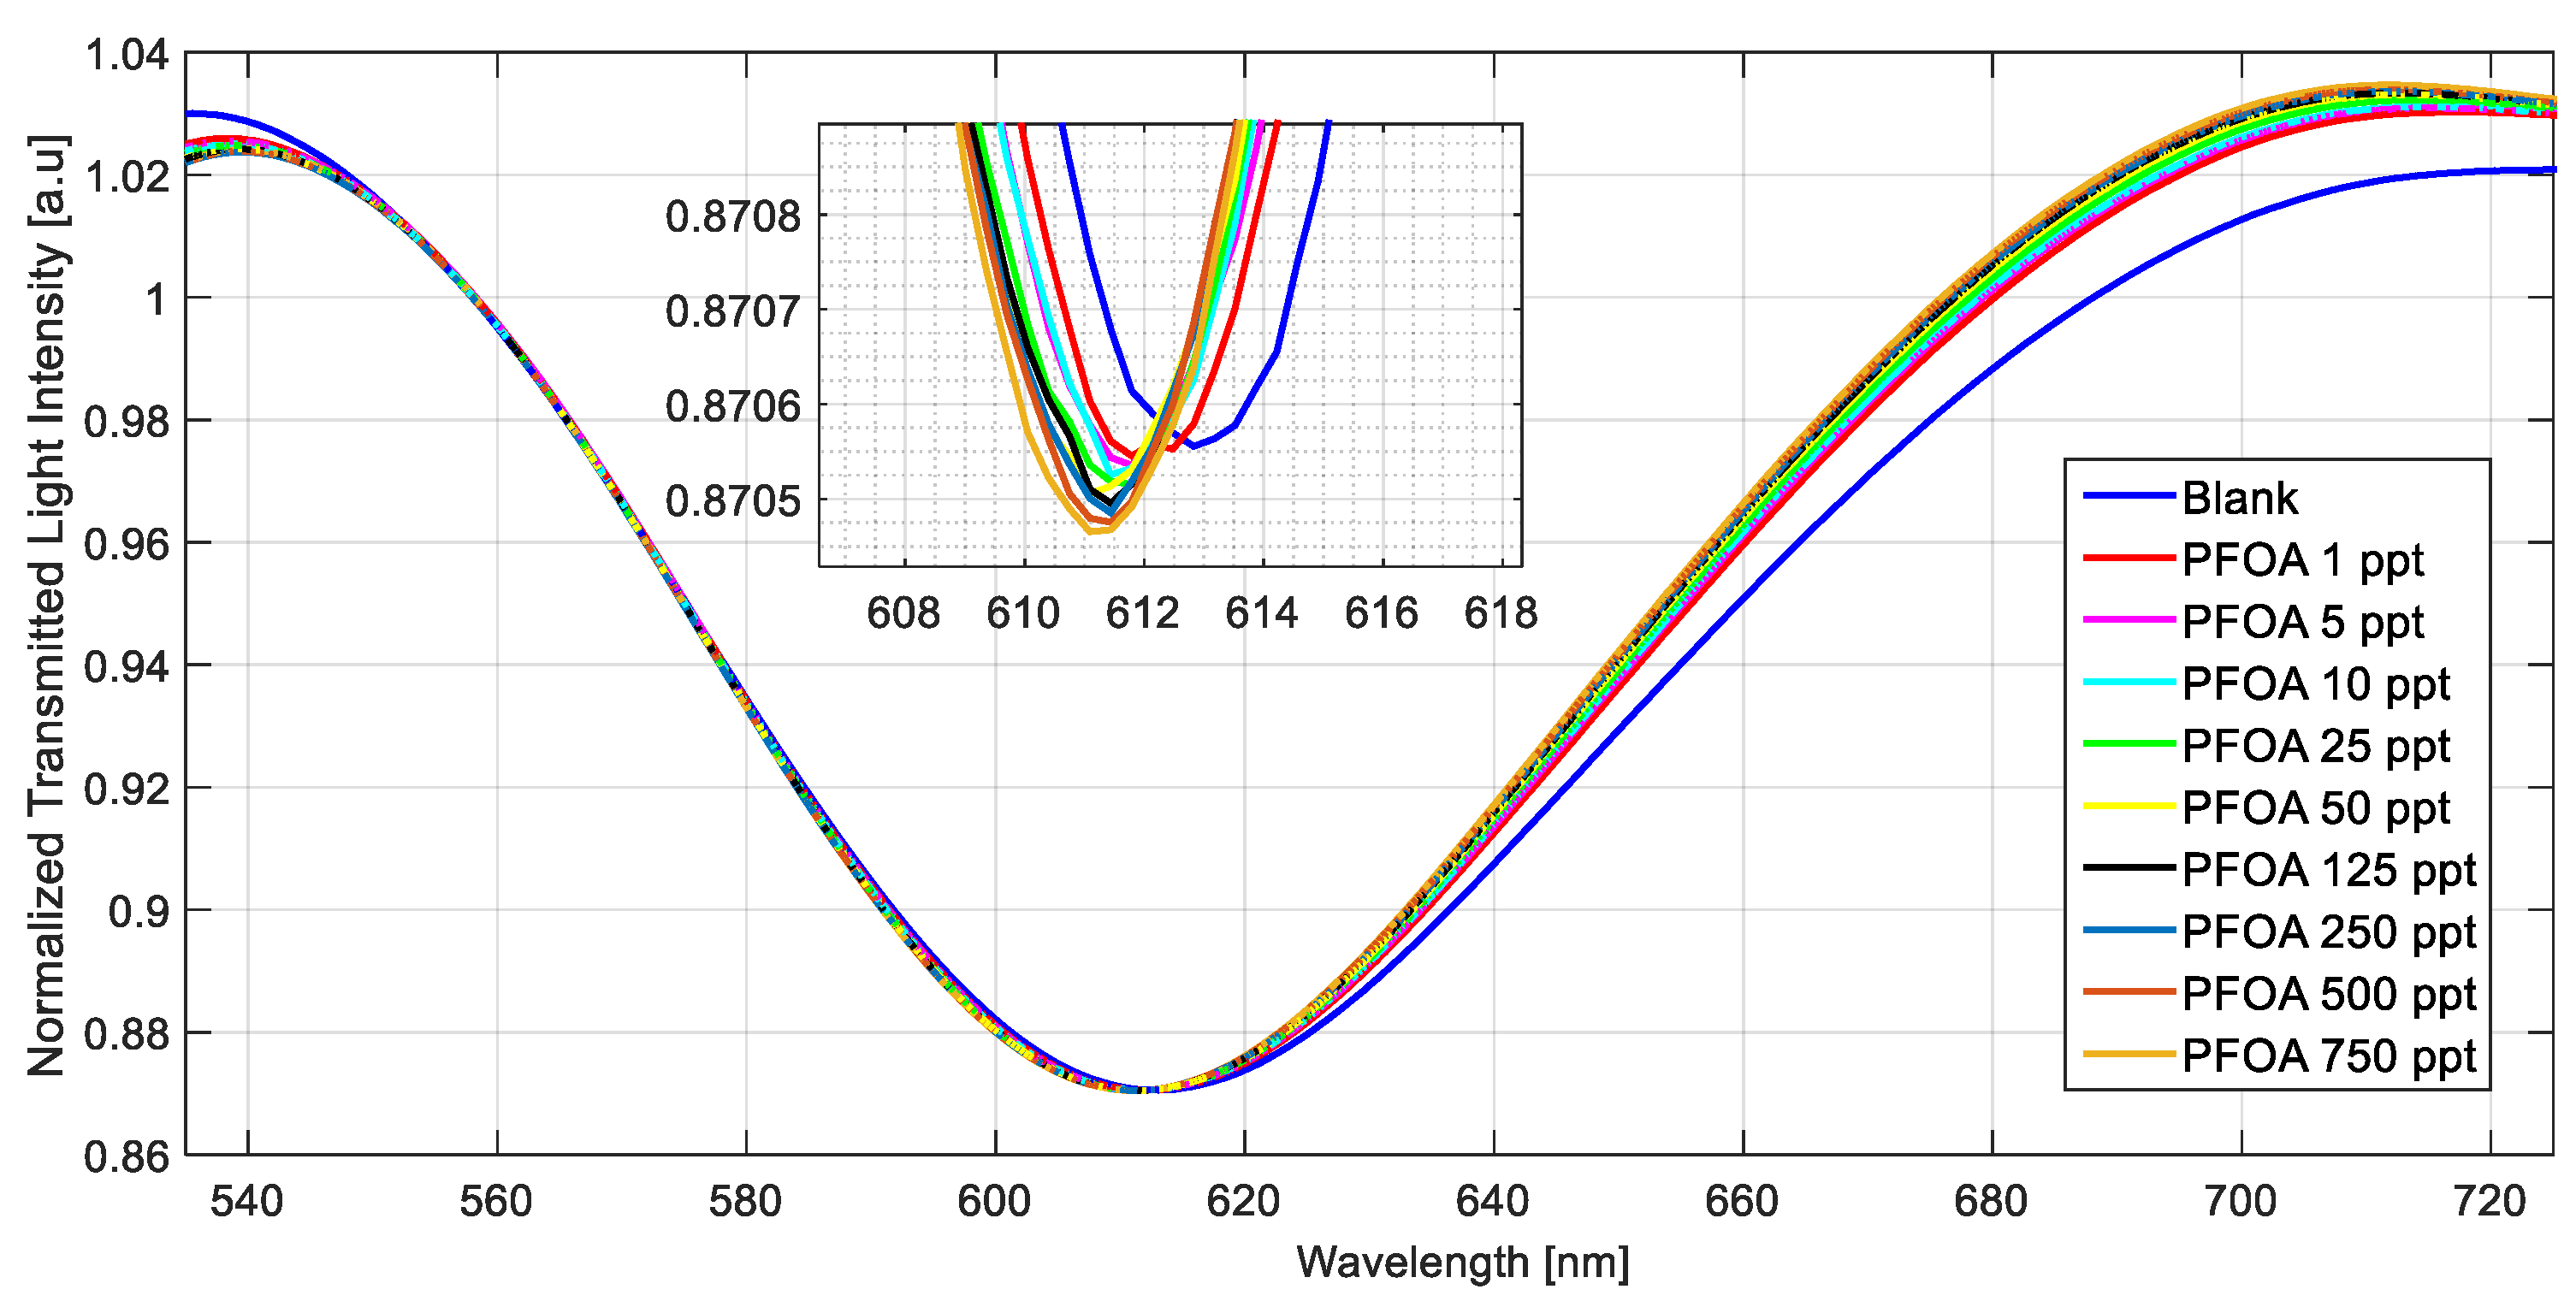
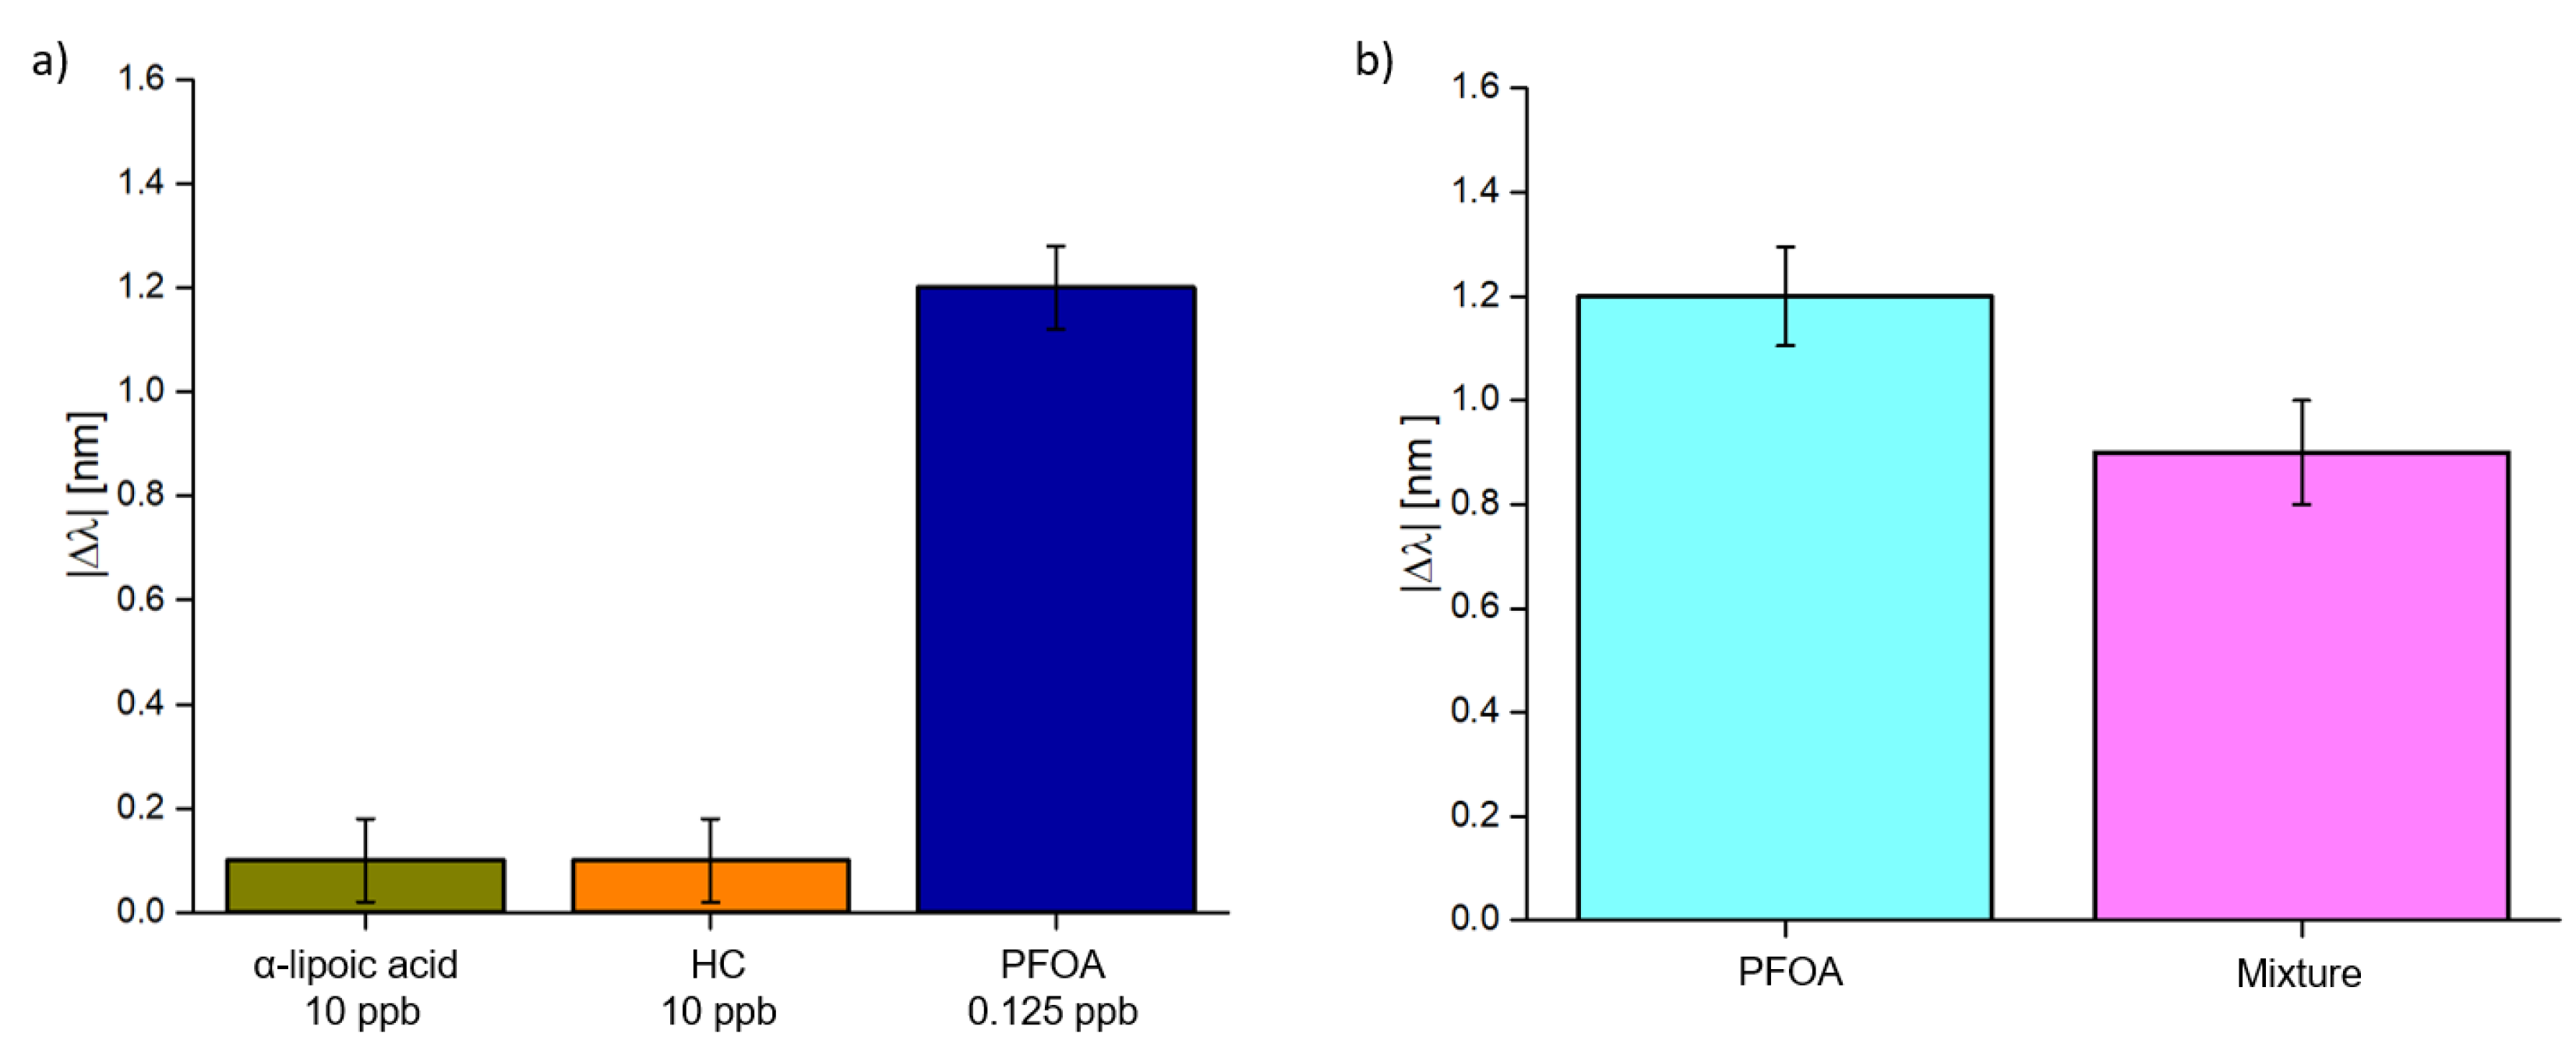
3.2. Selectivity Tests and Experimental Results in Seawater Matrix
3.3. Discussion
4. Conclusions
Author Contributions
Funding
Institutional Review Board Statement
Informed Consent Statement
Data Availability Statement
Conflicts of Interest
References
- Al Amin, M.; Sobhani, Z.; Liu, Y.; Dharmaraja, R.; Chadalavada, S.; Naidu, R.; Chalker, J.M.; Fang, C. Recent Advances in the Analysis of Per- and Polyfluoroalkyl Substances (PFAS)—A Review. Environ. Technol. Innov. 2020, 19, 100879. [Google Scholar] [CrossRef]
- Corsini, E.; Sangiovanni, E.; Avogadro, A.; Galbiati, V.; Viviani, B.; Marinovich, M.; Galli, C.L.; Dell’Agli, M.; Germolec, D.R. In vitro characterization of the immunotoxic potential of several perfluorinated compounds (PFCs). Toxicol. Appl. Pharmacol. 2012, 15, 248–255. [Google Scholar] [CrossRef] [PubMed]
- Corsini, E.; Avogadro, A.; Galbiati, V.; Dell’Agli, M.; Marinovich, M.; Galli, C.L.; Germolec, D.R. In vitro evaluation of the immunotoxic potential of perfluorinated compounds (PFCs). Toxicol. Appl. Pharmacol. 2011, 250, 108–116. [Google Scholar] [CrossRef] [PubMed]
- Ballesteros, V.; Costa, O.; Iniguez, C.; Fletcher, T.; Ballester, F.; Lopez-Espinosa, M.J. Exposure to perfluoroalkyl substances and thyroid function in pregnant women and children: A systematic review of epidemiologic studies. Environ. Int. 2017, 99, 15–28. [Google Scholar] [CrossRef] [PubMed] [Green Version]
- Ryu, H.; Li, B.; De Guise, S.; McCutcheon, J.; Lei, Y. Recent Progress in the Detection of Emerging Contaminants PFASs. J. Hazard. Mater. 2021, 408, 124437. [Google Scholar] [CrossRef] [PubMed]
- Saito, K.; Uemura, E.; Ishizaki, A.; Kataoka, H. Determination of perfluorooctanoic acid and perfluorooctane sulfonate by automated in-tube solid-phase microextraction coupled with liquid chromatography–mass spectrometry. Anal. Chim. Acta 2010, 658, 141–146. [Google Scholar] [CrossRef]
- Scott, B.F.; Moody, C.A.; Spencer, C.; Small, J.M.; Muir, D.C.; Mabury, S.A. Analysis for perfluorocarboxylic acids/anions in surface waters and precipitation using GC− MS and analysis of PFOA from large-volume samples. Environ. Sci. Technol. 2006, 40, 6405–6410. [Google Scholar] [CrossRef] [PubMed]
- Zhang, T.; Zhao, H.; Lei, A.; Quan, X. Electrochemical biosensor for detection of perfluorooctane sulfonate based on inhibition biocatalysis of enzymatic fuel cell. Electrochemistry 2014, 82, 94–99. [Google Scholar] [CrossRef] [Green Version]
- Chen, L.D.; Lai, C.Z.; Granda, L.P.; Fierke, M.A.; Mandal, D.; Stein, A.; Gladysz, A.J.; Bühlmann, P. Fluorous membrane ion-selective electrodes for perfluorinated surfactants: Trace-level detection and in situ monitoring of adsorption. Anal. Chem. 2013, 85, 7471–7477. [Google Scholar] [CrossRef]
- Liang, J.; Deng, X.; Tan, K. An eosin Y-based “turn-on” fluorescent sensor for detection of perfluorooctane sulfonate. Spectrochim. Acta A 2015, 150, 772–777. [Google Scholar] [CrossRef]
- Clark, R.B.; Dick, J.E. Electrochemical Sensing of Perfluorooctanesulfonate (PFOS) Using Ambient Oxygen in River Water. ACS Sens. 2020, 5, 3591–3598. [Google Scholar] [CrossRef]
- Cheng, Y.H.; Barpaga, D.; Soltis, J.A.; Shutthanandan, V.; Kargupta, R.; Han, K.S.; McGrail, B.P.; Motkuri, R.K.; Basuray, S.; Chatterjee, S. Metal–organic framework-based microfluidic impedance sensor platform for ultrasensitive detection of perfluorooctanesulfonate. ACS Appl. Mater. Inter. 2020, 12, 10503–10514. [Google Scholar] [CrossRef]
- Garada, M.B.; Kabagambe, B.; Kim, Y.; Amemiya, S. Ion-transfer voltammetry of perfluoroalkanesulfonates and perfluoroalkanecarboxylates: Picomolar detection limit and high lipophilicity. Anal. Chem. 2014, 86, 11230–11237. [Google Scholar] [CrossRef] [PubMed]
- Faiz, F.; Baxter, G.; Collins, S.; Sidiroglou, F.; Cran, M. Polyvinylidene fluoride coated optical fibre for detecting perfluorinated chemicals. Sens. Actuat. B-Chem. 2020, 312, 128006. [Google Scholar] [CrossRef]
- Cennamo, N.; Zeni, L.; Tortora, P.; Regonesi, M.E.; Giusti, A.; Staiano, M.; D’Auria, S.; Varriale, A. A high sensitivity biosensor to detect the presence of perfluorinated compounds in environment. Talanta 2018, 178, 955–961. [Google Scholar] [CrossRef]
- Haupt, K.; Mosbach, K. Molecularly Imprinted Polymers and Their Use in Biomimetic Sensors. Chem. Rev. 2000, 100, 2495–2504. [Google Scholar] [CrossRef] [PubMed]
- Kupai, J.; Razali, M.; Buyuktiryaki, S.; Kecilic, R.; Szekely, G. Long-term stability and reusability of molecularly imprinted polymers. Polym. Chem. 2017, 8, 666–673. [Google Scholar] [CrossRef] [Green Version]
- Haupt, K. Plastic Antibodies. Nat. Mater. 2010, 9, 612–614. [Google Scholar] [CrossRef]
- Schmidt, R.H.; Mosbach, K.; Haupt, K. A Simple Method for Spin-Coating Molecularly Imprinted Polymer Films of Controlled Thickness and Porosity. Adv. Mater. 2004, 16, 719–722. [Google Scholar] [CrossRef]
- Cennamo, N.; D’Agostino, G.; Porto, G.; Biasiolo, A.; Perri, C.; Arcadio, F.; Zeni, L. A molecularly imprinted polymer on a plasmonic plastic optical fiber to detect perfluorinated compounds in water. Sensors 2018, 18, 1836. [Google Scholar] [CrossRef] [Green Version]
- Cennamo, N.; Arcadio, F.; Zeni, L.; Alberti, G.; Pesavento, M. Optical-Chemical Sensors Based on Plasmonic Phenomena Modulated via Micro-Holes in Plastic Optical Fibers Filled by Molecularly Imprinted Polymers. Sens. Actuat. B-Chem. 2022, 372, 132672. [Google Scholar] [CrossRef]
- Steenland, K.; Fletcher, T.; Savitz, D.A. Epidemiologic Evidence on the Health Effects of Perfluorooctanoic Acid (PFOA). Environ. Health Perspect. 2010, 118, 1100–1108. [Google Scholar] [CrossRef] [Green Version]
- Cennamo, N.; Massarotti, D.; Conte, L.; Zeni, L. Low cost sensors based on SPR in a plastic optical fiber for biosensor implementation. Sensors 2011, 11, 11752–11760. [Google Scholar] [CrossRef] [PubMed]
- Cennamo, N.; D’Agostino, G.; Sequeira, F.; Mattiello, F.; Porto, G.; Biasiolo, A.; Nogueira, R.; Bilro, L.; Zeni, L. A Simple and Low-Cost Optical Fiber Intensity-Based Configuration for Perfluorinated Compounds in Water Solution. Sensors 2018, 18, 3009. [Google Scholar] [CrossRef] [PubMed] [Green Version]
- Ayawei, N.; Ebelegi, A.N.; Wankasi, D. Modelling and interpretation of adsorption isotherms. J. Chem. 2017, 17, 11. [Google Scholar] [CrossRef] [Green Version]


| Configuration | Δλ0 [nm] | Δλmax [nm] | K [ppt] | Statistics | ||||
|---|---|---|---|---|---|---|---|---|
| Type of Polymer | Value | St. Error | Value | St. Error | Value | St. Error | Value | St. Error |
| MIP | 0.11423 | 0.01711 | 1.71884 | 0.03243 | 27.44135 | 6.77216 | 0.07236 | 0.9881 |
| NIP | 0.14454 | 0.04212 | 0.51872 | 0.03881 | 38.74961 | 22.26693 | 0.16638 | 0.88185 |
| Parameters | Value |
|---|---|
| Kaff [ppt−1] (Kaff = 1/K) | 0.036 |
| Sensitivity at low c [nm/ppt] (Sensitivity al low c = Δλmax/K) | 0.063 |
| LOD [ppt] (3× standard deviation of blank/sensitivity at low c) | 0.81 |
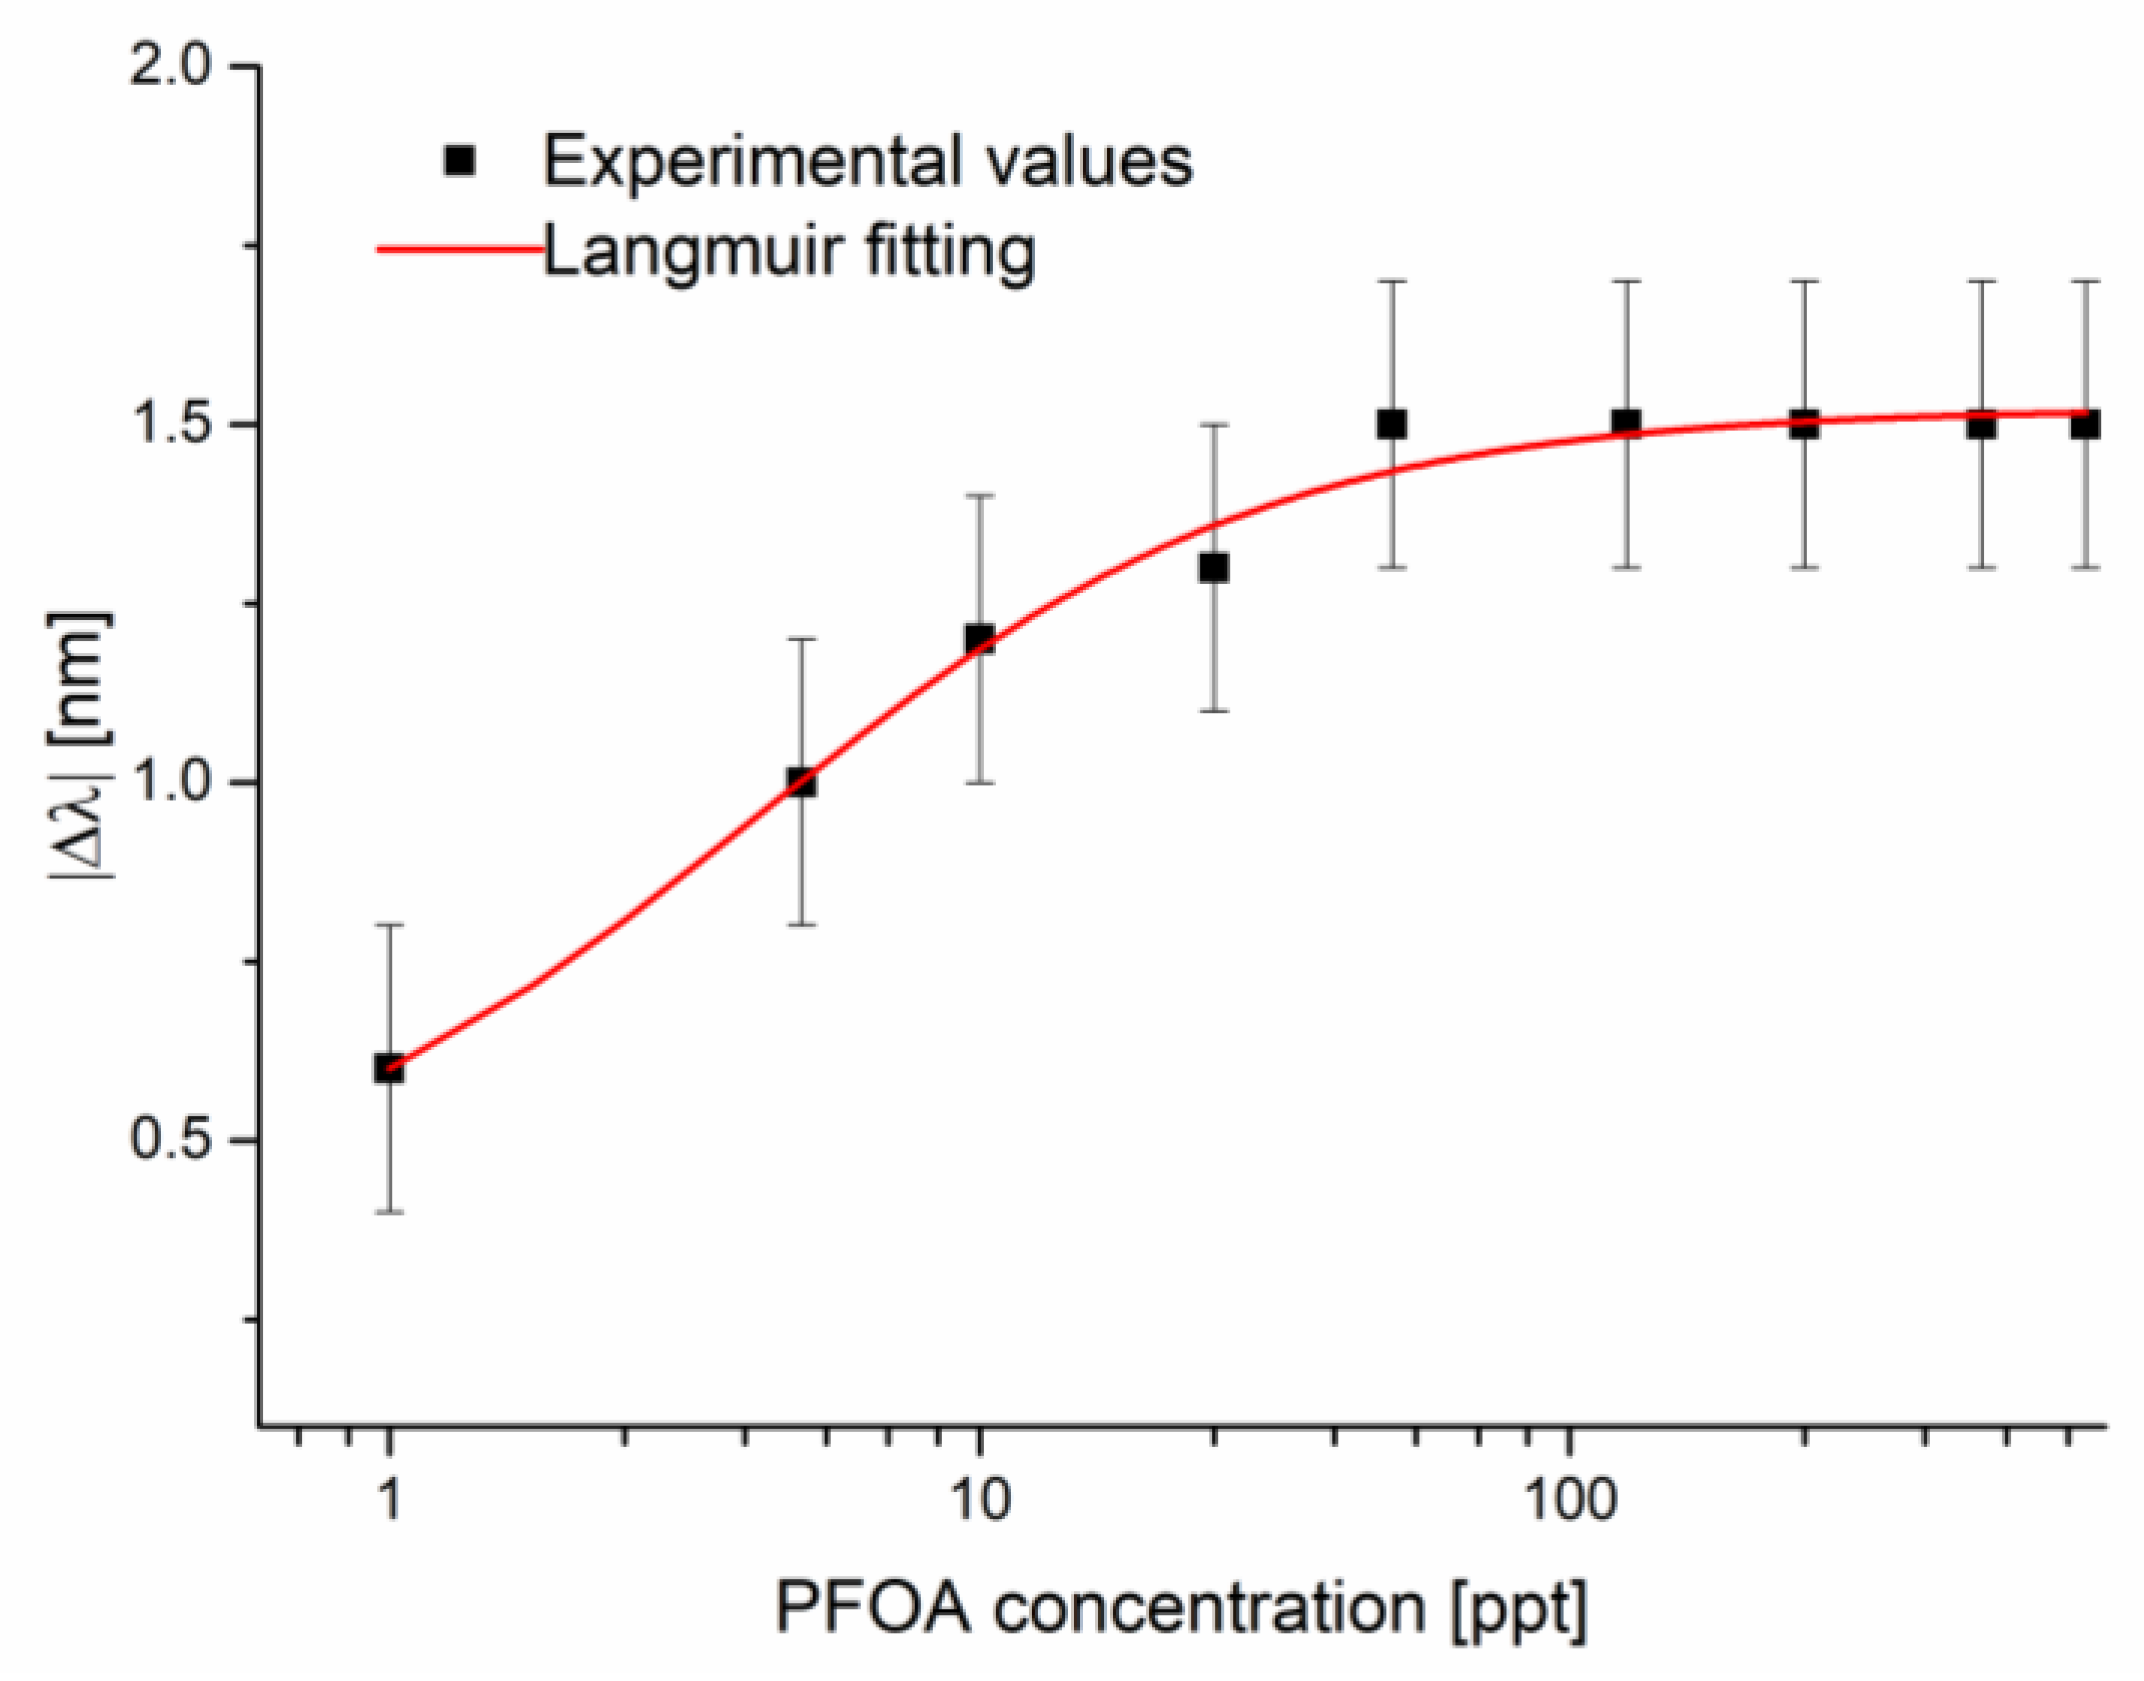
| Δλ0 [nm] | Δλmax [nm] | K [ppt] | Statistics | ||||
|---|---|---|---|---|---|---|---|
| Value | St. Error | Value | St. Error | Value | St. Error | Value | St. Error |
| 0.37867 | 0.11554 | 1.52249 | 0.01896 | 4.17024 | 0.78994 | 0.03598 | 0.98541 |
| Parameters | Value |
|---|---|
| Kaff [ppt−1] (Kaff = 1/K) | 0.240 |
| Sensitivity at low c [nm/ppt] (Sensitivity al low c = Δλmax/K) | 0.365 |
| LOD [ppt] (3* standard deviation of blank/sensitivity at low c) | 0.95 |
| Receptor/Method | LOD [ppt] | Reference |
|---|---|---|
| Antibody | 240 | [15] |
| MIP (over the SPR–POF chip) | 130 | [20] |
| MIP (in POF’s microholes) | 0.86 | This work |
| Sensing Method | Target Analyte | LOD [ppt] | Concentration Range [ppt] | Ref. |
|---|---|---|---|---|
| Fluorescence | PFOS | 7.5× 10⁴ | 0–109 | [10] |
| Electrochemical impedance spectroscopy | PFOS | 1.7 × 10³ | 0–250 | [11] |
| Ion-transfer stripping Voltammetry | PFCAs, PFSAs | 25 × 103 | 0–500 | [13] |
| Fabry–Perot Interferometry (FPI) | PFOA | 5 × 10⁶ | 900–5000 | [14] |
| SPR–POF–MIP | PFOA | 130 | 0–4000 | [20] |
| Intensity-based POF–MIP | PFOA | 210 | 0–4000 | [24] |
| SPR–POF chip + MIP-based chip | PFOA | 0.86 | 0–750 | This work |
Disclaimer/Publisher’s Note: The statements, opinions and data contained in all publications are solely those of the individual author(s) and contributor(s) and not of MDPI and/or the editor(s). MDPI and/or the editor(s) disclaim responsibility for any injury to people or property resulting from any ideas, methods, instructions or products referred to in the content. |
© 2023 by the authors. Licensee MDPI, Basel, Switzerland. This article is an open access article distributed under the terms and conditions of the Creative Commons Attribution (CC BY) license (https://creativecommons.org/licenses/by/4.0/).
Share and Cite
Pitruzzella, R.; Arcadio, F.; Perri, C.; Del Prete, D.; Porto, G.; Zeni, L.; Cennamo, N. Ultra-Low Detection of Perfluorooctanoic Acid Using a Novel Plasmonic Sensing Approach Combined with Molecularly Imprinted Polymers. Chemosensors 2023, 11, 211. https://doi.org/10.3390/chemosensors11040211
Pitruzzella R, Arcadio F, Perri C, Del Prete D, Porto G, Zeni L, Cennamo N. Ultra-Low Detection of Perfluorooctanoic Acid Using a Novel Plasmonic Sensing Approach Combined with Molecularly Imprinted Polymers. Chemosensors. 2023; 11(4):211. https://doi.org/10.3390/chemosensors11040211
Chicago/Turabian StylePitruzzella, Rosalba, Francesco Arcadio, Chiara Perri, Domenico Del Prete, Giovanni Porto, Luigi Zeni, and Nunzio Cennamo. 2023. "Ultra-Low Detection of Perfluorooctanoic Acid Using a Novel Plasmonic Sensing Approach Combined with Molecularly Imprinted Polymers" Chemosensors 11, no. 4: 211. https://doi.org/10.3390/chemosensors11040211
APA StylePitruzzella, R., Arcadio, F., Perri, C., Del Prete, D., Porto, G., Zeni, L., & Cennamo, N. (2023). Ultra-Low Detection of Perfluorooctanoic Acid Using a Novel Plasmonic Sensing Approach Combined with Molecularly Imprinted Polymers. Chemosensors, 11(4), 211. https://doi.org/10.3390/chemosensors11040211