Article

Distinctive Labeling of Live Monocytes and Neutrophils with a Single Fluorescent Molecule

1
Neural Circuits Research Group, Korea Brain Research Institute, Daegu 41062, Republic of Korea
2
Program in Neuroscience and Behavioral Disorders, Duke-NUS Medical School, Singapore 169857, Singapore
3
New Drug Discovery Center, Daegu-Gyeongbuk Medical Innovation Foundation (K-MEDI Hub), Daegu 41061, Republic of Korea
4
Department of Chemistry, Pohang University of Science and Technology (POSTECH), Pohang 37673, Republic of Korea
*
Author to whom correspondence should be addressed.
Chemosensors 2023, 11(5), 265; https://doi.org/10.3390/chemosensors11050265
Submission received: 6 March 2023 / Revised: 20 April 2023 / Accepted: 27 April 2023 / Published: 29 April 2023

Abstract

:
(1) Background: a small-molecule fluorescent chemosensor, CDr20, tracks the resident macrophages based on the UGT1A7C activity in the brain, raising the possibility that additional immune cells expressing the UGT1A7C can be labeled with CDr20. (2) Methods: we applied CDr20 to various types of blood cells derived from hematopoietic organs (spleen and bone marrow) as well as peripheral blood to test the degree and selectivity of labeling of CDr20 in these cell types; (3) Results: CDr20 fluorescently labels monocytes/macrophages and neutrophils as a result of glucuronidation reaction (CDr20-Gluc), which is mediated with UGT1A7C. The selectivity of CDr20 labeling highly correlates with the Ugt1a7c expression level in immune cells. Moreover, CDr20-Gluc is exported from cells by a mechanism of how glucuronides within cells are excreted into extracellular space. Interestingly, the exportation of CDr20-Gluc is mainly observed in monocytes, potentially due to the monocyte-specific expression of ABCC transporters and this resulted in large differences in the degree of fluorescence retention in neutrophils (CDr20bright), compared to monocytes (CDr20dim) upon one hour of CDr20 incubation; (4) Conclusions: CDr20 can differentially label monocytes and neutrophils due to the variance in two different cellular enzymatic activities of UGT1A7C and ABCC. By using this property, CDr20 can be used to distinguish specific cell types within blood.

1. Introduction

Myeloid cells are an essential upkeeping apparatus in the body. The term ‘myeloid cells’ encompasses various subtypes of innate immune cells, such as monocytes/macrophages, dendritic cells, and granulocytes [1]. Neutrophils and monocytes are classified as professional phagocytes in peripheral blood for eliminating pathogens and maintaining tissue homeostasis [2]. In clinical situations, the changes in the number of monocytes and neutrophils, and the associated symptoms called monocytosis and neutrophilia, respectively, are important preliminary diagnostic indicators of certain types of clinical conditions including leukemia, infectious, and inflammatory conditions [3]. Therefore, the precise enumeration of these two cell types has been important in various clinical situations. Currently, the precise enumeration of monocytes and neutrophils can be achieved by a flow cytometry hematology analyzer which requires an antibody cocktail to count the target cell population with minimum overlays [4]. However, antibody cocktails used to separate neutrophils and monocytes from other granulocytes and mononuclear cells are often a mix of more than five antibodies [4], significantly increasing the running cost of hematology tests. Additionally, potential lot-to-lot variations in antibodies necessitate their evaluation before each use. These disadvantages associated with using multiple antibodies highlight the need for a novel approach to biomolecule analysis.
Small-molecule fluorescent chemosensors (SMFCs) are a type of fluorometric tool used for the detecting and quantifying of specific chemical species such as proteins. SMFCs with a small molecular size (~500 Da) and appropriate lipophilicity can readily diffuse across the cell membrane and intracellular organelles, and often label their molecular targets while minimally affecting cellular functions [5]. SMFCs have also been utilized for cell-type-specific labeling when their target molecule is specific to a certain cell type [6]. There are several SMFCs reported to label various types of blood cells such as neutrophils and activated monocytes [7,8,9]. However, there is no material available to distinguish the two types of blood cells with a single molecule.
One particular type of SMFC, utilizing metabolism-oriented live-cell distinction (MOLD), achieves remarkable cell-type specificity in biomolecule analysis by leveraging the specificity of enzyme-substrate interactions [7]. It is worth noting that intrinsic metabolic substrates are often targeted by more than one protein in the metabolic pathway, suggesting that the MOLD chemosensors may report more than one enzyme activity. This also opens up the possibility that MOLD chemosensors could label more than one type of cell with a different degree at the same time.
In the previous research, we developed a MOLD chemosensor called CDr20, which is specific to the murine uridine 5′-diphospho-glucuronosyltransferase 1A7C enzyme (UGT1A7C) [10]. This chemosensor produces a strong fluorescent intensity (F.I.) when its BODIPY-derived fluorescence-quenched substrate is converted by UGT1A7C into its glucuronide form, CDr20-Gluc. UDP glycosyltransferases (UGTs), including UGT1A7C, play a crucial role in metabolizing both endogenous and exogenous compounds, making them important enzymes in cellular detoxification. UGTs transfer glycosyl groups to lipophilic substrates and each isoforms have a different regioselectivity for glucuronidation. For example, human UGT1A8 has a strict regioselectivity toward 3′-OH of flavonoids [11]. Glycosyl transfer by UGTs converts substrates into a more hydrophilic form that can be easily exported out of cells. This extracellular transportation is mediated by membrane transporters, particularly the ABCB and ABCC transporter subfamilies, also known as multi drug resistance (MDR) and multidrug resistance-related proteins (MRP), respectively [12,13].
Initially, CDr20 was developed through unbiased screening and was found to label microglia distinctively from other types of brain cells. Given that microglia share a significant portion of their gene expression profile with other myeloid lineage cells, we hypothesized that UGT1A7C activity might also be present in specific types of myeloid cells outside of brain tissue. Thereby, we investigated the potential use of CDr20 as a MOLD chemosensor for discriminating myeloid cells in WBCs and its metabolic destination subsequent to its conversion into the glucuronide form.

2. Materials and Methods

2.1. Mouse Model and Cell Culture

All animal experiments were approved and overseen by the Institutional Animal Care and Use Committee (IACUC) of Korea Brain Research Institute (KBRI) under protocol ID IACUC-22-00003. Six to ten weeks old male and female C57BL/6N mice were used as a source of murine immune cells. Raw264.7 murine monocyte/macrophage cells and BV2 murine microglial cells were cultured using DMEM supplemented with 10% FBS and penicillin-Streptomycin (50 U/mL) at 37 °C with 5% CO2.

2.2. Murine Immune Cell Isolation from Bone Marrow, Spleen, and Peripheral Blood

Immune cells from mouse bone marrow were isolated as previously described with some modifications [14]. Briefly, femurs and tibiae were removed surgically post-mortem. Once the head of the femur and tibiae were removed, 10 mL of DPBS was injected inside the bone to wash out marrows using a syringe. Bone marrow cells were washed and resuspended in DMEM with 10% FBS without phenol red.
Murine splenocytes were isolated as described before with mild modifications [15]. Briefly, a mouse spleen was removed surgically post-mortem and homogenized mechanically by grinding against a 40 μm strainer using a syringe plunger. Single splenocytes were resuspended in DMEM with 10% FBS without phenol red.
Circulating immune cells were isolated from murine peripheral blood (mPRB) collected from the heart or inferior vena cava. Approximately 500 μL of mPRB was collected per mouse using a 1 mL syringe with a 23 ½ gauge needle and transferred to a K2EDTA coated tube. The erythrocytes in mPRB were eliminated using an RBC lysis buffer (Invitrogen™, Waltham, Massachusetts, U.S.). The remaining white blood cells (WBCs) were filtered and resuspended in DMEM with 10% FBS without phenol red.

2.3. Surgical Procedures for In Vivo Imaging

Mice were anesthetized with isoflurane (5% induction, 1.5% maintenance). Dexamethasone (2 mg/kg) and Carprofen (5 mg/kg) were administered subcutaneously to reduce inflammation and pain. Body temperature was maintained at 37 °C using a heating pad. The head of the mouse was secured in a stereotaxic frame during the surgery. A circular craniotomy (approximately 3 mm in diameter) on the left side of the primary somatosensory cortex was made using a high-speed dental drill. The dura was left intact, and a round glass coverslip (100 μm thickness (No. 0), 3 mm in diameter, Matsunami glass, Kishiwada, Japan) was secured using dental cement. For acute imaging experiments, the mice were allowed to recover for a few hours while the level of anesthesia was maintained after attaching custom headgear made of stainless steel or titanium.

2.4. Multiphoton In Vivo Imaging

Multiphoton in vivo imaging was performed using a custom-built multiphoton microscope (Bergamo, Thorlabs, Newton, New Jersey, U.S.), equipped with a resonant scanner, a piezo Z drive, and a 25x 1.1 NA water-immersion lens (Nikon, Tokyo, Japan). The light source was Mai Tai eHP DeepSee laser (Spectra-Physics, Santa Clara, California, U.S.) running at 860 nm (for FITC and CDr20). We used a set of 495LP, 562LP, and 635LP dichroic mirrors (Chroma, Bellows Falls, Vermont, U.S.) and 447/60 nm, 525/50 nm, and 607/70 nm filters (Chroma) for blue, green, and red channels, respectively. Briefly, anesthetized mice were harnessed under the objective lens using a custom-made head restraint holder, and the body temperature was maintained using a hand warmer. The following drugs and reagents were used for in vivo imaging: 150 kDa dextran-conjugated FITC (46946, Sigma-Aldrich, St. Louis, Missouri, U.S.), and a CDr20 mixture solution (100 μM in PBS with 2% Tween 20 and 1% PEG8000). Blood vessels and microglia were visualized by intravenously injecting 200 μL of FITC-dextran (10 mg/mL) and 300 μL of a CDr20 solution (100 µM). To image microglia, 3D volumes (576 × 576 × 100 μm3) were acquired at 2.5 Hz. To image blood vessels, 2D images were taken at 120 Hz.

2.5. Flow Cytometry Analysis and Fluorescence-Activated Cell Sorting (FACS)

To identify and characterize the target cell population of CDr20 in mouse immune cells, isolated WBCs from bone marrow, spleen, and peripheral blood were prepared as single cells using a 40 μm-cell strainer. The isolated single cells were then incubated with CDr20 (20 nM) in phenol red free-DMEM/10% FBS media at room temperature for the indicated time and analyzed by using Attune™ NxT Flow Cytometer (Invitrogen™). Initial gating was conducted with FSC-A/SSC-A parameters to exclude cell debris. Live cells were then sub-gated with SSC-A/SSC-H parameters for singlets gating, and 10,000 singlet cells were recorded for each sample.
To identify CDr20 stained mouse immune cell populations, isolated WBC single cells were incubated with the antibody cocktail on ice for an hour; CD11b-PE-Cy™7 (BD bioscience, Franklin Lakes, New Jersey, U.S.), Ly6g-APC (BD bioscience), F4/80-FITC (BD bioscience), CD45R-BV480 (BD bioscience), CD3-Alexa Fluor® 700 (BD bioscience), FcεR1a-BV421 (BD bioscience), Siglec-F-Alexa Fluor® 648 (BD bioscience), CD45-APC-Cy™7 (BD bioscience). Data analysis was performed using FlowJo 10.8 software (BD bioscience).
FACS was performed using MoFlo Astrios Cell Sorter (Beckman Coulter, Brea, California, U.S.).

2.6. Fluorimetric Cell Counting Using CDr20

To perform fluorimetric cell counting for neutrophils and monocytes using CDr20 staining, mouse bone marrow WBCs were stained with 500 nM CDr20 and 1 μM Calcein AM (Invitrogen™). WBCs were preincubated with Calcein AM for 60 min at 37 °C and then residual Calcein AM was removed by centrifugation. Calcein-AM-stained WBCs then stained with CDr20 for 10 min at room temperature. WBCs then counted using automated fluorimetric cell counter LUNA-FX7 (Logos Biosystems, Bucheon, Korea).

2.7. Microsome Isolation

Microsomes were isolated from WBCs of bone marrow, BV2, Raw264.7, and N2a cells as described previously with slight modification [16]. Briefly, 2 × 10⁷ cells were collected and their pellets were resuspended in 8 mL of Tris buffer (100 mM Tris-HCl pH 7.5 containing 5 mM MgCl2 and 1% proteinase inhibitor cocktail). The pellets were disrupted by sonication for 90 s (5 s pulse, 5 s interval, 40% amplitude) (SONICS & MATERIALS, Newtown, Connecticut, U.S.). The S9 fraction containing both microsomal and cytosolic fractions was collected by taking the supernatant after centrifugation of the disrupted solution at 12,000× g for 20 min. Microsome pellet was obtained by ultracentrifugation of the S9 fraction at 100,000× g for 60 min on 4 °C using Himac High-Speed Refrigerated Centrifuge (Hitachi, Tokyo, Japan). The pellet was resuspended in 500 µL of the Tris buffer and stored at −80 °C until use.

2.8. In Vitro UGT1A7C Conversion Test

A mixture of CDr20 (10 µM), UDPGA (2 mM), alamethicin (25 µg/mL), and S9 fraction (250 ng/100 µL total reaction volume) isolated from WBCs of bone marrow, BV2, Raw264.7, and N2a was mixed in the same phosphate buffer where the microsome was prepared and incubated at 37 °C. After 2 h, the fluorescence intensity at 612 nm emission by 544 nm excitation was measured (Supplementary Figure S1).

2.9. Inhibition of UGT1 Isoforms and ABC Transporters

All inhibitors were purchased from Sigma. The average IC50 concentration of each UGT1 inhibitors (magnolol, silybin, and ritonavir) compound to target UGT1 isoforms was determined based on the previous reports [17,18,19,20,21,22]. Stock solution of ABC transporter inhibitors Ko I43 (IC50, 0.01 µM), Elacridar (IC50, 0.055 µM), Reversan (IC50, 1 µM), Verapamil (IC50, 33.5 µM), Indomethacin (IC50, 7 µM) and MK571 (IC50, 17 µM) were made in DMSO.
Each inhibitor was pre-treated to isolated bone marrow cells for 30 min before adding 20 nM of CDr20 for 7 min. The intracellular fluorescence intensity was measured by using a flow cytometry analyzer.

2.10. HPLC-MS to Detect CDr20-Gluc

Intracellular CDr20 or CDr20-Gluc was extracted by incubating the cell pellet (1 × 10⁷ cells) from CDr20 pre-treated N2a or N2a-UGT1A7C cells (1 µM for 10 min) with 100% of acetonitrile (100 µL). The clear supernatant after centrifugation was diluted to 20% acetonitrile/0.1% formic acid. The extracted cells or the in vitro reacted solutions were filtrated by Amicon Ultra-centrifugal 30 K filters. A total of 100 µL of the filtrates were subjected to HPLC-MS analysis.
The experiment was performed on HPLC-MS (model: LCMS-2010, Shimadzu, Kyoto, Japan) with a single quadrupole mass spectrometer. The analytical method used mobile phase A: H2O (0.1% CF3CO2H), mobile phase B: CH3CN, gradient: 0–0.4 min 5% B, 0.4–3 min gradient from 5% B to 100% B, 3–4.5 min, 100% B, 4.51 min 5% B, 4.51–5.5 min, 5% B. Column: Gemini 3 µm C18 110 A (100 × 2 mm, 3 μm particle size). Data were collected at 560 nm.

2.11. Statistical Analysis

All experiments were conducted in at least three independent experiments. Statistical analyses were performed using the two-tailed Student’s t-test. A p-value less than 0.05 was considered statistically significant.

3. Results and Discussion

3.1. CDr20 Labels Circulating Phagocytic Myeloid Cells In Vivo

After injecting CDr20 intravenously into mice, we observed that the CDr20-derived fluorescence was present in live CX3CR1+ cells (CDr20+CX3CR1+) located in the Dextran-FITC labeled microvessel as well as CX3CR1high microglia in the parenchymal region of the brain (Figure 1a). Two-photon time-lapse imaging of microvessels in a primary somatosensory region showed that there are circulating cells emitting a fluorescent signal when CDr20 is injected into mice intravenously (Figure 1b,c, Movie S1). Encouraged by the results, we next stained WBCs isolated from the peripheral blood of Csf1r-EGFP mice, where CSF1R-expressing phagocytes were labeled by enhanced green fluorescence protein (EGFP), with CDr20. Consistent with our findings, CSF1R+CD45+ cells exhibited about 100-fold differences in CDr20 fluorescence intensity compared to CSF1RCD45+ and CSF1RCD45 cells, suggesting that CDr20 may selectively label phagocytic myeloid cell population(s) (Figure 1d).

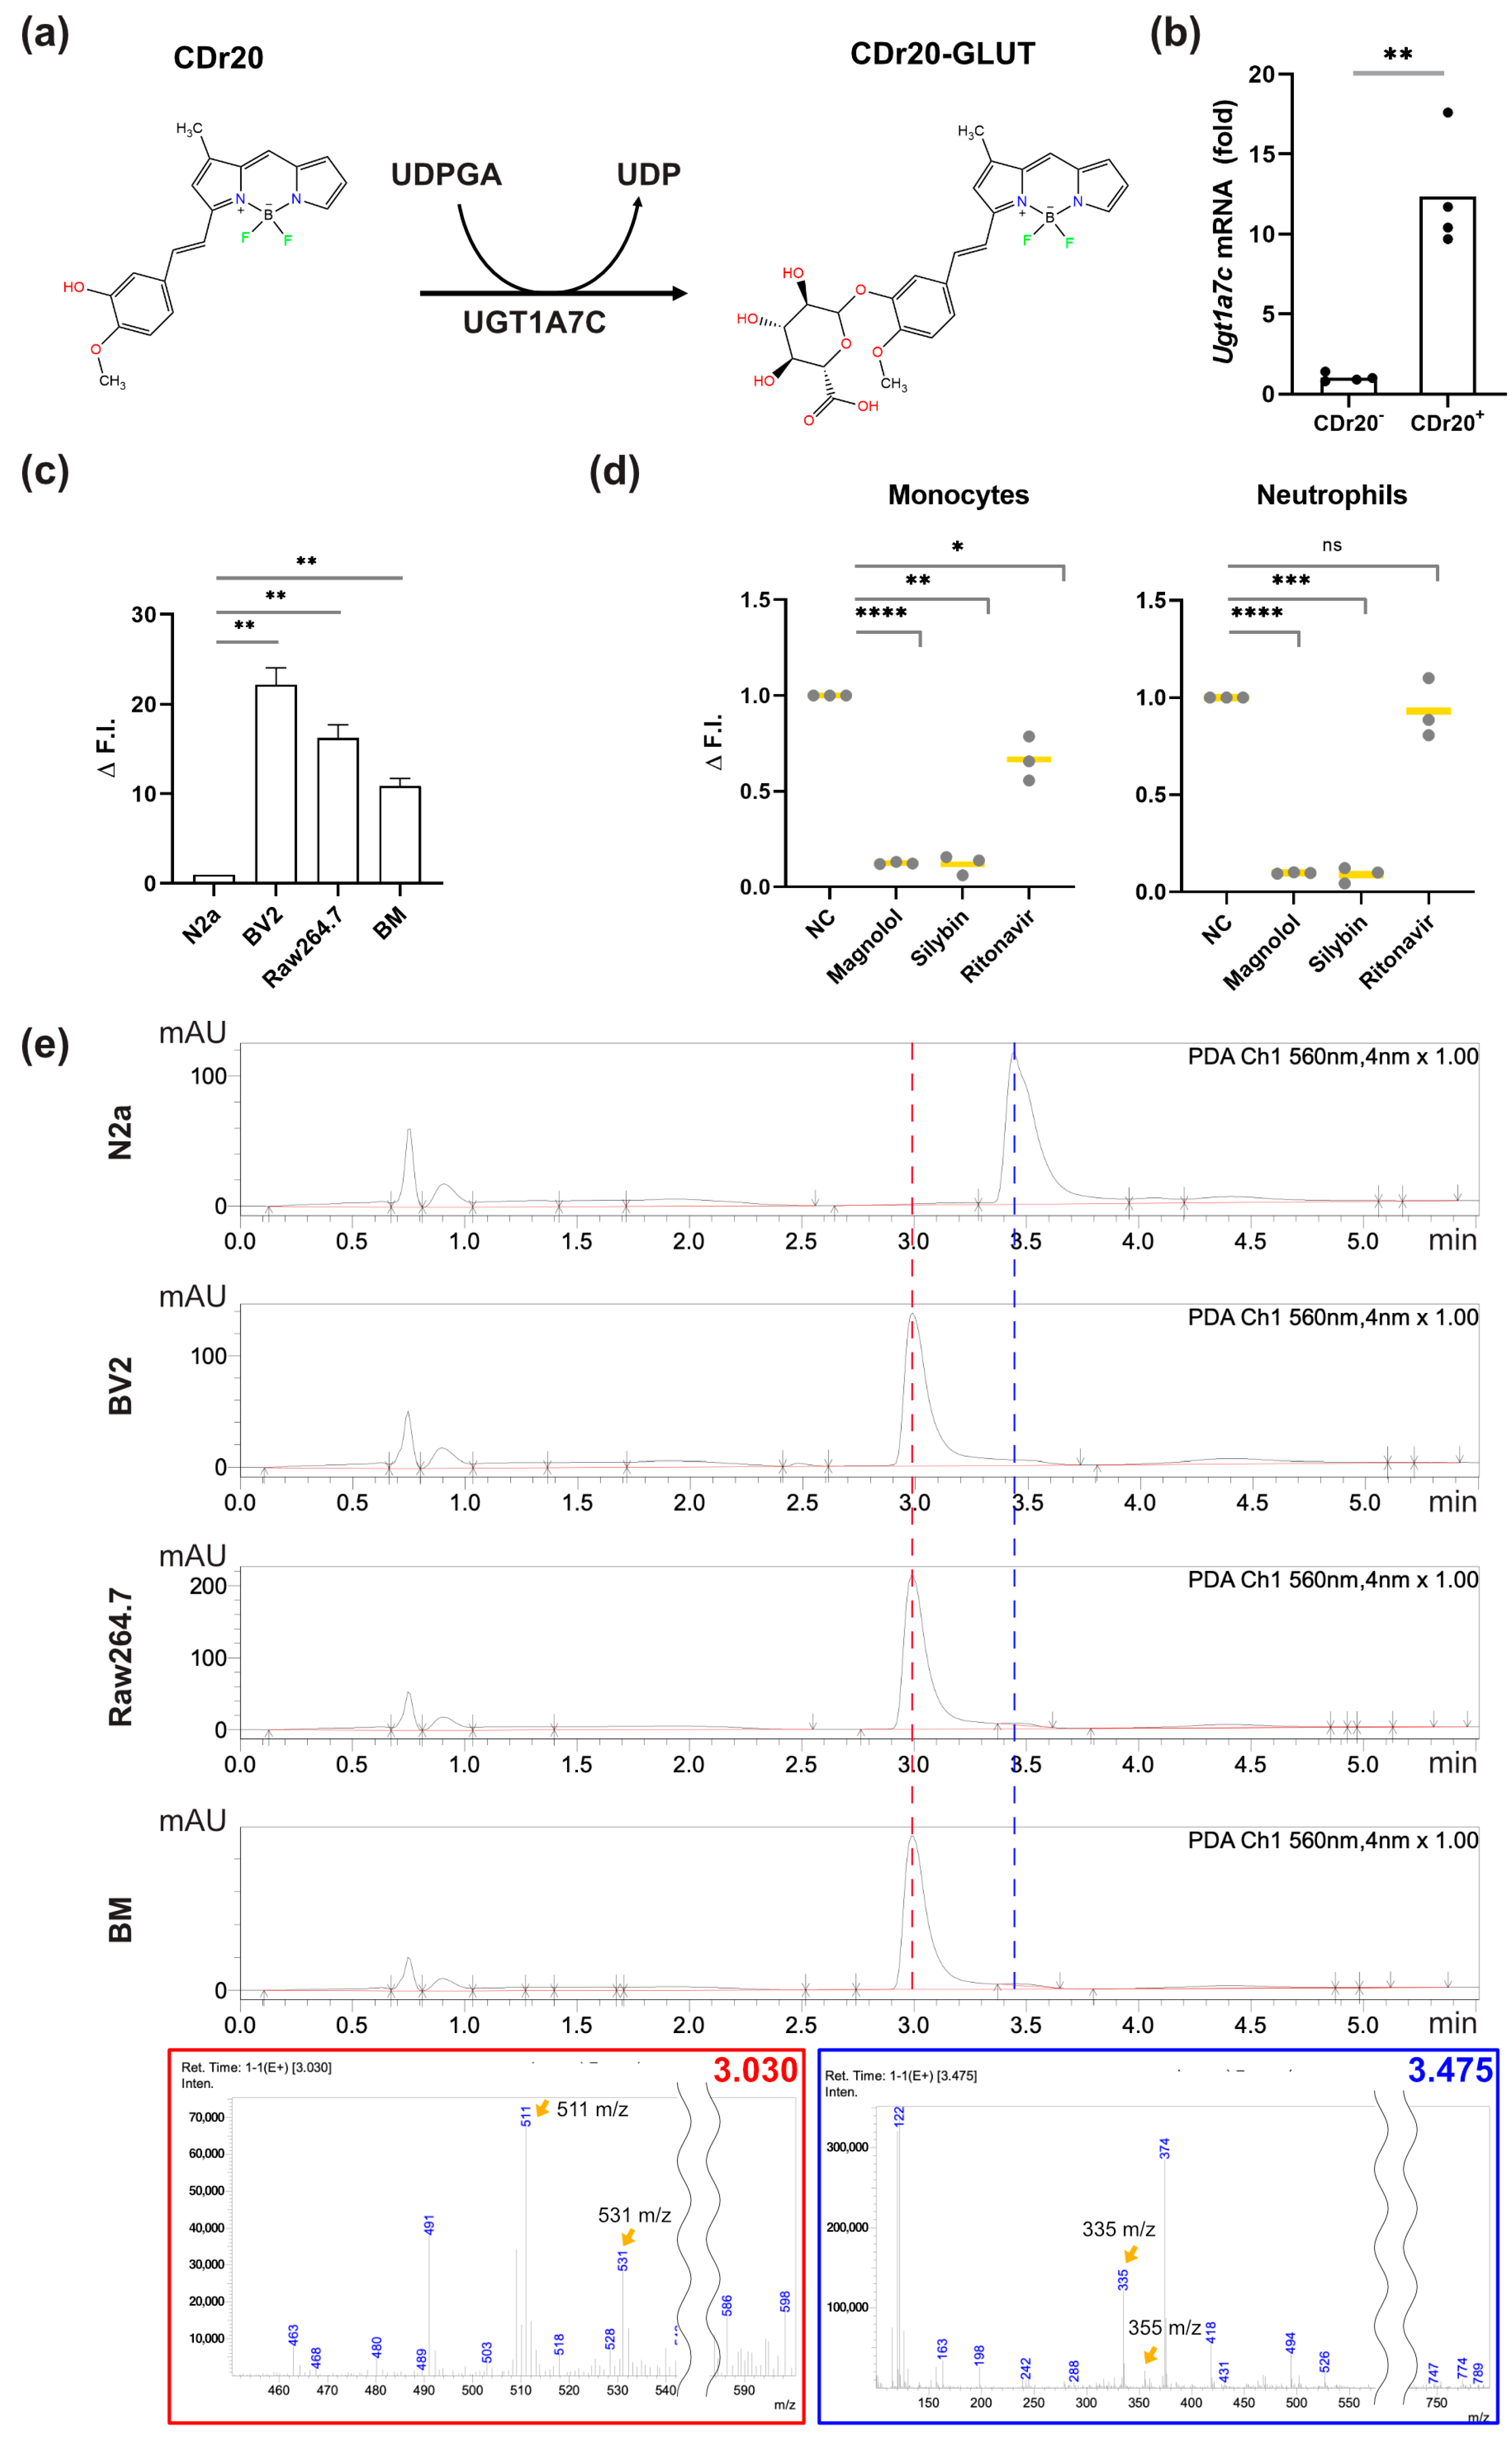
3.2. UGT1A7C Activity Is Responsible for the CDr20-Derived Fluorescence in Sub-Populations of Murine WBCs

CDr20 gains fluorescence after the glucuronidation of CDr20 (CDr20-Gluc), which is mediated by the catalytic reaction of UGT1A7C expressed in the target cells such as microglia (Figure 2a) [10]. Therefore, we investigated the expression levels of Ugt1a7c in WBCs that were either fluorescently stained or unstained after exposure to CDr20 to determine whether there were differences in Ugt1a7c expression levels between the two groups of cells. We isolated white blood cells from adult mouse blood and incubated them with CDr20 for 5 min. The cells were then separated into two populations, CDr20+ and CDr20, based on the F.I. derived from CDr20, using fluorescence-activated cell sorting (FACS). We found that Ugt1a7c mRNA expression levels were significantly higher in the CDr20+ sorted populations compared to that of CDr20 populations with a difference of approximately 12.4-fold. This suggests that UGT1A7C is differentially expressed in a subset of WBCs that are labeled with CDr20 and are not in the CDr20 populations (Figure 2b). Next, we investigated the intracellular UGT1A7C activity of WBCs with the fluorescence intensity change of CDr20 after in vitro UGT reaction. To complete this, we isolated from intracellular microsomes from neuronal N2a and microglial BV2, negative and positive control for the in vitro reaction of UGT1A7C, respectively [10], and from Raw 264.7 and total WBCs of mice bone marrow. Upon incubation of the intracellular microsomes with CDr20 and UDPGA, the cofactor of UGT transferases, we observed a significant increase in F.I. in microsomes from BV2, Raw264.7, and total WBCs compared to that of N2a. This suggests that subsets of murine WBCs including monocyte/macrophage exhibit UGT1A7C activity, and this activity is the responsible factor for CDr20 staining (Figure 2c).
To confirm the involvement of mouse UGT1A7C in the staining of CDr20 in WBCs, we next used UGT inhibitors with varying inhibitory affinities to different members of UGTs. UGT superfamily is a well-conserved protein across different mammal species, which avails human UGT inhibitors to have inhibition effects on mouse UGT proteins. Mouse UGT1A7C is predicted to be an ortholog to human UGT1A8 and -1A10 based on the genomic homology analysis [23]. Silybin and magnolol are known to target multiple human UGTs but have a strong affinity to UGT1A1, UGT1A8, and UGT1A10 for both inhibitors [24,25,26]. Ritonavir, known as cytochrome P450 3A (CYP3A) inhibitory HIV/AIDS medication, reported to have an inhibition effect on human UGTs including UGT1A1, 1A6, 1A9, and UGT2B15 [27]. As predicted, magnolol and silybin successfully prevent CDr20 labeling of target cells. The ritonavir did not show a strong preventing effect on CDr20 staining to the two WBC populations, monocytes/neutrophils (Figure 2d).
For a more direct account of the glucuronidation of CDr20 in WBCs, we extracted intracellular molecules from CDr20-stained bone marrow WBCs and Raw264.7. When the cell extracts were analyzed along with N2a and BV2, known as CDr20 and CDr20+ cell lines, respectively, we could find the expected molecular mass of CDr20-Gluc (m/z 531) from WBCs and Raw264.7 (Figure 2e, Supplementary Figures S2 and S3).

3.3. CDr20 Preferentially Targets UGT1A7C-Expressed WBCs: Monocytes/Macrophages and Neutrophils

Knowing that UGT1A7C is a differential factor for CDr20+ WBCs, we investigated the relative expression level of Ugt1a7c in each immune cell type to identify preliminary candidates for target populations of CDr20 cytolabeling. The normalized expression value of Ugt1a7c in different immune cell types was obtained from the open database, Immunological Genome Project [28]. When we compared Ugt1a7c expression value among different cell types, regardless of their organ of origin, we observed a significant difference in the Ugt1a7c expression level among different immune cell populations. Specifically, the expression levels in neutrophils, monocytes, and macrophages were approximately 8 times higher than in other WBC populations (Figure 3a).
Based on the in silico analysis, we incubated total WBCs from the peripheral blood of mice with anti-Ly6g and anti-CD11b, neutrophil, and myeloid cell surface markers, respectively, and CDr20 in a live state. Under a microscope, nearly every CD11b+Ly6g+ (arrowhead) and CD11b+Ly6g (arrow) cell was stained with CDr20, but no CD11b lymphoid cells stained by Hoechst33342 showed the fluorescent signal with CDr20 staining (Figure 3b). We further challenged the specificity of CDr20 labeling to the more complex pool of the WBC population, bone marrow. The isolated WBCs from mouse bone marrow were incubated with CDr20 and antibodies which bind to representative surface markers of each cell type found in the bone marrow. We used 10 key cell surface markers; SCA-1 (stem cells), CD3 (T cells), CD45R (B cells), MHCII (dendritic cells), NK1.1 (NK cells), CD11b (neutrophils and monocytes/macrophages), CX3CR1 (monocytes), Ly6g (Neutrophils), FcεR1 (basophils), and SiglecF (eosinophils) (Figure 3c–l). Among various BM immune cell types, we found that the majority of CD11b+ (86.9%), and CX3CR1+ monocytic myeloid immune cells (94.6%) showed the fluorescent signal with CDr20 staining (Figure 3c,d). Interestingly, among granulocytes, most neutrophils (Ly6g+, 90.4%), but not basophils (FcεR1+, 9.21%) and eosinophils (SiglecF+, 12.2%), were fluorescently stained with CDr20 (Figure 3e,k,l). Other populations in the bone marrow generally showed a small or moderate number of CDr20 labeled cells; T cells (CD3+, 1.99%), B cells (CD45R+, 8.1%), dendritic cells (MHCII+, 5.64%), stem cells (SCA-1+, 15.6%), and NK cells (NK1.1+, 24.5%). We next confirmed the major population of CDr20+ WBC cells with the combination of three antibodies, CD11b, CX3CR1, and Ly6G. Consistent with the previous results, most CD11b+ myeloid lineage cells, especially CD11b+CX3CR1lowLy6g+ neutrophils and CD11b+CX3CR1highLy6g monocytes are CDr20+ cells, but less than 17% of CD11b+CX3CR1Ly6g eosinophils and NK cells and 0.4% of CD11b lymphoid cells showed CD20-derived fluorescence (Figure 3m).

3.4. CDr20-Gluc Gets Exported out of Intracellular Space via ABCC Transporter

During our investigation of the characteristic of CDr20, we discovered that the fluorescence intensity of the CD11b+Ly6g monocytes decreased with prolonged incubation with CDr20, while that of CD11b+Ly6g+ neutrophils is unchanged from its original level (Figure 4a,b). Time-lapse flow cytometry analysis of CDr20 stained WBCs over a prolonged incubation period showed us in detail that fast-generated CDr20-derived fluorescence was selectively decreased in monocytes from 60 min and longer, generating CDr20dim populations compared to the CDr20bright neutrophil populations (Figure 4c,d). In xenobiotic metabolisms, active transportation out of intracellular space is the end destination of glucuronide form molecules [29]. ATP-binding cassette (ABC) transporters play an active role in this cellular excretion [30]. Therefore, we hypothesized that the signal fade-out in CDr20 stained monocytes could result from active transportation via ABC transports, removing CDr20-Gluc from intracellular space.
Raw264.7 cells were pre-incubated with inhibitors targeting various members of the ABC transporter family before CDr20 staining. Interestingly, the mean fluorescence intensity of the CDr20 stained cells decreased regardless of elacridar (an inhibitor for ABCB1, ABCG2), Ko 143 (ABCG2), and Verapamil (ABCB1 and ABCB4). Meanwhile, incubation with the two ABCC inhibitors MK571 (ABCC1-5) and Reversan (ABCB1, ABCC1) had a preventative effect on fluorescence fading (Figure 4e). The same inhibitory result of CDr20 fluorescence fading in monocytes was observed when we applied the same inhibitors to bone marrow-derived WBCs (Figure 4f). These results indicate that intracellular CDr20-Gluc is selectively transported out to the extracellular space through the ABCC activity of monocytes, but not in neutrophils.
In summary, we first showed that CDr20 mainly labels UGT1A7C-expressing WBCs, neutrophils, and monocytes, through the generation of intracellular CDr20-Gluc. Then, the ABCC-selective pumped-out phenomenon of CDr20-Gluc found in monocytes further distinguished neutrophils (CDr20bright) from monocytes (CDr20dim) populations with their fluorescence intensity after an hour (Figure 5a). Therefore, the single MOLD sensor, CDr20, functions as a dual-target sensor for measuring UGT1A7C and ABCC activities and can discriminate between the two cell populations using a single fluorescence channel. Finally, we challenged this novel concept of dual-target chemosensor in blood cell counting using an automated fluorimetric cell counter. With an interval fluorescence imaging of CDr20 as described in Figure 5b, we observed that the typical population composition of mouse bone marrow cells, which consists of 20~40% of neutrophils and ~10% of monocytes in the total live WBCs, could be counted when stained with CDr20 and calcein-AM (Figure 5c,d).
In conclusion, the identification of target cells of CDr20 in immune systems, as well as the discovery of the dual activity of the chemosensor based on the metabolic process, opens up opportunities for the development of a novel method for live blood cell imaging, tracking, and blood cell counting.

4. Patents

A patent has been filed in the Korean patent office about ’mouse blood cell typing by a small fluorescent molecule, CDr20‘ of this work.

Supplementary Materials

The following supporting information can be downloaded at: https://www.mdpi.com/article/10.3390/chemosensors11050265/s1, Figure S1: The spectra of CDr20 and CDr20-Gluc. (a) The absorbance and fluorescent spectra for CDr20, which shows maximum absorbance at 563 nm wavelength, but no fluorescence peak (100 μM in Tris buffer, pH 7.5). (b) The absorbance and fluorescent spectra for CDr20-Gluc (λabs, max / λemi, max = 561 / 590 nm; 100 μM in Tris buffer, pH 7.5).; Figure S2: LC-MS characterization of a CDr20-Gluc resulted from the intracellular reaction of CDr20 with Ugt1a7c. (a) – (f) full traces of PDA chromatographs and mass spectra 100% Methanol (a), BV2 non-stained control (b), CDr20 stained N2a (c), CDr20 stained BV2 (d), CDr20 stained Raw264.7 (e) and CDr20 stained mouse bone marrow (f), respectively.; Figure S3: Scaled-up mass spectra of CDr20-Gluc from 350 to 550 m/z (a) – (f) scaled-up mass spectra from 350 m/z to 550 m/z of 100% Methanol (a), BV2 non-stained control (b), CDr20 stained N2a (c), CDr20 stained BV2 (d), CDr20 stained Raw264.7 (e) and CDr20 stained mouse bone marrow (f), respectively; Movie S1: Two-photon live imaging of primary somatosensory micro vessels injected with CDr20 (red) and FITC-dextran (green). Dark dots inside blood vessels, red blood cells, or unstained cells; 12 fps (real-time = 30 fps).

Author Contributions

Conceptualization, S.K. and B.K.; methodology, S.K., M.F., J.Y.L. and B.K.; validation, S.K.; formal analysis, S.K., M.F. and B.K.; investigation, S.K., M.F. and B.K.; resources, J.Y.L., H.S.J., Y.-T.C. and B.K.; data curation, S.K., M.F., J.Y.L. and B.K.; writing—original draft preparation, S.K. and B.K.; writing—review and editing, S.K., M.F., H.S.J. and B.K.; visualization, S.K., M.F. and B.K.; supervision, Y.-T.C. and B.K.; project administration, B.K.; funding acquisition, B.K. All authors have read and agreed to the published version of the manuscript.

Funding

This research was supported by KBRI basic research program through Korea Brain Research Institute funded by Ministry of Science and ICT (23-BR-01-03), and by the Basic Science Research Program through the National Research Foundation of Korea (NRF-2021R1A2C1013975) to BK. The funders had no role in study design, data collection, analysis, publication decision, or manuscript preparation.

Institutional Review Board Statement

This animal study protocol was approved by the Institutional Review Board (or Ethics Committee) of Korea Brain Research Institute (KBRI) under protocol ID IACUC-22-00003.

Informed Consent Statement

Not applicable.

Data Availability Statement

The data presented in this study are available on request from the corresponding author.

Acknowledgments

Figure 5a,b are created with BioRender.com. (accessed on 03 February 2023).

Conflicts of Interest

S.K. and B.K. have submitted a patent application to the Korean patent office about ’mouse blood cell typing by a small fluorescent molecule, CDr20‘ of this work.

References

  1. Engblom, C.; Pfirschke, C.; Pittet, M.J. The role of myeloid cells in cancer therapies. Nat. Rev. Cancer 2016, 16, 447–462. [Google Scholar] [CrossRef]
  2. Kantari, C.; Pederzoli-Ribeil, M.; Witko-Sarsat, V. The role of neutrophils and monocytes in innate immunity. Contrib. Microbiol. 2008, 15, 118–146. [Google Scholar] [CrossRef] [PubMed]
  3. Elliott, M.A. Chronic neutrophilic leukemia and chronic myelomonocytic leukemia: WHO defined. Best Pract. Res. Clin. Haematol. 2006, 19, 571–593. [Google Scholar] [CrossRef] [PubMed]
  4. Buoro, S.; Moioli, V.; Seghezzi, M.; Previtali, G.; Alessio, M.G.; Simon Lopez, R.; Ortolani, C.; Ottomano, C.; Lippi, G. Evaluation and comparison of automated hematology analyzer, flow cytometry, and digital morphology analyzer for monocyte counting. Int. J. Lab. Hematol. 2018, 40, 577–585. [Google Scholar] [CrossRef]
  5. Alamudi, S.H.; Chang, Y.T. Advances in the design of cell-permeable fluorescent probes for applications in live cell imaging. Chem. Commun. 2018, 54, 13641–13653. [Google Scholar] [CrossRef] [PubMed]
  6. Yun, S.W.; Leong, C.; Zhai, D.; Tan, Y.L.; Lim, L.; Bi, X.; Lee, J.J.; Kim, H.J.; Kang, N.Y.; Ng, S.H.; et al. Neural stem cell specific fluorescent chemical probe binding to FABP7. Proc. Natl. Acad. Sci. USA 2012, 109, 10214–10217. [Google Scholar] [CrossRef] [Green Version]
  7. Gao, M.; Lee, S.H.; Park, S.H.; Ciaramicoli, L.M.; Kwon, H.Y.; Cho, H.; Jeong, J.; Chang, Y.T. Neutrophil-Selective Fluorescent Probe Development through Metabolism-Oriented Live-Cell Distinction. Angew. Chem. Int. Ed. Engl. 2021, 60, 23743–23749. [Google Scholar] [CrossRef]
  8. Park, S.J.; Kim, B.; Choi, S.; Balasubramaniam, S.; Lee, S.C.; Lee, J.Y.; Kim, H.S.; Kim, J.Y.; Kim, J.J.; Lee, Y.A.; et al. Imaging inflammation using an activated macrophage probe with Slc18b1 as the activation-selective gating target. Nat. Commun. 2019, 10, 1111. [Google Scholar] [CrossRef] [Green Version]
  9. Cho, H.; Kwon, H.Y.; Sharma, A.; Lee, S.H.; Liu, X.; Miyamoto, N.; Kim, J.J.; Im, S.H.; Kang, N.Y.; Chang, Y.T. Visualizing inflammation with an M1 macrophage selective probe via GLUT1 as the gating target. Nat. Commun. 2022, 13, 5974. [Google Scholar] [CrossRef] [PubMed]
  10. Kim, B.; Fukuda, M.; Lee, J.Y.; Su, D.; Sanu, S.; Silvin, A.; Khoo, A.T.T.; Kwon, T.; Liu, X.; Chi, W.; et al. Visualizing Microglia with a Fluorescence Turn-On Ugt1a7c Substrate. Angew. Chem. Int. Ed. Engl. 2019, 58, 7972–7976. [Google Scholar] [CrossRef]
  11. Wu, B.; Xu, B.; Hu, M. Regioselective glucuronidation of flavonols by six human UGT1A isoforms. Pharm. Res. 2011, 28, 1905–1918. [Google Scholar] [CrossRef] [PubMed] [Green Version]
  12. Klaassen, C.D. Xenobiotic transporters: Another protective mechanism for chemicals. Int. J. Toxicol. 2002, 21, 7–12. [Google Scholar] [CrossRef]
  13. Doring, B.; Petzinger, E. Phase 0 and phase III transport in various organs: Combined concept of phases in xenobiotic transport and metabolism. Drug Metab. Rev. 2014, 46, 261–282. [Google Scholar] [CrossRef]
  14. Liu, X.; Quan, N. Immune Cell Isolation from Mouse Femur Bone Marrow. Bio-Protocol 2015, 5, e1631. [Google Scholar] [CrossRef] [PubMed]
  15. Lim, J.F.; Berger, H.; Su, I.H. Isolation and Activation of Murine Lymphocytes. J. Vis. Exp. 2016, 116, e54596. [Google Scholar] [CrossRef]
  16. Walsky, R.L.; Bauman, J.N.; Bourcier, K.; Giddens, G.; Lapham, K.; Negahban, A.; Ryder, T.F.; Obach, R.S.; Hyland, R.; Goosen, T.C. Optimized assays for human UDP-glucuronosyltransferase (UGT) activities: Altered alamethicin concentration and utility to screen for UGT inhibitors. Drug Metab. Dispos. 2012, 40, 1051–1065. [Google Scholar] [CrossRef] [PubMed]
  17. Burkhart, C.A.; Watt, F.; Murray, J.; Pajic, M.; Prokvolit, A.; Xue, C.; Flemming, C.; Smith, J.; Purmal, A.; Isachenko, N.; et al. Small-molecule multidrug resistance-associated protein 1 inhibitor reversan increases the therapeutic index of chemotherapy in mouse models of neuroblastoma. Cancer Res. 2009, 69, 6573–6580. [Google Scholar] [CrossRef] [Green Version]
  18. Gekeler, V.; Ise, W.; Sanders, K.H.; Ulrich, W.R.; Beck, J. The leukotriene LTD4 receptor antagonist MK571 specifically modulates MRP associated multidrug resistance. Biochem. Biophys. Res. Commun. 1995, 208, 345–352. [Google Scholar] [CrossRef]
  19. Maguire, A.R.; Plunkett, S.J.; Papot, S.; Clynes, M.; O’Connor, R.; Touhey, S. Synthesis of indomethacin analogues for evaluation as modulators of MRP activity. Bioorg. Med. Chem. 2001, 9, 745–762. [Google Scholar] [CrossRef]
  20. Barraud de Lagerie, S.; Comets, E.; Gautrand, C.; Fernandez, C.; Auchere, D.; Singlas, E.; Mentre, F.; Gimenez, F. Cerebral uptake of mefloquine enantiomers with and without the P-gp inhibitor elacridar (GF1210918) in mice. Br. J. Pharmacol. 2004, 141, 1214–1222. [Google Scholar] [CrossRef] [Green Version]
  21. Weidner, L.D.; Zoghbi, S.S.; Lu, S.; Shukla, S.; Ambudkar, S.V.; Pike, V.W.; Mulder, J.; Gottesman, M.M.; Innis, R.B.; Hall, M.D. The Inhibitor Ko143 Is Not Specific for ABCG2. J. Pharmacol. Exp. Ther. 2015, 354, 384–393. [Google Scholar] [CrossRef] [Green Version]
  22. Abe, T.; Koike, K.; Ohga, T.; Kubo, T.; Wada, M.; Kohno, K.; Mori, T.; Hidaka, K.; Kuwano, M. Chemosensitisation of spontaneous multidrug resistance by a 1,4-dihydropyridine analogue and verapamil in human glioma cell lines overexpressing MRP or MDR1. Br. J. Cancer 1995, 72, 418–423. [Google Scholar] [CrossRef] [PubMed] [Green Version]
  23. Alliance of Genome Resources, C. Harmonizing model organism data in the Alliance of Genome Resources. Genetics 2022, 220, iyac022. [Google Scholar] [CrossRef] [PubMed]
  24. Gao, C.; Shi, R.; Wang, T.; Tan, H.; Xu, H.; Ma, Y. Interaction between oblongifolin C and UDP-glucuronosyltransferase isoforms in human liver and intestine microsomes. Xenobiotica 2015, 45, 578–585. [Google Scholar] [CrossRef] [PubMed]
  25. Zhu, L.; Ge, G.; Zhang, H.; Liu, H.; He, G.; Liang, S.; Zhang, Y.; Fang, Z.; Dong, P.; Finel, M.; et al. Characterization of hepatic and intestinal glucuronidation of magnolol: Application of the relative activity factor approach to decipher the contributions of multiple UDP-glucuronosyltransferase isoforms. Drug Metab. Dispos. 2012, 40, 529–538. [Google Scholar] [CrossRef] [Green Version]
  26. Gufford, B.T.; Chen, G.; Vergara, A.G.; Lazarus, P.; Oberlies, N.H.; Paine, M.F. Milk Thistle Constituents Inhibit Raloxifene Intestinal Glucuronidation: A Potential Clinically Relevant Natural Product-Drug Interaction. Drug Metab. Dispos. 2015, 43, 1353–1359. [Google Scholar] [CrossRef] [Green Version]
  27. Algeelani, S.; Alam, N.; Hossain, M.A.; Mikus, G.; Greenblatt, D.J. In vitro inhibition of human UGT isoforms by ritonavir and cobicistat. Xenobiotica 2018, 48, 764–769. [Google Scholar] [CrossRef]
  28. Heng, T.S.; Painter, M.W.; Immunological Genome Project, C. The Immunological Genome Project: Networks of gene expression in immune cells. Nat. Immunol. 2008, 9, 1091–1094. [Google Scholar] [CrossRef]
  29. Petzinger, E.; Geyer, J. Drug transporters in pharmacokinetics. Naunyn Schmiedebergs Arch. Pharmacol. 2006, 372, 465–475. [Google Scholar] [CrossRef] [Green Version]
  30. Ye, Z.; Lu, Y.; Wu, T. The impact of ATP-binding cassette transporters on metabolic diseases. Nutr. Metab. 2020, 17, 61. [Google Scholar] [CrossRef]
Figure 1. CDr20 fluorescence signal observed in a cell population of mouse blood vessels. (a) Multi-photon images of the parenchymal region of a CDr20 injected mouse brain. White arrows, CX3CR1+ cells without microglial ramified morphology. Scale bar = 20 μm; (b) Multi-photon time-lapse image of somatosensory region of CDr20-injected mouse brain. Red arrows, circulating blood cells with a red-fluorescent signal; (c) Flow cytometry analysis of CDr20-derived F.I. from spleen cells from Csf1r-GFP transgenic mice. The splenocytes were divided into three groups based on the expression level of CD45 and CSF1R; CD45+CSF1R+ (Red), CD45+CSF1R(Blue), and CD45 (Green). (d) Illustrated scheme of in vivo time-lapse imaging.
Chemosensors 11 00265 g001
Figure 2. UGT1A7C converts CDr20 to CDr20-Gluc in mouse WBCs. (a) The molecular change of CDr20 to CDr20-Gluc via UGT1A7C; (b) Fold difference in mRNA expression between FACS-sorted CDr20+ cells and CDr20 cells. (n = 4) *p < 0.0332, **p < 0.0021, ***p < 0.0002, ****p < 0.0001; (c) Fluorescence intensity of reacted CDr20 with UDPGA and isolated microsomes from N2a, BV2, Raw264.7, and mouse bone marrow (BM) in vitro; (d) Inhibition of CDr20 staining of monocytes and neutrophils by 3 UGT inhibitors at 10 times IC50 concentration. Yellow bar, mean intensities. Gray dots, data points (n = 3); (e) LC/MS of CDr20-stained cell extracts. Red dotted lines, 3.030 min. Blue dotted lines, 3.475 min. Yellow arrows in the mass spectrum indicate a peak with the corresponding mass of CDr20-Gluc, 531 m/z (C25H25BF2N2O8) and 511 m/z (C25H25BF1N2O8), and CDr20, 355 m/z (C19H17BF2O2) and 335 m/z (C19H17BF1O2).
Chemosensors 11 00265 g002
Figure 3. CDr20 stains monocytes and neutrophils preferentially. (a) Ugt1a7c expression level in different murine immune cell populations. MG, microglia, Pro, progenitors, NK, natural killer cells, ILC, innate lymphoid cells, DC, dendritic cells, MΦ, macrophages, Mono, monocytes, GN, granulocytes, Ba, basophils, Eo, eosinophils, MC, mast cells. The source data are from the Immunological Genome Project Consortium (https://www.immgen.org/ Accessed on 11 January 2023); (b) CDr20 stained myeloid cells colocalized with CD11b+Ly6g monocyte (Arrow) or CD11b+Ly6g+ neutrophils (Arrowheads); Scale bar = 20 μm; (cl) CDr20-derived fluorescence intensity of different immune populations from murine bone marrow; (m) Specificity of CDr20 staining to CD11b+CX3CR1+Ly6g (CX3CR1high and CX3CR1low) (blue) and CD11b+CX3CR1Ly6g+ (green) cells. Red, CD11b cells; Orange, CD11b+CX3CR1Ly6g cells.
Chemosensors 11 00265 g003
Figure 4. ABCC mediates monocyte-specific fluorescence fadeout after prolonged incubation with CDr20. (a,b) After 60 min of incubation with CDr20, CDr20-derived fluorescence fades specifically from CD11b+Ly6g (Arrows) cells, while the fluorescence intensity remains in CD11b+Ly6g+ (Arrowheads) cells. Scale bar = 20 μm; (c) Time-lapse flow cytometry analysis on changes of CDr20-derived fluorescence intensity in murine WBCs; (d) Time-lapse flow cytometry analysis on antibody-tagged neutrophils and monocytes at 7 min and 60 min after CDr20 staining; (e) The quantification of changes in CDr20-derived fluorescence intensity of Raw264.7 cells measured at 10 and 60 min with or without the influence of certain ABC inhibitors; (f) The fluorescence intensity of CDr20-stained CD11b+Ly6g and CD11b+Ly6g bone marrow-derived WBCs at 60 min. WBCs were pre-treated for 10 min with specified ABC inhibitors. The indicated gaps represent the difference in mode values between CD11b+Ly6g and CD11b+Ly6g cells.
Chemosensors 11 00265 g004
Figure 5. The dual enzyme measurement activity of CDr20 and its application as novel methods in live monocytes/neutrophils visualization including blood cell counting. (a) The molecular mechanism underlying CDr20 fluorescence labeling of neutrophils and monocytes. Both myeloid cell types are discriminately labeled with CDr20 due to UGT1A7C activity, which is expressed at a particularly high level in neutrophils and monocytes (Left). After prolonged incubation, the fluorescence intensity for CDr20 labeling decreases specifically in monocytes, in an ABC transporter-dependent manner; (b) Suggested workflow for fluorimetric cell counting for monocytes and neutrophils using CDr20; (c) Time-lapse fluorimetric cell counting using CDr20 (500 nM). Cells labeled with both calcein AM and CDr20 (yellow circle) and cells labeled only with calcein AM (cyan circle); scale bar = 200 μm; (d) Quantification of the number of neutrophils and monocytes in 1 mL sample, based on the counting result shown in (c).
Chemosensors 11 00265 g005
Disclaimer/Publisher’s Note: The statements, opinions and data contained in all publications are solely those of the individual author(s) and contributor(s) and not of MDPI and/or the editor(s). MDPI and/or the editor(s) disclaim responsibility for any injury to people or property resulting from any ideas, methods, instructions or products referred to in the content.

