1. Introduction
Creatinine is one of the natural compounds present in the body, being recognised as an indicator of kidney, muscle, and thyroid malfunctions [
1]. It is a waste product formed by the breakdown of creatine [
2], and its levels depend significantly on the muscle mass of each individual. This analyte is mostly filtered by the kidney [
3], being excreted in the urine, and almost none of it is absorbed.
Creatinine is produced and excreted continuously [
4], and due to this fact, kidney function can be assessed through the serum levels and through the amount of creatinine clearance, analysed by its range in urine. In a urine spot sample, these values can vary from 20 to 320 mg/dL and 20 to 280 mg/dL in men and women, respectively. The changes that occur in the kidneys’ normal function are better assessed when creatinine is analysed in urine [
5]. As the levels of creatinine can indicate health problems, monitoring is important to understand the health status. On one hand, lower urine creatinine values in human urine can show damage to renal function or chronic kidney disease [
6] and can also be related to nutritional factors, age, gender, and, therefore, subsequent muscle mass [
7]. On the other hand, high creatinine levels in urine may indicate dehydration and hyperfiltration by the glomerulus, where the renal plasma flow is normal, but an increased filtration pressure is present (“glomerular hypertension”), suggesting pregnancy or the presence of type 2 diabetes mellitus [
7,
8]. Routinely, creatinine is determined through the Jaffe Reaction. In this method, in an alkaline medium, the active methylene group of the creatinine reacts with the C3 atom of the picric acid, forming a complex. The solution changes its colour from yellow to orange/red, which can be further analysed in a spectrophotometer and correlated with the creatinine concentration present [
9,
10].
Although most of the existing methods use the previously described reaction in a batch-wise-like procedure, with the growth and development of new analysis systems, microfluidic devices have taken an important place. This type of equipment uses small volumes of samples and reagents, miniaturised equipment, being fast and non-expensive, which fits the guidelines of the World Health Organization in the “ASSURED” [
11].
Conventional microfluidic devices and novel µPADs have hydrophilic areas, provided by the paper zones, and hydrophobic areas surrounding them [
12]. The well-defined hydrophobic and hydrophilic areas can be obtained by patterning the paper to obtain the hydrophobic barrier or shaping and cutting the paper to define the hydrophilic barrier relative to the hydrophobic zone [
13,
14]. Some devices use materials like glass, silicon, and polymers [
15,
16] and techniques to pattern paper, like wax printing and photolithography [
12]. Although new µPADs seem to not have the mechanical robustness present in conventional microfluidic devices, the use of just paper is an advantage since it makes this approach cheaper, lightweight, simple, easier for transportation and storage, and thus more available to the end-user [
13,
16]. Moreover, the µPADs analysis itself is also inexpensive since these devices are usually used with colourimetric analysis [
17] and can be analysed with low-cost scanners, digital cameras, or mobile phones, combined with further image analysis software [
18] like ImageJ or Photoshop
® to analyse the different colour intensity. An RGB system is used to collect the intensity of the coloured zones [
19], and one filter channel corresponding to the colours Red, Green, and Blue is chosen by being the closest complementary colour of the colour developed after the reaction [
12,
20]. This device can reach the analytical requirements of a conventional UV-VIS spectrophotometry method, but it has the additional advantage of being portable and cheaper while using a significantly smaller volume. A calibration curve is easily obtained by inserting standard solutions into the µPAD and analysing the different colour intensities of each solution. [
12,
17].
In this context, the aim of this work was to devise a microfluidic paper-based analytical device for the inexpensive, portable, disposable, simple, and in-the-moment determination of creatinine in urine for the diagnosis of kidney-associated problems. This device was assembled by aligning layers of filter paper into a plastic pouch to create the hydrophobic and hydrophilic zones, and the creatinine quantification was based on the Jaffe reaction.
2. Material and Methods
2.1. Reagents and Solutions
The solutions were prepared with analytical grade chemicals and Milli-Q® Water (Resistivity > 18.2 MΩ.cm, Millipore, Bedford, MA, USA).
The picric acid solution was prepared weekly, dissolving 57 mg of picric acid (Sigma, Taufkirchen, Germany) in 5.00 mL of water to a final concentration of 0.050 M.
A 5.0 M sodium hydroxide stock solution was prepared, dissolving 10 g of sodium hydroxide (PanReac, Barcelona, Spain) in 50.0 mL of water. The 2.0 M hydroxide buffer working solution was prepared by dilution of the stock solution.
The colour reagent solution was prepared by mixing 240 µL of picric acid 0.050 M with 60.0 µL of NaOH 2.0 M, resulting in 0.040 M of picric acid and 0.40 M of NaOH. This mixture was prepared daily due to its low stability.
A creatinine stock solution of 1000 mg/L was prepared every other day by dissolving 10.0 mg of creatinine (Sigma, Taufkirchen, Germany) in 10.0 mL of water. Creatinine working standards within a range of 25.0 mg/L to 350 mg/L (2.50 mg/dL to 35.0 mg/dL) were then prepared from the stock solution.
The synthetic urine solution used in the interference studies was prepared according to Brooks et al. [
21], with the following composition: 10 g/L urea; 0.07 g/L uric acid; 5.2 g/L sodium chloride; 0.1 g/L lactic acid; 0.4 g/L citric acid; 0.37 g/L calcium chloride dehydrate; 0.49 g/L magnesium sulfate heptahydrate; 1.42 g/L sodium sulphate; 0.95 g/L potassium dihydrogen phosphate; 1.2 g/L potassium hydrogen phosphate; and 0.49 g/L glucose.
2.2. µPAD Assembly
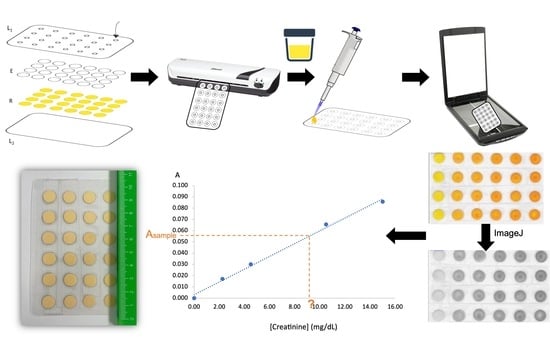
The µPAD consisted of two hydrophilic layers of different types of filter paper to create a vertical flow, arranged in 24 reading units aligned in a 6 × 4 arrangement (
Figure 1A). For calibration curves, #4 readings were used per standard, and, regarding sample analysis, #6 readings were performed. The #24 two-layer units (hydrophilic area) were separated by the hydrophobic zone created by the lamination of a plastic pouch of 125 microns (75 mic polyester, 25 mics low-density polyethene, 25 mic ethylene-vinyl acetate), size of 75 × 110 mm (Q-Connect, Gent, Belgium). The top layer of the plastic pouch had #24 holes cut out, 3 mm diameter sampling holes, to align with the reading units (L
1 in
Figure 1A).
Each two-layer unit consisted of 9.5 mm diameter filter paper discs (puncher of 3/8”, EK tools, Woodridge, IL, USA), being the top layer a qualitative filter paper (Whatman
® W1) and the bottom layer a hardened ashless filter paper (Whatman
® W542). The bottom layer was the colour reagent solution layer and was prepared first, loading 12 µL of reagent in each W542 filter paper disc, followed by incubation at 50 °C for 10 min to dry. Then, an empty disc of W1 was placed over the reagent disc, and the two-disc unit was aligned into the plastic pouch (
Figure 1A), followed by a sealing process through lamination (ACCO Brands Europe, Style/CBT12698) to create the proper hydrophobic and hydrophilic zones.
2.3. Creatinine Determination
The creatinine determination was attained by loading 15 µL of standard/sample through the sampling hole of the top laminating pouch (
Figure 1B). To promote the sample/standard vertical flow to the reagent layer (bottom layer of the reading unit) and the colour development, 20 min of time to scan (TTS) at room temperature were set. This time corresponds to the time elapsed between loading the standard/sample in the device and its scanning. The sample holes were covered with tape to avoid contamination of the device and scanner and, afterwards, the µPAD was scanned (Canon LIDE 120) on the side of the reagent layer (bottom layer), and the image was processed to measure the colour intensity of each disc (free software ImageJ 1.53t). In this software, the intensity value (at an 8-bit scale) can be obtained using an RGB filter (red, green, or blue filters), and the green filter was chosen as the complementary colour of the formed product (
Figure 1C). The colour intensity in each detection area was measured to calculate the pseudo-absorbance, which was based upon blank solution intensities and the standard/sample solutions intensities [
22,
23]; the pseudo-absorbance was calculated according to the equation:
, where
A is the calculated absorbance value,
I0 is the colour intensity obtained by the average intensity of the blank solutions, and
I is the average colour intensity obtained by the standard/sample solutions. In this way, a calibration curve was established between the concentration values of the standards and the calculated absorbance. In each device, a blank reading was performed (#4 units for calibration curves devices and #6 units in sample devices). The sample concentration was calculated by interpolation in the established calibration curve. Samples were mainly inserted directly, but they could be diluted if needed.
2.4. Comparison Method—Accuracy Assessment
For accuracy assessment of the creatinine determination, the results attained with the developed µPAD device were compared with those obtained with a commercially available kit for the quantitative determination of creatinine in human urine samples (#11 individuals) [
24]. This batch-wise assay relies on the colourimetric reaction of creatinine with sodium picrate, as described by Jaffe.
Briefly, two volumes of alkaline picrate solution (picric acid 0.006 M, NaOH 0.10 M) were added to one volume of urine sample, and the solution was incubated for 30 min at room temperature. The absorbance of the colour complex developed was measured at 490 nm, and the creatinine concentration was calculated through a standard calibration curve generated for each set of samples assayed. The samples can be used directly in the device (non-diluted), or with dilution, in the case of the more concentrated samples.
3. Results
3.1. Pre-Set Conditions
The chosen reaction for the development of the µPAD for creatinine determination was the Max Jaffe reaction [
25], using picric acid mixed with NaOH. Initially, the µPAD was assembled using two layers of filter paper Whatman 1 (W1) to ensure vertical flow through the filter paper pores (<25 µm) channels. The top layer was the layer with the colour reagent, and the bottom layer was an empty paper disc used as a reservoir. It was established to scan the µPAD at the reagent layer side (initially the top layer) and to perform the intensity measurements 20 min after sample/standard loading. The waiting period between loading and measurement was denominated TTS. The sample/standard was loaded through a hole in the top sheet of the plastic pouch; the sample hole was designed to be 3 mm in diameter. Standards within the range of 20 to 150 mg/L were used for the optimisation studies.
3.2. µPAD Design—Physical Parameters
3.2.1. Study of the Reagent Layer Paper Disc
The studies were made with the reagent layer as the top layer, loaded with 15 µL of colour reagent, on top of a 12.7 mm disc as the empty bottom layer.
Two-disc sizes were compared, 9.5 mm and 12.7 mm, establishing calibration curves loading 20 µL of standard. The µPAD with the 9.5 mm paper disc in the top layer resulted in the highest sensitivity (calibration curve slope 82% higher, ESM
Figure S1), so it was the chosen size. This can be explained by the higher reagent concentration in the reagent-sample contact area in the smaller-sized disc.
Subsequently, filter papers with different pore sizes were tested: paper Whatman 1 (pore size 11 µm), paper Whatman 4 (pore size 20–25 µm) and paper Whatman 5 (pore size 2.5 µm). Again, calibration curves were established, and the sensitivities (calibration curve slopes) were compared (
Figure 2A). The smallest pore size, Whatman 5 (W5), was chosen as it presented the highest sensitivity.
Next, the influence of the type of paper on the sensitivity was studied, maintaining the previously chosen pore size of approximately 2.5 µm. Calibration curves were established, and the slopes obtained were compared when assembling the µPAD with different types of paper on the reagent layer: qualitative paper (Whatman 5), ashless paper (Whatman 42), a hardened low ash paper (Whatman 50), and a hardened ashless paper (Whatman 542). For this purpose, the reagent volume was set to 10 µL since the 15 µL volume of the reagent was not absorbed in the W50 and W542 papers. As seen in
Figure 2B, the Whatman 542 paper showed significantly higher sensitivity. To further enhance the device performance, a reagent volume of 12 µL was tested with the Whatman 542 to provide more reagent and, consequently, higher sensitivity (calibration curve slope). In the end, the paper chosen was the Whatman 542 with 12 µL of reagent volume.
3.2.2. Study of Empty Layer Paper Disc
After establishing the type of paper and the pore size of the reagent layer (W542), the empty layer paper (bottom layer) influence on the calibration curve slope was studied. Considering that this layer intends to be a reservoir to ensure the vertical flow approach, it was set to use qualitative paper (with no treatment and, therefore, a more economical choice) with a paper diameter of 12.7 mm. In this way, only different pore sizes were tested. Calibration curves established with µPADs assembly with paper Whatman 1, 4, and 5 were compared, and given the fact that the calibration curve obtained when using Whatman 1 was the only one that presented linearity, this paper was chosen (ESM
Figure S2).
3.2.3. Order of Layers
After setting the type of filter paper used for each layer, the influence of the order of layers in the sensitivity was also studied. This study was performed mainly to “protect” the reagent layer from exposure to the air, as initially, it was the top layer in contact with the sample insertion hole.
Three configurations were compared by establishing calibration curves with (i) the previously used configuration, with the reagent in the top layer (9.5 mm W542 disc) and an empty bottom layer as a reservoir (12.7 mm W1 disc); (ii) an inverted configuration, with the empty top layer (12.7 mm W1 disc) and the reagent on the bottom layer (9.5 mm W542 disc); (iii) an inverted configuration but with a smaller empty top layer (9.5 mm W1 disc) maintaining the reagent on the bottom layer (9.5 mm W542 disc) (
Figure 3A). The inverted configuration, with the smaller W1 paper disc size, implied the use of a smaller standard/sample volume, 15 µL, instead of the 20 µL used in the other configurations. Despite having a smaller volume, the sensitivity was not significantly different in comparison with the configuration previously used (
Figure 3B). Thus, since the reagent in the bottom layer was less exposed, that was the chosen configuration.
3.3. µPAD Design—Chemical Parameters
Having set the µPAD assembly, the influence of the reagents’ concentrations and sample volume on the sensitivity was assessed.
A 0.03 M picric acid solution was prepared in different hydroxide concentrations ranging from no hydroxide to 0.5 M. Calibration curves were established for four NaOH concentrations (0.2, 0.3, 0.4, and 0.5 M) as the reaction did not occur without NaOH proving the need of alkaline medium (
Figure 4A). The concentration chosen was 0.4 M, as a compromise solution of the highest sensitivity and lower consumption.
With the chosen NaOH concentration of 0.4 M, different picric acid concentrations were tested, 0.02 M, 0.03 M, and 0.04 M (
Figure 4B). Although no significant differences between the calibration curve slope obtained with 0.03 and 0.04 M of picric acid could be observed, better linearity was achieved using the higher concentration (higher correlation coefficient). Thus, this was the chosen concentration.
3.4. Sample Volume
The influence of the standard/sample volume in the sensitivity was evaluated by analysis of calibration curves with volumes of 15 µL, 20 µL, and 25 µL (ESM
Figure S3). Furthermore, filter papers of Whatman 1 and Whatman 3 performances were compared. Using W1, sample volumes of 20 µL and 25 µL could not be absorbed; therefore, these volumes were only tested with W3. Using W3, the increase in sample volume is reflected in increased sensitivity. The highest sensitivity was then obtained with 25 µL.
Analysing the results, the sensitivity when using a sample volume of 15 µL on W1 did not show a significant difference when compared with a higher volume (25 µL) on W3; thus, the volume chosen was 15 µL with W1 in the top layer.
3.5. Stability Studies
After establishing the operational parameters to attain the highest sensitivity, the stability assessment of the developed µPAD was studied. It should be noted that two linear intervals were set with different sensitives, one between 20–150 mg/L (2.0 to 15.0 mg/dL) and the other between 150–350 mg/L (15.0 to 35.0 mg/dL).
3.5.1. µPAD Stability
Stability studies were performed by testing different storage conditions before the sample insertion. As so, it was studied the maximum time frame in which it was possible to obtain linear calibration curves. In terms of storage, the device was analysed when stored in air contact, in a vacuum clear zip-locked bag stored at room temperature and at 4 °C. In all storage conditions, the µPAD was protected from light by aluminium paper.
It was observed that, with storage in the air, there was no linear correspondence between the standards and the signal with the device after 2 days. When using the vacuum storage at room temperature, it was possible to notice that after 2 days, the calibration curve slope remained within a ± 10% deviation, with no significant differences. However, after 1 week, this storage was no longer suitable since it was possible to observe significant differences between the sensitivities of these µPADs and the ones freshly made.
The vacuum refrigerated storage was introduced due to the observation of sensitivity loss after one week in the vacuum storage at room temperature. Indeed, this storage proved not to have a significant difference from the freshly made one (<10% deviation) after one week. However, at two weeks, for the lower range of concentrations, there are significant differences when compared to the fresh µPAD. Although the differences in the higher range of concentrations (indicated as 14d* in
Figure 5) are not significant, in this case, the calibration curve was made with a fewer number of standards to maintain a linear correlation between the concentration and the signal. Because of that, the µPAD would not be able to quantify creatinine in the intended concentration range. Hence, the µPAD can be fabricated and stored for up to one week, keeping its stability, if in a vacuum-closed clear zip-locked bag, stored at 4 °C.
3.5.2. Stability of the Reaction Product
After loading the standard/sample into the µPAD, the reaction occurs, producing the coloured complex whose intensity is measured. In order to assess the stability of this coloured product, the device was scanned within different periods of time, ranging from the set TTS of 20 min up 6 h (ESM
Figure S4). Different calibration curves were plotted for each TTS set.
It was possible to observe that the sensitivity increased up to 40 min, and it was stable up to 3 h (180 min). A sensitivity decrease could be noted after 4 h (240 min), and after 6 h (360 min), that decrease showed significant differences to the stable period (slope relative deviation > 10%).
Aiming for a fast, real-time assessment, 20 min is a more efficient response time, and it is important to ensure that the sample measurement is interpolated at the calibration curve with the same TTS.
3.6. Features of the µPAD
The operational features of the designed µPAD for creatinine determination are presented in
Table 1. The typical calibration curves (standards prepared in MQW) present in
Table 1 were obtained from eight calibration curves made on different days. The colour images of the scanned device and the calibration curve plotting are also detailed in
Figure 6.
The limit of detection (LOD) and the limit of quantification (LOQ) was calculated, following 1995 IUPAC recommendations [
26], respectively, as the concentration equivalent to three times and ten times the standard deviation of the intercept (calibration curve used from 2.20 to 15.0 mg/dL). The superior limit of the dynamic range was set at 35.0 mg/dL since higher concentrations did not align with the established linear regression.
The repeatability of the µPAD was assessed by calculating the relative standard deviation (RSD) of calibration curve slopes made on different days (n = 8) with an absorbance accuracy of about 5%. The precision of the µPAD was assessed by analysing the RSD of two different samples (#8 measurements). The consumption of reagents was calculated per µPAD, and the presented sample consumption corresponds to one determination, which requires #6 readings.
3.7. Interferences
The potential interference of the urine matrix was assessed by comparison of calibration curves made using standards prepared with Milli-Q water (MQW) and prepared with synthetic urine (ESM
Figure S5). There was no difference in the sensitivity (calibration curve slopes deviation <10%), and therefore, MQW was kept for standards preparation in the analysis.
Additionally, the potential interference of relevant compounds in urine, namely, urea and glucose, was also assessed, testing the expected amounts in synthetic urine (approximately 10 g/L and 0.5 g/L, respectively) and higher amounts (2 and 4 times higher). Urea is one of the main components of urine, and glucose is an indicator of
diabetes mellitus (type 2), a problem also identified through creatinine urine levels. To evaluate the potential interference, two creatinine standard solutions of 5 mg/dL and 20 mg/dL were prepared, with and without the potential interfering compounds (
Table 2). Regarding urea and considering a daily volume of urine of 1.5 L [
27], the normal healthy value is approximately 13 g/L [
28]. In the case of glucose, the expected values vary from 0.6 to 1.4 g/L; however, when the condition of diabetes type 2 is verified, the levels can be above the higher limit. [
29]. Therefore, two concentration values of the interferent compounds were selected; in the case of urea, both were higher than the expected value, and in the case of glucose, one was within the healthy values and the other above.
The interference percentages were below or approximately 10%, indicating that the developed µPAD can accurately quantify creatinine even if high concentrations of urea and glucose were present in the urine.
The potential interference of the sample colour was not carried out due to the fact that the reading of the device is made from the opposite side to the loading of the sample.
3.8. Accuracy Assessment—Application to Samples
To evaluate the accuracy of the developed µPAD for creatinine determination in urine samples, several samples (#11) were directly analysed with the µPAD, and the results were compared to a conventional batch-wise procedure. The concentration of creatinine in each sample was determined, and the relative error between both methods ([Creatinine]
CM and [Creatinine]
µPAD) was calculated, as shown in
Table 3.
All the analysed samples presented creatinine concentrations within the limits of the developed µPAD. A linear relationship between the two methods was established (ESM
Figure S6), and the obtained equation (where the values in brackets represent the 95% confidence interval), [Creatinine]
µPAD = 0.898 (±0.137) [Creatinine]
CM + 1.60 (±1.73), proved that the developed method is not significantly different from the comparative method since both, the slope and intercept, were not statistically different from 1 and 0, respectively.
4. Discussion
After the design and optimisation of the µPAD for creatinine quantification, its features were compared with those reported in other studies for creatinine determination (
Table 4). Compared to other methods, this device has similar or even lower limits of detection, as well as, when available, lower limits of quantification [
30,
31,
32], reflecting the advantage when analysing lower creatinine values. Regarding sample insertion, directly dipping the device in urine samples could mean a non-controlled amount of sample in the detection area and consequently lower accuracy [
30,
32,
33]. Additionally, the developed device requires less sample volume than most of the developed processes [
31,
34,
35]. When creating hydrophilic and hydrophobic areas, all the other techniques with these two distinct zones require a solid ink printer [
30,
31,
32,
34,
35,
36], along with an additional step of heating at high temperatures. Not only this makes the approach more expensive, but the availability of wax printers has been declining due to their discontinuation, and even considering other ink techniques, the final resolution can be impaired [
37]. After placing all the reagents and samples, the image processing is a lot more complex in other devices [
30,
31,
34,
35,
38], for example, that need to convert the image type and that need specific detection sensors instead. Finally, the developed µPAD is able to accurately quantify creatinine, with a relative standard deviation below 10%, not simply in a semi-quantitative way, and it is not necessary to treat samples with acidic solutions or centrifugation. Furthermore, it uses vertical flow, maintaining a unilateral flow of solutions through the layers in the device.
5. Conclusions
In this work, a µPAD for the quantification of creatinine in human urine was developed, providing a simple, fast, on-site, and inexpensive determination of this analyte content in urine. Moreover, the accurate quantification of creatinine enables one to assess health conditions and anticipate potential problems. Even when the values are within the expected range (20–320 mg/dL for men and 20–280 mg/dL for women), it is still important to evaluate if it is closer to the lower end or upper end or if there is a tendency (frequent monitoring when there is a special concern). The developed μPAD application range was more focused on the lower range and to more accurately assess when there is a deficiency, as dilution is always easier to make in the case of higher values. That was exactly the procedure when the samples were above the higher limit of the quantification range.
This represents an easy and non-invasive biological sample collection with no need for specialised operators. The device represents a suitable approach for point-of-care analysis and can be applied in remote areas, namely developing countries where the population does not have access to basic health care and resources. Moreover, the device is also environmentally friendly and easy to dispose of via incineration while using reduced amounts of sample and reagent, important advantages when compared with other analysis procedures.
As so, to determine creatinine concentration after the sample placement, simple scanning of the developed µPAD after 20 min and posterior image processing in ImageJ (free software) allowed to measure the colour-developed intensity and calculate the absorbance using the blank signal as a pseudo incident radiation (I0). The use of a scanner is a way to assure consistent image acquisition, non-dependent on the scanner conditions and on the operator. Although its main use is an accurate quantification, which implies ImageJ data treatment, the developed device can also be used in a semi-quantitative way for home-test applications.
Furthermore, the developed sensor quantifies creatinine within a dynamic range of 2.20–35.0 mg/dL and an RSD of about 9%, being able to use samples directly in the device (non-diluted), or with dilution, in the case of the more concentrated samples. To evaluate if this device would be suitable for transportation, a stability study was performed, concluding that the µPAD enabled the accurate creatinine determination for up to one week when stored in a vacuum at approximately 4 °C. The stability of the reaction product was also assessed, and it was proved that the colour reading could be made up to 3 h after sample loading.


