Article

Applicability and Limitations of Fluorescence Intensity-Based Thermometry Using a Palette of Organelle Thermometers

1
WPI Nano Life Science Institute, Kanazawa University, Kakuma-machi, Kanazawa 920-1192, Japan
2
Center for Self-Assembly and Complexity, Institute for Basic Science (IBS), Pohang 37673, Republic of Korea
3
Department of Chemistry, Pohang University of Science and Technology (POSTECH), Pohang 37673, Republic of Korea
*
Authors to whom correspondence should be addressed.
Chemosensors 2023, 11(7), 375; https://doi.org/10.3390/chemosensors11070375
Submission received: 30 May 2023 / Revised: 27 June 2023 / Accepted: 29 June 2023 / Published: 4 July 2023

Abstract

:
Fluorescence thermometry is a microscopy technique in which a fluorescent temperature sensor records temperature changes as alterations of fluorescence signals. Fluorescence lifetime imaging (FLIM) is a promising method for quantitative analysis of intracellular temperature. Recently, we developed small-molecule thermometers, termed Organelle Thermo Greens, that target various organelles and achieved quantitative temperature mapping using FLIM. Despite its highly quantitative nature, FLIM-based thermometry cannot be used widely due to expensive instrumentation. Here, we investigated the applicability and limitations of fluorescence intensity (FI)-based analysis, which is more commonly used than FLIM-based thermometry. Temperature gradients generated by artificial heat sources and physiological heat produced by brown adipocytes were visualized using FI- and FLIM-based thermometry. By comparing the two thermometry techniques, we examined how the shapes of organelles and cells affect the accuracy of the temperature measurements. Based on the results, we concluded that FI-based thermometry could be used for “qualitative”, rather than quantitative, thermometry under the limited condition that the shape change and the dye leakage from the target organelle were not critical.

1. Introduction

Temperature is a fundamental physical parameter associated with biological events within cells, such as gene expression, proliferation, and metabolism [1,2,3]. Additionally, abnormal temperatures at the cellular and tissue levels are thought to cause inflammation and metabolic activity in cancer [4,5]. Monitoring intracellular temperature is important to understand these biological events at the cellular level. Fluorescence thermometry is a microscopy technique that enables the measurement of temperature changes through the alteration of fluorescence signals, such as fluorescence intensity (FI), intensity ratio between two emissions, peak position, and fluorescence lifetime [6,7]. This thermometry requires the use of nanosized fluorescent materials with temperature-sensitive properties, called fluorescent thermometers, which can be used at the cellular and tissue levels [8]. Among the few types of measurable fluorescence signals, fluorescence lifetime is expected to be a promising parameter for more accurate thermometry, as the fluorescence signals in FLIM are independent of factors such as the intensity of excitation, fluorophore concentration, and focus drift, which are problematic in most conventional FI-based analyses [9].
To achieve fluorescence lifetime imaging (FLIM)-based thermometry, various materials have been developed in which fluorescence lifetime responds to changes in temperature; examples include polymeric nanogels, nanorods, nanowires, nanoparticles, and small fluorescent dyes [10,11,12,13,14]. In particular, fluorescent dyes offer advantages such as the accessibility of chemical modification with a targeting moiety and the ability to distribute evenly in many cell types [15]. Previously, we reported a small molecular-sized fluorescent thermometer targeting the endoplasmic reticulum (ER), named ER Thermo Yellow (ETY), which enables FI- and FLIM-based thermometry [15]. Furthermore, by modifying the structure of ETY, we extended it to a series of fluorescent dyes termed Organelle Thermo Greens (OTGs), a palette of organelle thermometers, to cover the ER, Golgi body, lysosomes, lipid droplets, nucleus, mitochondria, and plasma membrane. We further introduced FLIM-based thermometry for quantitative analysis of physiological heat production and succeeded in visualizing thermogenesis in brown adipocytes [16].
Although FLIM-based organelle thermometry is a powerful tool for the quantitative analysis of temperature increases in organelles, it is not widely used because of the high cost of FLIM instruments, which limits its availability in microscopy. As an alternative, FI-based thermometry requires only a conventional fluorescence microscope, although quantitative analysis remains challenging. Here, we demonstrated the applicability of FI-based thermometry for imaging the temperature gradient generated by photothermal heating and physiological thermogenesis in brown adipocytes. By comparing the resulting data with those obtained from FLIM-based thermometry, we evaluated the accuracy of the FI-based thermometry, taking into consideration the effect of inherent artifacts on the results. Finally, we discuss the applicability and limitations of FI-based thermometry.

2. Materials and Methods

2.1. Chemicals

All the materials were purchased from Sigma-Aldrich (St. Louis, MO, USA), TCI (Tokyo, Japan), Nacalai Tesque (Kyoto, Japan), and Thermo Fisher Scientific (Waltham, MA, USA). ETY and OTGs were synthesized as described in previous studies [15,16].

2.2. Cell Culture

HeLa and 3T3-L1 cells were cultured in Dulbecco’s modified Eagle’s medium (DMEM) at 37 °C in 5% CO2. WT-1 cells were cultured in GlutaMAX medium under the same conditions. All media were supplemented with 10% fetal bovine serum and 1% penicillin-streptomycin. Subsequently, 3T3-L1 and WT-1 cells were differentiated as described previously [17,18].

2.3. Evaluation of Temperature Sensitivity of OTGs through Photothermal Heating Using Graphite Flakes

HeLa cells were stained with one of the OTGs and ETY at a final concentration of 1 μM; subsequently, graphite flakes (98 μm, M199.95, NSC, Osaka, Japan) were placed on the cells. FI-based images were obtained using a confocal microscope (FV1200, Olympus, Tokyo, Japan) equipped with a 60 × oil immersion objective lens (NA = 1.42, PLAPON, Olympus, Tokyo, Japan) in the FITC channel (emission filter set: 490–540 nm; excitation laser: 473 nm) and Texas Red channel (emission filter set: 575–675 nm; excitation laser: 561 nm) for OTGs and ETY, respectively. During the observation, graphite flakes were illuminated with an NIR laser (808 nm, LuxX 808-190, omicron, Dudenhofen, HE, Germany). The timing and duration of the stimulation were regulated using an IR-LEGO system (IR-LEGO-100/mini, Sigma Kohki, Tokyo, Japan). The data were analyzed using ImageJ software(ImageJ 1.53t).

2.4. Visualization of Temperature Gradient Generated by Nano Heater (nanoHT) and Comparison of Accuracy between FI- and FLIM-Based Thermometry

Poly(methyl methacrylate-co-methacrylic acid) solution (500 μL, 10 mg/mL in tetrahydrofuran (THF)), vanadyl 2,11,20,29-tetra-tert-butyl-2,3-naphthalocyanine solution (440 μL, 2.0 mg/mL in THF), and coumarin102 solution (250 μL, 1.0 mg/mL in THF) were mixed together in a glass vial. Distilled water (8 mL) was then added to the organic solutions. The mixture in the uncapped vial was left overnight in a fume hood to remove THF.
Differentiated 3T3-L1 cells were treated with DMEM containing 10 μL of nanoHT for 24 h. The cells were stained with Mito Thermo Green (MTG) at a final concentration (1 μM) for 30 min. Fluorescence imaging was performed using a confocal microscope (FV1200, Olympus) equipped with an objective lens (NA = 1.42, PLAPON) in the FITC channel (emission filter set: 490–540 nm; excitation laser: 473 nm). Images were captured at a size of 512 × 512 pixels at 1.66 s/frame. During the observation, nanoHT was illuminated with an 808 nm NIR laser at a power of 9.2 mW for 10 s or 500 ms. Images with negligible photobleaching were selected for analyzing the step-like response.
Fluorescence lifetime images were obtained at 512 × 512 pixels at 1.66 s/frame using a FLIM system (rapid-FLIMHiRes with MltiHarp 150 Time-Correlated Single Photon Counting unit, PicoQuant), a 485 nm pulsed laser, and an FITC emission filter set (520/35 Bright Line HC). All FLIM images were analyzed using SymPhoTime 64 (PicoQuant). The instrumental response function (IRF) was obtained by calculating the difference in decay between estimated and measured fluorescence decay curves. The fluorescence decay of MTG including IRF was then fitted to a double exponential function, and fluorescence lifetime was calculated using the following Equation (1):
τ i n t = ( A 1 τ 1 2 + A 2 τ 2 2 ) / ( A 1 τ 1 + A 2 τ 2 )
where A and τ are the contribution and fluorescence lifetime of each component, respectively. During the observation, the nanoHT was illuminated with an 808 nm NIR laser at a power of 9.2 mW for 500 ms.

2.5. Visualization of Thermogenesis in Brown Adipocytes

Brown adipocytes (WT1) were stained with MTG at a final concentration of 1 μM for 30 min. The FI and FLIM images were obtained according to the conditions described in Section 2.4. To image the heat production in brown adipocytes, isoproterenol was added to the dish at a final concentration of 1 μM during observation.

2.6. Evaluation of the Diffusivity of Dyes in Each Organelle by Fluorescence Recovery after Photobleaching (FRAP)

HeLa cells were stained with ER Thermo Green (ETG), PTG, or NTG at a final concentration of 1 μM. Differentiated 3T3-L1 cells were stained with DTG at the final concentration (1 μM). FI images were obtained using the same confocal microscope as that for the FITC channel. During the observation, the region of interest was irradiated with a green laser (473 nm) at a power of 64 μW for 10 s.

3. Results and Discussion

3.1. Evaluation of FI-Based Temperature Sensitivity of OTGs

First, we address the mechanism of temperature sensing in OTGs. Meso-substituted boron-dipyrromethene (BODIPY), called the BODIPY rotor, is often used as a scaffold for the development of fluorescence sensors because it responds to changes in the microenvironment, such as viscosity and temperature [19,20]. Previous studies using time-dependent density functional theory (TD-DFT) have estimated the relative electronic energy versus the dihedral angle between BODIPY and the benzene ring in BODIPY rotors [21]. BODIPY rotors possess two metastable states: the planar conformation (PC-1) and the butterfly conformation T(BC-2). Notably, the rotor is more often in the PC-1 state in the higher-viscosity environment and BC-2 in the lower-viscosity environment. The energy state of BC-2 was lower than that of PC-1, resulting in a short S0–S1 energy gap for BC-2 and the relaxation of the excited energy via a nonradiative pathway. In other words, in lower-viscosity environments, the nonradiative constant (knr) of the BODIPY rotor increases while the radiative constant (kf) remains the same, meaning that the fluorescence lifetime decreases [22]. Oppositely, the fluorescence lifetime increases in higher-viscosity environments. In the case of ETG as the latest version, the energy barrier between PC-1 and BC-2 is quite small (0.016 eV); therefore, the transition from PC-1 to BC-2 is smooth, without the aid of a temperature rise to overcome the barrier [23]. In this case, ETG can function as fluorescence lifetime-based viscosity sensors. In fact, we found that the fluorescence lifetime of OTGs was not sensitive to temperature but to viscosity. However, we proposed that a viscosity sensor can be used as a temperature sensor. This is because ETG is able to detect the “temperature induced viscosity change” as a detectable fluorescence signal, since the change in the viscosity of the microenvironment is always physically accompanied by the change in temperature. We then successfully visualized temperature increments with ETG or other OTGs that are sensitive only to viscosity [16]. We also observed that the FI of ETG was sensitive to viscosity with negligible temperature sensitivity (Supplementary Figure S1). Similar to the fluorescence lifetime, the FI values of ETG, as well as those of the other OTGs, are expected to follow the same trend as the sensing temperature. This means that the fluorescence would be dimmed in a lower-viscosity environment induced by an increase in temperature.
To assess whether the fluorescence of OTGs responds to changes in temperature, we employed a microscopic system that can generate a temperature gradient during observation, as reported in a previous study [15]. Specifically, an 808 nm NIR laser was used to illuminate the graphite flakes as a photothermal material with micro-size (98 μm2 on average), generating a temperature gradient across a few cells (Figure 1A) [24]. To estimate the temperature sensitivity of OTGs, HeLa cells were stained with ETG as representative OTGs together with ETY, where dual imaging could be performed due to the emission at different wavelengths in the FITC and Texas red channels (Figure 1B). When the shutter of the NIR laser was opened during microscopic observation, the FI of the ETG decreased, indicating that the FI of the ETG possessed temperature sensitivity, as mentioned above (Figure 1C). Additionally, the time course of FI exhibited a step-like pattern in ETG and ETY in each channel in response to NIR illumination, with deeper steps observed with increasing laser power (Figure 1D). Previously, we have prepared the calibration curve for the first temperature sensor, ER thermo yellow (ETY), using an NIR heating method [15]. Apart from that, using the conventional circulation chamber with the thermocouple thermometer, we varied the temperature in the dish and obtained the reproducible value of the temperature sensitivity, which is estimated to be 3.9%/°C. Therefore, ETY could be used as a robust reference fluorescence thermometer. In conjunction with ETY, we then evaluated the temperature sensitivity of ETG in HeLa cells. Firstly, the temperature at each region of interest (ROI) could be estimated from the depth of the step generated by the heating using ETY as a reference thermometer. In the other emission channel, the normalized FI of ETG at the same ROI could be obtained and plotted versus the temperature increment given by the calibration using ETY. Similarly, after analyzing the different depths of the steps at different ROIs in the repeated experiments, the normalized FI of ETG was plotted against varying temperature increments to generate the calibration curve (Supplementary Figure S2). This method could also be used to generate the calibration curves for other OTGs, as these organelles can be encircled by the same ROI at a subcellular scale, although the localization of ETY and the other OTGs was not exactly the same. The obtained curves tended to be negatively correlated in the range of 37 to 45 °C (Figure 1E). As reported in previous studies, while representative temperature-sensitive dyes are likely to show an exponential trend in sensitivity, the correlation between the FI of ETG and temperature could be fitted with negative linearity in the physiological temperature range (4.1%/°C) [25,26]. Similarly, based on the temperature increments analyzed with ETY as a reference thermometer in the other channel, the normalized FI of the other OTGs was plotted against the temperature increments (Figure 1F). The temperature sensitivity of Plasma Membrane Thermo Green (PTG), Nucleus Thermo Green (NTG), Mitochondria Thermo Green (MTG), Golgi Thermo Green (GTG), Lysosome Thermo Green (LTG), and Droplet Thermo Green (DTG) were measured to be 2.9, 1.4, 4.1, 3.9, 3.8, and 5.1%/°C, respectively (Figure 1G). Notably, the order of temperature sensitivity of the OTGs obtained from the FI-based analysis did not agree with that of the FLIM-based analysis in a previous study. The difference in sensitivity was assumed to be due to the microenvironment surrounding the OTG. In a previous study, it was shown that the FLIM-based sensitivity of PTG is higher than that of ETG, MTG, GTG, LTG, and DTG, which could be attributed to the distinct capacity of how much the membrane fluidity can be altered upon heating [16]. Plasma membranes constitute a liquid-ordered phase (Lo), whereas other intracellular membranes constitute a liquid-disordered phase (Ld). Indeed, the FRAP study showed that the lateral diffusion coefficient at the ER was greater than that at the plasma membrane, which is compatible with the characteristics of the membranes (Supplementary Figure S3A,B). Consequently, the viscosity change induced by a temperature increment (ΔT) of 1 °C in the plasma membrane is greater than in the others, leading to the greater temperature sensitivity of PTG compared to the other green dyes. Considering such a fluidity-dependent mechanism, as well as the relationship between lifetime and FI, it was expected that the order of the FI-based sensitivities would be similar; yet, the results were not consistent. As the discrepancy between the two sensitivities is yet to be explained, the underlying mechanism should be further investigated in the future.

3.2. Visualization of Temperature Gradient Induced with a Nano Heater

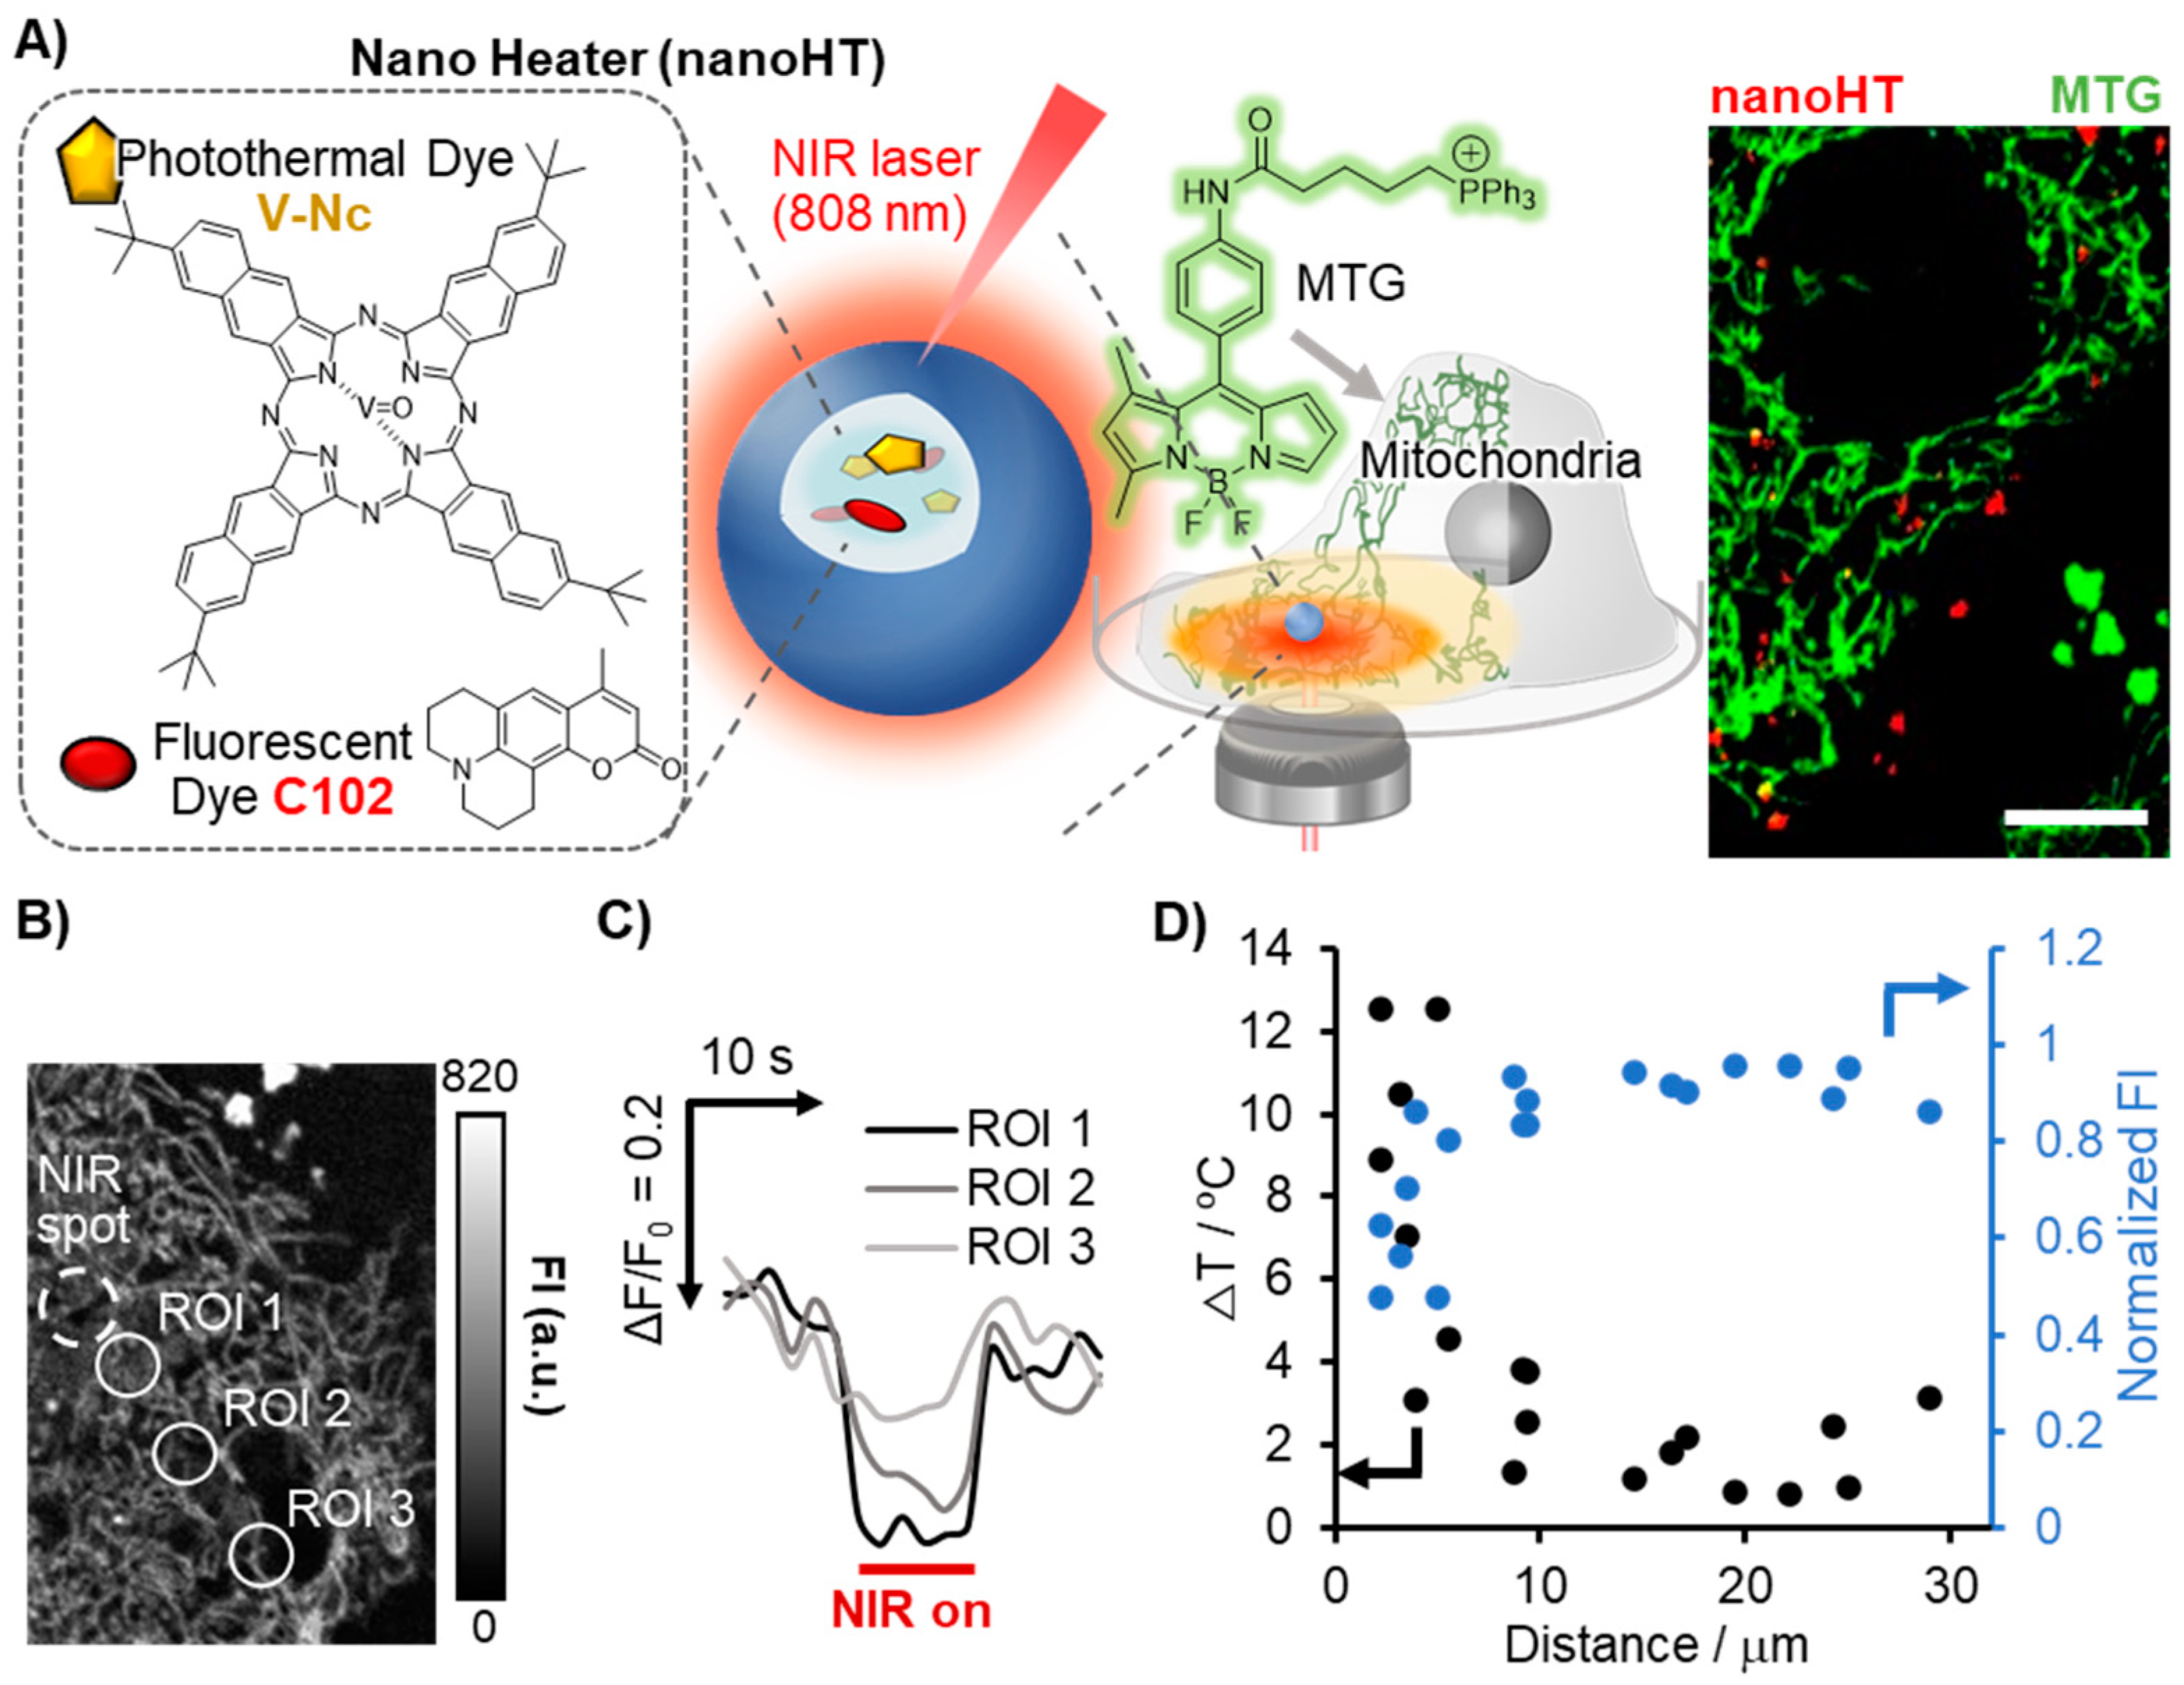
Recently, efforts to develop a myriad of nanoscale photothermal materials have been devoted to the light-operated modulation of cellular functions, including clinical applications such as photothermal therapy [27]. In order to achieve effective treatment with photothermal heating, it is important to comprehend how the spatial distribution of heat is provided by a photothermal material and which cellular components feel temperature increments. A series of OTGs are essential microscopic tools in this research field. Therefore, we examined OTGs in the visualization of the intracellular temperature gradient by internal heating using nanosized photothermal particles. For this purpose, we employed a polymeric nanoparticle containing a naphthalocyanine vanadium oxide complex as a photothermal dye that converts NIR light into heat, named nano heater (nanoHT) in a previous study [28]. In this experiment, nanoHT was prepared without europium(III)-tris(dinaphthoylmethane)-bis-trioctylphosphine oxide complex (EuDT) as a temperature-sensitive dye, although the original nanoHT contains EuDT for fluorescence thermometry at the heat spot (Figure 2A). This is because we only need the heating function at the subcellular scale. Compared to graphite flakes, nanoHT is expected to generate a steep temperature gradient at the subcellular level by 808 nm NIR laser stimulation. Given that mitochondrial function is a target for effective photothermal therapy, MTG was chosen for subsequent experiments. After the uptake of nanoHT into the cell via the endocytosis pathway, nanoHT was surrounded by dense mitochondrial networks, as supported by MTG staining (Figure 2A). When nanoHT was illuminated with an NIR laser for 10 s, the FI of the MTG at an ROI located at a certain distance from the heat spot showed a step-like pattern (Figure 2B,C). Moreover, the depth of the step decreased with increasing distance from the NIR spot, indicating a steep gradient at the single-cell level (Figure 2D). When the normalized FI was converted into a temperature increment using the calibration curve, we found that an approximately 10 °C gap exists within the 10 μm range. Notably, the nucleus and plasma membrane exhibited reversible step-like responses as long as the temperature gradient reached the target location (Supplementary Figure S4).
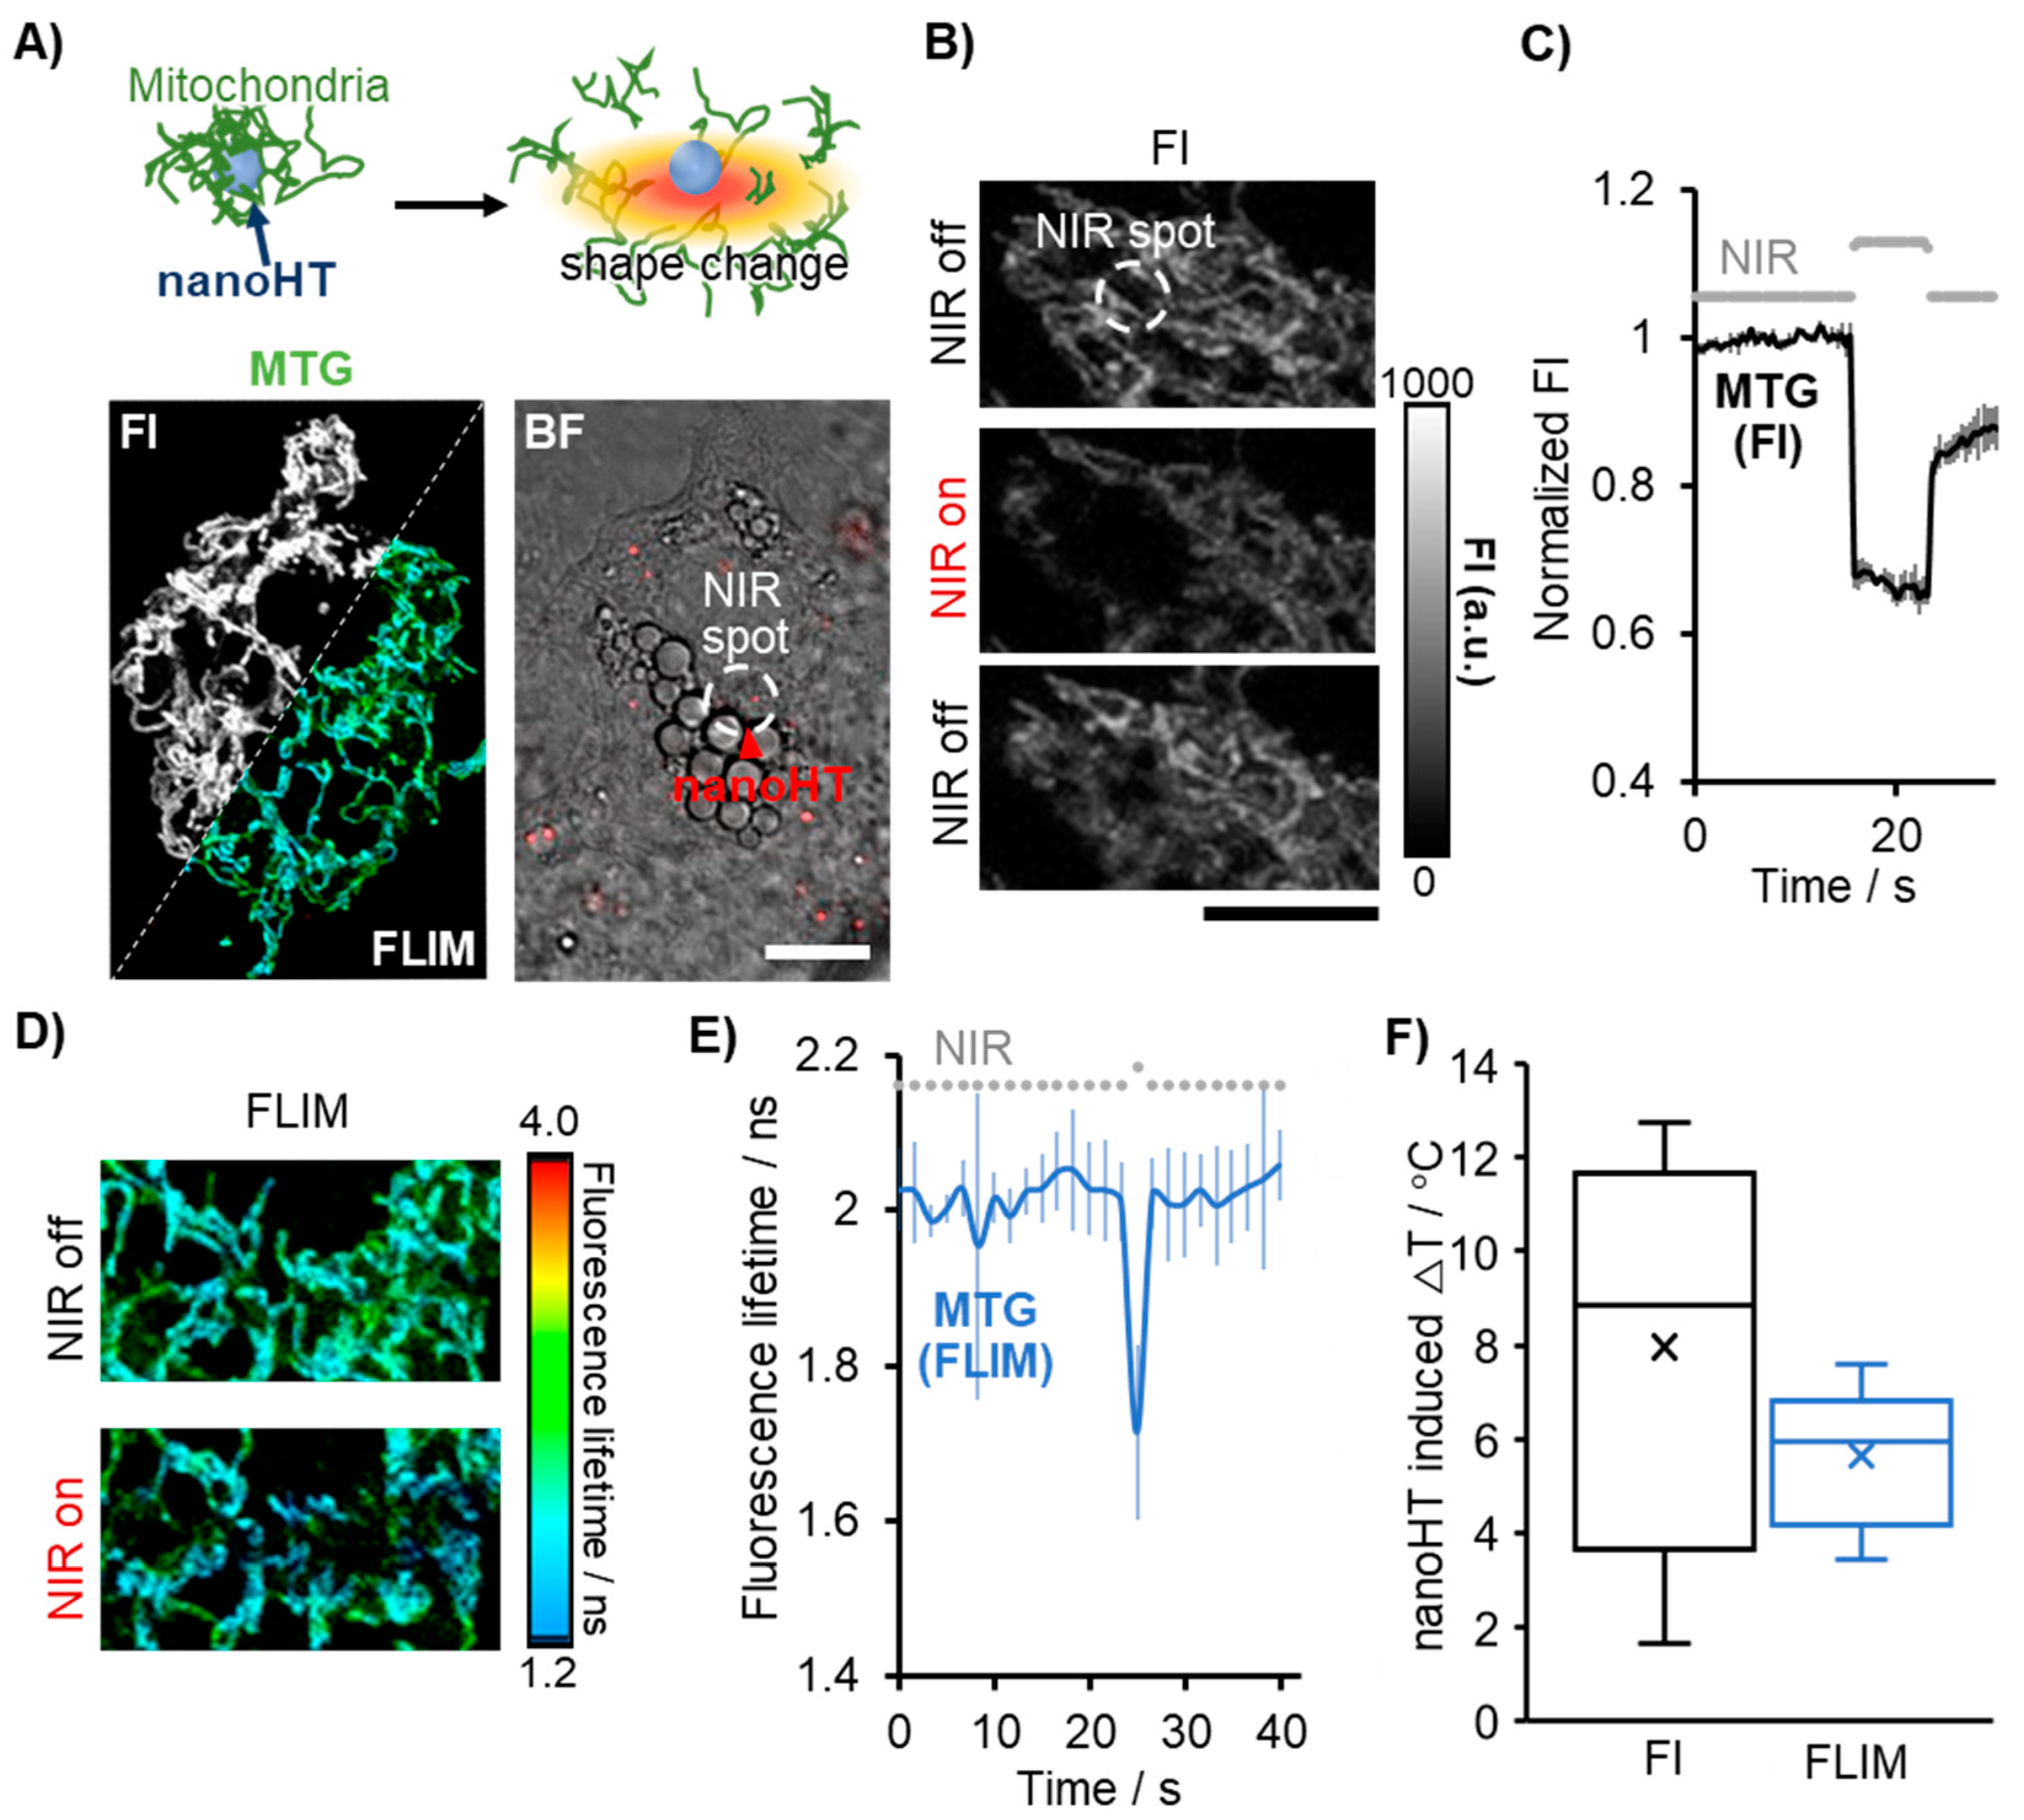
Importantly, we also found that when mitochondria feel the harsh temperature increment in proximity to nanoHT, their shape appears to physically change due to heat stress, or their position appears to shift out of the focal plane (Figure 3A). In addition, the harsh temperature increase would cause MTG to leak out of the mitochondria because heat stress causes the loss of mitochondrial membrane potential due to the aggregation of mitochondrial proteins [29]. Therefore, these elements affecting the FI-based analysis may lead to irreversible changes in the FI of MTG as shown in Figure 3C. However, even in such cases, the FLIM-based analysis showed reversible responses upon heating (Figure 3D,E), suggesting quantitative thermometry with smaller measurement errors than FI-based thermometry (Figure 3F). Because of the merit of the fluorescence lifetime, shape changes in mitochondria or leakage of the thermometer from mitochondria can be negligible for FLIM-based analysis. In contrast, whenever an irreversible step pattern is observed during photothermal heating, the accuracy of FI-based thermometry should be considered.

3.3. Comparison between FI- and FLIM-Based Thermometry in Brown Adipocytes

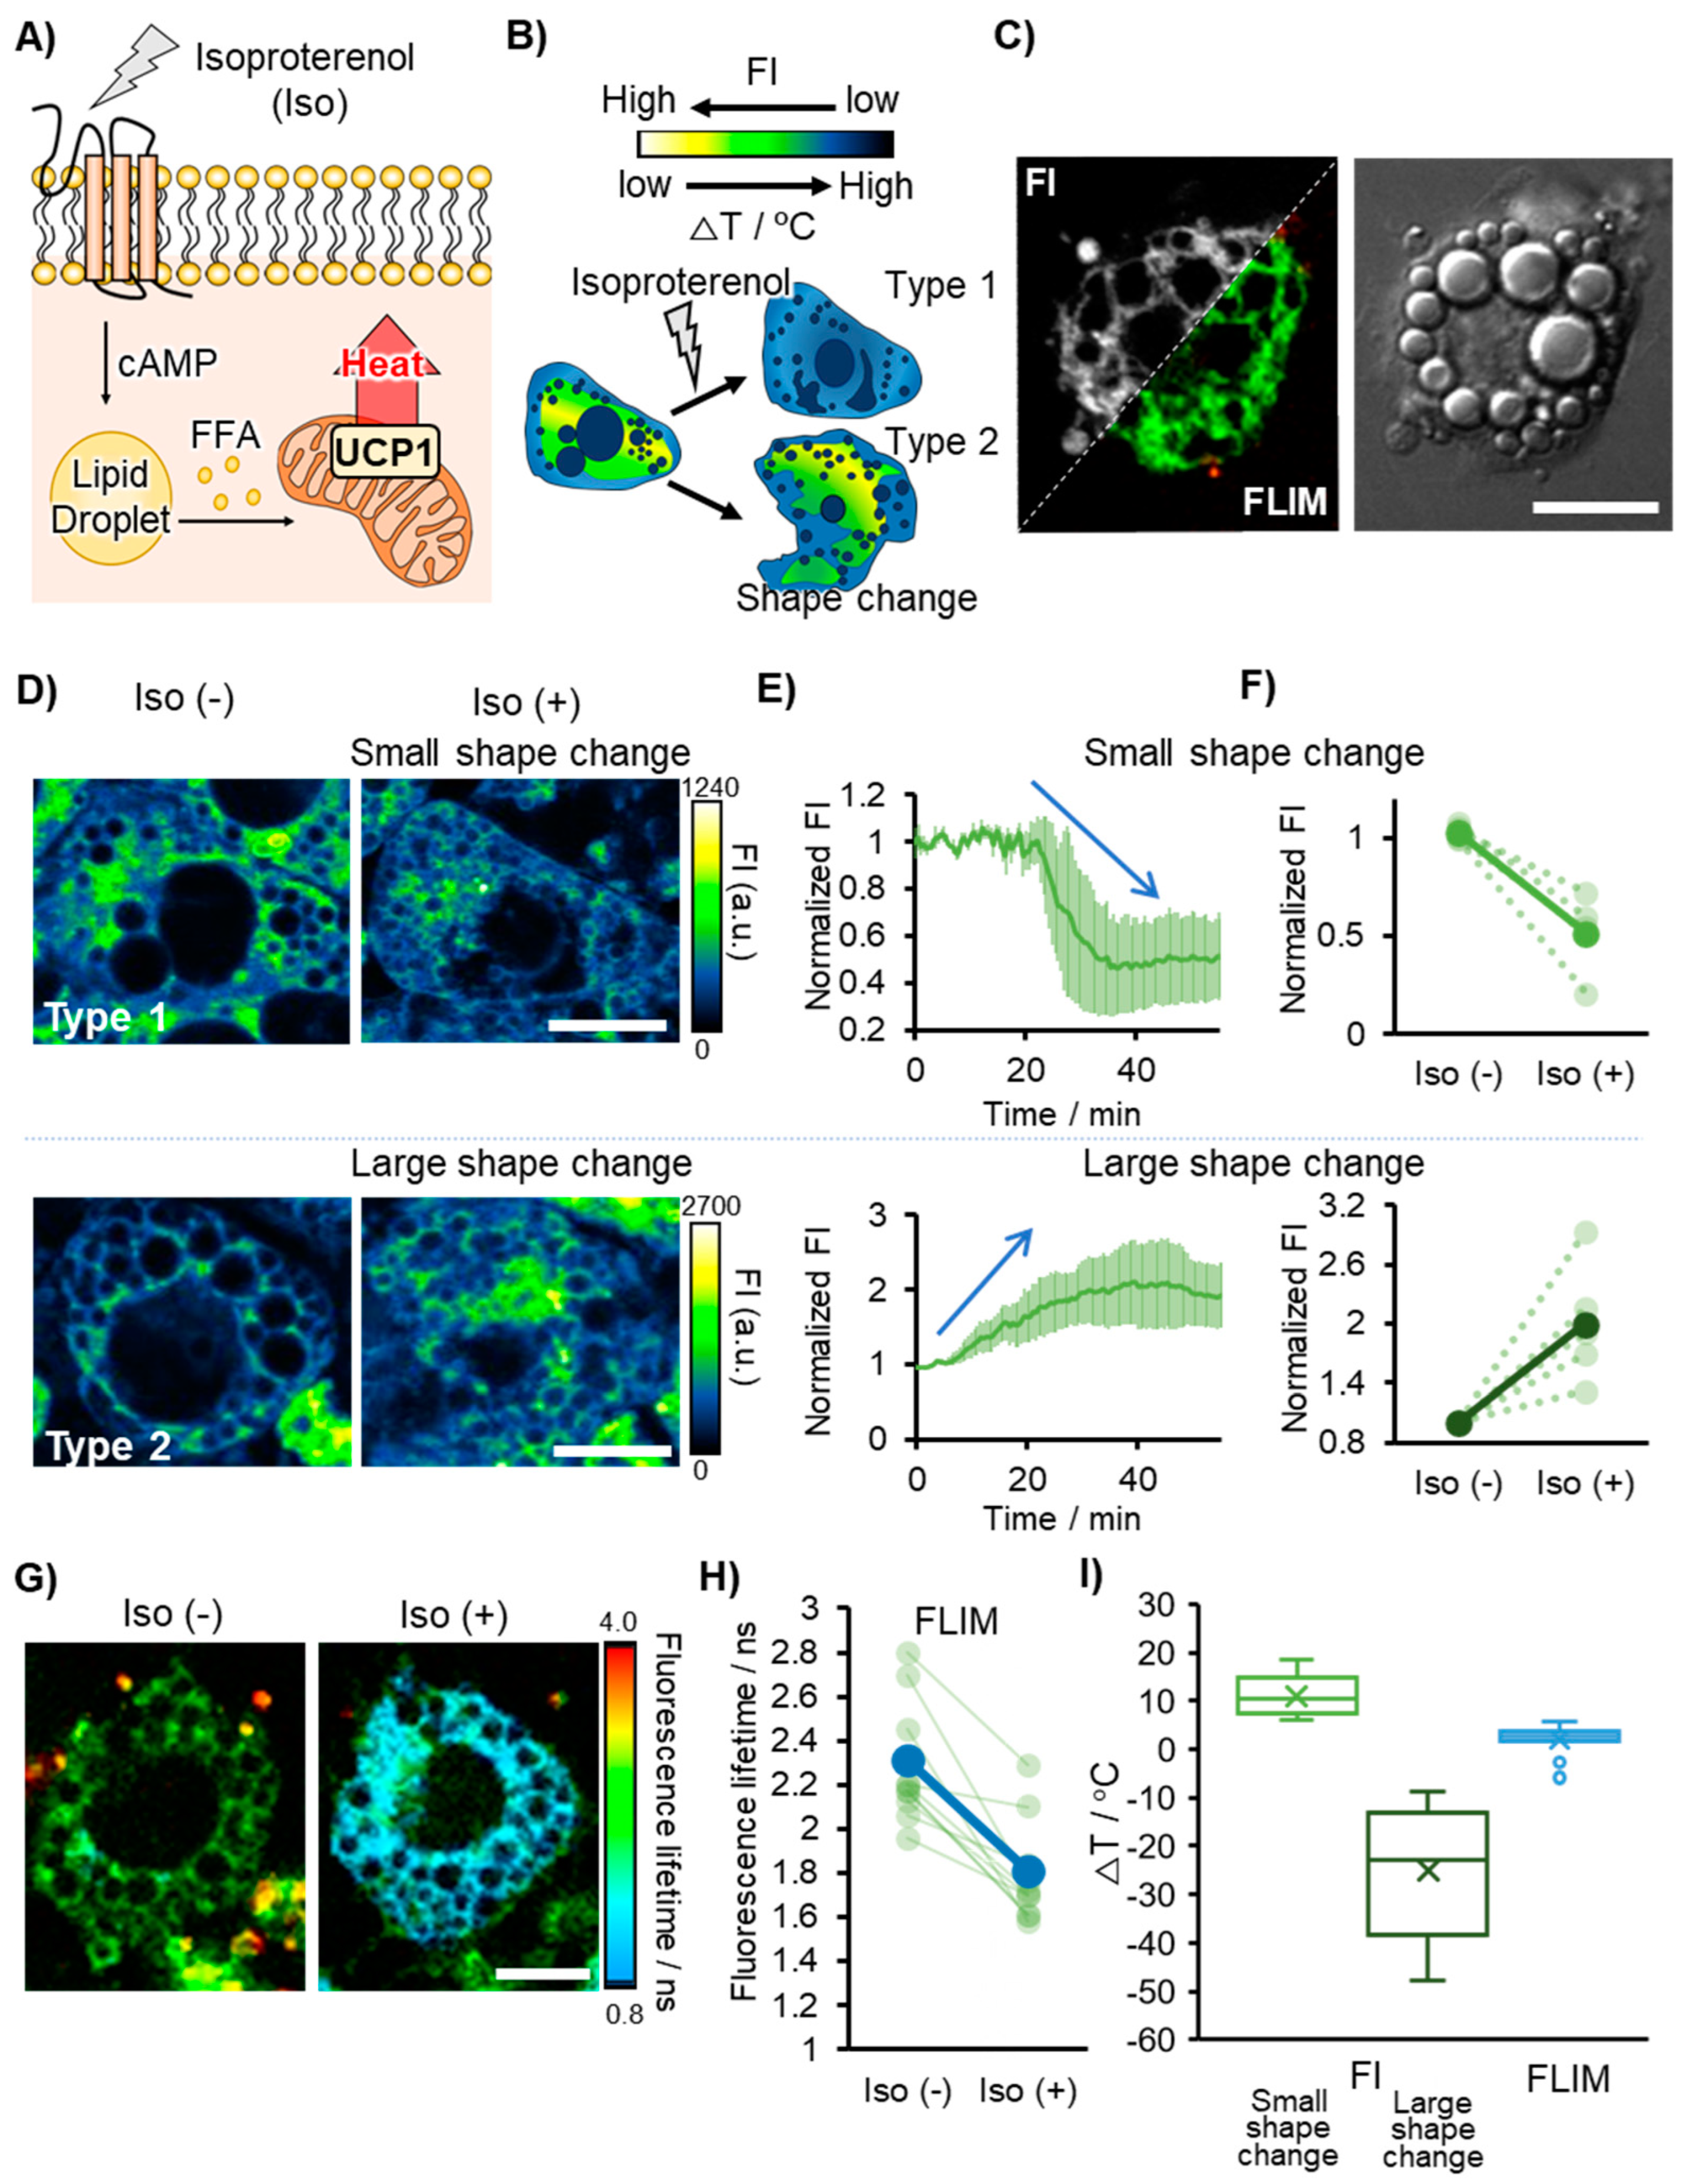
Finally, we imaged physiological heat production in brown adipocytes. Brown adipocytes have dense mitochondria that express uncoupler protein 1 (UCP1) to maintain body temperature in cold environments [30]. To induce thermogenesis in brown adipocytes, cells were treated with isoproterenol (Iso), which triggers β-adrenergic signaling. Firstly, Iso is taken up by the receptor, which increases the level of cyclic adenosine monophosphate (cAMP). Subsequently, cAMP activates protein kinase A and then induces the release of free fatty acids (FFAs) from lipid droplets. FFAs uncouple the mitochondrial respiratory chain via UCP1, resulting in mitochondrial heat production (Figure 4A). In a previous report, FLIM-based thermometry using MTG showed a temperature increase of a few degrees in the mitochondria. We also observed a change in the shape of brown adipocytes during thermogenesis in some populations (Figure 4B) [16]. As mentioned in the previous section, FI-based analysis is strongly influenced by the concentration of the fluorophore and changes in the morphology of the samples. Therefore, this demonstration is a suitable example for discussing the accuracy of FI- and FLIM-based thermometry.
Using the MTG, we performed FI- and FLIM-based mitochondrial thermometry to monitor the thermogenesis of brown adipocytes in real time (Figure 4C). In the case of FI-based thermometry, the FI in the MTG after stimulation with isoproterenol decreased in some brown adipocytes and increased in others (Figure 4D,E). We defined the criteria for whether the morphological change was significant based on the analysis of the change in the nucleus shape. The area of the nucleus in brown adipocytes was analyzed before and after treatment with isoproterenol, and a “large” change was defined as when its ratio of the area was less than 0.1, while the other cases were defined as “small” changes (Supplementary Figure S5). A more detailed analysis indicated that the normalized FI of the MTG decreased when less shape change occurred after thermogenesis. In contrast, the FI in the MTG increased when the shape changed drastically after thermogenesis (Figure 4F). Furthermore, the fluorescence lifetime of MTG showed a decreasing trend in any case, regardless of shape changes (2.3 to 1.8 ns on average) (Figure 4G,H). The data obtained from both types of thermometry were converted into temperature increments. The temperature change from FI was estimated to be 11.6 °C in cells with less shape change and −24.8 °C with a drastic shape change. Notably, the temperature increment obtained from FLIM-based thermometry was estimated to be 2.5 °C, which is in good agreement with the findings of a previous study (Figure 4I) [16].
Although not surprising, it was clear that the drastic change in cell morphology was misleading in FI-based thermometry. Although the intracellular temperature remains controversial, a cooling event as low as −24.8 °C, namely ectothermic reactions occurring in mitochondria, would not be a realistic consideration [31]. Even if the cellular shape was not changed apparently, there was a critical gap in the estimated temperature, approximately +8 °C (FI: 11.6 °C, FLIM: 2.5 °C), between FI- and FLIM-based thermometry. This is because MTG contains a triphenylphosphonium moiety as a lipophilic cation for targeting mitochondria, and its uptake depends on the mitochondrial membrane potential [32,33]. Because heat production is accompanied by depolarization of the mitochondrial membrane by the uncoupling of the mitochondrial respiratory chain, MTG is likely to leak into the cytosol [34]. That led to the overestimation of the chance in FI including the effect of the leakage of MTG and reached approximately +10 °C. Therefore, there is no doubt that FLIM-based analysis provides more quantitative and reproducible data than FI-based analysis. Additionally, the cellular morphology and retention of OTG in organelles should be considered when using the OTG series for FI-based thermometry. Notably, unless it is not applied in the case of a critical morphological change, the thermal event can be discussed qualitatively and not quantitatively. For example, FI-based thermometry qualitatively identifies cell types with upregulated thermogenic functions [35]. It should also be noted that ER thermometry, regardless of FI- and FLIM-based analyses, would provide reliable data because heat production at the ER in skeletal muscle is scarcely involved in the shape change of cells and organelles and leakage of the dye from the ER.

4. Conclusions

In this study, we demonstrated an OTG using FI- and FLIM-based thermometry for artificial photothermal heating and physiological thermogenesis (the result is summarized in Supplementary Figure S6). It was confirmed that robust FLIM-based thermometry provided quantitative and reproducible data. In particular, the thermometry in brown adipocytes was repeated independently, showing results that were largely similar to those reported in previous studies. We then assessed the morphological changes in organelles and cells and found that the leakage of OTG from the target organelle was a critical element in the FI-based analysis. In other words, as long as these factors are considered, FI-based thermometry using an OTG would be a feasible approach. Even in problematic cases, it has been suggested that an internal reference dye be used to correct morphological changes. For instance, organelle trackers, which are insensitive to temperature, can be used in such applications to correct the artifact that FI-based analysis suffers from. For a future perspective of temperature sensor development, the drastic improvement of the sensitivity (%/°C), called dynamic range, will be essential, which makes the artifact negligible. Furthermore, it will also include the development of a “turn-on”-type sensor with a positive correlation between the temperature and FI.

Supplementary Materials

The following supporting information can be downloaded at: https://www.mdpi.com/article/10.3390/chemosensors11070375/s1. Figure S1. Relationship between fluorescence intensity (FI) of ER Thermo Green (ETG) and viscosity. The normalized fluorescence intensity (FI) at 512 nm was plotted against viscosity. Viscosity was varied from 17 to 529 cP by preparing mixtures of glycerol and ethylene glycol at different volume ratios. Figure S2. How to evaluate the temperature sensitivity of OTGs. (1) Temperature increment (ΔT) was estimated from the step depth in the normalized FI of ETY (F/F0) when a graphite flake was illuminated with an NIR laser. (2) The experiment of 1 was repeated to investigate the relationship between normalized FI (F/F0) of ETG and ΔT. F/F0 was plotted against ΔT to obtain the calibration curve and the temperature sensitivity of ETG. Figure S3. Lateral diffusion of Organelle Thermo Greens (OTGs) analyzed by fluorescence recovery after photobleaching (FRAP). A) Fluorescence images of ETG, PTG, NTG, and DTG in the FRAP experiments. Scale bar: 10 μm. (B) Normalized fluorescence intensities (FIs) of ETG, PTG, NTG, and DTG were plotted against time, showing the recovery of fluorescence intensity after the bleaching. Figure S4. Step-like response of the fluorescence intensity of PTG, NTG, and DTG after photothermal heating using a nanoheater (nanoHT). The step-like responses of the normalized FIs of the PTG, NTG, and DTG were plotted. Images with negligible photobleaching were selected for analyzing the step-like responses. Figure S5. Definition of induced shape change in brown adipocytes after stimulation. The nuclear area in brown adipocytes was evaluated before and after treatment with isoproterenol, after which a “large” shape change was defined when its ratio of the area was less than 0.1 and the others as “small” shape changes. The nuclear area was measured using ImageJ software. Figure S6. Pros and cons in fluorescence intensity-based and fluorescence lifetime-based thermometry.

Author Contributions

Conceptualization, T.Y., X.L., Y.-T.C. and S.A.; methodology, T.Y., X.L. and S.A.; software, T.Y.; validation, T.Y.; formal analysis, T.Y.; data curation, T.Y.; writing, T.Y. and S.A.; supervision, Y.-T.C. and S.A. All authors have read and agreed to the published version of the manuscript.

Funding

This research was financially supported by the World Premier International Research Center Initiative (WPI), the Basic Science Research Institute Fund (NRF 2021R1A6A1A10042944, to Y.-T.C.), the National Research Foundation of Korea (NRF) grant funded by the Korea government (MSIT) (2023R1A2C300453411, to Y.-T.C.), the Institute for Basic Science (IBS-R007-A1, to Y.-T.C.), the JST FOREST Program (JPMJFR201E, Japan, to S.A.), The Murata Science Foundation (to S.A.), the KAKENHI Program of the Japan Society for the Promotion of Science (JP19H02750, to S.A.), and JST SPRING (JPMJSP2135, Japan, to T.Y.).

Institutional Review Board Statement

Not applicable.

Informed Consent Statement

Not applicable.

Data Availability Statement

Data will be shared upon reasonable request.

Acknowledgments

We thank Yu-Hua Tseng (Joslin Diabetes Center/Harvard Medical School, Boston, MA, USA) for providing WT-1 cells.

Conflicts of Interest

The authors declare no conflict of interest.

References

  1. Deguchi, T.; Itoh, M.; Urawa, H.; Matsumoto, T.; Nakayama, S.; Kawasaki, T.; Kitano, T.; Oda, S.; Mitani, H.; Takahashi, T.; et al. Infrared laser-mediated local gene induction in medaka, zebrafish and Arabidopsis thaliana. Dev. Growth Differ. 2009, 51, 769–775. [Google Scholar] [CrossRef]
  2. Harding, R.L.; Halevy, O.; Yahav, S.; Velleman, S.G. The effect of temperature on proliferation and differentiation of chicken skeletal muscle satellite cells isolated from different muscle types. Physiol. Rep. 2016, 4, e12770. [Google Scholar] [CrossRef] [PubMed] [Green Version]
  3. Gillooly, J.F.; Brown, J.H.; West, G.B.; Savage, V.M.; Charnov, E.L. Effects of size and temperature on metabolic rate. Science 2001, 293, 2248–2251. [Google Scholar] [CrossRef] [PubMed] [Green Version]
  4. Kushimoto, S.; Yamanouchi, S.; Endo, T.; Sato, T.; Nomura, R.; Fujita, M.; Kudo, D.; Omura, T.; Miyagawa, N.; Sato, T. Body temperature abnormalities in non-neurological critically ill patients: A review of the literature. J. Intensive Care 2014, 2, 14. [Google Scholar] [CrossRef] [PubMed] [Green Version]
  5. Karnebogen, M.; Singer, D.; Kallerhoff, M.; Ringert, R.H. Microcalorimetric investigations on isolated tumorous and non-tumorous tissue samples. Thermochim. Acta 1993, 229, 147–155. [Google Scholar] [CrossRef]
  6. Okabe, K.; Sakaguchi, R.; Shi, B.; Kiyonaka, S. Intracellular thermometry with fluorescent sensors for thermal biology. Pflug. Arch. Eur. J. Physiol. 2018, 470, 717–731. [Google Scholar] [CrossRef] [PubMed]
  7. Zhou, J.; del Rosal, B.; Jaque, D.; Uchiyama, S.; Jin, D. Advances and challenges for fluorescence nanothermometry. Nat. Methods 2020, 17, 967–980. [Google Scholar] [CrossRef] [PubMed]
  8. Bai, T.; Gu, N. Micro/nanoscale thermometry for cellular thermal sensing. Small 2016, 12, 4590–4610. [Google Scholar] [CrossRef] [PubMed]
  9. Ogle, M.M.; McWilliams, A.D.S.; Jiang, B.; Martí, A.A. Latest Trends in Temperature Sensing by Molecular Probes. ChemPhotoChem 2020, 4, 255–270. [Google Scholar] [CrossRef]
  10. Okabe, K.; Inada, N.; Gota, C.; Harada, Y.; Funatsu, T.; Uchiyama, S. Intracellular temperature mapping with a fluorescent polymeric thermometer and fluorescence lifetime imaging microscopy. Nat. Commun. 2012, 3, 705. [Google Scholar] [CrossRef] [Green Version]
  11. Gao, H.; Kam, C.; Chou, T.Y.; Wu, M.Y.; Zhao, X.; Chen, S. A simple yet effective AIE-based fluorescent nano-thermometer for temperature mapping in living cells using fluorescence lifetime imaging microscopy. Nanoscale Horiz. 2020, 5, 488–494. [Google Scholar] [CrossRef] [PubMed] [Green Version]
  12. Wang, Y.; Zhao, Q.; Liang, S.; Mei, M.; She, G.; Shi, W.; Mu, L. Single nanowire-based fluorescence lifetime thermometer for simultaneous measurement of intra- and extracellular temperature. Chem. Commun. 2023, 59, 4483–4486. [Google Scholar] [CrossRef] [PubMed]
  13. Chihara, T.; Umezawa, M.; Miyata, K.; Sekiyama, S.; Hosokawa, N.; Okubo, K.; Kamimura, M.; Soga, K. Biological Deep Temperature Imaging with Fluorescence Lifetime of Rare-Earth-Doped Ceramics Particles in the Second NIR Biological Window. Sci. Rep. 2019, 9, 12806. [Google Scholar] [CrossRef] [PubMed] [Green Version]
  14. Vyšniauskas, A.; Cornell, B.; Sherin, P.S.; Maleckaitė, K.; Kubánková, M.; Izquierdo, M.A.; Vu, T.T.; Volkova, Y.A.; Budynina, E.M.; Molteni, C.; et al. Cyclopropyl Substituents Transform the Viscosity-Sensitive BODIPY Molecular Rotor into a Temperature Sensor. ACS Sens. 2021, 6, 2158–2167. [Google Scholar] [CrossRef]
  15. Arai, S.; Lee, S.C.; Zhai, D.; Suzuki, M.; Chang, Y.T. A molecular fluorescent probe for targeted visualization of temperature at the endoplasmic reticulum. Sci. Rep. 2014, 4, 6701. [Google Scholar] [CrossRef] [Green Version]
  16. Liu, X.; Yamazaki, T.; Kwon, H.Y.; Arai, S.; Chang, Y.T. A palette of site-specific organelle fluorescent thermometers. Mater. Today Bio. 2022, 16, 100405. [Google Scholar] [CrossRef]
  17. Reed, B.C.; Lane, M.D. Insulin receptor synthesis and turnover in differentiating 3T3-L1 preadipocytes. Proc. Natl. Acad. Sci. USA 1980, 77, 285–289. [Google Scholar] [CrossRef]
  18. Tseng, Y.H.; Kokkotou, E.; Schulz, T.J.; Huang, T.L.; Winnay, J.N.; Taniguchi, C.M.; Tran, T.T.; Suzuki, R.; Espinoza, D.O.; Yamamoto, Y.; et al. New role of bone morphogenetic protein 7 in brown adipogenesis and energy expenditure. Nature 2008, 454, 1000–1004. [Google Scholar] [CrossRef]
  19. Miao, W.; Yu, C.; Hao, E.; Jiao, L. Functionalized BODIPYs as Fluorescent Molecular Rotors for Viscosity Detection. Front. Chem. 2019, 7, 825. [Google Scholar] [CrossRef] [Green Version]
  20. Vyšniauskas, A.; Kuimova, M.K. A twisted tale: Measuring viscosity and temperature of microenvironments using molecular rotors. Int. Rev. Phys. Chem. 2018, 37, 259–285. [Google Scholar] [CrossRef]
  21. Liu, X.; Chi, W.; Qiao, Q.; Kokate, S.V.; Cabrera, E.P.; Xu, Z.; Liu, X.; Chang, Y.T. Molecular Mechanism of Viscosity Sensitivity in BODIPY Rotors and Application to Motion-Based Fluorescent Sensors. ACS Sens. 2020, 5, 731–739. [Google Scholar] [CrossRef] [PubMed]
  22. Kuimova, M.K.; Yahioglu, G.; Levitt, J.A.; Suhling, K. Molecular rotor measures viscosity of live cells via fluorescence lifetime imaging. J. Am. Chem. Soc. 2008, 130, 6672–6673. [Google Scholar] [CrossRef] [PubMed] [Green Version]
  23. Liu, X.; Chi, W.; de J Gómez-Infante, A.; Peña-Cabrera, E.; Liu, X.; Chang, Y.T. A Systematic Study on the Relationship between Viscosity Sensitivity and Temperature Dependency of BODIPY Rotors. Bull. Korean Chem. Soc. 2021, 42, 91–94. [Google Scholar] [CrossRef]
  24. Savchuk, O.A.; Carvajal, J.J.; Massons, J.; Aguiló, M.; Díaz, F. Determination of photothermal conversion efficiency of graphene and graphene oxide through an integrating sphere method. Carbon 2016, 103, 134–141. [Google Scholar] [CrossRef]
  25. Arata, H.F.; Löw, P.; Ishizuka, K.; Bergaud, C.; Kim, B.; Noji, H.; Fujita, H. Temperature distribution measurement on microfabricated thermodevice for single biomolecular observation using fluorescent dye. Sens. Actuators B Chem. 2006, 117, 339–345. [Google Scholar] [CrossRef] [Green Version]
  26. Nardo, L.; Lamperti, M.; Salerno, D.; Cassina, V.; Missana, N.; Bondani, M.; Tempestini, A.; Mantegazza, F. Effects of non-CpG site methylation on DNA thermal stability: A fluorescence study. Nucleic Acids Res. 2015, 43, 10722–10733. [Google Scholar] [CrossRef] [Green Version]
  27. Jung, H.S.; Verwilst, P.; Sharma, A.; Shin, J.; Sessler, J.L.; Kim, J.S. Organic molecule-based photothermal agents: An expanding photothermal therapy universe. Chem. Soc. Rev. 2018, 47, 2280–2297. [Google Scholar] [CrossRef]
  28. Ferdinandus, M.; Suzuki, C.Q.; Vu, Y.; Harada, S.R.; Sarker, S.; Ishiwata, T.; Kitaguchi, S. Arai, Modulation of Local Cellular Activities using a Photothermal Dye-Based Subcellular-Sized Heat Spot. ACS Nano 2022, 16, 9004–9018. [Google Scholar] [CrossRef]
  29. Wilkening, A.; Rüb, C.; Sylvester, M.; Voos, W. Analysis of heat-induced protein aggregation in human mitochondria. J. Biol. Chem. 2018, 293, 11537–11552. [Google Scholar] [CrossRef] [Green Version]
  30. AShinde, B.; Song, A.; Wang, Q.A. Brown Adipose Tissue Heterogeneity, Energy Metabolism, and Beyond. Front. Endocrinol. 2021, 12, 651763. [Google Scholar] [CrossRef]
  31. Baffou, G.; Rigneault, H.; Marguet, D.; Jullien, L. A critique of methods for temperature imaging in single cells. Nat. Methods 2014, 11, 899–901. [Google Scholar] [CrossRef] [PubMed]
  32. Smith, R.A.J.; Hartley, R.C.; Cochemé, H.M.; Murphy, M.P. Mitochondrial pharmacology. Trends Pharmacol. Sci. 2012, 33, 341–352. [Google Scholar] [CrossRef] [PubMed] [Green Version]
  33. Kulkarni, C.A.; Fink, B.D.; Gibbs, B.E.; Chheda, P.R.; Wu, M.; Sivitz, W.I.; Kerns, R.J. A Novel Triphenylphosphonium Carrier to Target Mitochondria without Uncoupling Oxidative Phosphorylation. J. Med. Chem. 2021, 64, 662–676. [Google Scholar] [CrossRef] [PubMed]
  34. Samanta, S.; He, Y.; Sharma, A.; Kim, J.; Pan, W.; Yang, Z.; Li, J.; Yan, W.; Liu, L.; Qu, J.; et al. Fluorescent Probes for Nanoscopic Imaging of Mitochondria. Chem 2019, 5, 1697–1726. [Google Scholar] [CrossRef]
  35. Meizoso-Huesca, A.; Pearce, L.; Barclay, C.J.; Launikonis, B.S. Ca2+ leak through ryanodine receptor 1 regulates thermogenesis in resting skeletal muscle. Proc. Natl. Acad. Sci. USA 2022, 119, e2119203119. [Google Scholar] [CrossRef]
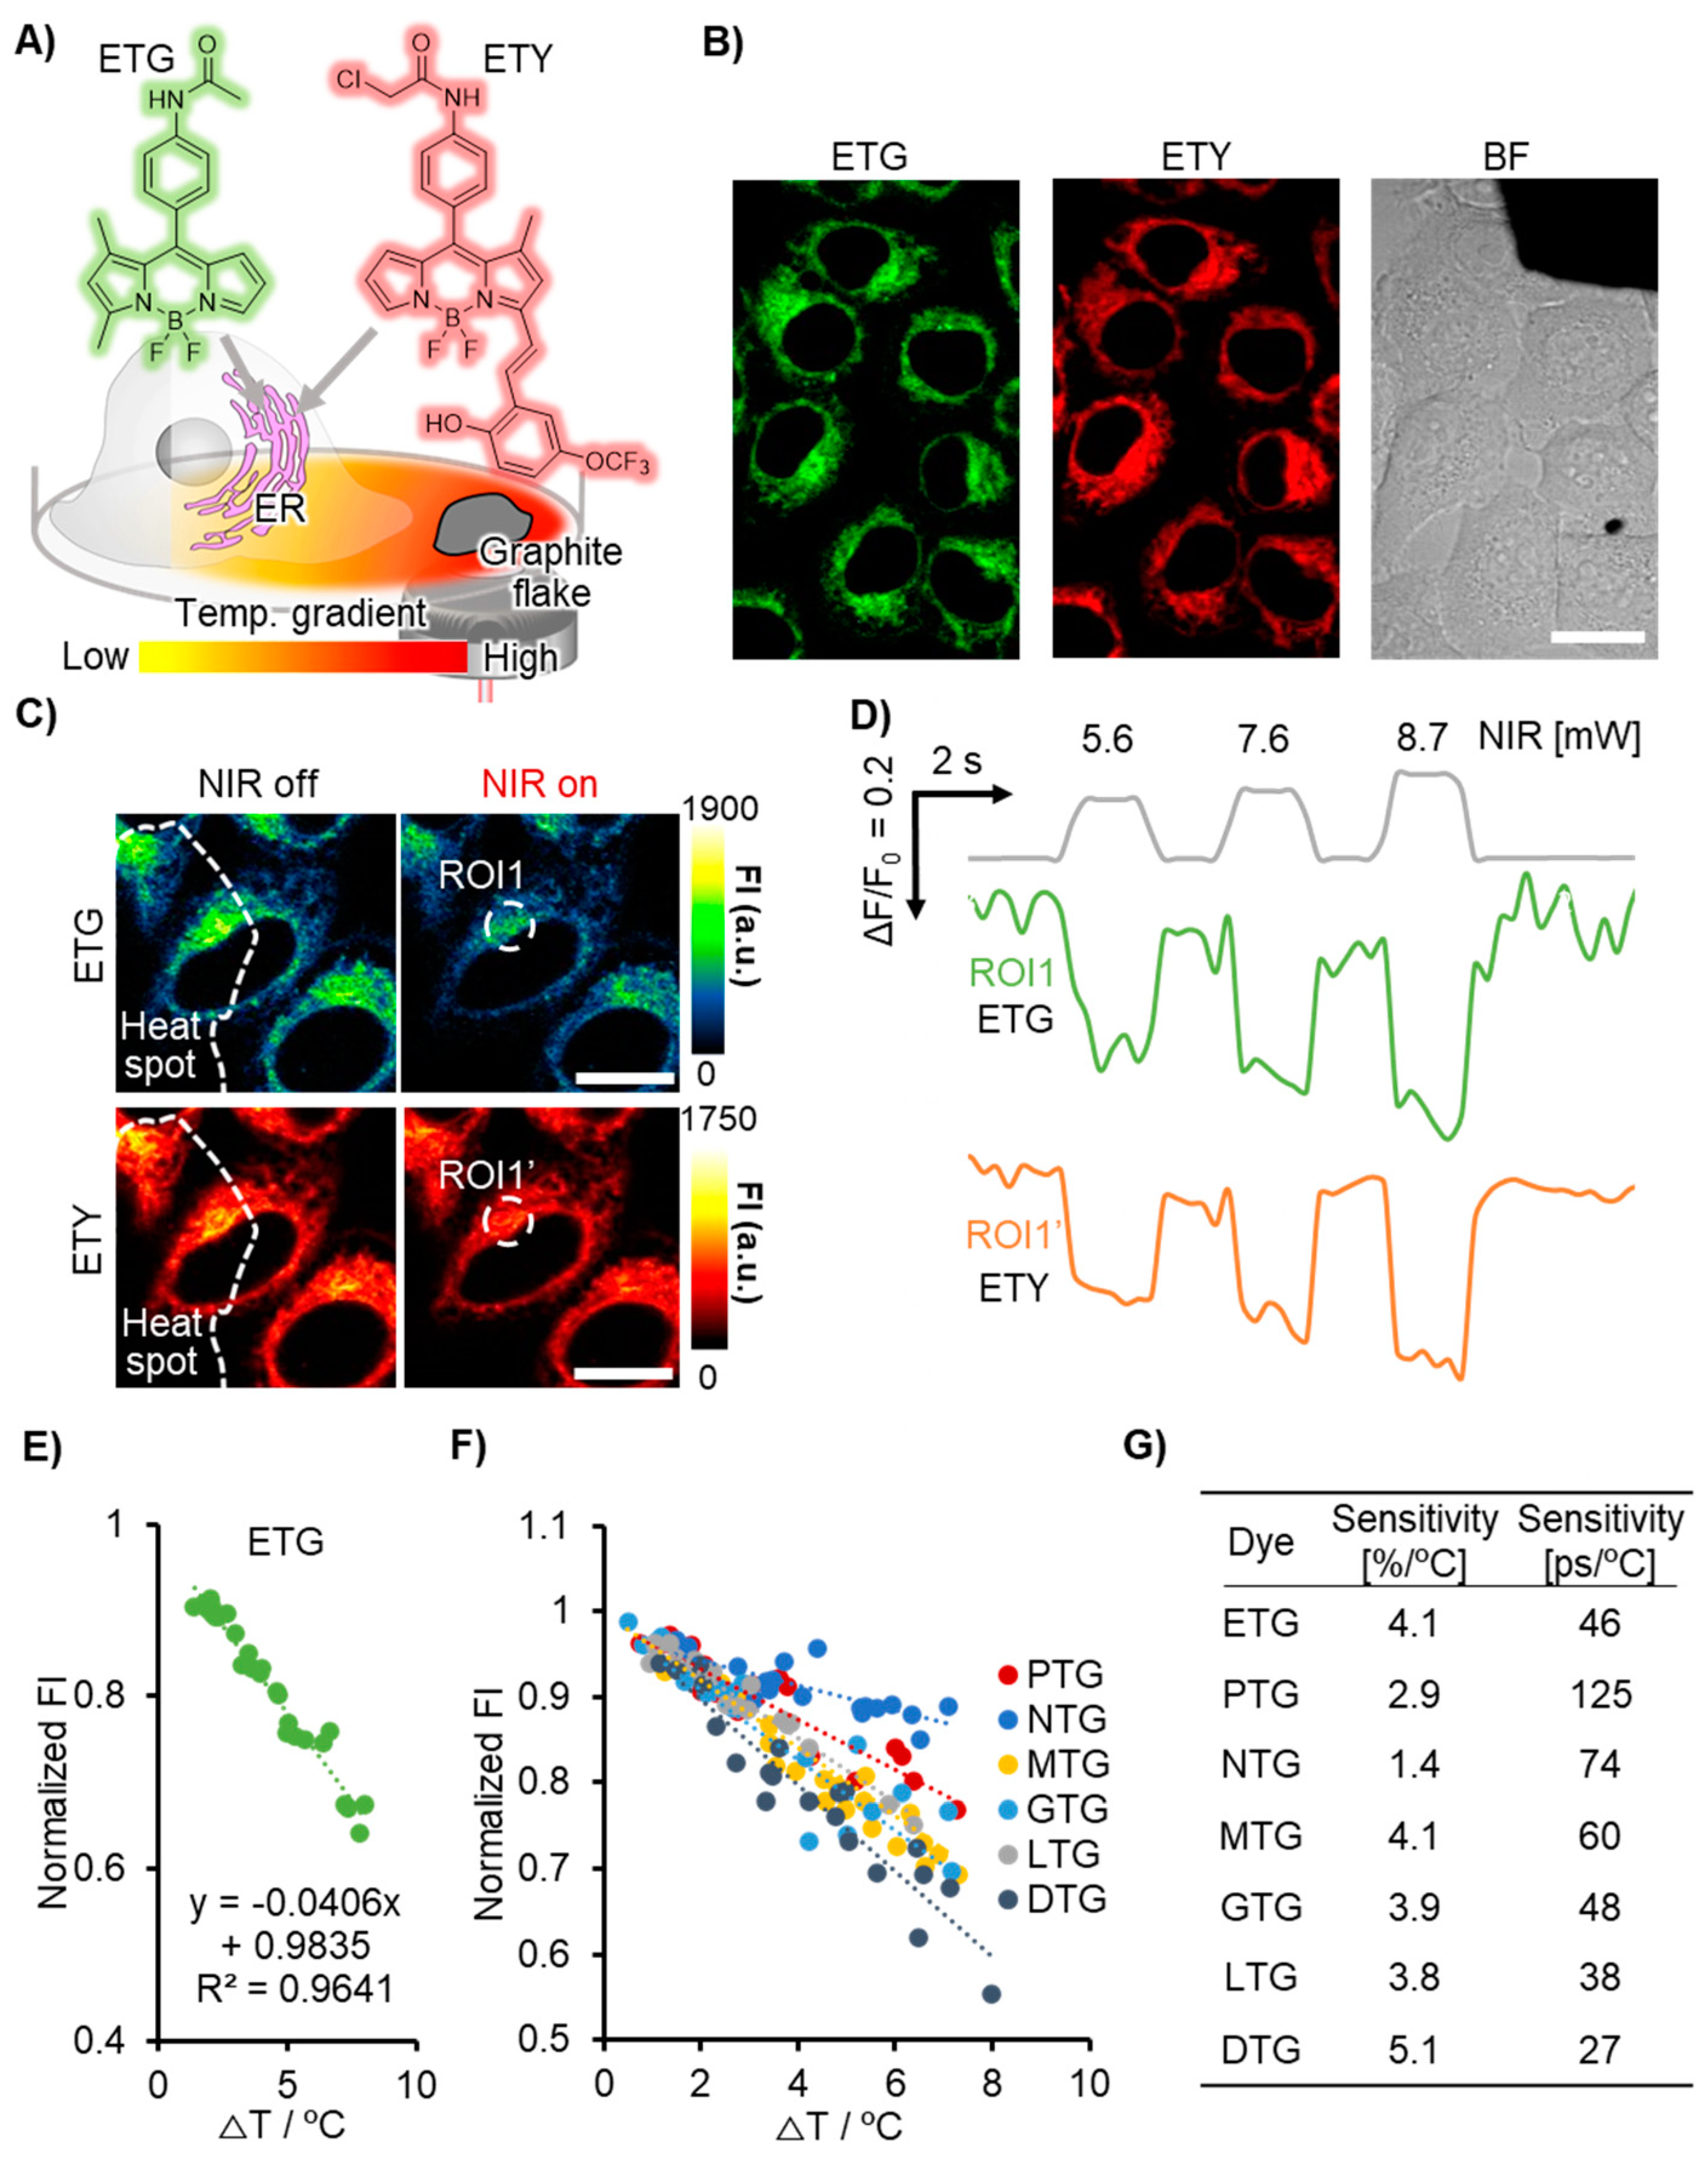
Figure 1. Temperature sensitivity in the fluorescence intensity of Organelle Thermo Greens (OTGs). (A) Schematic image of the microscopic set-up. HeLa cells were stained with endoplasmic reticulum (ER) Thermo Green (ETG) and ER Thermo Yellow (ETY). A graphite flake was illuminated with an 808 nm NIR laser to create temperature gradient at microscopic scale. (B) Fluorescence images of ETG and ETY with bright field (BF) image in HeLa cells. Scale bar: 20 μm. (C,D) Step-like responses of fluorescence intensity (FI) of ETG and ETY in HeLa cells when subjected to photothermal heating. Scale bar: 10 μm. (E) Calibration curve (normalized FI vs. DT) of ETG in HeLa cells. For normalization of FI, the FI at each timepoint was divided by the average of FI before heating (from 0 to 10 s). ΔT at each point was obtained from change in FI of ETY. (F) The calibration curves of PTG, NTG, MTG, GTG, LTG, and DTG in HeLa cells. The calibration curve was calculated to be y = −0.029x + 0.99, y = −0.014x + 0.97, y = −0.041x + 0.99, y = −0.039x + 0.99, y = −0.038x + 1.0, and y = −0.051x + 1.0 for PTG, NTG, MTG, GTG, LTG, and DTG, respectively. (G) Temperature sensitivity of OTGs estimated from analysis of FI and fluorescence lifetime imaging (FLIM). The temperature sensitivity was referred from the previous study (X. liu et al., 2022 [16]). Base temperature was 37 °C through all experiments.
Chemosensors 11 00375 g001
Figure 2. Visualization of a steep temperature gradient with Mito Thermo Green (MTG) (A) A schematic illustration of a nanoheater (nanoHT) and experimental design. Fluorescence image showed mitochondria (green) and the location of nanoHT (red) in HeLa cells. Scale bar: 10 μm. (B,C) Detection of temperature gradient with MTG. The depth of the step at each ROI depended on the distance from the heat spot (B,C). (D) Normalized fluorescence intensity (FI) at ROI (Blue dot) was plotted versus the distance from nanoHT (2nd axis). The temperature increment (ΔT) obtained from the calibration curve of MTG (Black dot) was plotted as 1st axis.
Chemosensors 11 00375 g002
Figure 3. Influence of shape change at subcellular level on thermometry. (A) Schematic images of influence of a nanoheater (nanoHT)-induced harsh temperature increment to morphology of mitochondria. Fluorescence intensity (FI) and fluorescence lifetime imaging (FLIM) images of 3T3-L1 cell stained with Mito Thermo Green (MTG). Scale bar: 10 μm. (B) Fl images of MTG before and after an NIR stimulation. Scale bar: 10 μm. (C) The irreversible fluorescence response upon heating using nanoHT. (D,E) As such, the harsh temperature increment was imaged with FLIM-based thermometry with MTG, which was reversible response. (F) Comparison of the accuracy in the thermometry between FI- and FLIM-based analysis. The box plot shows nanoHT-induced temperature increment (ΔT) analyzed from normalized FI and Fluorescence lifetime during the heating. Number of cells was 5. Average ± SD indicates 8.0 ± 4.8 °C (FI-based analysis) and 5.7 ± 1.7 °C (FLIM-based analysis). Median represents 9.8 °C (FI) and 6.3 °C (FLIM). The line and x in the boxes show the median and the average, respectively.
Chemosensors 11 00375 g003
Figure 4. Comparison of the accuracy in fluorescence intensity (FI)- and fluorescence lifetime imaging (FLIM)-based thermometry of thermogenesis in brown adipocytes. (A) Heat generation mechanism in mitochondrion of brown adipocytes. (B) Illustration of cell morphology change after the isoproterenol stimulation. The cases were classified to type 1 with less change and type 2 with drastic change. The definition was shown in Supplementary Figure S5. (C) FI and FLIM images of brown adipocyte with Mito Thermo Green (MTG) and bright field (BF) image. Scale bar: 10 μm. (DF) Visualization of heat production by FI-based thermometry (D). In both cases of type 1 and 2, normalized FI of MTG was plotted versus time (E). The average of normalized FI at 40 min after the Iso stimulation (F). Thick lines represent the average of normalized FI in 5 cells. (G) Similar to Figure 4D–F, the heat production was imaged using FLIM-based thermometry. Scale bar: 10 μm. (H) Changes in the fluorescence lifetime were plotted before and during heat production. Thick lines represent the average of fluorescence lifetime in 5 cells. Fluorescence lifetime was analyzed after 40 min treatment of Iso. (I) Comparison of temperature increment (ΔT) obtained from FI- and FLIM-based analysis. The line and x in the boxes show the median and the average, respectively.
Chemosensors 11 00375 g004
Disclaimer/Publisher’s Note: The statements, opinions and data contained in all publications are solely those of the individual author(s) and contributor(s) and not of MDPI and/or the editor(s). MDPI and/or the editor(s) disclaim responsibility for any injury to people or property resulting from any ideas, methods, instructions or products referred to in the content.