
Sensing of Digestive Enzymes—Diagnosis and Monitoring of Pancreatitis


Abstract
:1. Introduction
1.1. Pancreatitis
1.2. Diagnosis and Treatment of Pancreatitis
1.3. Point-of-Care Testing
1.4. Summary
2. Detection of Amylase
2.1. Pancreatic Amylase
2.2. Laboratory Chemical Analysis
2.3. Optical Methods
2.3.1. Amylose-Iodine Colorimetry
2.3.2. Special Substrate Colorimetry
2.3.3. Fluorescence Methods
2.3.4. Liquid Crystal Phase Transition Methods
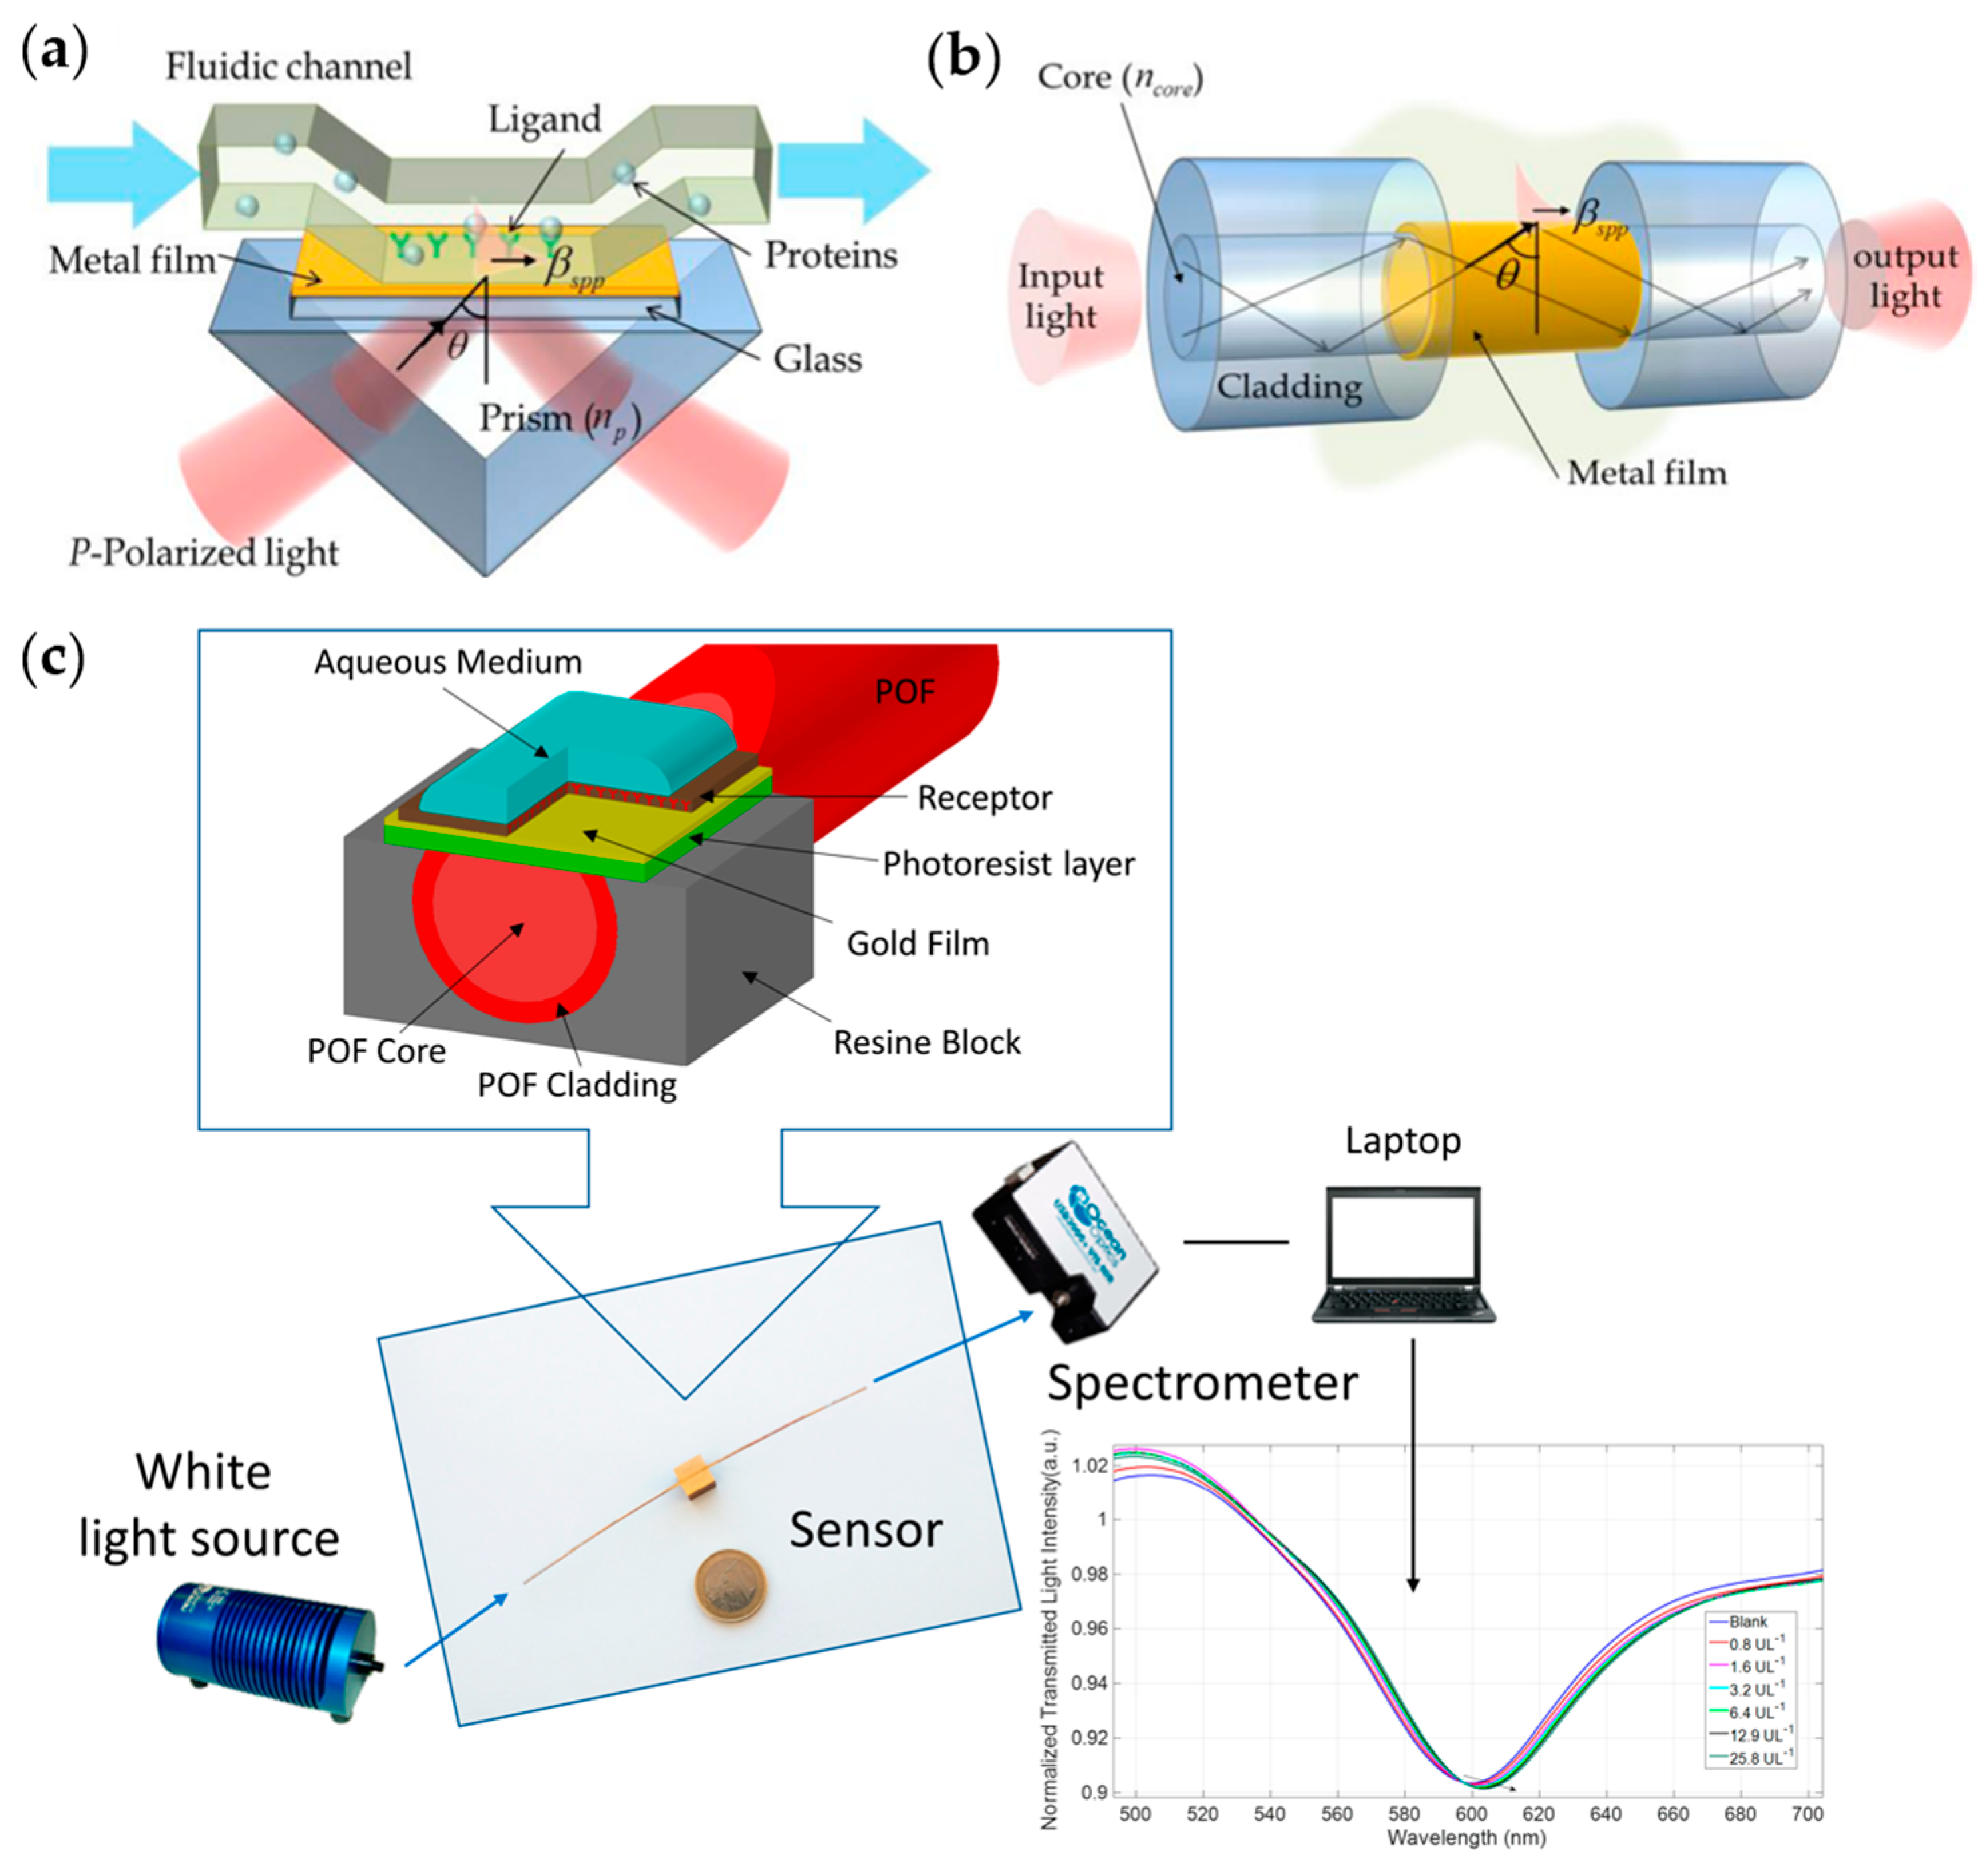
2.3.5. Surface Plasmon Resonance
2.3.6. Chemiluminescence Methods
2.4. Mechanical Methods
2.4.1. Resonance Methods
2.4.2. Viscosity Methods
2.5. Electrical Methods
2.5.1. Resistance Measurement
2.5.2. Giant Magnetoresistive Sensors
2.5.3. Electrochemical Methods
2.6. Other Methods
2.6.1. Blood Glucose Meter Methods
2.6.2. Antigen Test Strip Methods
2.6.3. Isothermal Titration Calorimetry
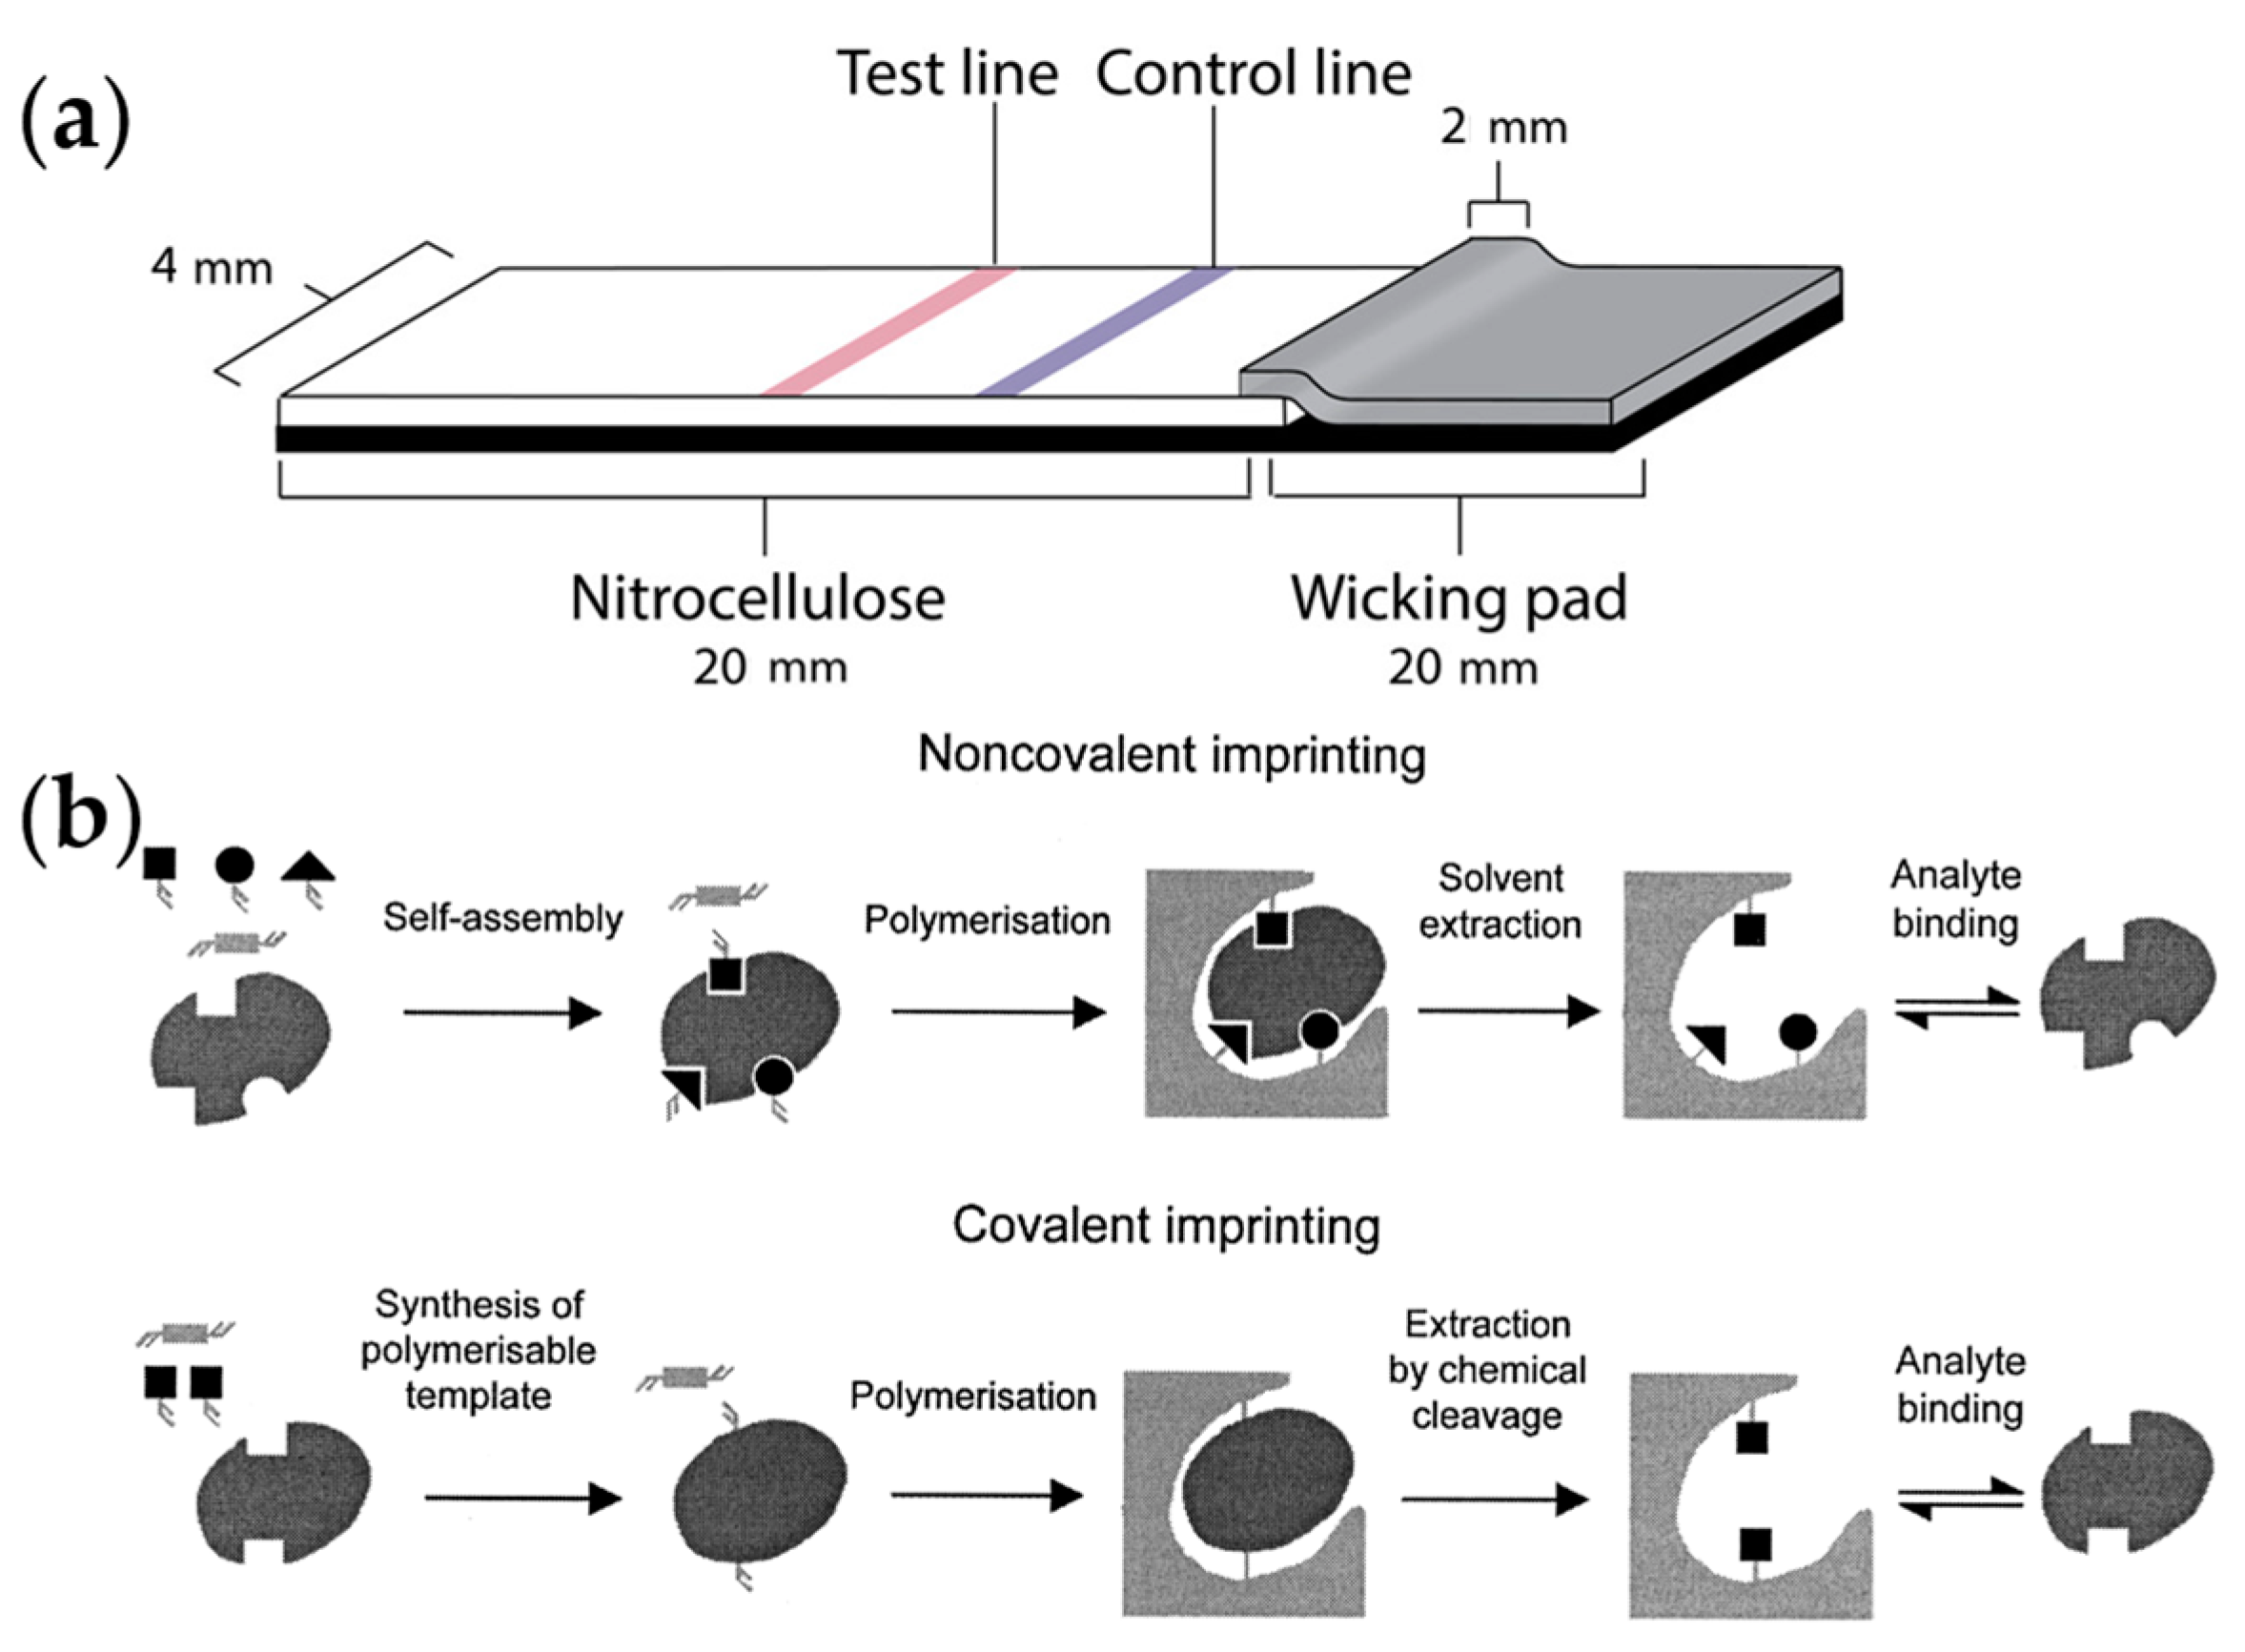
2.6.4. Molecularly Imprinted Polymer Methods
2.7. Summary
3. Detection of Protease
3.1. Trypsin
3.2. Optical Methods
3.2.1. Colorimetry
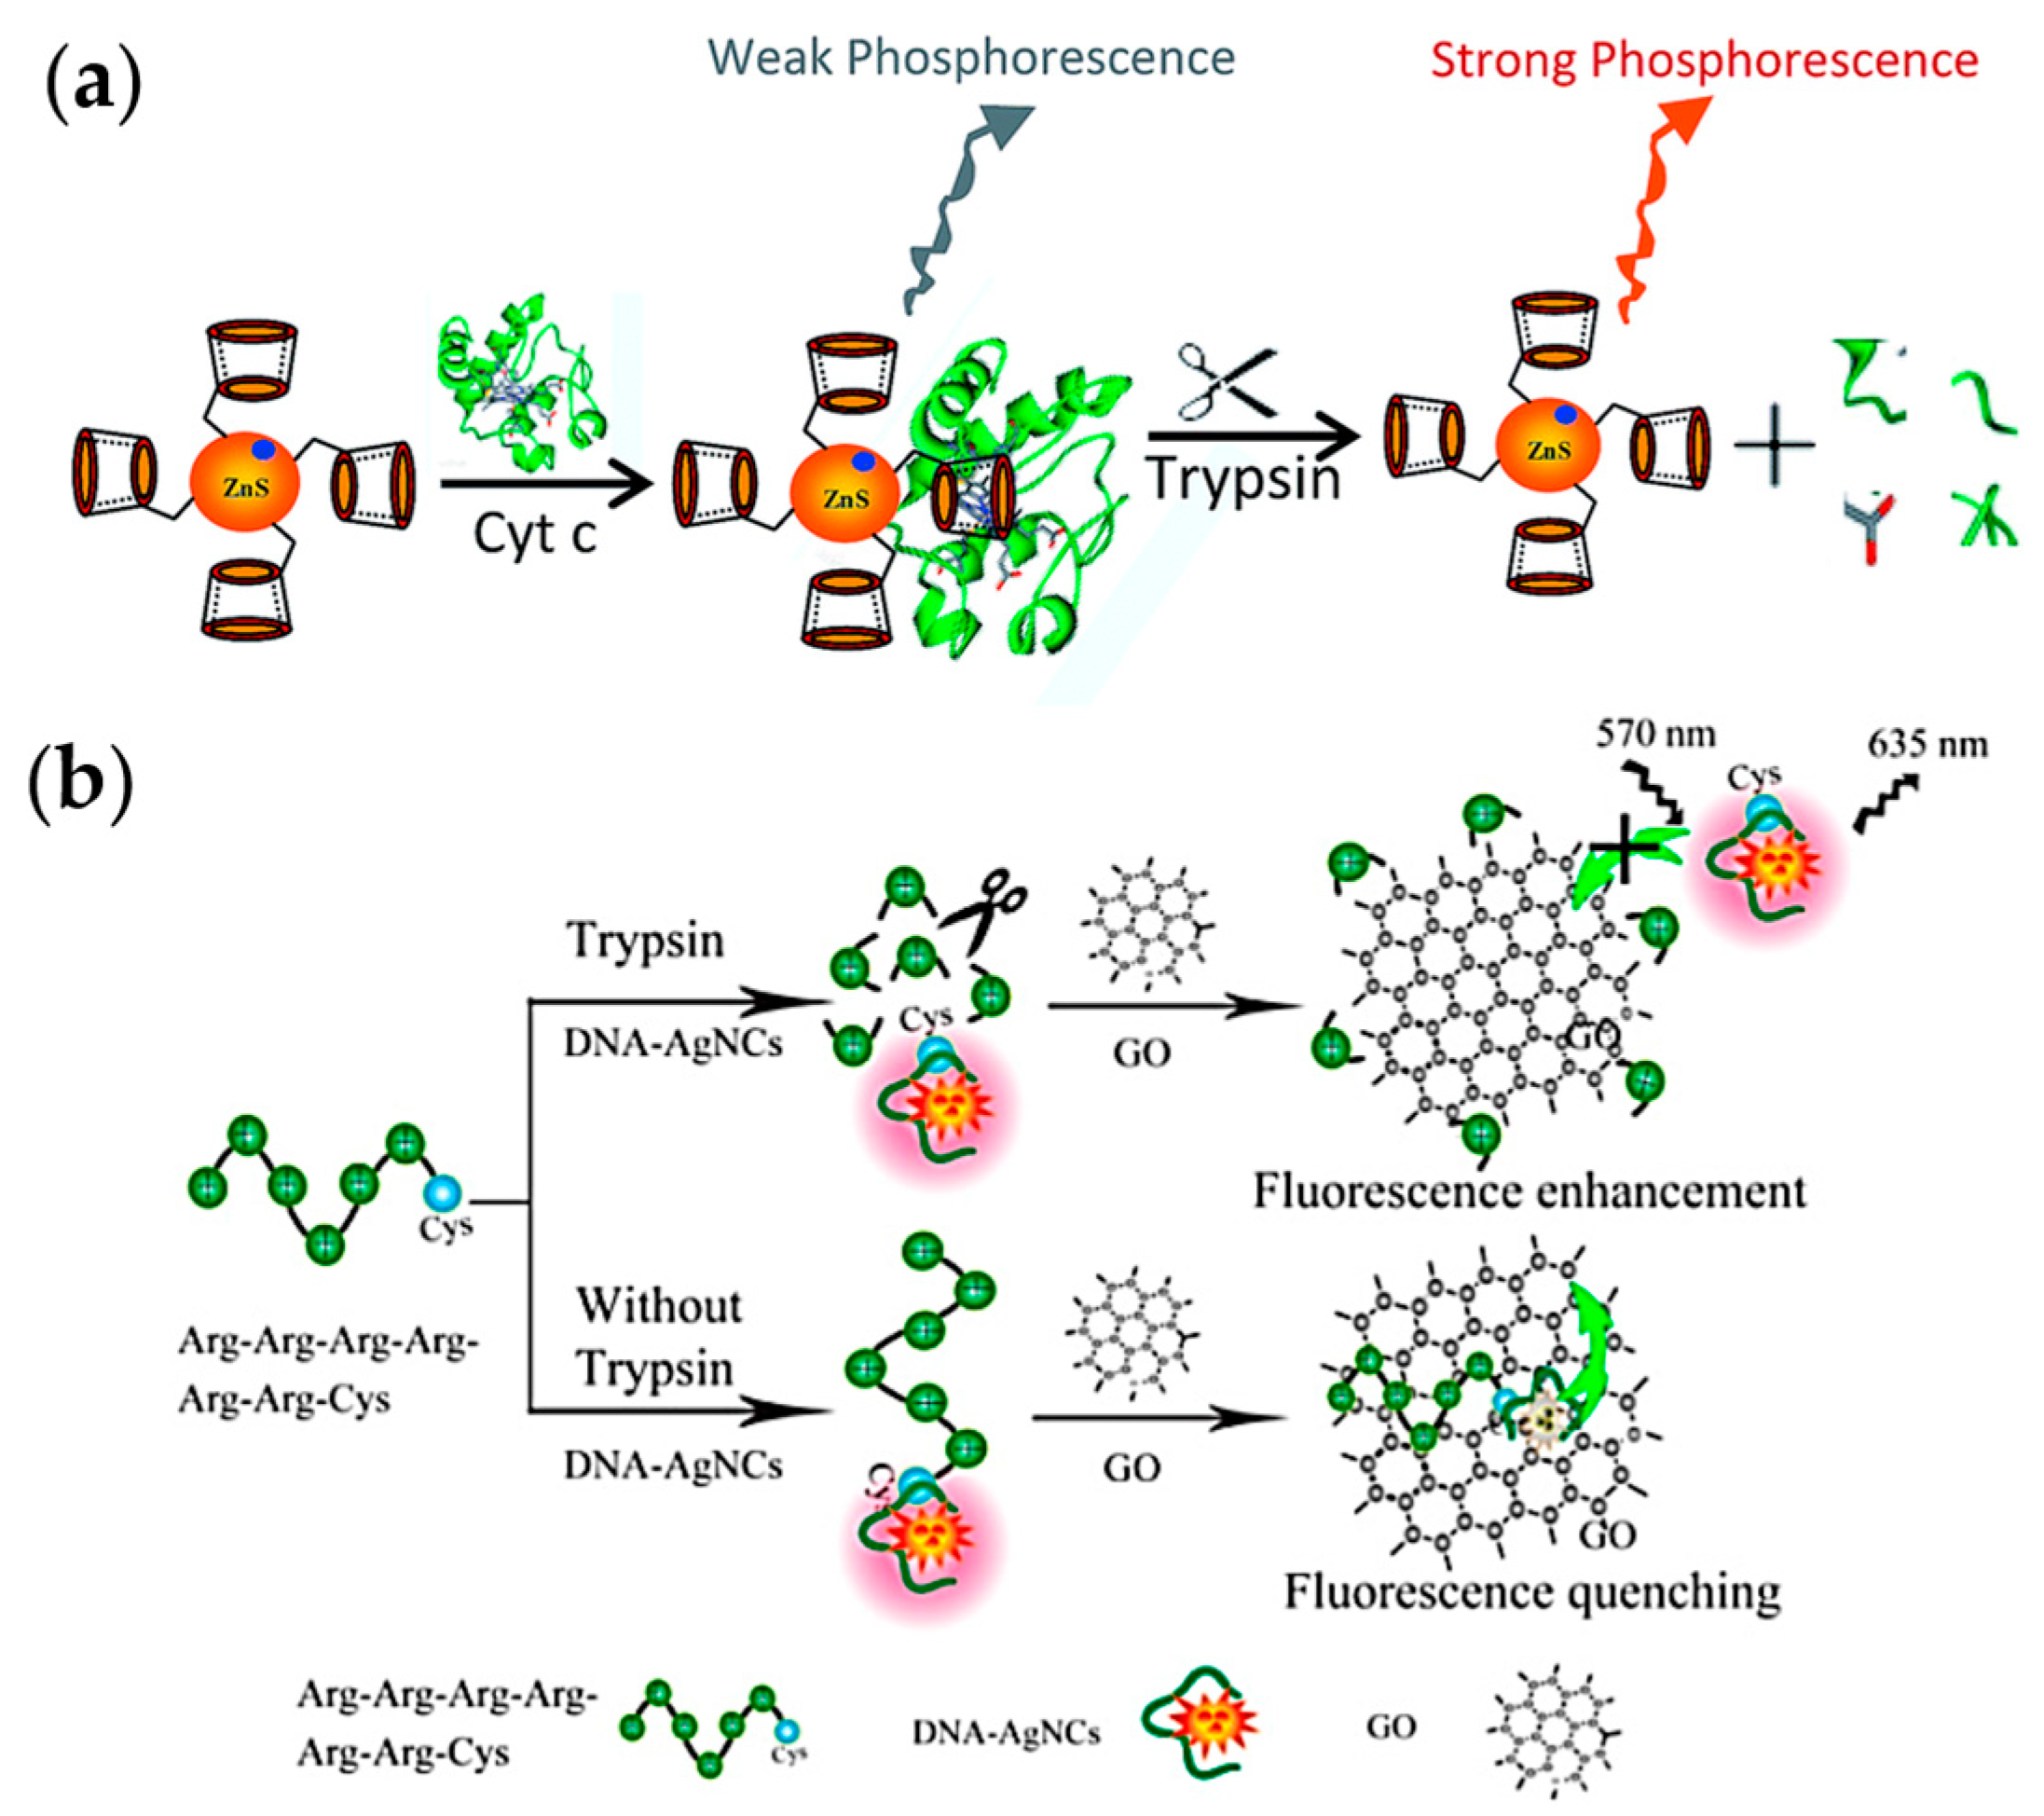
3.2.2. Fluorescence Methods
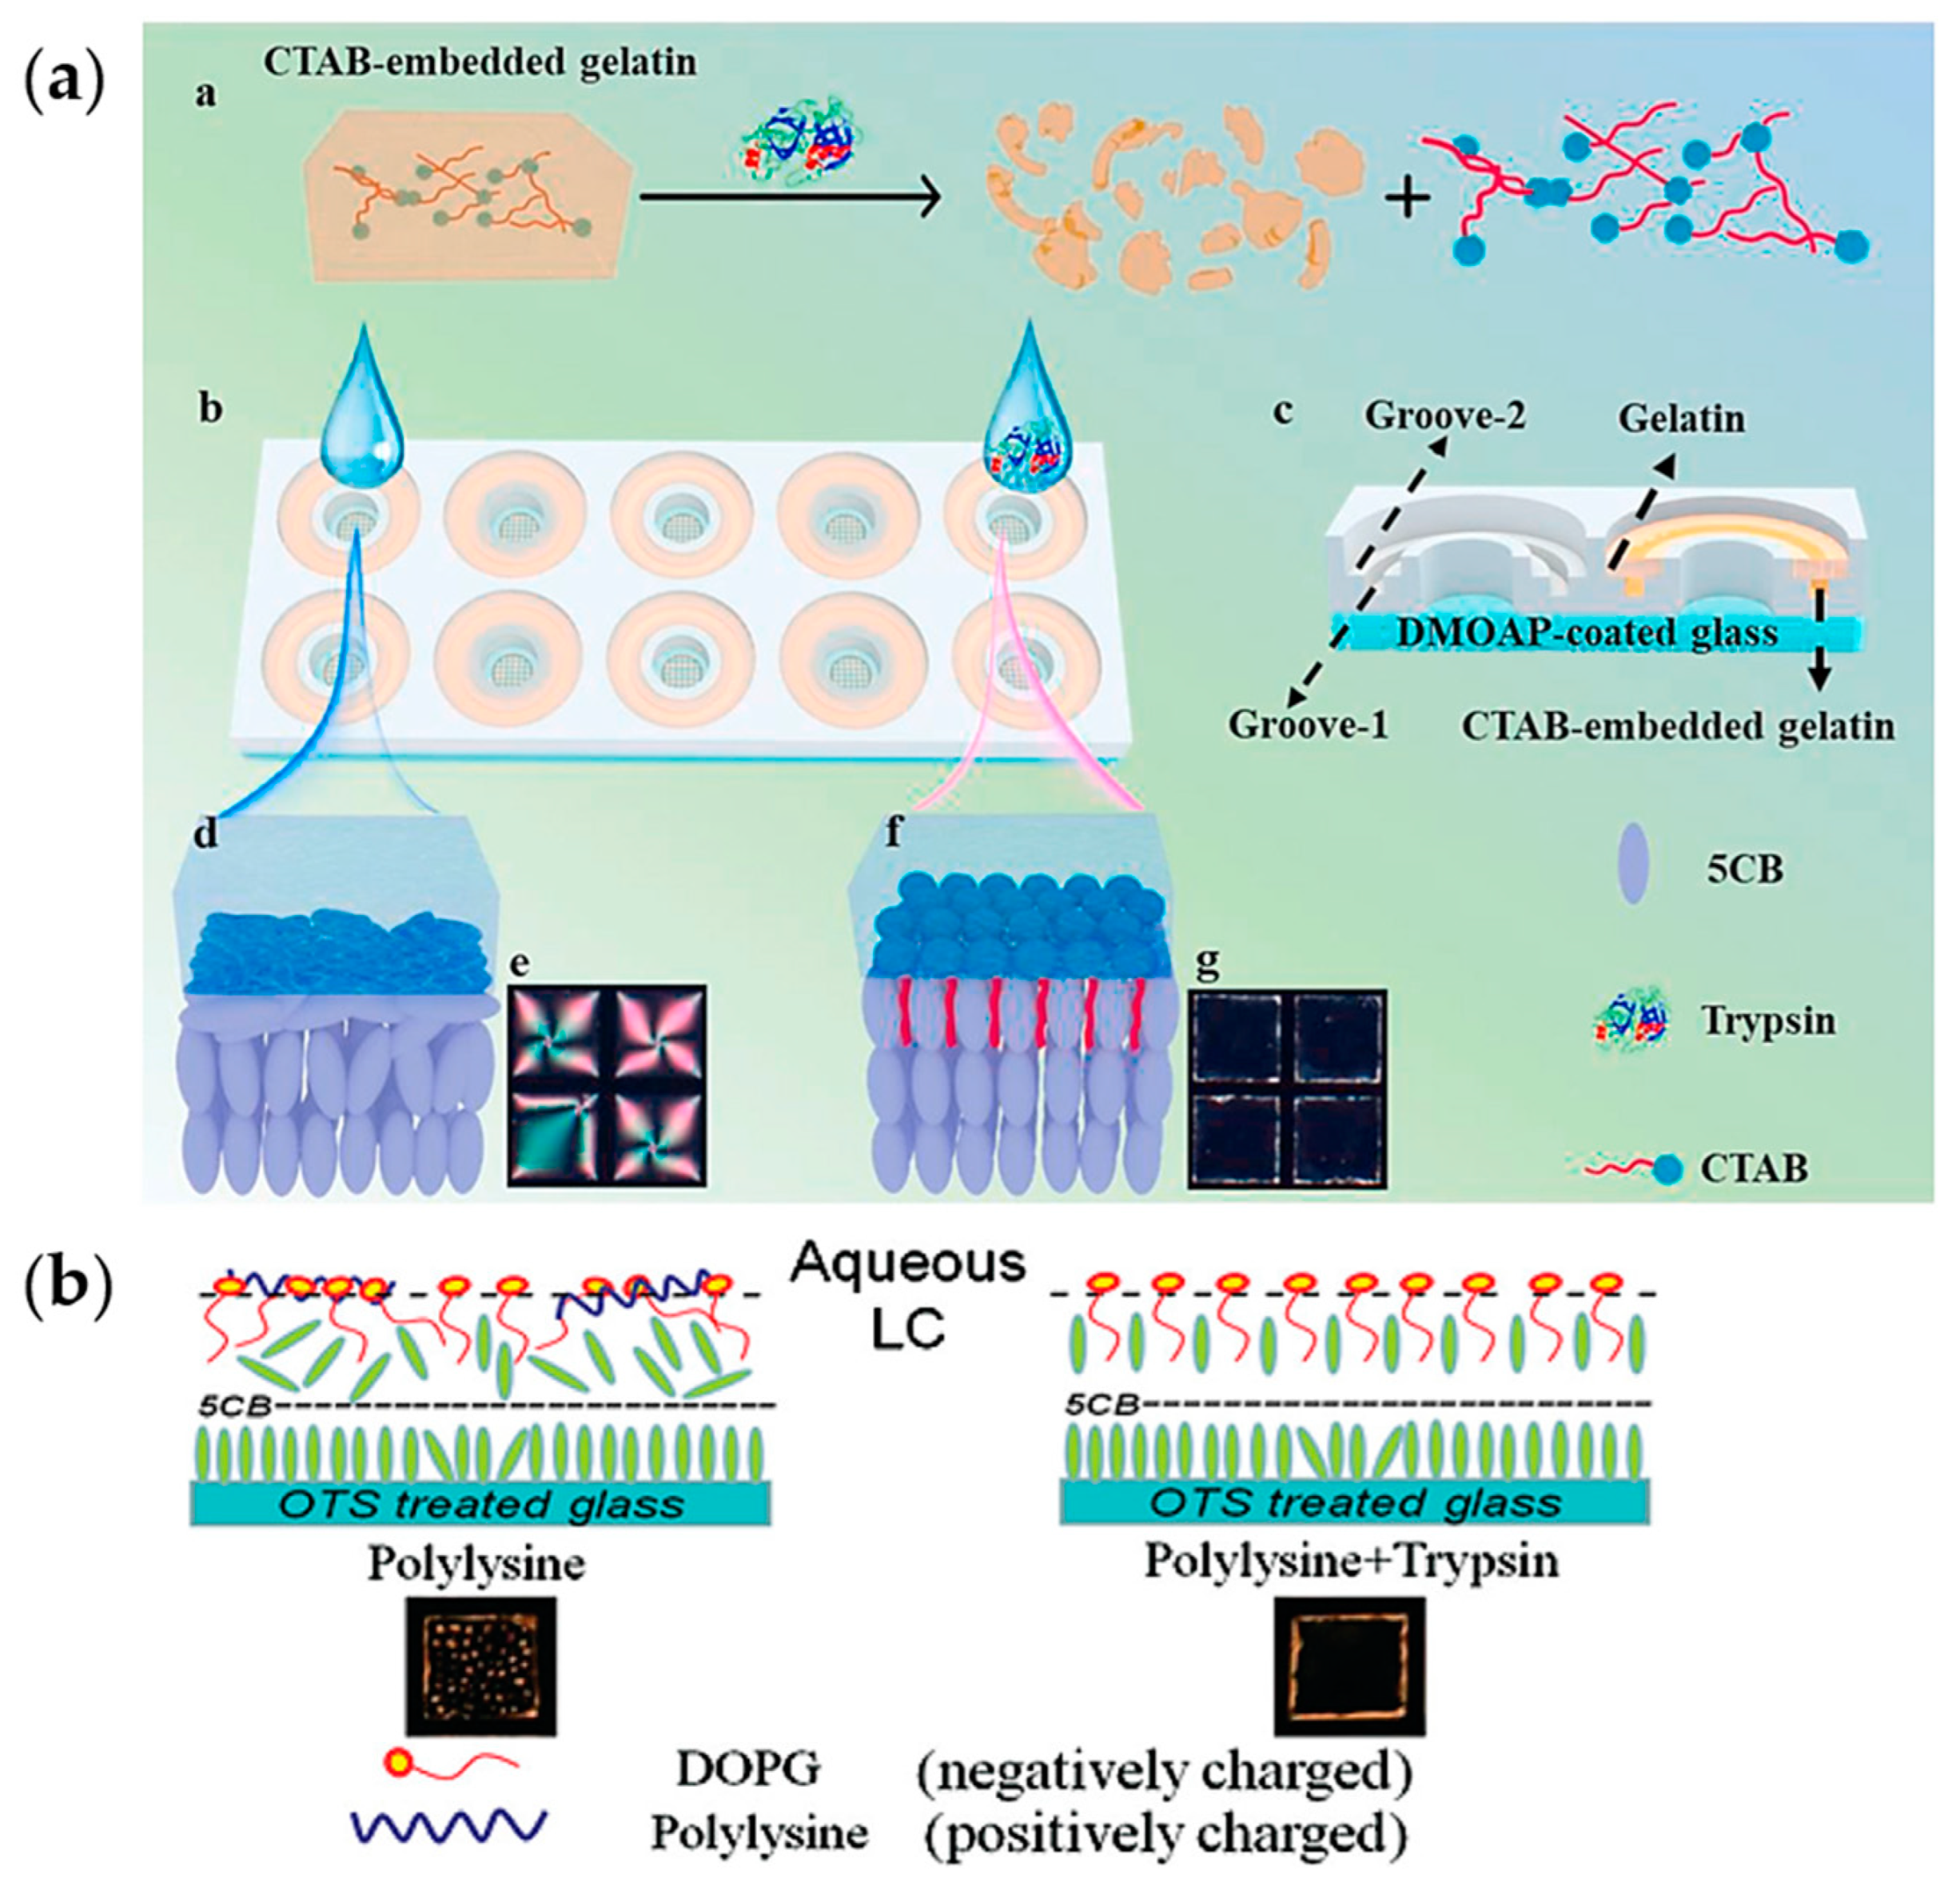
3.2.3. Liquid Crystal Phase Transition Methods
3.2.4. Localized Surface Plasmon Resonance
3.2.5. Electrochemiluminescence Method
3.3. Mechanical Methods
3.4. Electrical Methods
3.4.1. Circuit Parameter Testing
3.4.2. Electrochemical Method
3.5. Chymotrypsin and Elastase
3.6. Detection of Chymotrypsin
3.7. Detection of Elastase
3.8. Summary
4. Detection of Lipase
4.1. Lipase
4.2. Optical Methods
4.3. Electrical Methods
4.4. Other Methods
4.5. Summary
5. Conclusions and Outlook
Author Contributions
Funding
Institutional Review Board Statement
Informed Consent Statement
Data Availability Statement
Conflicts of Interest
References
- Whitcomb, D.C.; Lowe, M.E. Human pancreatic digestive enzymes. Dig. Dis. Sci. 2007, 52, 1–17. [Google Scholar] [CrossRef] [PubMed]
- Slack, J.M. Developmental Biology of The Pancreas. Development 1995, 121, 1569–1580. [Google Scholar] [CrossRef] [PubMed]
- Rothman, S.S. Digestive Enzymes of Pancreas—Mixture of Inconstant Proportions. Annu. Rev. Physiol. 1977, 39, 373–389. [Google Scholar] [CrossRef]
- Pallagi, P.; Hegyi, P.; Rakonczay, Z., Jr. The Physiology and Pathophysiology of Pancreatic Ductal Secretion The Background for Clinicians. Pancreas 2015, 44, 1211–1233. [Google Scholar] [CrossRef]
- Ishiguro, H.; Yamamoto, A.; Nakakuki, M.; Yi, L.; Ishiguro, M.; Yamaguchi, M.; Kondo, S.; Mochimaru, Y. Physiology and Pathophysiology of Bicarbonate Secretion by Pancreatic Duct Epithelium. Nagoya J. Med. Sci. 2012, 74, 1–18. [Google Scholar] [PubMed]
- Czaja, M.J. Functions of Autophagy in Hepatic and Pancreatic Physiology and Disease. Gastroenterology 2011, 140, 1895–1908. [Google Scholar] [CrossRef]
- Logsdon, C.D.; Ji, B. The role of protein synthesis and digestive enzymes in acinar cell injury. Nat. Rev. Gastroenterol. Hepatol. 2013, 10, 362–370. [Google Scholar] [CrossRef]
- Petrov, M.S.; Yadav, D. Global epidemiology and holistic prevention of pancreatitis. Nat. Rev. Gastroenterol. Hepatol. 2019, 16, 175–184. [Google Scholar] [CrossRef]
- Beyer, G.; Habtezion, A.; Werner, J.; Lerch, M.M.; Mayerle, J. Chronic pancreatitis. Lancet 2020, 396, 499–512. [Google Scholar] [CrossRef]
- Xiao, A.Y.; Tan, M.L.Y.; Wu, L.M.; Asrani, V.M.; Windsor, J.A.; Yadav, D.; Petrov, M.S. Global incidence and mortality of pancreatic diseases: A systematic review, meta-analysis, and meta-regression of population-based cohort studies. Lancet Gastroenterol. Hepatol. 2016, 1, 45–55. [Google Scholar] [CrossRef]
- Machicado, J.D.; Dudekula, A.; Tang, G.; Xu, H.; Wu, B.U.; Forsmark, C.E.; Yadav, D. Period prevalence of chronic pancreatitis diagnosis from 2001–2013 in the commercially insured population of the United States. Pancreatology 2019, 19, 813–818. [Google Scholar] [CrossRef] [PubMed]
- Boxhoorn, L.; Voermans, R.P.; Bouwense, S.A.; Bruno, M.J.; Verdonk, R.C.; Boermeester, M.A.; van Santvoort, H.C.; Besselink, M.G. Acute pancreatitis. Lancet 2020, 396, 726–734. [Google Scholar] [CrossRef] [PubMed]
- Schepers, N.J.; Bakker, O.J.; Besselink, M.G.; Ali, U.A.; Bollen, T.L.; Gooszen, H.G.; van Santvoort, H.C.; Bruno, M.J. Impact of characteristics of organ failure and infected necrosis on mortality in necrotising pancreatitis. Gut 2019, 68, 1044–1051. [Google Scholar] [CrossRef] [PubMed]
- van Santvoort, H.C.; Bakker, O.J.; Bollen, T.L.; Besselink, M.G.; Ali, U.A.; Schrijver, A.M.; Boermeester, M.A.; van Goor, H.; Dejong, C.H.; van Eijck, C.H.; et al. A Conservative and Minimally Invasive Approach to Necrotizing Pancreatitis Improves Outcome. Gastroenterology 2011, 141, 1254–1263. [Google Scholar] [CrossRef]
- Gurusamy, K.S.; Belgaumkar, A.P.; Haswell, A.; Pereira, S.P.; Davidson, B.R. Interventions for necrotising pancreatitis. Cochrane Database Syst. Rev. 2016, 4. [Google Scholar] [CrossRef]
- Young, B.J.; Melbern, W.C.; Pablo, A.J.; Shyam, V. Superiority of endoscopic interventions over minimally invasive surgery for infected necrotizing pancreatitis: Meta-analysis of randomized trials. Dig. Endosc. Off. J. Jpn. Gastroenterol. Endosc. Soc. 2020, 32, 298–308. [Google Scholar]
- Lankisch, P.G.; Apte, M.; Banks, P.A. Acute pancreatitis. Lancet 2015, 386, 85–96. [Google Scholar] [CrossRef]
- Tenner, S.; Baillie, J.; DeWitt, J.; Vege, S.S. American College of Gastroenterology Guideline: Management of Acute Pancreatitis. Am. J. Gastroenterol. 2013, 108, 1400–1415. [Google Scholar] [CrossRef]
- Habtezion, A.; Gukovskaya, A.S.; Pandol, S.J. Acute Pancreatitis: A Multifaceted Set of Organelle and Cellular Interactions. Gastroenterology 2019, 156, 1941–1950. [Google Scholar] [CrossRef]
- Yadav, D.; Lowenfels, A.B. The Epidemiology of Pancreatitis and Pancreatic Cancer. Gastroenterology 2013, 144, 1252–1261. [Google Scholar] [CrossRef]
- Crockett, S.D.; Wani, S.; Gardner, T.B.; Falck-Ytter, Y.; Barkun, A.N.; American Gastroenterological Association Institute Clinical Guidelines Committee. American Gastroenterological Association Institute Guideline on Initial Management of Acute Pancreatitis. Gastroenterology 2018, 154, 1096–1101. [Google Scholar] [CrossRef] [PubMed]
- Wang, F.; Wang, H.; Fan, J.; Zhang, Y.; Wang, H.; Zhao, Q. Pancreatic Injury Patterns in Patients With Coronavirus Disease 19 Pneumonia. Gastroenterology 2020, 159, 367–370. [Google Scholar] [CrossRef] [PubMed]
- Hadi, A.; Werge, M.; Kristiansen, K.T.; Pedersen, U.G.; Karstensen, J.G.; Novovic, S.; Gluud, L.L. Coronavirus Disease-19 (COVID-19) associated with severe acute pancreatitis: Case report on three family members. Pancreatology 2020, 20, 665–667. [Google Scholar] [CrossRef] [PubMed]
- de-Madaria, E.; Capurso, G. COVID-19 and acute pancreatitis: Examining the causality. Nat. Rev. Gastroenterol. Hepatol. 2021, 18, 3–4. [Google Scholar] [CrossRef] [PubMed]
- Aloysius, M.M.; Thatti, A.; Gupta, A.; Sharma, N.; Bansal, P.; Goyal, H. COVID-19 presenting as acute pancreatitis. Pancreatology 2020, 20, 1026–1027. [Google Scholar] [CrossRef]
- Kiyak, M.; Duzenli, T. Lipase elevation on admission predicts worse clinical outcomes in patients with COVID-19. Pancreatology 2022, 22, 665–670. [Google Scholar] [CrossRef]
- Ali, U.A.; Issa, Y.; Hagenaars, J.C.; Bakker, O.J.; van Goor, H.; Nieuwenhuijs, V.B.; Bollen, T.L.; van Ramshorst, B.; Witteman, B.J.; Brink, M.A.; et al. Risk of Recurrent Pancreatitis and Progression to Chronic Pancreatitis After a First Episode of Acute Pancreatitis. Clin. Gastroenterol. Hepatol. 2016, 14, 738–746. [Google Scholar]
- Sankaran, S.J.; Xiao, A.Y.; Wu, L.M.; Windsor, J.A.; Forsmark, C.E.; Petrov, M.S. Frequency of Progression From Acute to Chronic Pancreatitis and Risk Factors: A Meta-analysis. Gastroenterology 2015, 149, 1490–1500.e1. [Google Scholar] [CrossRef]
- Braganza, J.M.; Lee, S.H.; McCloy, R.F.; McMahon, M.J. Chronic pancreatitis. Lancet 2011, 377, 1184–1197. [Google Scholar] [CrossRef]
- MBraganza, J.M.; Scott, P.; Bilton, D.; Schofield, D.; Chaloner, C.; Shiel, N.; Hunt, L.P.; Bottiglieri, T. Evidence for early oxidative stress in acute pancreatitis. Int. J. Pancreatol. 1995, 17, 69–81. [Google Scholar] [CrossRef]
- Kamisawa, T.; Wood, L.D.; Itoi, T.; Takaori, K. Pancreatic cancer. Lancet 2016, 388, 73–85. [Google Scholar] [CrossRef] [PubMed]
- Balthazar, E.J.; Robinson, D.L.; Megibow, A.J.; Ranson, J.H.C. Acute-Pancreatitis—Value of CT in Establishing Prognosis. Radiology 1990, 174, 331–336. [Google Scholar] [CrossRef] [PubMed]
- Tonozuka, R.; Itoi, T.; Nagata, N.; Kojima, H.; Sofuni, A.; Tsuchiya, T.; Ishii, K.; Tanaka, R.; Nagakawa, Y.; Mukai, S. Deep learning analysis for the detection of pancreatic cancer on endosonographic images: A pilot study. J. Hepato-Biliary-Pancreat. Sci. 2021, 28, 95–104. [Google Scholar] [CrossRef] [PubMed]
- Banks, P.A.; Bollen, T.L.; Dervenis, C.; Gooszen, H.G.; Johnson, C.D.; Sarr, M.G.; Tsiotos, G.G.; Vege, S.S.; Acute Pancreatitis, C. Classification of acute pancreatitis-2012: Revision of the Atlanta classification and definitions by international consensus. Gut 2013, 62, 102–111. [Google Scholar] [CrossRef] [PubMed]
- Silva-Vaz, P.; Abrantes, A.M.; Castelo-Branco, M.; Gouveia, A.; Botelho, M.F.; Tralhao, J.G. Multifactorial Scores and Biomarkers of Prognosis of Acute Pancreatitis: Applications to Research and Practice. Int. J. Mol. Sci. 2020, 21, 338. [Google Scholar] [CrossRef] [PubMed]
- Patel, H.R.R.; Almanzar, V.M.D.M.; LaComb, J.F.F.; Ju, J.; Bialkowska, A.B.B. The Role of MicroRNAs in Pancreatitis Development and Progression. Int. J. Mol. Sci. 2023, 24, 1057. [Google Scholar] [CrossRef]
- Yan, X.; Li, J.; Wu, D. The Role of Short-Chain Fatty Acids in Acute Pancreatitis. Molecules 2023, 28, 4985. [Google Scholar] [CrossRef]
- Waddell, H.; Stevenson, T.J.; Mole, D.J. The role of the circadian rhythms in critical illness with a focus on acute pancreatitis. Heliyon 2023, 9, e15335. [Google Scholar] [CrossRef]
- Wang, H.; Kang, Z.L.; Peng, X.H.; Liu, L.M.; Liu, Y.X.; Feng, Y.J.; Tao, L.J. Misdiagnosed Analysis of Severe Acute Pancreatitis. Clin. Misdiagn. Misther. 2021, 34, 12–15. [Google Scholar]
- Overbeek, K.A.; Levink, I.J.M.; Koopmann, B.D.M.; Harinck, F.; Konings, I.C.A.W.; Ausems, M.G.E.M.; Wagner, A.; Fockens, P.; van Eijck, C.H.; Koerkamp, B.G.; et al. Long-term yield of pancreatic cancer surveillance in high-risk individuals. Gut 2022, 71, 1152–1160. [Google Scholar] [CrossRef]
- Corral, J.E.; Mareth, K.F.; Riegert-Johnson, D.L.; Das, A.; Wallace, M.B. Diagnostic Yield From Screening Asymptomatic Individuals at High Risk for Pancreatic Cancer: A Meta-analysis of Cohort Studies. Clin. Gastroenterol. Hepatol. 2018, 17, 41–53. [Google Scholar] [CrossRef] [PubMed]
- Gardner, T.B. Fluid Resuscitation in Acute Pancreatitis—Going over the WATERFALL. N. Engl. J. Med. 2022, 387, 1038–1039. [Google Scholar] [CrossRef] [PubMed]
- Drewes, A.M.; Olesen, A.E.; Farmer, A.D.; Szigethy, E.; Rebours, V.; Olesen, S.S. Gastrointestinal pain. Nat. Rev. Dis. Prim. 2020, 6, 1. [Google Scholar] [CrossRef] [PubMed]
- Meyers, C.; Radler, D.R.; Zelig, R.S. Impact of solid food provision within 24 hours of hospital admission on clinical outcomes for adult patients with acute pancreatitis: A literature review. Nutr. Clin. Pract. 2023, 1–11. [Google Scholar] [CrossRef] [PubMed]
- Gubala, V.; Harris, L.F.; Ricco, A.J.; Tan, M.X.; Williams, D.E. Point of Care Diagnostics: Status and Future. Anal. Chem. 2012, 84, 487–515. [Google Scholar] [CrossRef]
- Vashist, S.K.; Luppa, P.B.; Yeo, L.Y.; Ozcan, A.; Luong, J.H.T. Emerging Technologies for Next-Generation Point-of-Care Testing. Trends Biotechnol. 2015, 33, 692–705. [Google Scholar] [CrossRef]
- Yager, P.; Domingo, G.J.; Gerdes, J. Point-of-care diagnostics for global health. Annu. Rev. Biomed. Eng. 2008, 10, 107–144. [Google Scholar] [CrossRef]
- Pai, N.P.; Vadnais, C.; Denkinger, C.; Engel, N.; Pai, M. Point-of-Care Testing for Infectious Diseases: Diversity, Complexity, and Barriers in Low- And Middle-Income Countries. PLoS Med. 2012, 9, e1001306. [Google Scholar] [CrossRef]
- Zerem, E.; Kurtcehajic, A.; Kunosic, S.; Malkocevic, D.Z.; Zerem, O. Current trends in acute pancreatitis: Diagnostic and therapeutic challenges. World J. Gastroenterol. 2023, 29, 2747–2763. [Google Scholar] [CrossRef]
- Yamamiya, A.; Irisawa, A.; Abe, Y.; Arisaka, T.; Ohnishi, T.; Hoshi, K.; Suzuki, T.; Nagashima, K.; Kashima, K.; Kunogi, Y.; et al. Diagnosing chronic pancreatitis by endoscopic ultrasound assessing the association between ultrasound and pathological findings: A narrative review. DEN Open 2023, 3, e164. [Google Scholar] [CrossRef]
- Berbis, M.A.; Paulano Godino, F.; Royuela del Val, J.; Alcala Mata, L.; Luna, A. Clinical impact of artificial intelligence-based solutions on imaging of the pancreas and liver. World J. Gastroenterol. 2023, 29, 1427–1445. [Google Scholar] [CrossRef] [PubMed]
- Corring, T. The Adaptation of Digestive Enzymes to The Diet—Its Physiological Significance. Reprod. Nutr. Dev. 1980, 20, 1217–1235. [Google Scholar] [CrossRef] [PubMed]
- Isenman, L.; Liebow, C.; Rothman, S. The endocrine secretion of mammalian digestive enzymes by exocrine glands. Am. J. Physiol. -Endocrinol. Metab. 1999, 276, E223–E232. [Google Scholar] [CrossRef] [PubMed]
- Rothman, S.; Liebow, C.; Isenman, L. Conservation of digestive enzymes. Physiol. Rev. 2002, 82, 1–18. [Google Scholar] [CrossRef] [PubMed]
- Greaves, J.P.; Hollingsworth, D.F. Changes in the pattern of carbohydrates consumption in Britain. Proc. Nutr. Soc. 1964, 23, 136–143. [Google Scholar] [CrossRef]
- Caspary, W.F. Physiology and pathophysiology of intestinal absorption. Am. J. Clin. Nutr. 1992, 55, 299S–308S. [Google Scholar] [CrossRef]
- Salt, W.B.; Schenker, S. Amylase—Its Clinical Significance—Review of Literature. Medicine 1976, 55, 269–289. [Google Scholar] [CrossRef]
- Ghelis, C.; Tempete-Gaillourdet, M.; Yon, J.M. The folding of pancreatic elastase: Independent domain refolding and inter-domain interaction. Biochem. Biophys. Res. Commun. 1978, 84, 31–36. [Google Scholar] [CrossRef]
- Stiefel, D.J.; Keller, P.J. Preparation and some properties of human pancreatic amylase including a comparison with human parotid amylase. Biochim. Biophys. Acta 1973, 302, 345–361. [Google Scholar] [CrossRef]
- Douglas, H.; Fraser, I.; Davidson, G.; Murphy, C.; Gorman, M.L.; Boyce, M.; Doole, S. Assessing the background levels of body fluids on hands. Sci. Justice 2023, 63, 493–499. [Google Scholar] [CrossRef]
- Agatonovic-Kustrin, S.; Wong, S.; Dolzhenko, A.V.; Gegechkori, V.; Ku, H.; Tan, W.K.; Morton, D.W. Effect directed analysis of bioactive compounds in leaf extracts from two Salvia species by High-performance thin-layer chromatography. J. Pharm. Biomed. Anal. 2023, 227, 115308. [Google Scholar] [CrossRef] [PubMed]
- Barber, E.; Houghton, M.J.; Visvanathan, R.; Williamson, G. Measuring key human carbohydrate digestive enzyme activities using high-performance anion-exchange chromatography with pulsed amperometric detection. Nat. Protoc. 2022, 17, 2882–2919. [Google Scholar] [CrossRef] [PubMed]
- Mileski, K.S.; Ciric, A.D.; Gasic, U.M.; Zarkovic, L.D.; Krivosej, Z.D.; Dzamic, A.M. Comparative Analyses on Chemical Constituents and Biological Activities of Laserpitium siler L. from Serbia. Rec. Nat. Prod. 2022. [Google Scholar] [CrossRef]
- Weng, S.; Tang, L.; Wang, J.; Zhu, R.; Wang, C.; Sha, W.; Zheng, L.; Huang, L.; Liang, D.; Hu, Y.; et al. Detection of amylase activity and moisture content in rice by reflectance spectroscopy combined with spectral data transformation. Spectrochim. Acta Part A Mol. Biomol. Spectrosc. 2023, 290, 122311. [Google Scholar] [CrossRef] [PubMed]
- Dutta, S.; Mandal, N.; Bandyopadhyay, D. Paper-based alpha-amylase detector for point-of-care diagnostics. Biosens. Bioelectron. 2016, 78, 447–453. [Google Scholar] [CrossRef] [PubMed]
- Hyung, S.; Karima, G.; Shin, K.; Kim, K.S.; Hong, J.W. A Simple Paper-Based alpha-Amylase Separating System for Potential Application in Biological Sciences. Biochip J. 2021, 15, 252–259. [Google Scholar] [CrossRef]
- Adhikary, R.R.; Banerjee, R. Development of smart core-shell nanoparticle-based sensors for the point-of-care detection of alpha amylase in diagnostics and forensics. Biosens. Bioelectron. 2021, 184, 113244. [Google Scholar] [CrossRef]
- Fuentes, M.; Tecles, F.; Gutierrez, A.; Otal, J.; Martinez-Subiela, S.; Ceron, J.J. Validation of an automated method for salivary alpha-amylase measurements in pigs (Sus scrofa domesticus) and its application as a stress biomarker. J. Vet. Diagn. Investig. 2011, 23, 282–287. [Google Scholar] [CrossRef]
- Visvanathan, R.; Jayathilake, C.; Liyanage, R. A simple microplate-based method for the determination of alpha-amylase activity using the glucose assay kit (GOD method). Food Chem. 2016, 211, 853–859. [Google Scholar] [CrossRef]
- Dehghani, Z.; Mohammadnejad, J.; Hosseini, M. A new colorimetric assay for amylase based on starch-supported Cu/Au nanocluster peroxidase-like activity. Anal. Bioanal. Chem. 2019, 411, 3621–3629. [Google Scholar] [CrossRef]
- Chen, L.; Huang, W.; Hao, M.; Yang, F.; Shen, H.; Yu, S.; Wang, L. Rapid and ultrasensitive activity detection of & alpha;-amylase based on & gamma;-cyclodextrin crosslinked metal-organic framework nanozyme. Int. J. Biol. Macromol. 2023, 242, 124881. [Google Scholar] [CrossRef]
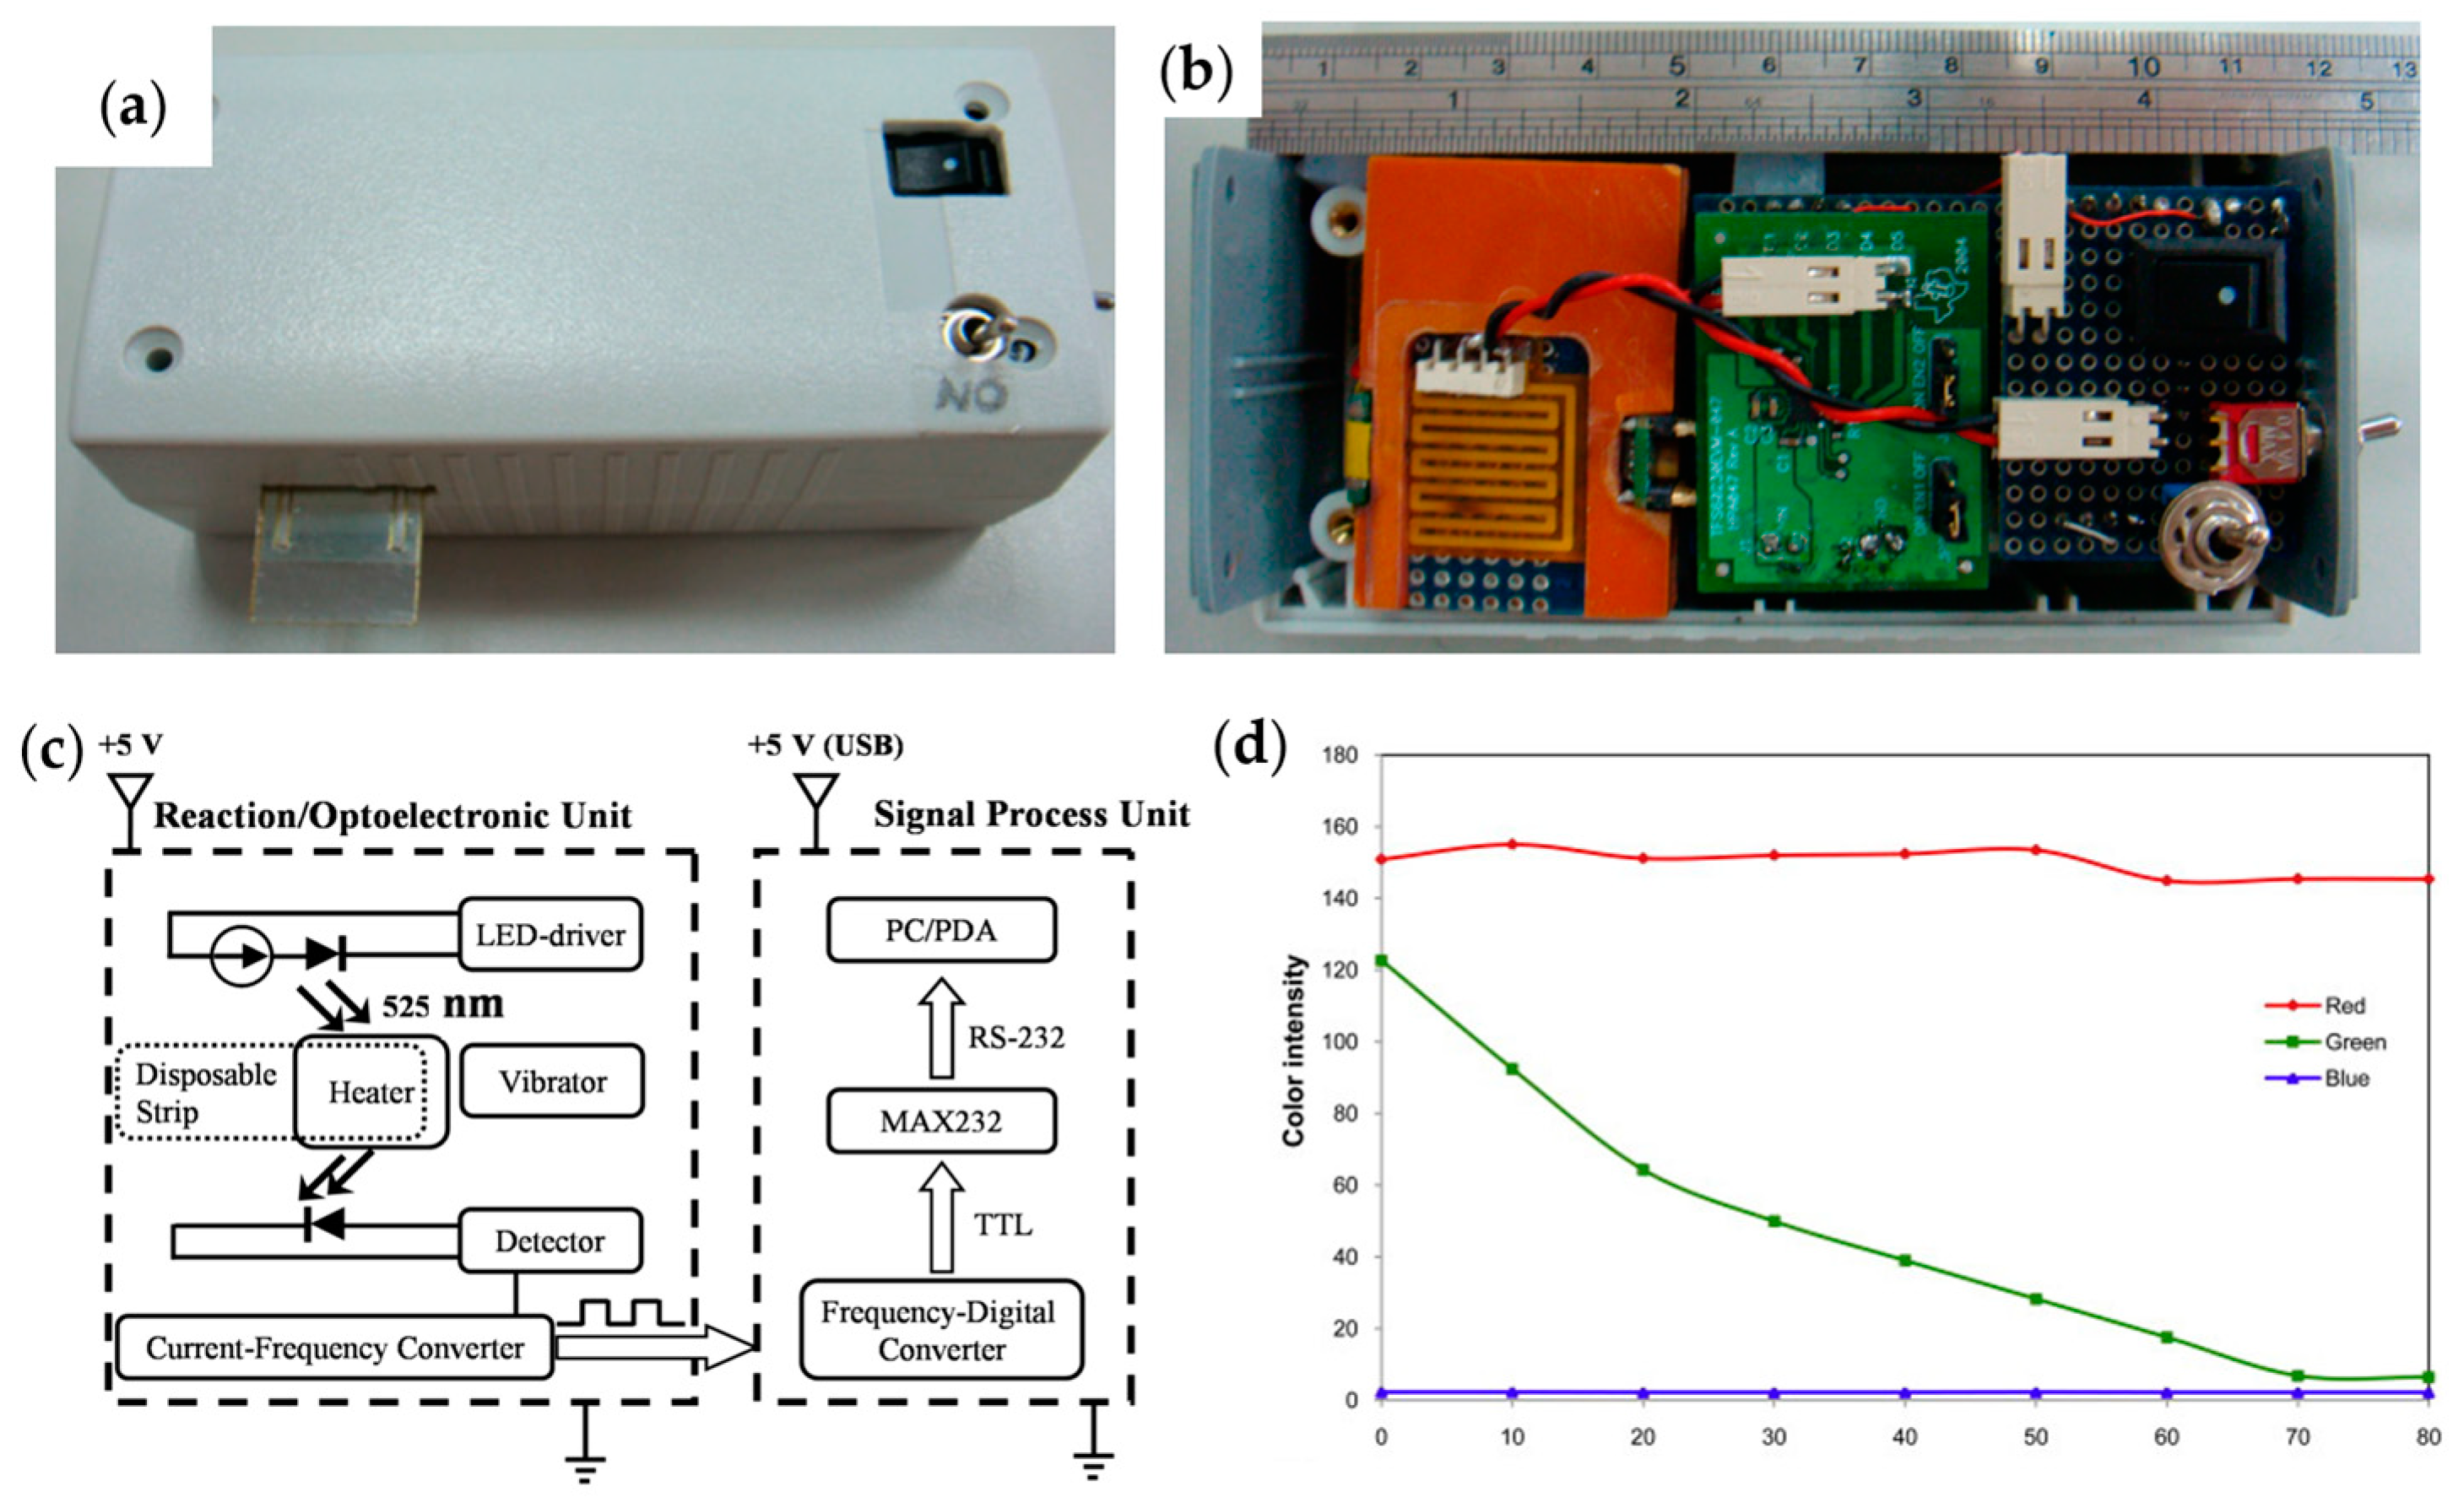
- Hsiao, H.Y.; Chen, R.L.C.; Chou, C.C.; Cheng, T.J. Hand-held Colorimetry Sensor Platform for Determining Salivary -Amylase Activity and Its Applications for Stress Assessment. Sensors 2019, 19, 1571. [Google Scholar] [CrossRef] [PubMed]
- Thongprajukaew, K.; Choodum, A.; Sa-E, B.; Hayee, U. Smart phone: A popular device supports amylase activity assay in fisheries research. Food Chem. 2014, 163, 87–91. [Google Scholar] [CrossRef] [PubMed]
- Dangkulwanich, M.; Kongnithigarn, K.; Aurnoppakhun, N. Colorimetric Measurements of Amylase Activity: Improved Accuracy and Efficiency with a Smartphone. J. Chem. Educ. 2018, 95, 141–145. [Google Scholar] [CrossRef]
- Ishikawa-Ankerhold, H.C.; Ankerhold, R.; Drummen, G.P.C. Advanced Fluorescence Microscopy Techniques-FRAP, FLIP, FLAP, FRET and FLIM. Molecules 2012, 17, 4047–4132. [Google Scholar] [CrossRef]
- Wang, X.; Tang, Y.; Qin, Y.; Zhang, P.; Zhang, D.; Xue, K.; Cao, Y.; Qi, Z. Rational design of water-soluble supramolecular AIEgen with ultra-high quantum yield, and its application in α-amylase activity detection and wash-free lysosome imaging. Chem. Eng. J. 2022, 448, 137632. [Google Scholar] [CrossRef]
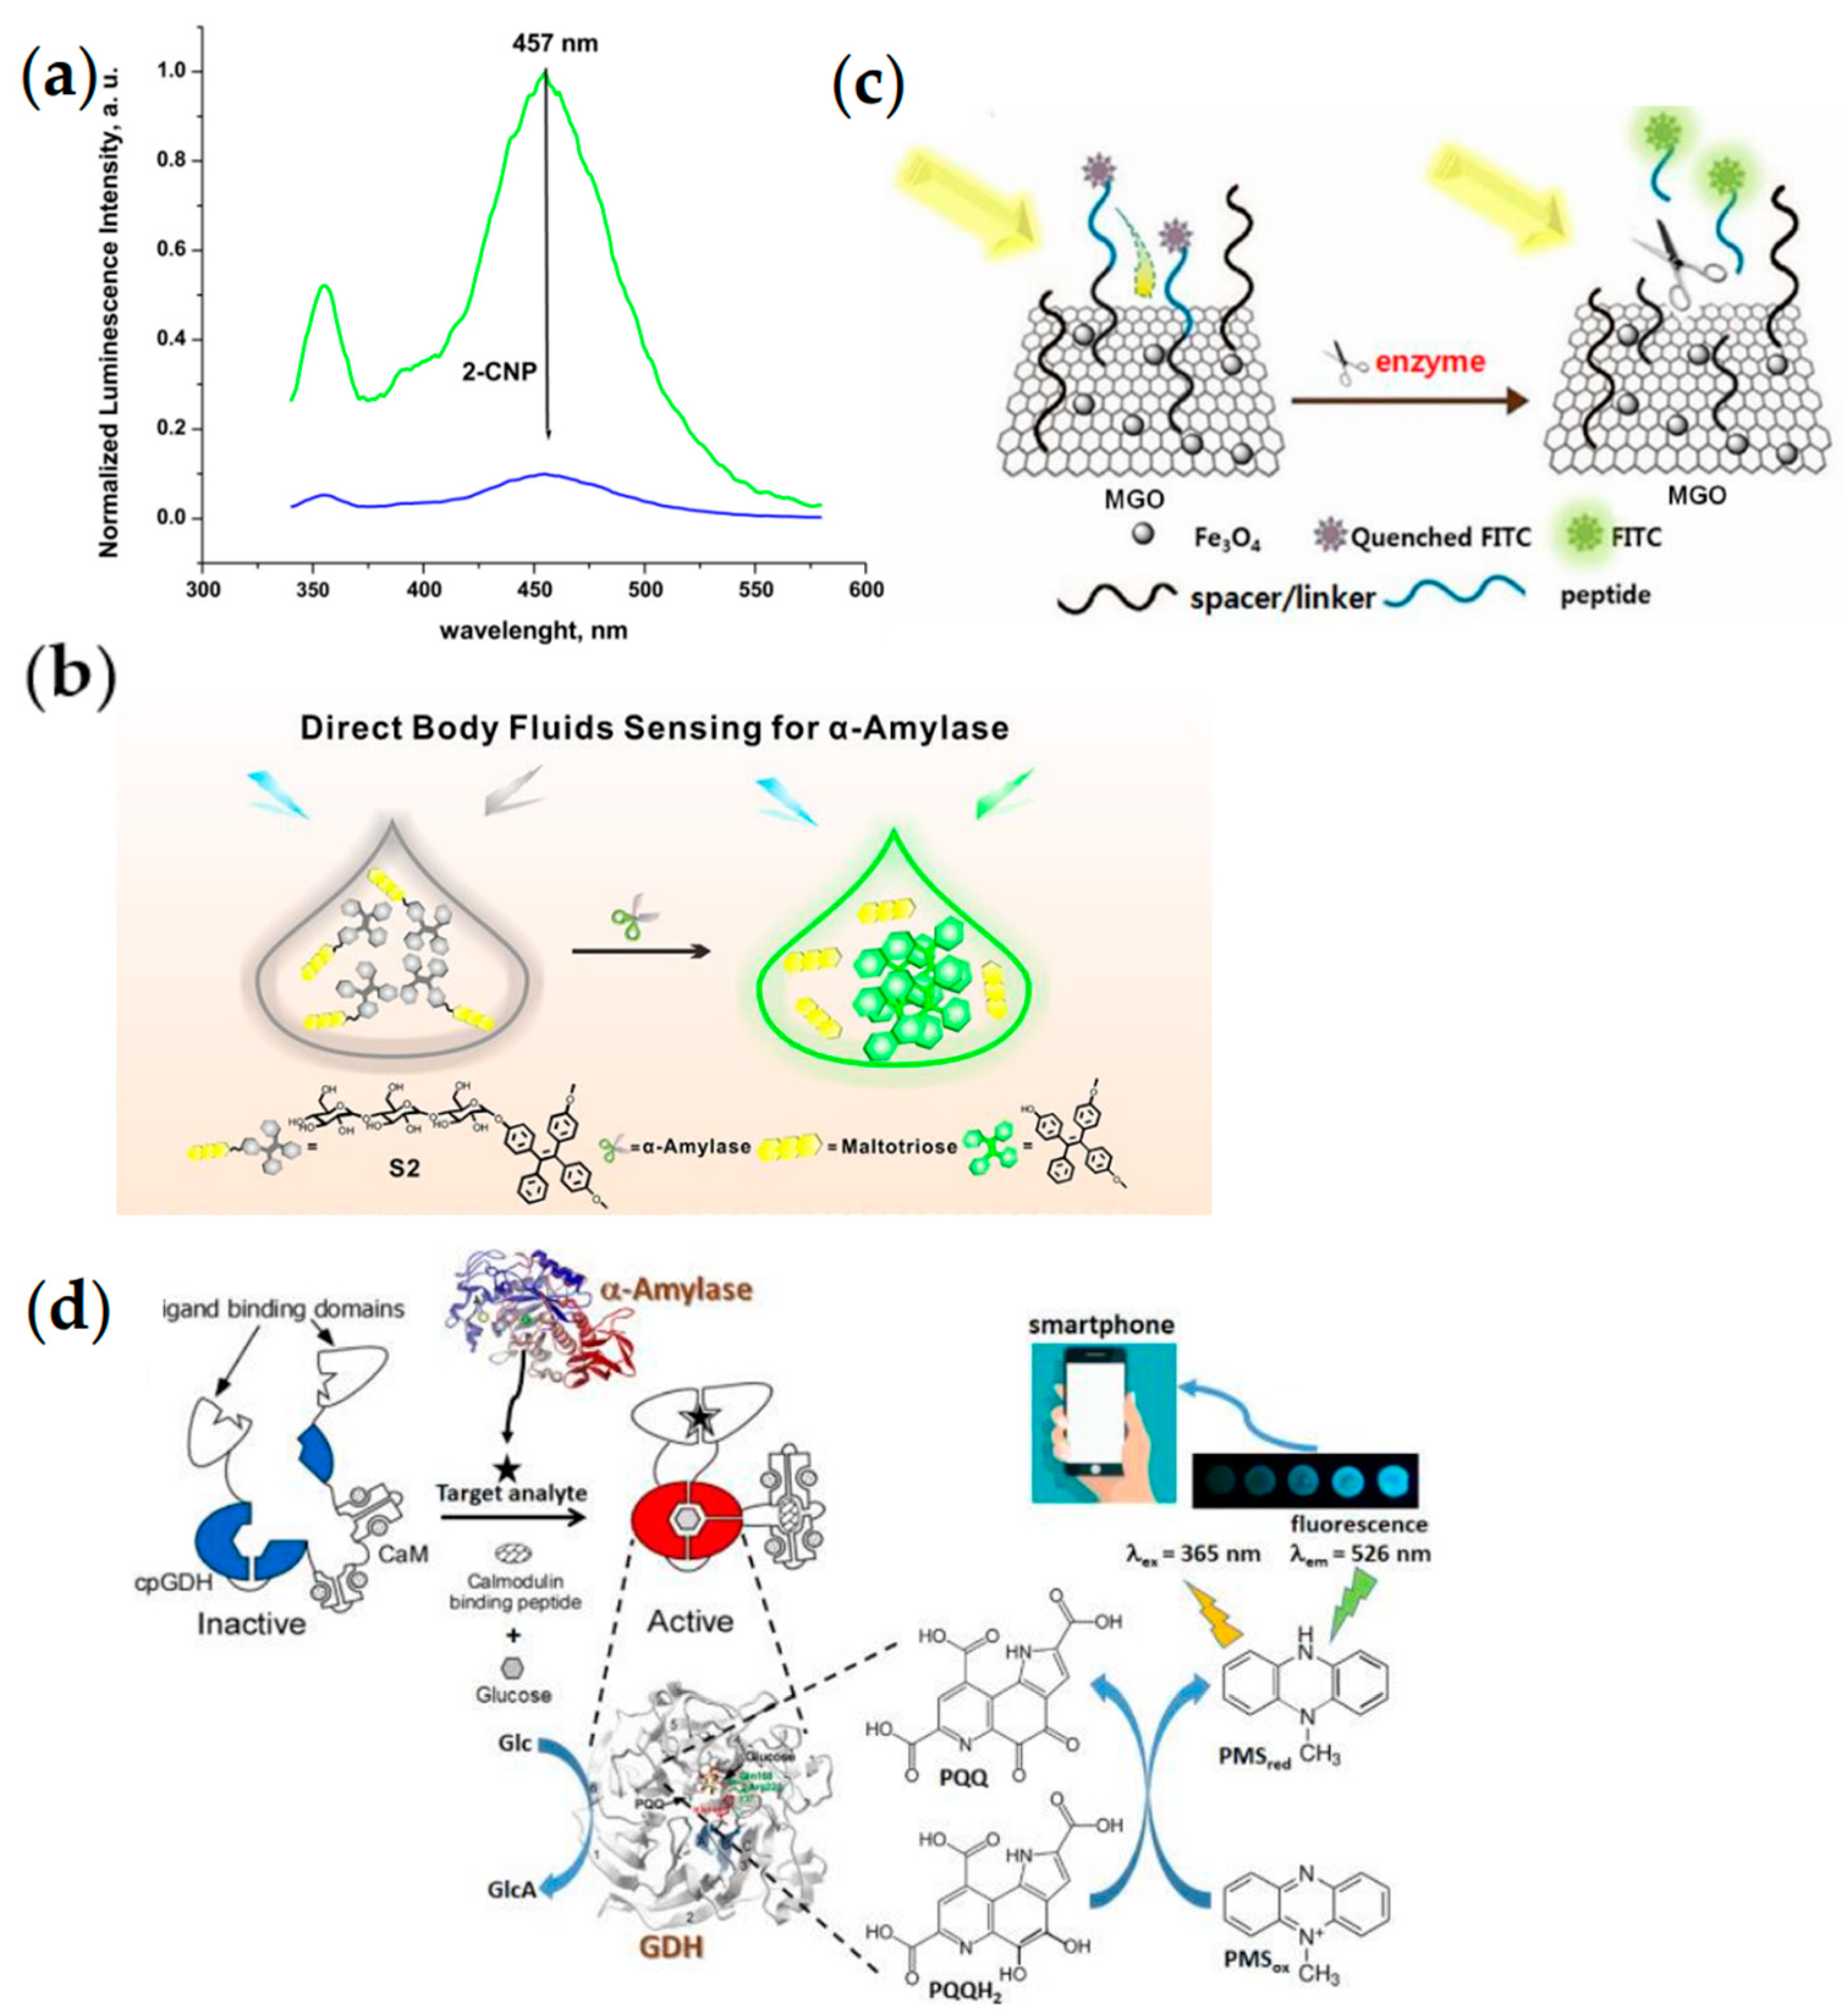
- Shi, J.; Deng, Q.; Li, Y.; Zheng, M.; Chai, Z.; Wan, C.; Zheng, Z.; Li, L.; Huang, F.; Tang, B. A Rapid and Ultrasensitive Tetraphenylethylene-Based Probe with Aggregation-Induced Emission for Direct Detection of α-Amylase in Human Body Fluids. Anal. Chem. 2018, 90, 13775–13782. [Google Scholar] [CrossRef]
- Li, Y.; Peng, Y.; Liu, W.; Fan, Y.; Wu, Y.; Li, X.; Fan, X. Hierarchical Self-Assembly of Amino Acid Derivatives into Enzyme-Responsive Luminescent Gel. Chemosensors 2017, 5, 6. [Google Scholar] [CrossRef]
- Attia, M.S.; Zoulghena, H.; Abdel-Mottaleb, M.S.A. A new nano-optical sensor thin film cadmium sulfide doped in sol-gel matrix for assessment of alpha-amylase activity in human saliva. Analyst 2014, 139, 793–800. [Google Scholar] [CrossRef]
- Attia, M.S.; Al-Radadi, N.S. Progress of pancreatitis disease biomarker alpha amylase enzyme by new nano optical sensor. Biosens. Bioelectron. 2016, 86, 413–419. [Google Scholar] [CrossRef]
- Kim, S.; Lee, S.-M.; Yoon, J.P.; Lee, N.; Chung, J.; Chung, W.-J.; Shin, D.-S. Robust Magnetized Graphene Oxide Platform for In Situ Peptide Synthesis and FRET-Based Protease Detection. Sensors 2020, 20, 5275. [Google Scholar] [CrossRef] [PubMed]
- Wells, P.K.; Smutok, O.; Guo, Z.; Alexandrov, K.; Katz, E. Fluorometric biosensing of alpha-amylase using an artificial allosteric biosensor immobilized on nanostructured interface. Talanta 2023, 255, 124215. [Google Scholar] [CrossRef] [PubMed]
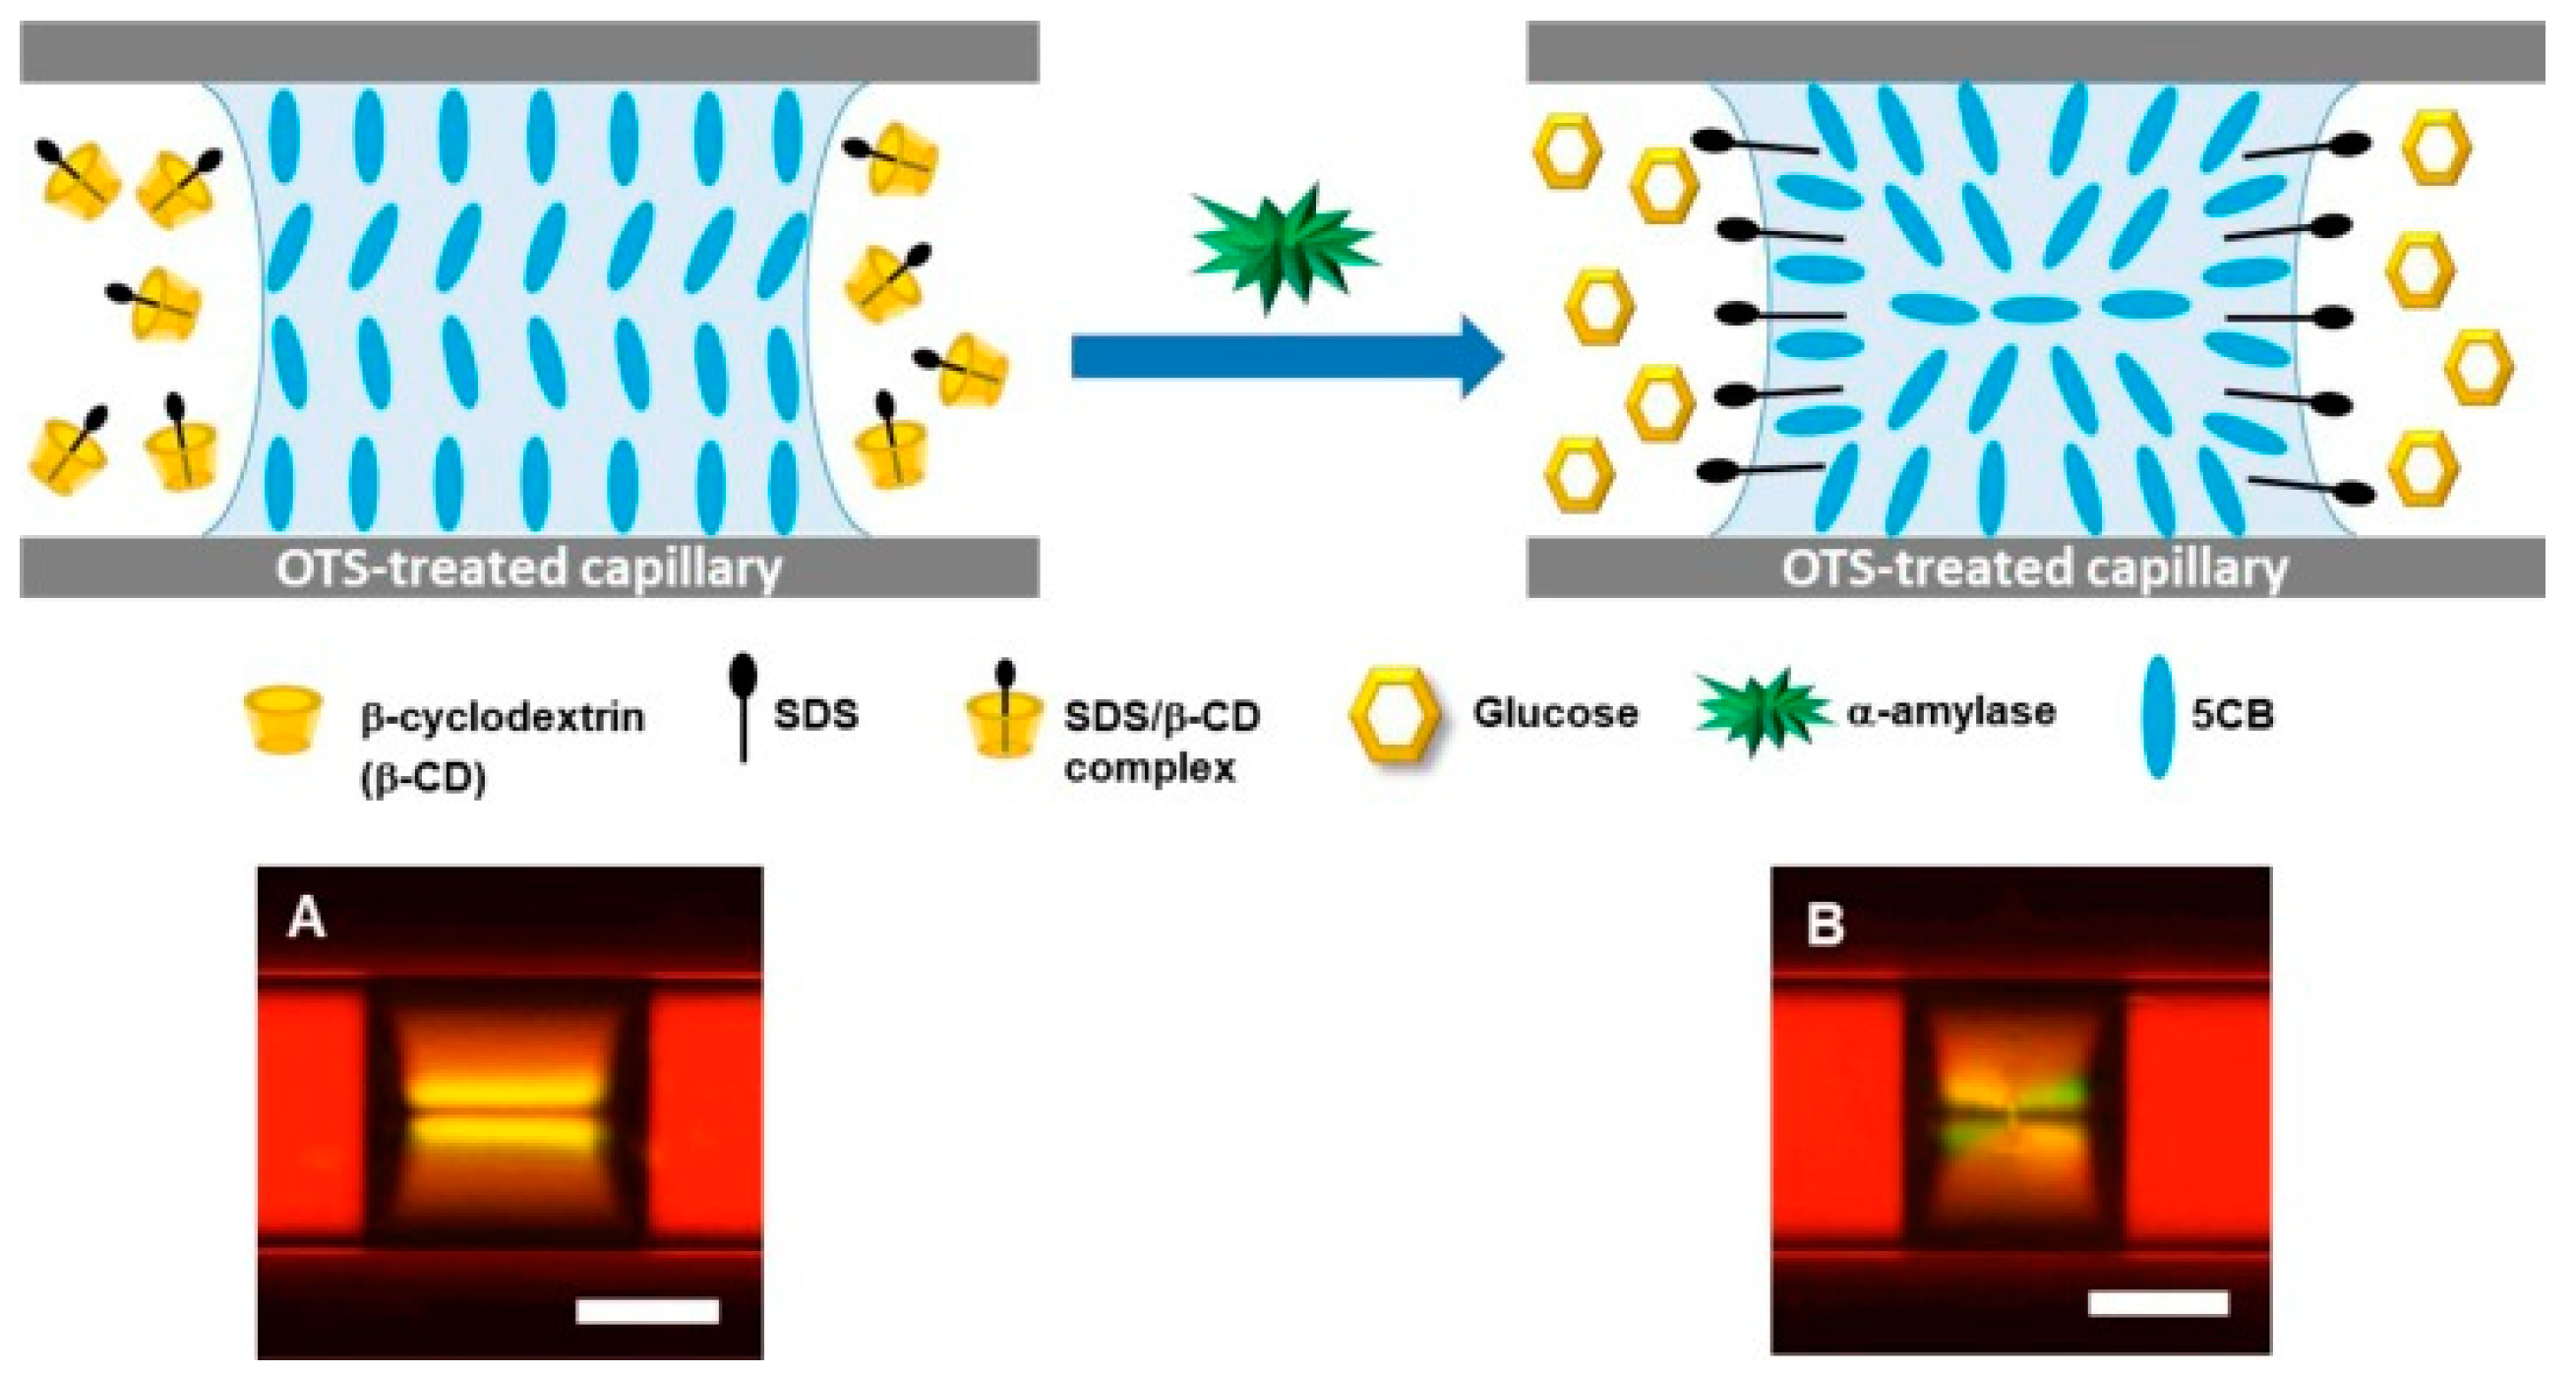
- Pham Thi Kim, H.; Jang, C.-H. Simple, sensitive technique for alpha-amylase detection facilitated by liquid crystal-based microcapillary sensors. Microchem. J. 2021, 162, 105864. [Google Scholar] [CrossRef]
- Homola, J. Surface plasmon resonance sensors for detection of chemical and biological species. Chem. Rev. 2008, 108, 462–493. [Google Scholar] [CrossRef] [PubMed]
- Homola, J.; Yee, S.S.; Gauglitz, G. Surface plasmon resonance sensors: Review. Sens. Actuators B Chem. 1999, 54, 3–15. [Google Scholar] [CrossRef]
- Singh, A.K.; Anwar, M.; Pradhan, R.; Ashar, M.S.; Rai, N.; Dey, S. Surface plasmon resonance based-optical biosensor: Emerging diagnostic tool for early detection of diseases. J. Biophotonics 2023, 16, e202200380. [Google Scholar] [CrossRef]
- Roh, S.; Chung, T.; Lee, B. Overview of the Characteristics of Micro- and Nano-Structured Surface Plasmon Resonance Sensors. Sensors 2011, 11, 1565–1588. [Google Scholar] [CrossRef]
- Pasquardini, L.; Cennamo, N.; Malleo, G.; Vanzetti, L.; Zeni, L.; Bonamini, D.; Salvia, R.; Bassi, C.; Bossi, A.M. A Surface Plasmon Resonance Plastic Optical Fiber Biosensor for the Detection of Pancreatic Amylase in Surgically-Placed Drain Effluent. Sensors 2021, 21, 3443. [Google Scholar] [CrossRef]
- Cennamo, N.; Massarotti, D.; Conte, L.; Zeni, L. Low Cost Sensors Based on SPR in a Plastic Optical Fiber for Biosensor Implementation. Sensors 2011, 11, 11752–11760. [Google Scholar] [CrossRef]
- Teng, C.; Wang, Y.; Yuan, L. Polymer optical fibers based surface plasmon resonance sensors and their applications: A review. Opt. Fiber Technol. 2023, 77, 103256. [Google Scholar] [CrossRef]
- Zhang, X.; Jia, Y.; Fei, Y.; Lu, Y.; Liu, X.; Shan, H.; Huan, Y. Cu/Au nanoclusters with peroxidase-like activity for chemiluminescence detection of alpha-amylase. Anal. Methods 2023, 15, 1553–1558. [Google Scholar] [CrossRef] [PubMed]
- Diltemiz, S.E.; Kecili, R.; Ersoez, A.; Say, R. Molecular Imprinting Technology in Quartz Crystal Microbalance (QCM) Sensors. Sensors 2017, 17, 454. [Google Scholar] [CrossRef] [PubMed]
- Ding, K.; Jia, Z.; Wang, Q.; Tian, N.; Tong, R.; Wang, X. The applications of electrochemical quartz crystal microbalance (EQCM) in recent years. Chem. Res. Appl. 2002, 14, 123–126. [Google Scholar]
- He, J.; Fu, L.; Huang, M.; Lu, Y.; Lv, B.; Zhu, Z.; Fang, J. The development of quartz crystal microbalance. Sci. Sin. Chim. 2011, 41, 1679–1698. [Google Scholar]
- Wei, X.; Wang, G.; Li, A.; Quan, Y.; Chen, J.; Wang, R. Application of Electrochemical Quartz Crystal Microbalance. Prog. Chem. 2018, 30, 1701–1721. [Google Scholar] [CrossRef]
- Yuan, H.Y.; Ma, C.F.; Liu, G.M.; Zhang, G.Z. Applications of Quartz Crystal Microbalance in Polymer Studies. Acta Polym. Sin. 2021, 52, 806–821. [Google Scholar] [CrossRef]
- Le Guillou-Buffello, D.; Helary, G.; Gindre, M.; Pavon-Djavid, G.; Laugier, P.; Migonney, V. Monitoring cell adhesion processes on bioactive polymers with the quartz crystal resonator technique. Biomaterials 2005, 26, 4197–4205. [Google Scholar] [CrossRef]
- Poturnayova, A.; Karpisova, I.; Castillo, G.; Mezo, G.; Kocsis, L.; Csampai, A.; Keresztes, Z.; Hianik, T. Detection of plasmin based on specific peptide substrate using acoustic transducer. Sens. Actuators B Chem. 2016, 223, 591–598. [Google Scholar] [CrossRef]
- Xiong, W.; Baker, M.D. Electrochemistry of zeolites on thickness shear mode oscillators. J. Phys. Chem. B 2005, 109, 13590–13596. [Google Scholar] [CrossRef]
- Della Ventura, B.; Sakac, N.; Funari, R.; Velotta, R. Flexible immunosensor for the detection of salivary alpha-amylase in body fluids. Talanta 2017, 174, 52–58. [Google Scholar] [CrossRef]
- Zhao, M.; Luo, L.; Guo, Y.; Zhao, B.; Chen, X.; Shi, X.; Khan, M.; Lin, J.-M.; Hu, Q. Viscosity-Based Flow Sensor on Paper for Quantitative and Label-Free Detection of alpha-Amylase and Its Inhibitor. ACS Sens. 2022, 7, 593–600. [Google Scholar] [CrossRef]
- Bhattacharjee, M.; Middya, S.; Escobedo, P.; Chaudhuri, J.; Bandyopadhyay, D.; Dahiya, R. Microdroplet based disposable sensor patch for detection of alpha-amylase in human blood serum. Biosens. Bioelectron. 2020, 165, 112333. [Google Scholar] [CrossRef]
- Mandal, N.; Bhattacharjee, M.; Chattopadhyay, A.; Bandyopadhyay, D. Point-of-care-testing of alpha-amylase activity in human blood serum. Biosens. Bioelectron. 2019, 124, 75–81. [Google Scholar] [CrossRef]
- Cardoso, S.; Leitao, D.C.; Dias, T.M.; Valadeiro, J.; Silva, M.D.; Chicharo, A.; Silverio, V.; Gaspar, J.; Freitas, P.P. Challenges and trends in magnetic sensor integration with microfluidics for biomedical applications. J. Phys. D-Appl. Phys. 2017, 50, 213001. [Google Scholar] [CrossRef]
- Murzin, D.; Mapps, D.J.; Levada, K.; Belyaev, V.; Omelyanchik, A.; Panina, L.; Rodionova, V. Ultrasensitive Magnetic Field Sensors for Biomedical Applications. Sensors 2020, 20, 1569. [Google Scholar] [CrossRef] [PubMed]
- Jogschies, L.; Klaas, D.; Kruppe, R.; Rittinger, J.; Taptimthong, P.; Wienecke, A.; Rissing, L.; Wurz, M.C. Recent Developments of Magnetoresistive Sensors for Industrial Applications. Sensors 2015, 15, 28665–28689. [Google Scholar] [CrossRef]
- Weddemann, A.; Ennen, I.; Regtmeier, A.; Albon, C.; Wolff, A.; Eckstaedt, K.; Mill, N.; Peter, M.K.H.; Mattay, J.; Plattner, C.; et al. Review and outlook: From single nanoparticles to self-assembled monolayers and granular GMR sensors. Beilstein J. Nanotechnol. 2010, 1, 75–93. [Google Scholar] [CrossRef] [PubMed]
- Wu, K.; Tonini, D.; Liang, S.; Saha, R.; Chugh, V.K.; Wang, J.-P. Giant Magnetoresistance Biosensors in Biomedical Applications. ACS Appl. Mater. Interfaces 2022, 14, 9945–9969. [Google Scholar] [CrossRef]
- Mabarroh, N.M.; Alfansuri, T.; Wibowo, N.A.; Istiqomah, N.I.; Tumbelaka, R.M.; Suharyadi, E. Detection of green-synthesized magnetite nanoparticles using spin-valve GMR-based sensor and their potential as magnetic labels. J. Magn. Magn. Mater. 2022, 560, 169645. [Google Scholar] [CrossRef]
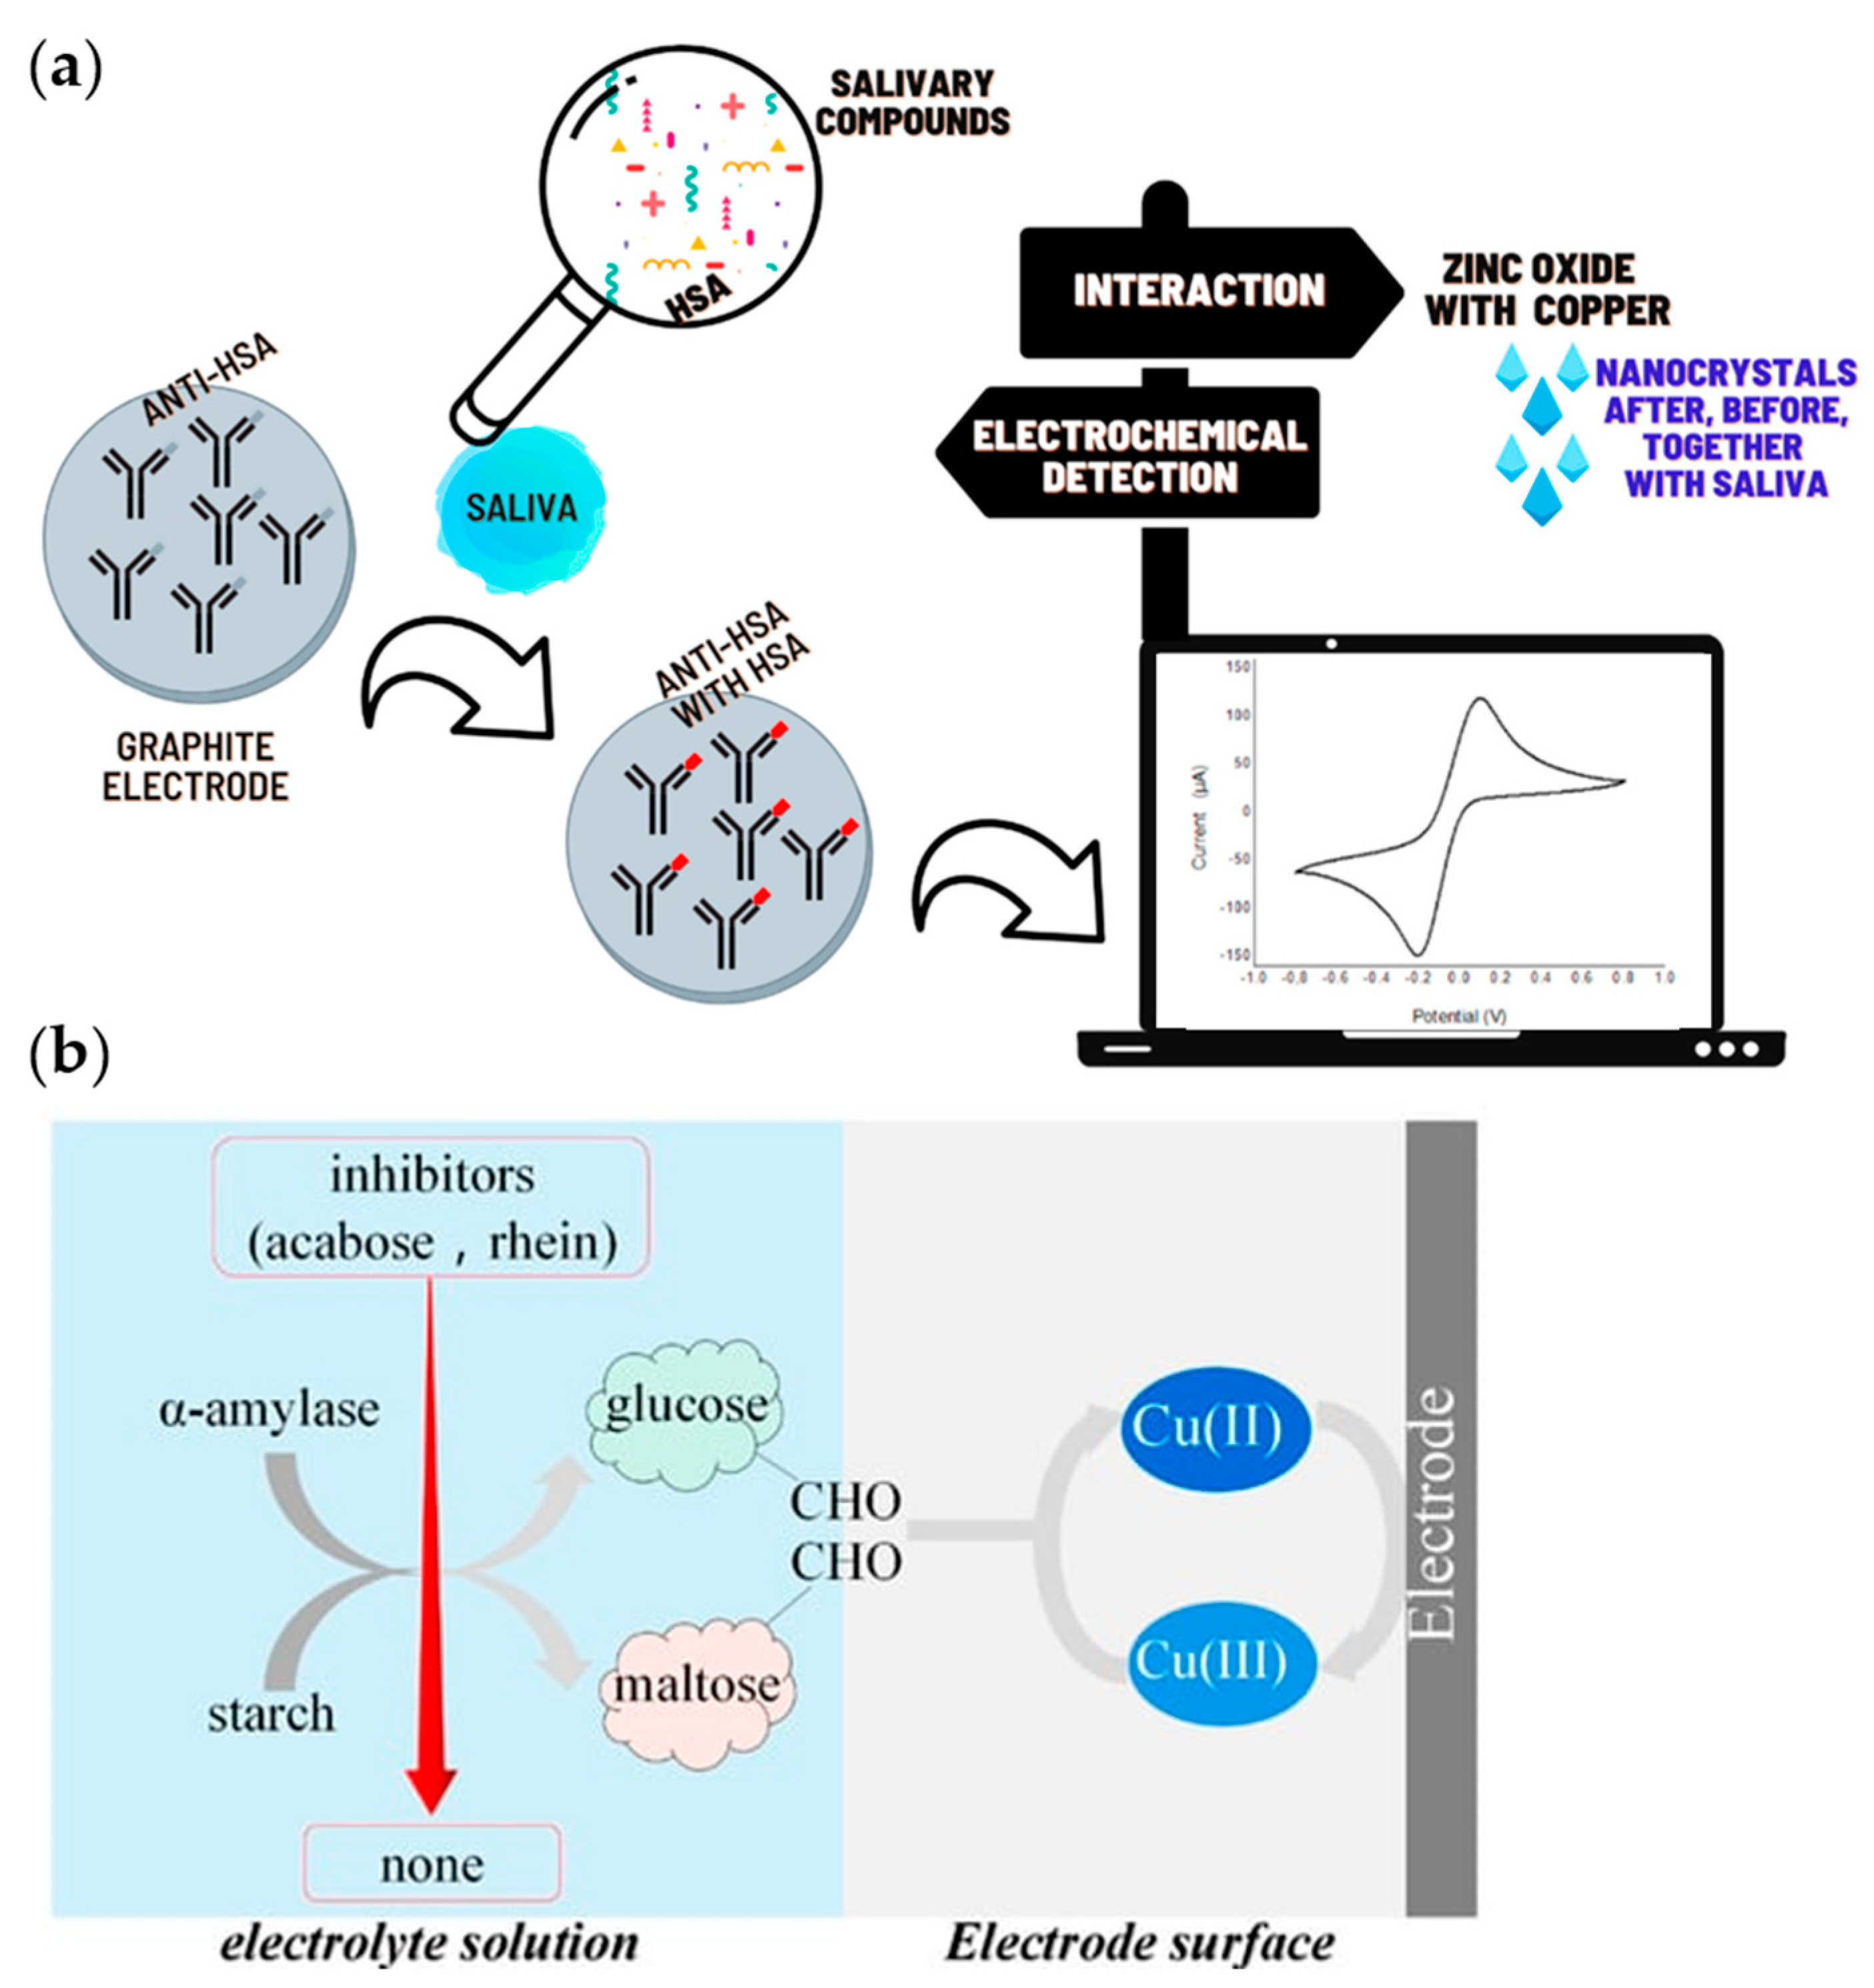
- Martins, B.R.; Sampaio, T.M.; de Farias, A.K.S.R.; Martins, R.d.P.; Teixeira, R.R.; Oliveira, R.T.S.; Oliveira, C.J.F.; da Silva, M.V.; Rodrigues, V.; Dantas, N.O.; et al. Immunosensor Based on Zinc Oxide Nanocrystals Decorated with Copper for the Electrochemical Detection of Human Salivary Alpha-Amylase. Micromachines 2021, 12, 657. [Google Scholar] [CrossRef]
- Teixeira, S.R.; Lloyd, C.; Yao, S.; Gazze, A.S.; Whitaker, I.S.; Francis, L.; Conlan, R.S.; Azzopardi, E. Polyaniline-graphene based alpha-amylase biosensor with a linear dynamic range in excess of 6 orders of magnitude. Biosens. Bioelectron. 2016, 85, 395–402. [Google Scholar] [CrossRef] [PubMed]
- Li, M.; Yin, X.; Shan, H.; Meng, C.; Chen, S.; Yan, Y. The Facile Preparation of PBA-GO-CuO-Modified Electrochemical Biosensor Used for the Measurement of alpha-Amylase Inhibitors’ Activity. Molecules 2022, 27, 2395. [Google Scholar] [CrossRef] [PubMed]
- Garcia, P.T.; Guimaraes, L.N.; Dias, A.A.; Ulhoa, C.J.; Coltro, W.K.T. Amperometric detection of salivary alpha-amylase on screen-printed carbon electrodes as a simple and inexpensive alternative for point-of-care testing. Sens. Actuators B Chem. 2018, 258, 342–348. [Google Scholar] [CrossRef]
- Mahosenaho, M.; Caprio, F.; Micheli, L.; Sesay, A.M.; Palleschi, G.; Virtanen, V. A disposable biosensor for the determination of alpha-amylase in human saliva. Microchim. Acta 2010, 170, 243–249. [Google Scholar] [CrossRef]
- Sun, M.; Ma, B.; Yuan, S.; Xin, L.F.; Zhao, C.; Liu, H. Mercury thermometer-inspired test strip for concentration cell-based potentiometric detection of salivary alpha-amylase. Anal. Chim. Acta 2022, 1206, 339770. [Google Scholar] [CrossRef] [PubMed]
- Zhang, L.; Yang, W.; Yang, Y.; Liu, H.; Gu, Z. Smartphone-based point-of-care testing of salivary alpha-amylase for personal psychological measurement. Analyst 2015, 140, 7399–7406. [Google Scholar] [CrossRef] [PubMed]
- Wang, Q.; Wang, H.; Yang, X.; Wang, K.; Liu, R.; Li, Q.; Ou, J. A sensitive one-step method for quantitative detection of alpha-amylase in serum and urine using a personal glucose meter. Analyst 2015, 140, 1161–1165. [Google Scholar] [CrossRef]
- Casey, D.G.; Price, J. The sensitivity and specificity of the RSID (TM)-saliva kit for the detection of human salivary amylase in the Forensic Science Laboratory, Dublin, Ireland. Forensic Sci. Int. 2010, 194, 67–71. [Google Scholar] [CrossRef]
- Grant, B.D.; Anderson, C.E.; Williford, J.R.; Alonzo, L.F.; Glukhova, V.A.; Boyle, D.S.; Weigl, B.H.; Nichols, K.P. SARS-CoV-2 Coronavirus Nucleocapsid Antigen-Detecting Half-Strip Lateral Flow Assay Toward the Development of Point of Care Tests Using Commercially Available Reagents. Anal. Chem. 2020, 92, 11305–11309. [Google Scholar] [CrossRef]
- Haupt, K.; Mosbach, K. Molecularly imprinted polymers and their use in biomimetic sensors. Chem. Rev. 2000, 100, 2495–2504. [Google Scholar] [CrossRef]
- Freire, E.; Mayorga, O.L.; Straume, M. Isothermal Titration Calorimetry. Anal. Chem. 1990, 62, A950–A959. [Google Scholar] [CrossRef]
- Siddiqui, K.S.; Poljak, A.; Ertan, H.; Bridge, W. The use of isothermal titration calorimetry for the assay of enzyme activity: Application in higher education practical classes. Biochem. Mol. Biol. Educ. 2022, 50, 519–526. [Google Scholar] [CrossRef] [PubMed]
- Zhang, N.; Yang, G. alpha-amylase detection methods and applications. Sheng Wu Gong Cheng Xue Bao = Chin. J. Biotechnol. 2023, 39, 898–911. [Google Scholar] [CrossRef]
- Lehoczki, G.; Kandra, L.; Gyemant, G. The use of starch azure for measurement of alpha-amylase activity. Carbohydr. Polym. 2018, 183, 263–266. [Google Scholar] [CrossRef]
- Lehoczki, G.; Szabo, K.; Takacs, I.; Kandra, L.; Gyemant, G. Simple ITC method for activity and inhibition studies on human salivary alpha-amylase. J. Enzym. Inhib. Med. Chem. 2016, 31, 1648–1653. [Google Scholar] [CrossRef]
- Pilvenyte, G.; Ratautaite, V.; Boguzaite, R.; Samukaite-Bubniene, U.; Plausinaitis, D.; Ramanaviciene, A.; Bechelany, M.; Ramanavicius, A. Molecularly imprinted polymers for the recognition of biomarkers of certain neurodegenerative diseases. J. Pharm. Biomed. Anal. 2023, 228, 115343. [Google Scholar] [CrossRef]
- Rebelo, T.S.C.R.; Miranda, I.M.; Brandão, A.T.S.C.; Sousa, L.I.G.; Ribeiro, J.A.; Silva, A.F.; Pereira, C.M. A Disposable Saliva Electrochemical MIP-Based Biosensor for Detection of the Stress Biomarker α-Amylase in Point-of-Care Applications. Electrochem 2021, 2, 427–438. [Google Scholar] [CrossRef]
- Yan, R.-Y.; Lin, W.-H.; Lu, T.-L.; Chen, J.-L. Conjugated hypercrosslinked polymers imprinted with 3,5-dinitrosalicylic acid for the fluorescent determination of alpha-amylase activity. Spectrochim. Acta Part A Mol. Biomol. Spectrosc. 2023, 291, 122383. [Google Scholar] [CrossRef]
- Arakawa, M.; Yoshida, A.; Okamura, S.; Ebina, H.; Morita, E. A highly sensitive NanoLuc-based protease biosensor for detecting apoptosis and SARS-CoV-2 infection. Sci. Rep. 2023, 13, 1753. [Google Scholar] [CrossRef]
- Kaur, J.; Malegaonkar, J.N.; Bhosale, S.V.; Singh, P.K. An anionic tetraphenyl ethylene based simple and rapid fluorescent probe for detection of trypsin and paraoxon methyl. J. Mol. Liq. 2021, 333, 115980. [Google Scholar] [CrossRef]
- Cai, Y.; Dong, T.; Zhang, X.; Liu, A. Morphology and Enzyme-Mimicking Activity of Copper Nanoassemblies Regulated by Peptide: Mechanism, Ultrasensitive Assaying of Trypsin, and Screening of Trypsin Inhibitors. Anal. Chem. 2022, 94, 18099–18106. [Google Scholar] [CrossRef] [PubMed]
- Zhang, L.; Du, J. A sensitive and label-free trypsin colorimetric sensor with cytochrome c as a substrate. Biosens. Bioelectron. 2016, 79, 347–352. [Google Scholar] [CrossRef] [PubMed]
- Wu, W.; Xia, S.; Liu, Y.; Ma, C.; Lyu, Z.; Zhao, M.; Ding, S.; Hu, Q. Single-atom catalysts with peroxidase-like activity boost gel-sol transition-based biosensing. Biosens. Bioelectron. 2023, 225, 115112. [Google Scholar] [CrossRef]
- Wang, G.-L.; Jin, L.-Y.; Dong, Y.-M.; Wu, X.-M.; Li, Z.-J. Intrinsic enzyme mimicking activity of gold nanoclusters upon visible light triggering and its application for colorimetric trypsin detection. Biosens. Bioelectron. 2015, 64, 523–529. [Google Scholar] [CrossRef] [PubMed]
- Luo, Q.; Tian, M.; Luo, F.; Zhao, M.; Lin, C.; Qiu, B.; Wang, J.; Lin, Z. Multicolor Biosensor for Trypsin Detection Based on the Regulation of the Peroxidase Activity of Bovine Serum Albumin-Coated Gold Nanoclusters and Etching of Gold Nanobipyramids. Anal. Chem. 2023, 95, 2390–2397. [Google Scholar] [CrossRef] [PubMed]
- Lin, X.; Zhu, Z.; Zhao, C.; Li, S.; Liu, Q.; Liu, A.; Lin, L.; Lin, X. Robust oxidase mimicking activity of protamine-stabilized platinum nanoparticles units and applied for colorimetric sensor of trypsin and inhibitor. Sens. Actuators B Chem. 2019, 284, 346–353. [Google Scholar] [CrossRef]
- Lin, X.; Zhu, Z.; Lin, D.; Bao, Q.; Gao, Y.; Liu, Q.; Liu, A.; Lin, L.; Lin, X. Boosting the oxidase-like activity of platinum nanozyme in MBTH-TOOS chromogenic system for detection of trypsin and its inhibitor. Talanta 2021, 234, 122647. [Google Scholar] [CrossRef]
- Chen, X.; Liang, Y. Colorimetric sensing strategy for multiplexed detection of proteins based on three DNA-gold nanoparticle conjugates sensors. Sens. Actuators B Chem. 2021, 329, 129202. [Google Scholar] [CrossRef]
- Liu, L.; Zhang, L.; Liang, Y. A Simple Visual Strategy for Protein Detection Based on Oxidase-Like Activity of Silver Nanoparticles. Food Anal. Methods 2021, 14, 1852–1859. [Google Scholar] [CrossRef]
- Arora, A.; Sharma, K.; Tripathi, S.K. Impact of luminescent MoSe2 quantum dots on activity of trypsin under different pH environment. Spectrochim. Acta Part A Mol. Biomol. Spectrosc. 2023, 302, 122958. [Google Scholar] [CrossRef]
- Liu, W.; Li, H.; Wei, Y.; Dong, C. A label-free phosphorescence sensing platform for trypsin based on Mn-ZnS QDs. RSC Adv. 2017, 7, 26930–26934. [Google Scholar] [CrossRef]
- Zhuo, C.-X.; Wang, L.-H.; Feng, J.-J.; Zhang, Y.-D. Label-Free Fluorescent Detection of Trypsin Activity Based on DNA-Stabilized Silver Nanocluster-Peptide Conjugates. Sensors 2016, 16, 1477. [Google Scholar] [CrossRef] [PubMed]
- Jingjing, W.; Manning, W.; Jie, G.; Meixian, G.; Ya, Y. Preparation of AgInS2 quantum dots and their application for trypsin detection. J. Mater. Sci. Mater. Electron. 2021, 32, 26490–26502. [Google Scholar]
- Milicevic, D.; Hlavac, J. Triple-FRET multi-purpose fluorescent probe for three-protease detection. RSC Adv. 2022, 12, 28780–28787. [Google Scholar] [CrossRef]
- Hu, L.; Han, S.; Parveen, S.; Yuan, Y.; Zhang, L.; Xu, G. Highly sensitive fluorescent detection of trypsin based on BSA-stabilized gold nanoclusters. Biosens. Bioelectron. 2012, 32, 297–299. [Google Scholar] [CrossRef]
- Qu, F.; Wang, Z.; Li, C.; Jiang, D.; Zhao, X.-E. Peptide cleavage-mediated aggregation-enhanced emission from metal nanoclusters for detecting trypsin and screen its inhibitors from foods. Sens. Actuators B Chem. 2022, 359, 131610. [Google Scholar] [CrossRef]
- Xue, F.; Qu, F.; Han, W.; Xia, L.; You, J. Aggregation-induced emission enhancement of gold nanoclusters triggered by silicon nanoparticles for ratiometric detection of protamine and trypsin. Anal. Chim. Acta 2019, 1046, 170–178. [Google Scholar] [CrossRef]
- Zhao, D.; Chen, C.; Zhao, J.; Sun, J.; Yang, X. Label-free fluorescence turn-on strategy for trypsin activity based on thiolate-protected gold nanoclusters with bovine serum albumin as the substrate. Sens. Actuators B Chem. 2017, 247, 392–399. [Google Scholar] [CrossRef]
- Zheng, X.; Chen, S.; Fu, B.; Cao, Y.; Li, H.; Wang, F.; Pan, Q. Improved sensitivity of gold nanoclusters toward trypsin under synergistic adsorption of CdTe quantum dots. Microchem. J. 2023, 187, 108457. [Google Scholar] [CrossRef]
- Zhou, J.; Zhang, F.; Zhao, R.; Liu, S.; Li, W.; He, F.; Gai, S.; Yang, P. A novel “off-on-off” fluorescent sensor based on inner filter effect for ultrasensitive detection of protamine/trypsin and subcellular colocalization. Sens. Actuators B Chem. 2021, 340, 129930. [Google Scholar] [CrossRef]
- Hou, S.; Feng, T.; Zhao, N.; Zhang, J.; Wang, H.; Liang, N.; Zhao, L. A carbon nanoparticle-peptide fluorescent sensor custom-made for simple and sensitive detection of trypsin. J. Pharm. Anal. 2020, 10, 482–489. [Google Scholar] [CrossRef] [PubMed]
- Poon, C.-Y.; Li, Q.; Zhang, J.; Li, Z.; Dong, C.; Lee, A.W.-M.; Chan, W.-H.; Li, H.-W. FRET-based modified graphene quantum dots for direct trypsin quantification in urine. Anal. Chim. Acta 2016, 917, 64–70. [Google Scholar] [CrossRef] [PubMed]
- Wu, M.; Wang, X.; Wang, K.; Guo, Z. An ultrasensitive fluorescent nanosensor for trypsin based on upconversion nanoparticles. Talanta 2017, 174, 797–802. [Google Scholar] [CrossRef] [PubMed]
- Xu, S.; Zhang, F.; Xu, L.; Liu, X.; Ma, P.; Sun, Y.; Wang, X.; Song, D. A fluorescence resonance energy transfer biosensor based on carbon dots and gold nanoparticles for the detection of trypsin. Sens. Actuators B Chem. 2018, 273, 1015–1021. [Google Scholar] [CrossRef]
- Chen, Y.; Lin, Z.; Miao, C.; Cai, Q.; Li, F.; Zheng, Z.; Lin, X.; Zheng, Y.; Weng, S. A simple fluorescence assay for trypsin through a protamine-induced carbon quantum dot-quenching aggregation platform. RSC Adv. 2020, 10, 26765–26770. [Google Scholar] [CrossRef]
- Huang, S.; Yao, J.D.; Ning, G.; Li, B.; Mu, P.P.; Xiao, Q. Ultrasensitive ratiometric fluorescent probes for Hg(ii) and trypsin activity based on carbon dots and metalloporphyrin via a target recycling amplification strategy. Analyst 2022, 147, 1457–1466. [Google Scholar] [CrossRef]
- Chen, S.; Fu, J.; Zhou, S.; Wu, X.; Tang, S.; Zhao, P.; Zhang, Z. An eco-friendly near infrared fluorescence molecularly imprinted sensor based on zeolite imidazolate framework-8 for rapid determination of trace trypsin. Microchem. J. 2021, 168, 106449. [Google Scholar] [CrossRef]
- Giel, M.C.; Zhang, S.X.; Hu, Q.; Ding, D.; Tang, Y.H.; Hong, Y.N. Synthesis of a beta-Arylethenesulfonyl Fluoride-Functionalized AlEgen for Activity-Based Urinary Trypsin Detection. ACS Appl. Bio Mater. 2022, 5, 4321–4326. [Google Scholar] [CrossRef]
- Sun, W.; Zhang, F.; Wang, M.; Wang, N.; Wang, G.; Su, X. A ratiometric fluorescence strategy based on polyethyleneimine surface-modified carbon dots and Eosin Y for the ultrasensitive determination of protamine and trypsin. Analyst 2022, 147, 677–684. [Google Scholar] [CrossRef]
- Park, T.; Han, M.; Schanze, K.S.S.; Lee, S.H. Ultrasensitive Determination of Trypsin in Human Urine Based on Amplified Fluorescence Response. ACS Sens. 2023, 8, 2591–2597. [Google Scholar] [CrossRef]
- Li, F.; Chen, Y.; Lin, R.; Miao, C.; Ye, J.; Cai, Q.; Huang, Z.; Zheng, Y.; Lin, X.; Zheng, Z.; et al. Integration of fluorescent polydopamine nanoparticles on protamine for simple and sensitive trypsin assay. Anal. Chim. Acta 2021, 1148, 338201. [Google Scholar] [CrossRef] [PubMed]
- Gu, P.; Lu, Y.; Li, S.; Ma, C. A Label-Free Fluorescence Aptasensor Based on G-Quadruplex/Thioflavin T Complex for the Detection of Trypsin. Molecules 2022, 27, 6093. [Google Scholar] [CrossRef]
- Duan, X.; Li, N.; Wang, G.; Su, X. High sensitive ratiometric fluorescence analysis of trypsin and dithiothreitol based on WS2 QDs. Talanta 2020, 219, 121171. [Google Scholar] [CrossRef]
- Ou, L.-J.; Li, X.-Y.; Li, L.-J.; Liu, H.-W.; Sun, A.-M.; Liu, K.-J. A sensitive assay for trypsin using poly(thymine)-templated copper nanoparticles as fluorescent probes. Analyst 2015, 140, 1871–1875. [Google Scholar] [CrossRef] [PubMed]
- Yin, C.; Chen, L.; Niu, N. Nitrogen-doped carbon quantum dots fabricated from cellulolytic enzyme lignin and its application to the determination of cytochrome c and trypsin. Anal. Bioanal. Chem. 2021, 413, 5239–5249. [Google Scholar] [CrossRef] [PubMed]
- Hu, W.; Feng, S.; Pei, F.; Du, B.; Liu, B.; Mu, X.; Tong, Z. A novel smartphone-integrated binary-emission molecularly imprinted fluorescence sensor embedded with MIL-101(Cr) for sensitive and real-time detection of protein. Talanta 2023, 260, 124563. [Google Scholar] [CrossRef]
- Manmana, Y.; Kubo, T.; Otsuka, K. Protein Determination by Distance and Color Changing via PEG-Based Hydrogels. Chromatography 2023, 44, 27–32. [Google Scholar] [CrossRef]
- Zhao, L.; Wang, T.; Wu, Q.; Liu, Y.; Chen, Z.; Li, X. Fluorescent Strips of Electrospun Fibers for Ratiometric Sensing of Serum Heparin and Urine Trypsin. ACS Appl. Mater. Interfaces 2017, 9, 3400–3410. [Google Scholar] [CrossRef]
- Hu, Q.-Z.; Jang, C.-H. Imaging Trypsin Activity through Changes in the Orientation of Liquid Crystals Coupled to the Interactions between a Polyelectrolyte and a Phospholipid Layer. ACS Appl. Mater. Interfaces 2012, 4, 1791–1795. [Google Scholar] [CrossRef]
- Ping, J.; Qi, L.; Wang, Q.; Liu, S.; Jiang, Y.; Yu, L.; Lin, J.-M.; Hu, Q. An integrated liquid crystal sensing device assisted by the surfactant-embedded smart hydrogel. Biosens. Bioelectron. 2021, 187, 113313. [Google Scholar] [CrossRef]
- Mayer, K.M.; Hafner, J.H. Localized Surface Plasmon Resonance Sensors. Chem. Rev. 2011, 111, 3828–3857. [Google Scholar] [CrossRef] [PubMed]
- Willets, K.A.; Van Duyne, R.P. Localized surface plasmon resonance spectroscopy and sensing. Annu. Rev. Phys. Chem. 2007, 58, 267–297. [Google Scholar] [CrossRef] [PubMed]
- Miao, P.; Liu, T.; Li, X.; Ning, L.; Yin, J.; Han, K. Highly sensitive, label-free colorimetric assay of trypsin using silver nanoparticles. Biosens. Bioelectron. 2013, 49, 20–24. [Google Scholar] [CrossRef]
- Guo, Q.; Zhou, J.; Hu, K.; He, Y.; Huang, K.; Chen, P. Enzymatic reaction modulated gold nanoparticle aggregation-induced photothermal and smartphone readable colorimetry dual-mode biosensing platform for trypsin detection in clinical samples. Sens. Actuators B Chem. 2023, 374, 132841. [Google Scholar] [CrossRef]
- Dutta, S.; Saikia, K.; Nath, P. Smartphone based LSPR sensing platform for bio-conjugation detection and quantification. RSC Adv. 2016, 6, 21871–21880. [Google Scholar] [CrossRef]
- Liu, H.; Yin, H.; Dong, Y.; Ding, H.; Chu, X. Electrochemiluminescence resonance energy transfer between luminol and black phosphorus nanosheets for the detection of trypsin via the “off-on-off” switch mode. Analyst 2020, 145, 2204–2211. [Google Scholar] [CrossRef]
- Dong, Z.-M.; Cheng, L.; Zhang, P.; Zhao, G.-C. Label-free analytical performances of a peptide-based QCM biosensor for trypsin. Analyst 2020, 145, 3329–3338. [Google Scholar] [CrossRef]
- Dizon, M.; Tatarko, M.; Hianik, T. Advances in Analysis of Milk Proteases Activity at Surfaces and in a Volume by Acoustic Methods. Sensors 2020, 20, 5594. [Google Scholar] [CrossRef]
- Piovarci, I.; Melikishvili, S.; Tatarko, M.; Hianik, T.; Thompson, M. Detection of Sub-Nanomolar Concentration of Trypsin by Thickness-Shear Mode Acoustic Biosensor and Spectrophotometry. Biosensors 2021, 11, 117. [Google Scholar] [CrossRef]
- Lee, A.-W.; Cheng, C.-C.; Chang, C.-J.; Lu, C.-H.; Chen, J.-K. Optical assay of trypsin using a one-dimensional plasmonic grating of gelatin-modified poly(methacrylic acid). Microchim. Acta 2020, 187, 1–8. [Google Scholar] [CrossRef]
- Erturk, G.; Hedstrom, M.; Mattiasson, B. A sensitive and real-time assay of trypsin by using molecular imprinting-based capacitive biosensor. Biosens. Bioelectron. 2016, 86, 557–565. [Google Scholar] [CrossRef]
- Palomar, Q.; Svard, A.; Zeng, S.; Hu, Q.; Liu, F.; Aili, D.; Zhang, Z. Detection of gingipain activity using solid state nanopore sensors. Sens. Actuators B Chem. 2022, 368, 132209. [Google Scholar] [CrossRef]
- Zaccheo, B.A.; Crooks, R.M. Self-Powered Sensor for Naked-Eye Detection of Serum Trypsin. Anal. Chem. 2011, 83, 1185–1188. [Google Scholar] [CrossRef] [PubMed]
- Zhou, S.; Wang, L.; Chen, X.; Guan, X. Label-Free Nanopore Single-Molecule Measurement of Trypsin Activity. ACS Sens. 2016, 1, 607–613. [Google Scholar] [CrossRef] [PubMed]
- Yi, Q.; Liu, Q.; Gao, F.; Chen, Q.; Wang, G. Application of an Electrochemical Immunosensor with a MWCNT/PDAA Modified Electrode for Detection of Serum Trypsin. Sensors 2014, 14, 10203–10212. [Google Scholar] [CrossRef]
- Rahmati, Z.; Roushani, M.; Hosseini, H. Amorphous Ni(OH)(2) nano-boxes as a high performance substrate for aptasensor application. Measurement 2022, 189, 110649. [Google Scholar] [CrossRef]
- Hu, J.; Li, Q.; Chen, J.; Chen, S.; Cai, Y.; Zhao, C. A label-free Electrochemical Immunosensor Based on Polythionine-nanogold Nanocomposite for Detection of Trypsin Using screen-printed Electrode. Int. J. Electrochem. Sci. 2022, 17, 220617. [Google Scholar] [CrossRef]
- Ucar, A.; Gonzalez-Fernandez, E.; Stadenni, M.; Avlonstis, N.; Murray, A.F.; Bradley, M.; Mount, A.R. Miniaturisation of a peptide-based electrochemical protease activity sensor using platinum microelectrodes. Analyst 2020, 145, 975–982. [Google Scholar] [CrossRef] [PubMed]
- Adjemian, J.; Anne, A.; Cauet, G.; Demaille, C. Cleavage-Sensing Redox Peptide Monolayers for the Rapid Measurement of the Proteolytic Activity of Trypsin and alpha-Thrombin Enzymes. Langmuir 2010, 26, 10347–10356. [Google Scholar] [CrossRef]
- Barsan, M.M.; Serban, A.; Onea, M.; Wysocka, M.; Lesner, A.; Diculescu, V.C. Synthetic peptide array on gold for the electrochemical assessment of the 20S proteasome activity and effect of inhibitory compounds. Appl. Surf. Sci. 2023, 610, 155620. [Google Scholar] [CrossRef]
- Hu, Q.; Bao, Y.; Gan, S.; Zhang, Y.; Han, D.; Niu, L. Electrochemically controlled grafting of polymers for ultrasensitive electrochemical assay of trypsin activity. Biosens. Bioelectron. 2020, 165, 112358. [Google Scholar] [CrossRef]
- Poma, N.; Vivaldi, F.; Bonini, A.; Biagini, D.; Bottai, D.; Tavanti, A.; Di Francesco, F. Voltammetric sensing of trypsin activity using gelatin as a substrate. Microchem. J. 2023, 190, 108631. [Google Scholar] [CrossRef]
- Shin, J.; Park, K.; Park, S.; Yang, H. Trypsin Detection Using Electrochemical Reduction-based Redox Cycling. Bull. Korean Chem. Soc. 2021, 42, 37–42. [Google Scholar] [CrossRef]
- Choi, D.Y.; Yang, J.C.; Park, J. Optimization and characterization of electrochemical protein Imprinting on hemispherical porous gold patterns for the detection of trypsin. Sens. Actuators B Chem. 2022, 350, 130855. [Google Scholar] [CrossRef]
- Zhao, W.; Li, B.; Xu, S.; Zhu, Y.; Liu, X. A fabrication strategy for protein sensors based on an electroactive molecularly imprinted polymer: Cases of bovine serum albumin and trypsin sensing. Anal. Chim. Acta 2020, 1117, 25–34. [Google Scholar] [CrossRef]
- Carrere, J.; Figarella, C.; Guy, O.; Thouvenot, J.P. Human pancreatic chymotrypsinogen A: A non-competitive enzyme immunoassay, and molecular forms in serum and amniotic fluid. Biochim. Biophys. Acta (BBA)-Gen. Subj. 1986, 883, 46–53. [Google Scholar] [CrossRef]
- Keim, V.; Teich, N.; Moessner, J. Clinical value of a new fecal elastase test for detection of chronic pancreatitis. Clin. Lab. 2003, 49, 209–215. [Google Scholar]
- Liu, L.; Liu, C.; Zhang, B.; Gao, L. Detection of chymotrypsin using a peptide sensor based on graphene oxide modified with sulfhydryl groups and gold nanoparticles. New J. Chem. 2022, 46, 16303–16308. [Google Scholar] [CrossRef]
- Gao, L.; Shi, H.; Liu, C.; Xia, N.; Cheng, J.; Liu, L. The detection of chymotrypsin using peptides covalent bound to the surface of graphene oxide and gold nanoparticles. New J. Chem. 2021, 45, 7946–7950. [Google Scholar] [CrossRef]
- Liu, L.; Liu, C.; Gao, L. Highly Sensitive Detection of Chymotrypsin Based on Metal Organic Frameworks with Peptides Sensors. Biosensors 2023, 13, 263. [Google Scholar] [CrossRef] [PubMed]
- Qu, Y.; Xu, Z.; Wang, J.; Liu, W.; Iqbal, A.; Iqbal, K.; Su, Y.; Cao, Y.; Yang, J.; Qin, W.; et al. Strong red fluorescent probe for detecting chymotrypsin activity in vivo and in vitro. Sens. Actuators B Chem. 2023, 382, 133552. [Google Scholar] [CrossRef]
- Lan, T.; Tian, Q.-Q.; Li, M.-H.; He, W. Activatable endoplasmic reticulum-targeted NIR fluorescent probe with a large Stokes shift for detecting and imaging chymotrypsin. Analyst 2022, 147, 4098–4104. [Google Scholar] [CrossRef] [PubMed]
- Piovarci, I.; Hianik, T.; Ivanov, I.N. Detection of Chymotrypsin by Optical and Acoustic Methods. Biosensors 2021, 11, 63. [Google Scholar] [CrossRef] [PubMed]
- Ping, J.; Wu, W.; Qi, L.; Liu, J.; Liu, J.; Zhao, B.; Wang, Q.; Yu, L.; Lin, J.-M.; Hu, Q. Hydrogel-assisted paper-based lateral flow sensor for the detection of trypsin in human serum. Biosens. Bioelectron. 2021, 192, 113548. [Google Scholar] [CrossRef]
- Kakizaki, E.; Seo, Y.; Takahama, K. A sandwich enzyme immunoassay for human pancreatic elastase III. Forensic Sci. Int. 2000, 113, 189–192. [Google Scholar] [CrossRef] [PubMed]
- Ogawa, M. Pancreatic elastase 1. Rinsho Byori. Jpn. J. Clin. Pathol. 2001, Suppl 116, 131–134. [Google Scholar]
- Huta, Y.; Ashorov, O.; Hamouda, D.; Boltin, D.; Dickman, R.; Perets, T.T. A Novel Fecal Elastase Assay for the Detection of Pancreatic Exocrine Insufficiency. Clin. Lab. 2022, 68, 1476–1480. [Google Scholar] [CrossRef]
- Benini, L.; Amodio, A.; Campagnola, P.; Agugiaro, F.; Cristofori, C.; Micciolo, R.; Magro, A.; Gabbrielli, A.; Cabrini, G.; Moser, L.; et al. Fecal elastase-1 is useful in the detection of steatorrhea in patients with pancreatic diseases but not after pancreatic resection. Pancreatology 2013, 13, 38–42. [Google Scholar] [CrossRef]
- Leeds, J.S.; Oppong, K.; Sanders, D.S. The role of fecal elastase-1 in detecting exocrine pancreatic disease. Nat. Rev. Gastroenterol. Hepatol. 2011, 8, 405–415. [Google Scholar] [CrossRef]
- Edwards, J.V.; Prevost, N.; Sethumadhavan, K.; Ullah, A.; Condon, B. Peptide conjugated cellulose nanocrystals with sensitive human neutrophil elastase sensor activity. Cellulose 2013, 20, 1223–1235. [Google Scholar] [CrossRef]
- Edwards, J.V.; Prevost, N.T.; French, A.D.; Concha, M.; Condon, B.D. Kinetic and structural analysis of fluorescent peptides on cotton cellulose nanocrystals as elastase sensors. Carbohydr. Polym. 2015, 116, 278–285. [Google Scholar] [CrossRef]
- Hasmann, A.; Gewessler, U.; Hulla, E.; Schneider, K.P.; Binder, B.; Francesko, A.; Tzanov, T.; Schintler, M.; Van der Palen, J.; Guebitz, G.M.; et al. Sensor materials for the detection of human neutrophil elastase and cathepsin G activity in wound fluid. Exp. Dermatol. 2011, 20, 508–513. [Google Scholar] [CrossRef] [PubMed]
- He, J.-L.; Wu, Z.-S.; Zhang, S.-B.; Shen, G.-L.; Yu, R.-Q. Fluorescence aptasensor based on competitive-binding for human neutrophil elastase detection. Talanta 2010, 80, 1264–1268. [Google Scholar] [CrossRef] [PubMed]
- Ling, Z.; Xu, F.; Edwards, J.V.; Prevost, N.T.; Nam, S.; Condon, B.D.; French, A.D. Nanocellulose as a colorimetric biosensor for effective and facile detection of human neutrophil elastase. Carbohydr. Polym. 2019, 216, 360–368. [Google Scholar] [CrossRef] [PubMed]
- Sun, Q.; Li, J.; Liu, W.-N.; Dong, Q.-J.; Yang, W.-C.; Yang, G.-F. Non-Peptide-Based Fluorogenic Small-Molecule Probe for Elastase. Anal. Chem. 2013, 85, 11304–11311. [Google Scholar] [CrossRef]
- Li, W.K.; Yang, Y.J. Mixed self-assembled monolayers modified electrode for the detection of human neutrophil elastase. Adv. Mater. Res. 2014, 898, 308–311. [Google Scholar] [CrossRef]
- Yang, T.; Pan, S.-C.; Cheng, C.-M. Paper-based human neutrophil elastase detection device for clinical wound monitoring. Lab A Chip 2020, 20, 2709–2716. [Google Scholar] [CrossRef]
- Huang, L.; Su, W.; Zhu, L.; Li, J.; Quan, W.; Yoon, J.; Lin, W. A Biocompatible Probe for the Detection of Neutrophil Elastase Free from the Interference of Structural Changes and Its Application to Ratiometric Photoacoustic Imaging In Vivo. Angew. Chem. -Int. Ed. 2023, 62, e202217508. [Google Scholar] [CrossRef]
- Li, X.; Zhao, Y.; Qiu, Y.; Luo, X.; Liu, G.; Sun, Q. Phenoxazine-based red-emitting fluorescence probe for specific detection and imaging of endogenous neutrophil elastase in vitro and in vivo. Dye. Pigment. 2023, 210, 110966. [Google Scholar] [CrossRef]
- Usui, M.; Iwasaki, M.; Ariyoshi, W.; Kobayashi, K.; Kasai, S.; Yamanaka, R.; Nakashima, K.; Nishihara, T. The Ability of a Novel Trypsin-like Peptidase Activity Assay Kit to Detect Red-Complex Species. Diagnostics 2022, 12, 2172. [Google Scholar] [CrossRef]
- Lowe, M.E. The triglyceride lipases of the pancreas. J. Lipid Res. 2002, 43, 2007–2016. [Google Scholar] [CrossRef] [PubMed]
- Verger, R.; Cambillau, C.; Tilbeurgh, H.V.; Egloff, M.P.; Martinez, C.; Rugani, N. Interfacial activation of the lipase-procolipase complex by mixed micelles revealed by X-ray crystallography. Nature 1993, 362, 814–820. [Google Scholar]
- Verger, R. ‘Interfacial activation’ of lipases: Facts and artifacts. Trends Biotechnol. 1997, 15, 32–38. [Google Scholar] [CrossRef]
- Winkler, F.K.; Darcy, A.; Hunziker, W. Structure of Human Pancreatic Lipase. Nature 1990, 343, 771–774. [Google Scholar] [CrossRef]
- Guo, C.; Zhai, J.; Chen, Q.; Du, X.; Xie, X. Phase transfer of fatty acids into ultrasmall nanospheres for colorimetric detection of lipase and albumin. Chem. Commun. 2022, 58, 5037–5040. [Google Scholar] [CrossRef]
- Wang, L.; Song, Y.; Yao, J.; Wang, R.; Zhang, N.; Zou, D.; Yu, D.; Elfalleh, W. Detection of lipase activity in rice bran with AuNPs colorimetric sensor. J. Food Meas. Charact. 2021, 15, 3461–3470. [Google Scholar] [CrossRef]
- Guan, P.; Liu, Y.; Yang, B.; Wu, Y.; Chai, J.; Wen, G.; Liu, B. Fluorometric probe for the lipase level: Design, mechanism and biological imaging application. Talanta 2021, 225, 121948. [Google Scholar] [CrossRef]
- Shi, J.; Deng, Q.; Wan, C.; Zheng, M.; Huang, F.; Tang, B. Fluorometric probing of the lipase level as acute pancreatitis biomarkers based on interfacially controlled aggregation-induced emission (AIE). Chem. Sci. 2017, 8, 6188–6195. [Google Scholar] [CrossRef]
- Du, T.; Zhang, F.; Jiang, L.; Tian, D. A Colorimetric and Fluorescent Dual-Signal Sensor for Detecting Lipase Activity Based on Inner Filter Effect. J. Braz. Chem. Soc. 2022, 33, 1255–1262. [Google Scholar] [CrossRef]
- Zhang, F.; Du, T.; Jiang, L.; Zhu, L.; Tian, D. A combined “AIE+ESIPT” fluorescent probe for detection of lipase activity. Bioorg. Chem. 2022, 128, 106026. [Google Scholar] [CrossRef]
- La Rocca, P.; Mingione, A.; Casati, S.; Ottria, R.; Allevi, P.; Ciuffreda, P.; Rota, P. Small-Molecules as Chemiluminescent Probes to Detect Lipase Activity. Int. J. Mol. Sci. 2022, 23, 9039. [Google Scholar] [CrossRef] [PubMed]
- Luo, J.; Zhang, H.; Guan, J.; An, B.; Peng, J.; Zhu, W.; Wei, N.; Zhang, Y. Detection of lipase activity in human serum based on a ratiometric fluorescent probe. New J. Chem. 2021, 45, 9561–9568. [Google Scholar] [CrossRef]
- Tang, J.Y.; Li, Z.B.; Xie, M.Y.; Zhang, Y.; Long, W.J.; Long, S.; Wen, T.J.; Fang, Z.X.; Zhu, W.G.; Zheng, H.D.; et al. Optical fiber bio-sensor for phospholipase using liquid crystal. Biosens. Bioelectron. 2020, 170, 112547. [Google Scholar] [CrossRef]
- Schuchert-Shi, A.; Hauser, P.C. Following the Lipase Catalyzed Enantioselective Hydrolysis of Amino Acid Esters with Capillary Electrophoresis Using Contactless Conductivity Detection. Chirality 2010, 22, 331–335. [Google Scholar] [CrossRef]
- Banni, G.A.H.D.; Nasreddine, R.; Fayad, S.; Phu, C.-N.; Rossi, J.-C.; Leclercq, L.; Cottet, H.; Marchal, A.; Nehme, R. Screening for pancreatic lipase natural modulators by capillary electrophoresis hyphenated to spectrophotometric and conductometric dual detection. Analyst 2021, 146, 1386–1401. [Google Scholar] [CrossRef]
- Zlatev, R.; Stoytcheva, M.; Valdez, B.; Montero, G.; Toscano, L. Simple impedimetric sensor for rapid lipase activity quantification. Talanta 2019, 203, 161–167. [Google Scholar] [CrossRef]
- Zlatev, R.; Stoytcheva, M.; Gochev, V.; Velkova, Z.; Valdez, B.; Montero, G. Rapid disposable lipase activity sensor for automatic industrial application. Biotechnol. Biotechnol. Equip. 2021, 35, 366–375. [Google Scholar] [CrossRef]
- Rogala, A.; Rechberger, J.; Vasold, V.; Samphao, A.; Kalcher, K.; Ortner, A. Voltammetric lipase activity assay based on dilinolein and a modified carbon paste electrode. Anal. Bioanal. Chem. 2022, 414, 5033–5041. [Google Scholar] [CrossRef]
- Sarakhman, O.; Wenninger, N.; Rogala, A.; Svorc, L.; Kurt, K.; Ortner, A. Electrochemical flow injection approach for routine screening of lipase activity in pancreatic preparations. Talanta 2023, 260, 124588. [Google Scholar] [CrossRef]
- Valek, T.; Pohanka, M. The Determination of Lipase Activity by Measuring pH Using ion-Sensitive Field-effect Transistor. Int. J. Electrochem. Sci. 2021, 16, 210760. [Google Scholar] [CrossRef]
- Wang, L.; Zhang, H.; Li, Z.; Qu, J.; Xing, K.; Wang, M.; Han, C.; Qiu, Z.; Yu, D. Development of a three-dimensional graphene-based photoelectrochemical biosensor and its use for monitoring lipase activity. LWT-Food Sci. Technol. 2022, 170, 114076. [Google Scholar] [CrossRef]
- Xia, S.; Yin, F.; Xu, L.; Zhao, B.; Wu, W.; Ma, Y.; Lin, J.-M.; Liu, Y.; Zhao, M.; Hu, Q. Paper-Based Distance Sensor for the Detection of Lipase via a Phase Separation-Induced Viscosity Change. Anal. Chem. 2022, 94, 17055–17062. [Google Scholar] [CrossRef] [PubMed]
- Zhang, H.; Yang, F.-Q.; Gao, J.-L. A Simple and Portable Personal Glucose Meter Method Combined with Molecular Docking for Screening of Lipase Inhibitors. Evid.-Based Complement. Altern. Med. 2022, 2022, 4430050. [Google Scholar] [CrossRef]
- Middya, S.; Bhattacharjee, M.; Mandal, N.; Bandyopadhyay, D. RGO-Paper Sensor for Point-of-Care Detection of Lipase in Blood Serum. IEEE Sens. Lett. 2018, 2, 1–4. [Google Scholar] [CrossRef]


| Type | Probes/Substrates | LOD | Sensing Range | POCT Progress | Ref. |
|---|---|---|---|---|---|
| Amylose Sensing | Transmittance sensing of amylose–iodine blue compounds | \ | 10–110 U/L | Paper-based | [65] |
| Chitosan-triphosphate nuclei encapsulated with amylose–iodine shell structure | 1.25 mg/mL | \ | Human-eye readable | [67] | |
| Starch-stabilized CuNPs; TMB color development | 0.04 U/mL | 0.1–10 U/mL | Human-eye readable | [70] | |
| Starch-stabilized CuNPs and AuNPs | 0.006 U/mL | 0.05–8 U/mL | Human-eye readable | [91] | |
| Starch fixes AuNPs and increases resistance after being decomposed | \ | 25–100 U/L | Achieved POCT device | [103] | |
| Viscosity changes after starch hydrolysis | 0.017 U/mL | 0–10 U/mL | Paper-based | [101] | |
| Hydrolysis products Sensing | 3,5-dinitrosalicylic acid sensing reducing sugars | \ | 0.1–1 U/mL | Handheld | [72] |
| Reduction in a substrate by a reducing sugar produces a potential difference | \ | 125–2000 U/mL | Portable Test Strips | [115] | |
| Dinitro salicylic acid staining method to label maltose | 3.5 ± 0.3 μmol/mL | 0–70 μmol/mL | Using smartphone | [64,73] | |
| Reduced phenazine methosulfate upon glucose oxidation by Amy-GDH | 2 pM | 2–150 pM | Using smartphone | [82] | |
| Hydrolysis improves electrical conductivity | \ | 15–110 U/L | Miniature patch electrode | [102] | |
| Reduction in trivalent iron ions by reducing sugar | 1.1 U/mL | 1.1–10.7 U/mL | Miniaturized equipment | [113] | |
| Reduction in trivalent iron ions by reducing sugar | 0.12 U/mL | 30 U–1 kU/mL | Using smartphone | [116] | |
| Blood glucose meter | 20 U/L | \ | Blood glucose meter | [117] | |
| Antigen-Antibodies | Fiber optic SPR | 0.5 U/L | 0.8–25.8 U/L | Cheap and small fiber optic structure | [88] |
| Test strips | 50 ng/mL | \ | Easy-to-use, portable | [118] |
| Type | Probes/Substrates | LOD | Sensing Range | POCT Progress | Ref. |
|---|---|---|---|---|---|
| TMB | Peptide-stabilized CuNPs | 0.82 nM | 3–1000 nM | Human-eye readable | [131] |
| POD properties of trypsin-hydrolyzed Cyt c | 4.5 ng/mL | 5–20 ng/mL | Human-eye readable | [132] | |
| Immobilization of SAC in gel hydrogels | 1 ng/mL | 1–100 ng/mL | Human-eye readable | [133] | |
| Peptide-stabilized PtNPs | 0.03 μg/mL | 0.06–0.6 μg/mL | Human-eye readable | [133] | |
| Hydrolysis (except TMB method) | CdTe | 0.014 μM | 0.15–4 μM | Using cell phone | [166] |
| Fisetin, catechol B-TPE ratio change | \ | \ | Human-eye readable | [168] | |
| BSA inhibits the aggregation of AuNPs | 1.2 μg/mL | 0.3–4 μg/mL | Using cell phone | [174] | |
| Protein and enzyme conjugation with AuNPs | 1.1 μM | \ | Using cell phone | [175] | |
| Gel-protein-layer-covered electrodes | 0.5 μg/mL | \ | Portable device | [184] | |
| Changes in light transmission after alignment of LC molecules | 34 ng/mL | 1–1000 μg/mL | Portable device | [170] | |
| Release of redox fragments and reduction in electrochemical signals | \ | \ | Implantable potential | [188] | |
| Viscosity change after gelatin hydrolysis | 1 ng/mL | \ | Paper based | [204] | |
| Fluorescent-containing gel fades after hydrolysis | \ | 0.5–5 mM | Human-eye readable | [167] |
| Type | Probes/Substrates | LOD | Sensing Range | POCT Progress | Ref. |
|---|---|---|---|---|---|
| Hydrolysis | Fatty acids as ion exchangers | 1.8 μg/mL | \ | Human-eye readable | [225] |
| Altered LC molecular arrangement of lipid molecules | 1 nM | 2–10 nM | Small fiber optic sensors | [233] | |
| Hydrolysis of polymer changes the conductive area of electrodes | 8 mU/mL | 0.0099–1.68 U/mL | Miniaturized equipment | [236] | |
| Hydrolysis of polymer changes the thickness of capacitors | \ | 0.0073–3.9 U/mL | Miniaturized equipment | [237] | |
| Viscosity change | 0.052 U/mL | 0.052–30 U/mL | Paper based | [242] | |
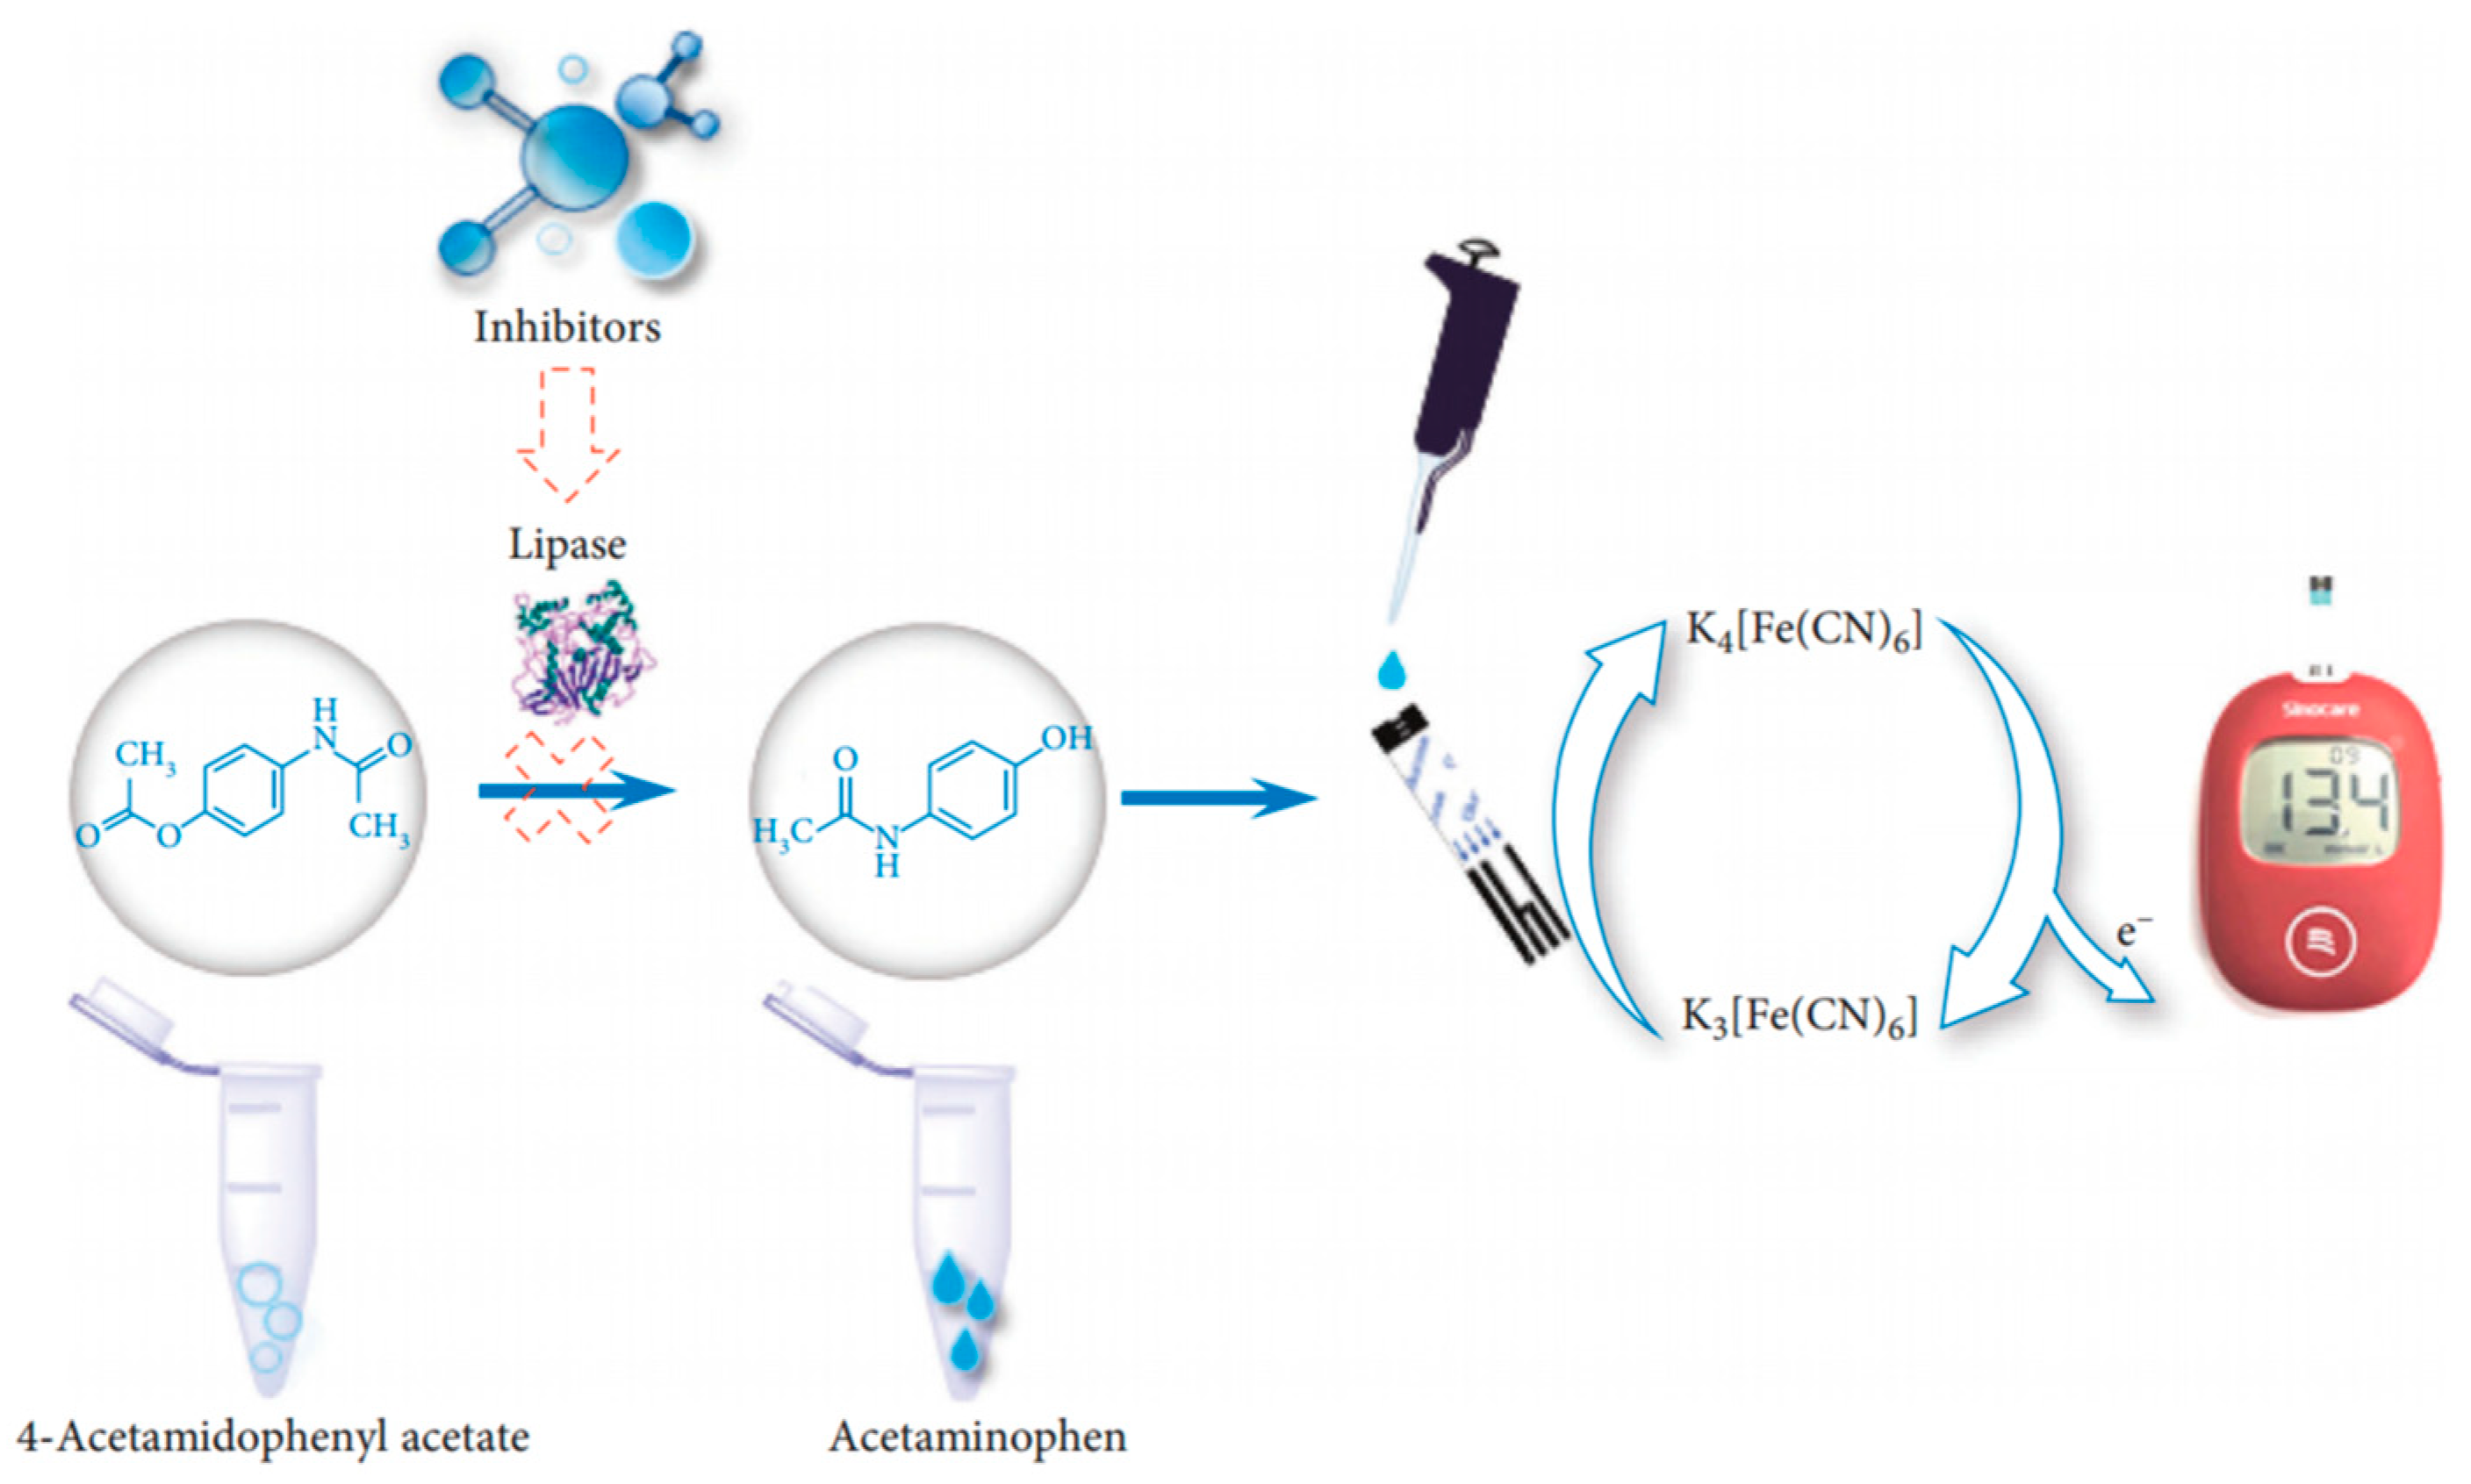
| Hydrolysis of 4-acetaminophen acetate | \ | \ | Blood glucose meter | [243] | |
| Hydrolysis releases H+ ions to improve electrical conductivity | 6.087 U/L | \ | Paper based | [244] |
Disclaimer/Publisher’s Note: The statements, opinions and data contained in all publications are solely those of the individual author(s) and contributor(s) and not of MDPI and/or the editor(s). MDPI and/or the editor(s) disclaim responsibility for any injury to people or property resulting from any ideas, methods, instructions or products referred to in the content. |
© 2023 by the authors. Licensee MDPI, Basel, Switzerland. This article is an open access article distributed under the terms and conditions of the Creative Commons Attribution (CC BY) license (https://creativecommons.org/licenses/by/4.0/).
Share and Cite
Yin, J.; Cui, T.; Yang, Y.; Ren, T.-L. Sensing of Digestive Enzymes—Diagnosis and Monitoring of Pancreatitis. Chemosensors 2023, 11, 469. https://doi.org/10.3390/chemosensors11090469
Yin J, Cui T, Yang Y, Ren T-L. Sensing of Digestive Enzymes—Diagnosis and Monitoring of Pancreatitis. Chemosensors. 2023; 11(9):469. https://doi.org/10.3390/chemosensors11090469
Chicago/Turabian StyleYin, Jiaju, Tianrui Cui, Yi Yang, and Tian-Ling Ren. 2023. "Sensing of Digestive Enzymes—Diagnosis and Monitoring of Pancreatitis" Chemosensors 11, no. 9: 469. https://doi.org/10.3390/chemosensors11090469
APA StyleYin, J., Cui, T., Yang, Y., & Ren, T.-L. (2023). Sensing of Digestive Enzymes—Diagnosis and Monitoring of Pancreatitis. Chemosensors, 11(9), 469. https://doi.org/10.3390/chemosensors11090469