Article

Green and Sensitive Analysis of the Antihistaminic Drug Pheniramine Maleate and Its Main Toxic Impurity Using UPLC and TLC Methods, Blueness Assessment, and Greenness Assessments

by
Nessreen S. Abdelhamid
1,
Huda Salem AlSalem
2,
Faisal K. Algethami
3,
Eglal A. Abdelaleem
1,
Alaa M. Mahmoud
4,
Dalal A. Abou El Ella
5 and
Mohammed Gamal
1,*
1
Pharmaceutical Analytical Chemistry Department, Faculty of Pharmacy, Beni-Suef University, Alshaheed Shehata Ahmed Hegazy St., Beni-Suef 62514, Egypt
2
Department of Chemistry, College of Science, Princess Nourah bint Abdulrahman University, P.O. Box 84428, Riyadh 11671, Saudi Arabia
3
Department of Chemistry, College of Science, Imam Mohammad Ibn Saud Islamic University (IMSIU), P.O. Box 90950, Riyadh 11623, Saudi Arabia
4
Pharmaceutical Chemistry Department, Faculty of Pharmacy, Nile Valley University, Demo, Faiyum 2943050, Egypt
5
Pharmaceutical Chemistry Department, Faculty of Pharmacy, Ain Shams University, Abbassia, Cairo 11566, Egypt
*
Author to whom correspondence should be addressed.
Chemosensors 2024, 12(10), 206; https://doi.org/10.3390/chemosensors12100206
Submission received: 1 August 2024 / Revised: 28 September 2024 / Accepted: 5 October 2024 / Published: 9 October 2024
(This article belongs to the Special Issue Green Analytical Chemistry: Current Trends and Future Developments)

Abstract

:
For the first time, two direct and eco-friendly chromatographic approaches were adapted for the simultaneous estimation of pheniramine maleate (PAM) and its major toxic impurity, 2-benzyl pyridine (BNZ). Method A used reversed-phase ultra-performance liquid chromatography; separation was achieved within 4 min using a C18 column with a developing system of methanol/water (60:40 v/v) with a 0.1 mL/min flow rate. Photodiode array detection was adjusted at 215 nm. The method was linear in the ranges of 5.0–70.0 and 0.05–10.0 µg/mL for PAM and BNZ, correspondingly. Method B used thin-layer chromatography; separation was applied on silica gel TLC F254 using ethanol/ethyl acetate/liquid ammonia (8:2:0.1, in volumes) at room temperature, at 265 nm. Linearity was assured at concentration ranges 0.5–8.0 and 0.1–3.0 µg/band for the two components, respectively. Generally, the new UPLC and TLC methods outperform the old ones in terms of quickness, greenness, and sensitivity. Concisely, the greenness features were partially achieved using the Green Analytical Procedure Index (GAPI) and the Analytical Greenness (AGREE) pictograms. In contrast, the usefulness of the novel approaches was assured via the Blue Applicability Grade Index (BAGI) tool.

Graphical Abstract

1. Introduction

Avil® injection is released in the Egyptian market for allergic rhinitis and movement sickness; pheniramine maleate is the active constituent of the dosage form [1].
Pheniramine maleate (PAM), Figure 1a, is of the antihistamines group, advised in case of allergic conditions, such as runny nose, itching, fever, and rashes. PAM is effective in the treatment and avoidance of vomiting, nausea, travel sickness, and dizziness due to inner ear disorders [2,3].
2-benzyl pyridine (BNZ), Figure 1b, was stated in the British Pharmacopoeia as the main impurity of pheniramine maleate. Although BNZ has antifungal properties and is used as a chromogenic reagent for determination of molybdenum, it is also considered very hazardous and dangerous due to the poisonous vapors it releases upon decomposition by heating [4], so it is highly recommended to determine such toxic impurity along with pheniramine maleate. Similar to pyridine and its derivatives, BNZ can affect the liver, kidneys, and nervous system.
Pheniramine maleate was determined both alone and with other components using the following methods: spectroscopic methods [5,6,7,8,9,10], titrimetric methods [8,11,12], high-performance liquid chromatography (HPLC) [1,2,13,14,15,16], thin-layer chromatography (TLC) [17,18], capillary electrophoresis (CE) [19,20,21], electrochemical methods [22], and multivariate chemometrics [23] methods.
This work is presented to develop ecological chromatographic approaches that could separate and analyze the main active components of Avil® ampoule (pheniramine maleate) and its main toxic impurity with more advanced techniques than the reported one [1] using the UHPLC instrument in the first method, which, compared to conventional HPLC, uses less liquid mobile phase and runs faster. Moreover, the suggested TLC approach is advantageous because it is an easy-to-use, convenient, and inexpensive technique using high proportions of green liquid phases that eliminate environmental risks.

2. Materials and Methods Descriptions

2.1. Apparatuses

For UHPLC, the used instruments were a Dionex Ultimate 3000 (Germany) connected to a pump of aforementioned grade RS (HPG-3400, Thermo Fisher Scientific, San Jose, CA, USA), autosampler Dionex Ultimate 3000 RS (WPS-3000, Thermo Fisher Scientific, Bremen, Germany), and diode array detector Dionex Ultimate 3000 RS (DAD-3000 RS, Thermo Fisher Scientific in Bremen, Germany). The isocratic analysis was performed by a column of ACQUITY UPLC® BEH C-Eighteen (1.7 μm × 2.1 mm × 150 mm). Output signals were processing and monitoring in a computer installed with Chromeleon 7.2 version software. Other used instruments were a pH meter, which was a Jenway 350 (Staffordshire, UK); ultra-sonicator (Sonix TV SS-series, Sonix Technology, New York, NY, USA); and numerical balance (Sartorius AG, Göttingen, Germany).
Concerning the novel TLC approach, the assessment of PAM and BNZ was performed on a 3 S/N Camag® TLC scanner instrument connected to a linomat IV auto-sampler (Camage, Muttenz, Switzerland) and supported with Win CATS® (V 1.4.4) software, supplied with a 100 µL syringe. The separation was achieved on TLC plate (20 × 20 cm) as a stationary phase, which was covered with silica gel 60 F254 (Merck KGaA Company, Darmstadt, Germany); the source of radiation was a deuterium lamp, absorbance was the scan mode, slit dimensions were 4 mm and 0.45 mm, and the scanning speediness was 20 mm per second. The outputs were 3D-TLC chromatograms and the peak areas. Other instruments were used, including a glass syringe from TLC–Hamilton®, Allugram SILG/UV 254 (Macherey-Nagel GmbH & Co. KG, Düren, Germany), and ultra-sonicator Sonix TV SS-series. Furthermore, a TLC glass container (Sigma-Aldrich Company, St. Louis, MO, USA) of standard dimensions, 26.5 × 27 × 7 cm in height, width, and diameter, respectively, was used in all TLC experiments.

2.2. Pure Standard Samples

Authentic PAM of 99.75% purity was delivered by Sanofi pharmaceutical Company (Giza, Egypt). Authentic BNZ of 99% purity was bought from Merck Group Firm (Cairo, Egypt).

2.3. Pharmaceutical Formulation

Avil® ampoules (batch number 9EG060) were formulated by Sanofi Pharmaceutical Company (Giza, Egypt). Each ampoule contains 45.5 mg PAM per 2 mL.

2.4. Solvents and Reagents

Cornell-Lab® provided Tedia HPLC-quality methanol, ethyl acetate, and ethanol (Cairo, Egypt). Deionized water was supplied from Nahda University Central Laboratory (Beni-Suef, Egypt). Ammonia 98% was purchased from El-Nasr Pharmaceutical Chemicals Firm (Giza, Egypt).

2.5. Parent and Working Solutions

2.5.1. PAM and BNZ Stock Typical Solutions (1 mg/mL)

Parent standard solutions with nominal content of 1 mg/mL of PAM and BNZ were dissolved in methyl alcohol by accurately weighing 0.025 gm of each in two different 25 mL glass flasks, after adding roughly 10 mL of solvent and shaking it carefully to dissolve it; methyl alcohol was added to complete the final size.

2.5.2. PAM and BNZ Secondary Standard Solutions (100 µg/mL)

PAM and BNZ secondary solutions (100 µg/mL) were produced by transferring 10 mL of each compound from their respective parent solutions into two separate 100 mL glass flasks and filling the remaining space with methyl alcohol.

2.6. Pharmaceutical Formulation Solutions

Avil® ampoule in a perfectly estimated amount was put into a 100 mL flask; in more detail, 0.44 mL of Avil® liquid solution, which is equivalent to 10 mg of PAM, was transferred to a 100 mL flask. Next, 75 mL of methanol was added, and the container was sonicated for 20 min. Using an identical solvent, the size was increased to 100 mL in order to create a secondary solution with a concentration of 100 µg/mL of PAM.

2.7. Analytical Procedures

2.7.1. Circumstances for the Chromatographic Techniques

-
RP-UPLC Chromatographic Approach
Connected to C-Eighteen stationary material (1.7 μm × 2.1 mm × 150 mm), ACQUITY-grade UHPLC® BEH was used for PAM and BNZ isocratic separation with a liquid system of methyl alcohol/water (60:40 v/v). The chosen speed rate was 0.1 mL/min. The injection volume was 5 μL with photodiode array (PDA) detection at 215 nm at room temperature.
-
TLC–Densitometry Method
The separation of PAM and BNZ in the TLC approach was accomplished on 20 × 10 cm aluminum silica gel TLC F 254 plates. The distance between bands was 20 mm, while the spotting line was 15 mm from the plate bottom end. The chromatographic tank was saturated earlier for 20 min with a mobile phase of ethanol/ethyl acetate/ammonia (8:2:0.1; in volume) at room temperature. The total run time was about 5 min. Following a short time of air drying, the produced plates were scanned at 265 nm using the provided instrument settings.

2.7.2. Development of Measurement Curves

-
RP-UPLC Approach
PAM and BNZ were precisely measured out of 100 μg/mL, prepared as secondary solutions, and placed into two sets of 10 mL glass flasks. After that, methyl alcohol was added to the contents of each flask to create solutions with PAM and BNZ concentration ranges of 5–70 and 0.05–10 µg/mL, correspondingly. Subsequently, each solution was applied in triplicate in line with the chromatographic conditions stated earlier. Plotting the average peak area versus concentrations in µg/mL allowed for the construction of linear curves for PAM and BNZ, which were then used for accurately calculating the regression equations.
-
TLC Spectrodensitometric Approach
Diverse concentration levels of PAM and BNZ were independently moved from their secondary solutions, 100 µg per mL, into new 10 mL flasks using ethanol as a solvent. Then, three trials of a 20 μL aliquot of each new solution were inserted onto TLC plates to give concentrations ranging between 0.5–8.0 μg/band for PAM and 0.1–3.0 μg/band for BNZ. Following the aforementioned chromatographic procedures, the automated peak areas that were obtained were displayed against the concentration level in µg/band to determine the linear equation.

2.8. Application to Avil® Ampoules

Preparation of pharmaceutical solution for Avil® ampoules was stated in detail in Section 2.6. Essential dilutions of the secondary solution were performed using methyl alcohol in the UPLC method or ethanol in the TLC one in order to obtain adequate concentrations of PAM. The aforementioned guidelines in Section 2.7.1 were then monitored. The obtained corresponding regression equation was used to calculate the concentrations and percentage recoveries of PAM.

3. Results and Discussion

The inspiration for this study was the newly arisen approach, ‘green analytical chemistry’, allowing for the development of highly selective and accurate chromatographic methods UPLC and TLC for analysis of PAM and its toxic impurity, BNZ, which may be present during bad storage and synthesis.
The suggested techniques provide superior sensitivity and optimal resolution in a brief period of time using ecofriendly and polar solvents, such as water and ethanol.

3.1. Developments of the Chromatographic Methods and Their Optimization

3.1.1. For RP- UPLC Method

The proposed method achieved good linearity during determination of different prepared concentrations of pure PAM and BNZ and constructing the calibration curves. Linear correlation between nominal amounts of the drugs and their corresponding peak area was obtained; the corresponding linear formulas are as follows:
PA PAM = 0.0566 C PAM + 0.8645, r = 0.9998 for PAM
PA BNZ = 2.8495 C BNZ + 0.4062, r = 0.9999 for BNZ
r refers to the relationship coefficient, PA denotes the peak areas, and C denotes the concentrations in µg/mL. The main targets were applying green chemistry in the determination of PAM and BNZ and reaching optimum parameters that provide the best separation.
A.
Mobile Phase Composition
Water is considered the greenest known solvent, followed by ethanol and methanol [24]. Because of its low toxicity, ethanol is regarded as the most desirable solvent after water. So, mixtures of ethanol and deionized water as a mobile phase were principally tested in diverse ratios, such as 60:40, 20:80, 50:50, 40:60, 30:70, 25:75, and 80:20 v/v, but low selectivity was obtained between PAM and BNZ. So, the next choice was to use methanol instead of ethanol by the same ratios, which showed better results. Because it demonstrated the best discrimination and separateness, methanol/water (60:40, v/v) at a flow rate of 0.1 mL/min was the preferred mobile system.
B.
Scanning Wavelengths
When estimating the two compounds under study simultaneously, several wavelengths were explored, e.g., 215, 230, 240, and 254 nm; 215 nm displayed the best result.
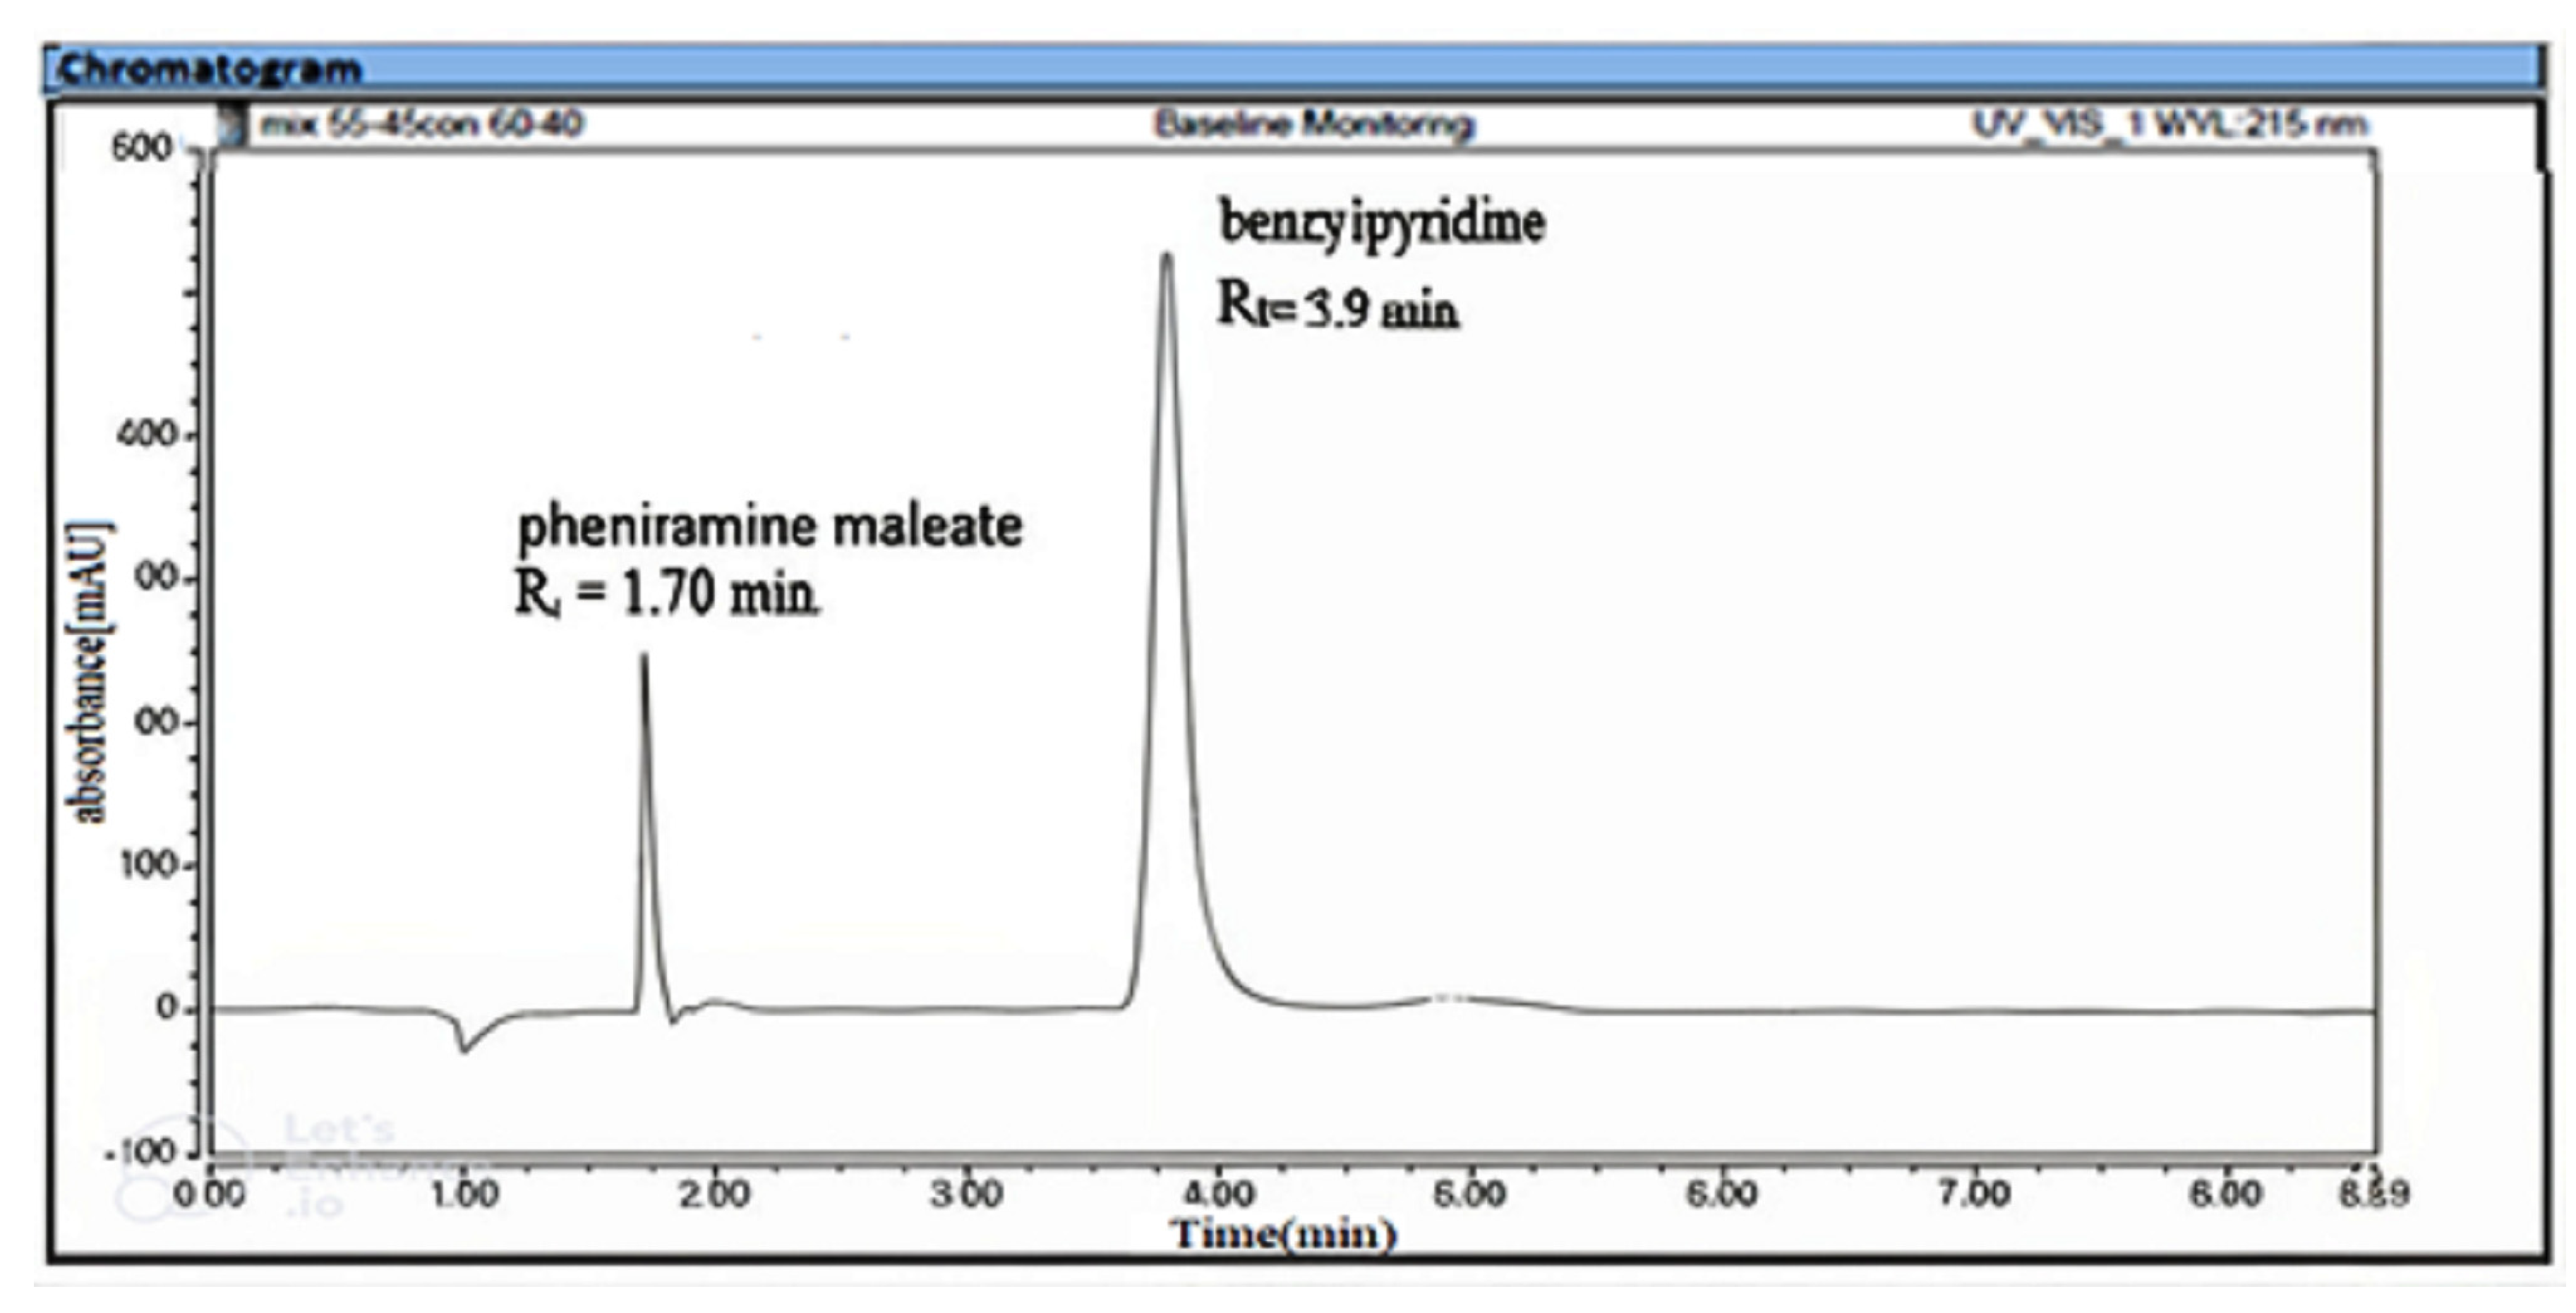
Finally, the finest chromatographic parameters with separated and symmetric peaks were achieved with liquid system of methyl alcohol/water (60:40 v/v), adjusting speed of flow to 0.1 mL/min, at a scanning wavelength of 215 nm, and at normal temperature. The resulted retention times were 1.70 min for PAM and 3.90 min for BNZ. Successful separation between PAM and BNZ compounds was achieved within 4 min (Figure 2).

3.1.2. For TLC Method

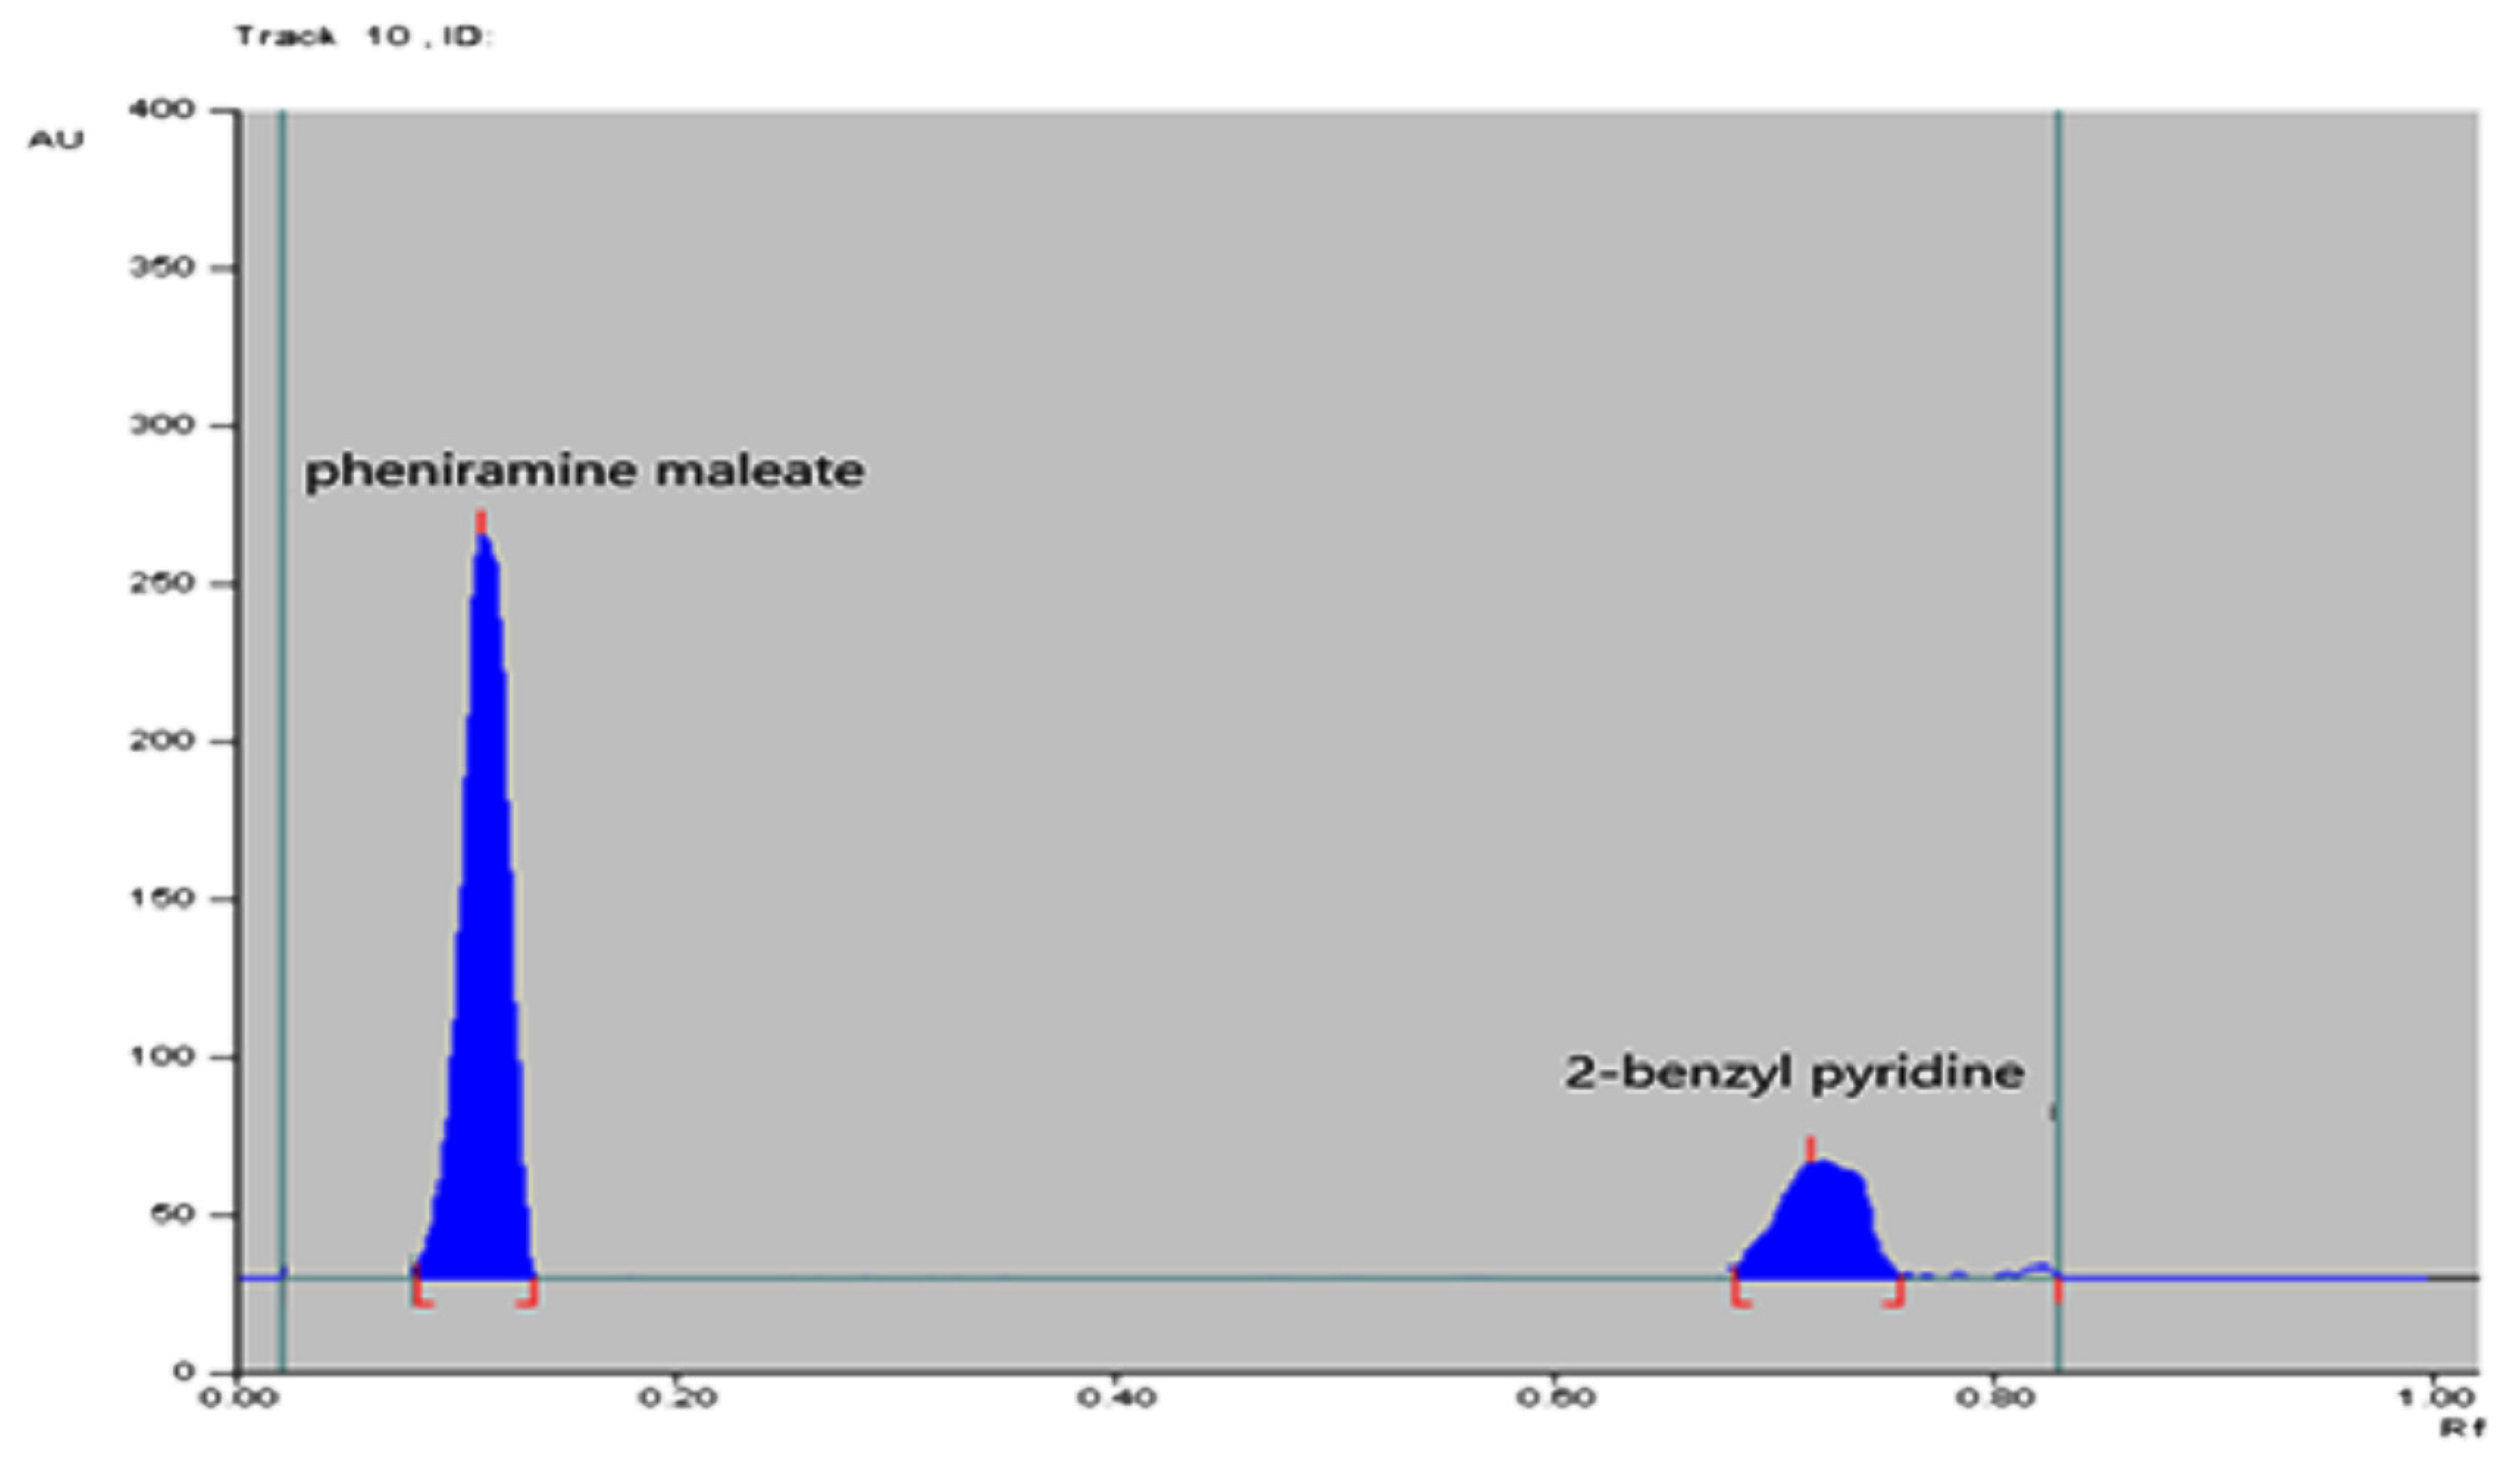
The developed TLC–densitometric method provides a green assessment of PAM and its impurity-A BNZ using ethanol/ethyl acetate/ammonia (8:2:0.1, in volume) as a mobile system with UV spectrophotometric detection at 265 nm (Figure 3). The components that were evaluated showed good separation between them, with significance values for Rf of 0.81 for BNZ and 0.10 for PAM, respectively.
Linear relationships were achieved during determination of PAM and BNZ by the TLC method in 0.5–8 and 0.1–3 µg/band concentration ranges, respectively. The linear formulas are as follows:
A PAM = 0.8023 C PAM + 1.0418, r PAM = 0.9999
A BNZ = 0.7319 C PAM + 1.9246, r BNZ = 0.9999
where ‘C’ refers to the concentration in µg/band, while ‘A’ indicates the automated peak area/104. The effects of many items were perfectly inspected for optimum chromatographic separation.
A.
Developing System
Several trials were carried out to choose the ideal liquid phase, preferring green solvents in different ratios, e.g., acetone/ethanol (9:0.5, in volume), acetone/water (8:2, in volume), ethyl acetate/water (9:1, in volume), and ethanol/water (9:1, in volume), yet none of these systems were able to well separate the investigated compounds. A developed mobile system of ethanol/ethyl acetate/ammonia (8:2:0.1, in volume) provided a good separation of PAM and BNZ. Ammonia was a crucial reagent in addressing PAM tailing. To guarantee the homogeneity of the surrounding atmosphere, the chromatographic container was saturated for 20 min using the chosen developed mobile system.
B.
Investigation of Optimal Scanning Wavelength
A variety of scanning wavelengths (220, 240, 265, and 254 nm) was investigated to achieve the optimal detection for low concentrations of both compounds, where scanning at 265 nm achieved a concurrent assay of PAM and BNZ with convenient sensitivity. The Rf numerical values of PAM and BNZ were 0.10 and 0.81, respectively (Figure 3).
C.
Dimensions of Scanning Beam’s Slit and Band
The scanning slit dimensions should guarantee that all band dimensions are completely covered on the scanned track, free from overlapping with neighbor bands. Many dimensions were investigated, and it was found that 6 mm × 0.45 mm was the most suitable slit size. Several band dimensions were investigated in order to attain regular and non-tailed PAM and BNZ peaks. A width of 6.00 mm and an interspace of 6.80 mm among each band were selected.

3.2. Assessment of Greenness Characteristics

A.
Greenness outline of the Novel Chromatographic Methods
Evaluating the analytical method’s greenness and comparing it with other methods is the concept of the greenness profile, according to four acceptance criteria, the solvent used must not be persistent, bio-accumulative, or poisonous. Solvents must not be toxic, also should not be corrosive (pH used should range between 2 and 12), and the amount of generated waste must not be above 50 g/sample [24].
In the proposed methods, the used solvents, water, methanol, ethanol, and ethyl acetate, were not persistent, bio-accumulative, or poisonous; the pH range used was between 2 and 12 (below the permissible limit); and the produced liquid waste was 0.39 mL/run for the UPLC method and 0.9 g/sample for the TLC method (Table 1).
B.
Greenness appraisal using the Analytical Greenness (AGREE) and Green Analytical Procedure Index (GAPI) approaches.
Using environmentally friendly chemicals and analytical techniques is essential in today’s world to reduce the harm that chemical solvents cause the environment and to improve the planet’s overall health [25]. Indeed, two automated greenness tools were employed, i.e., the Analytical Greenness (AGREE) [26] and the Green Analytical Procedure Index (GAPI) [27] approaches.
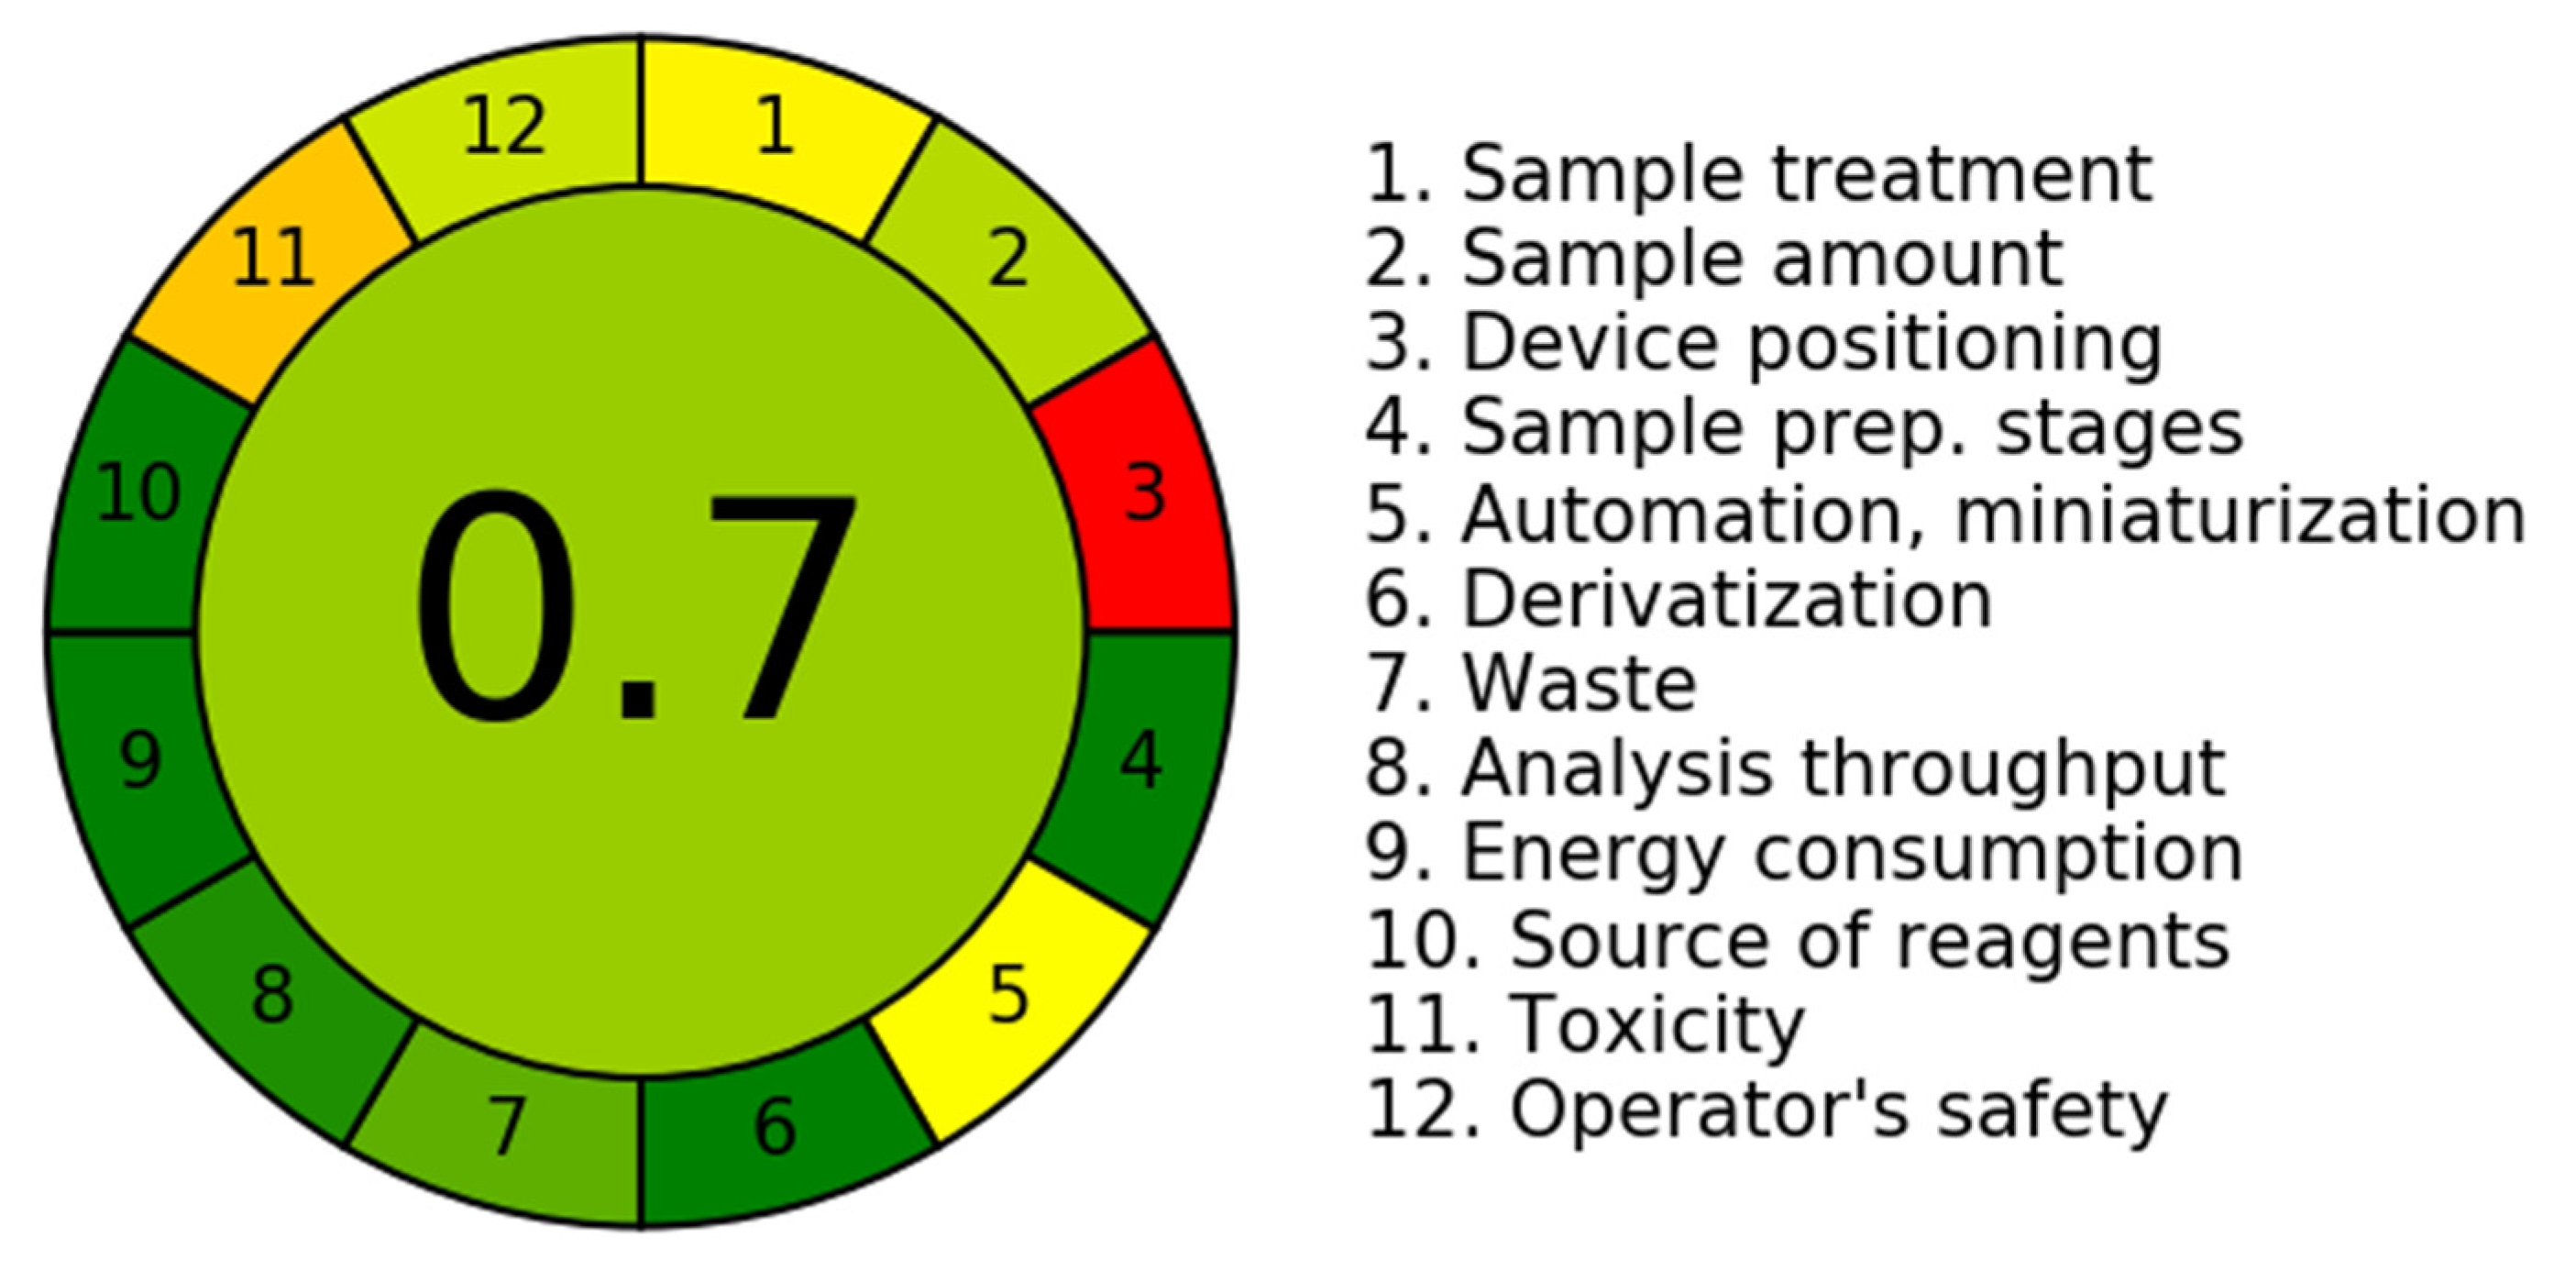
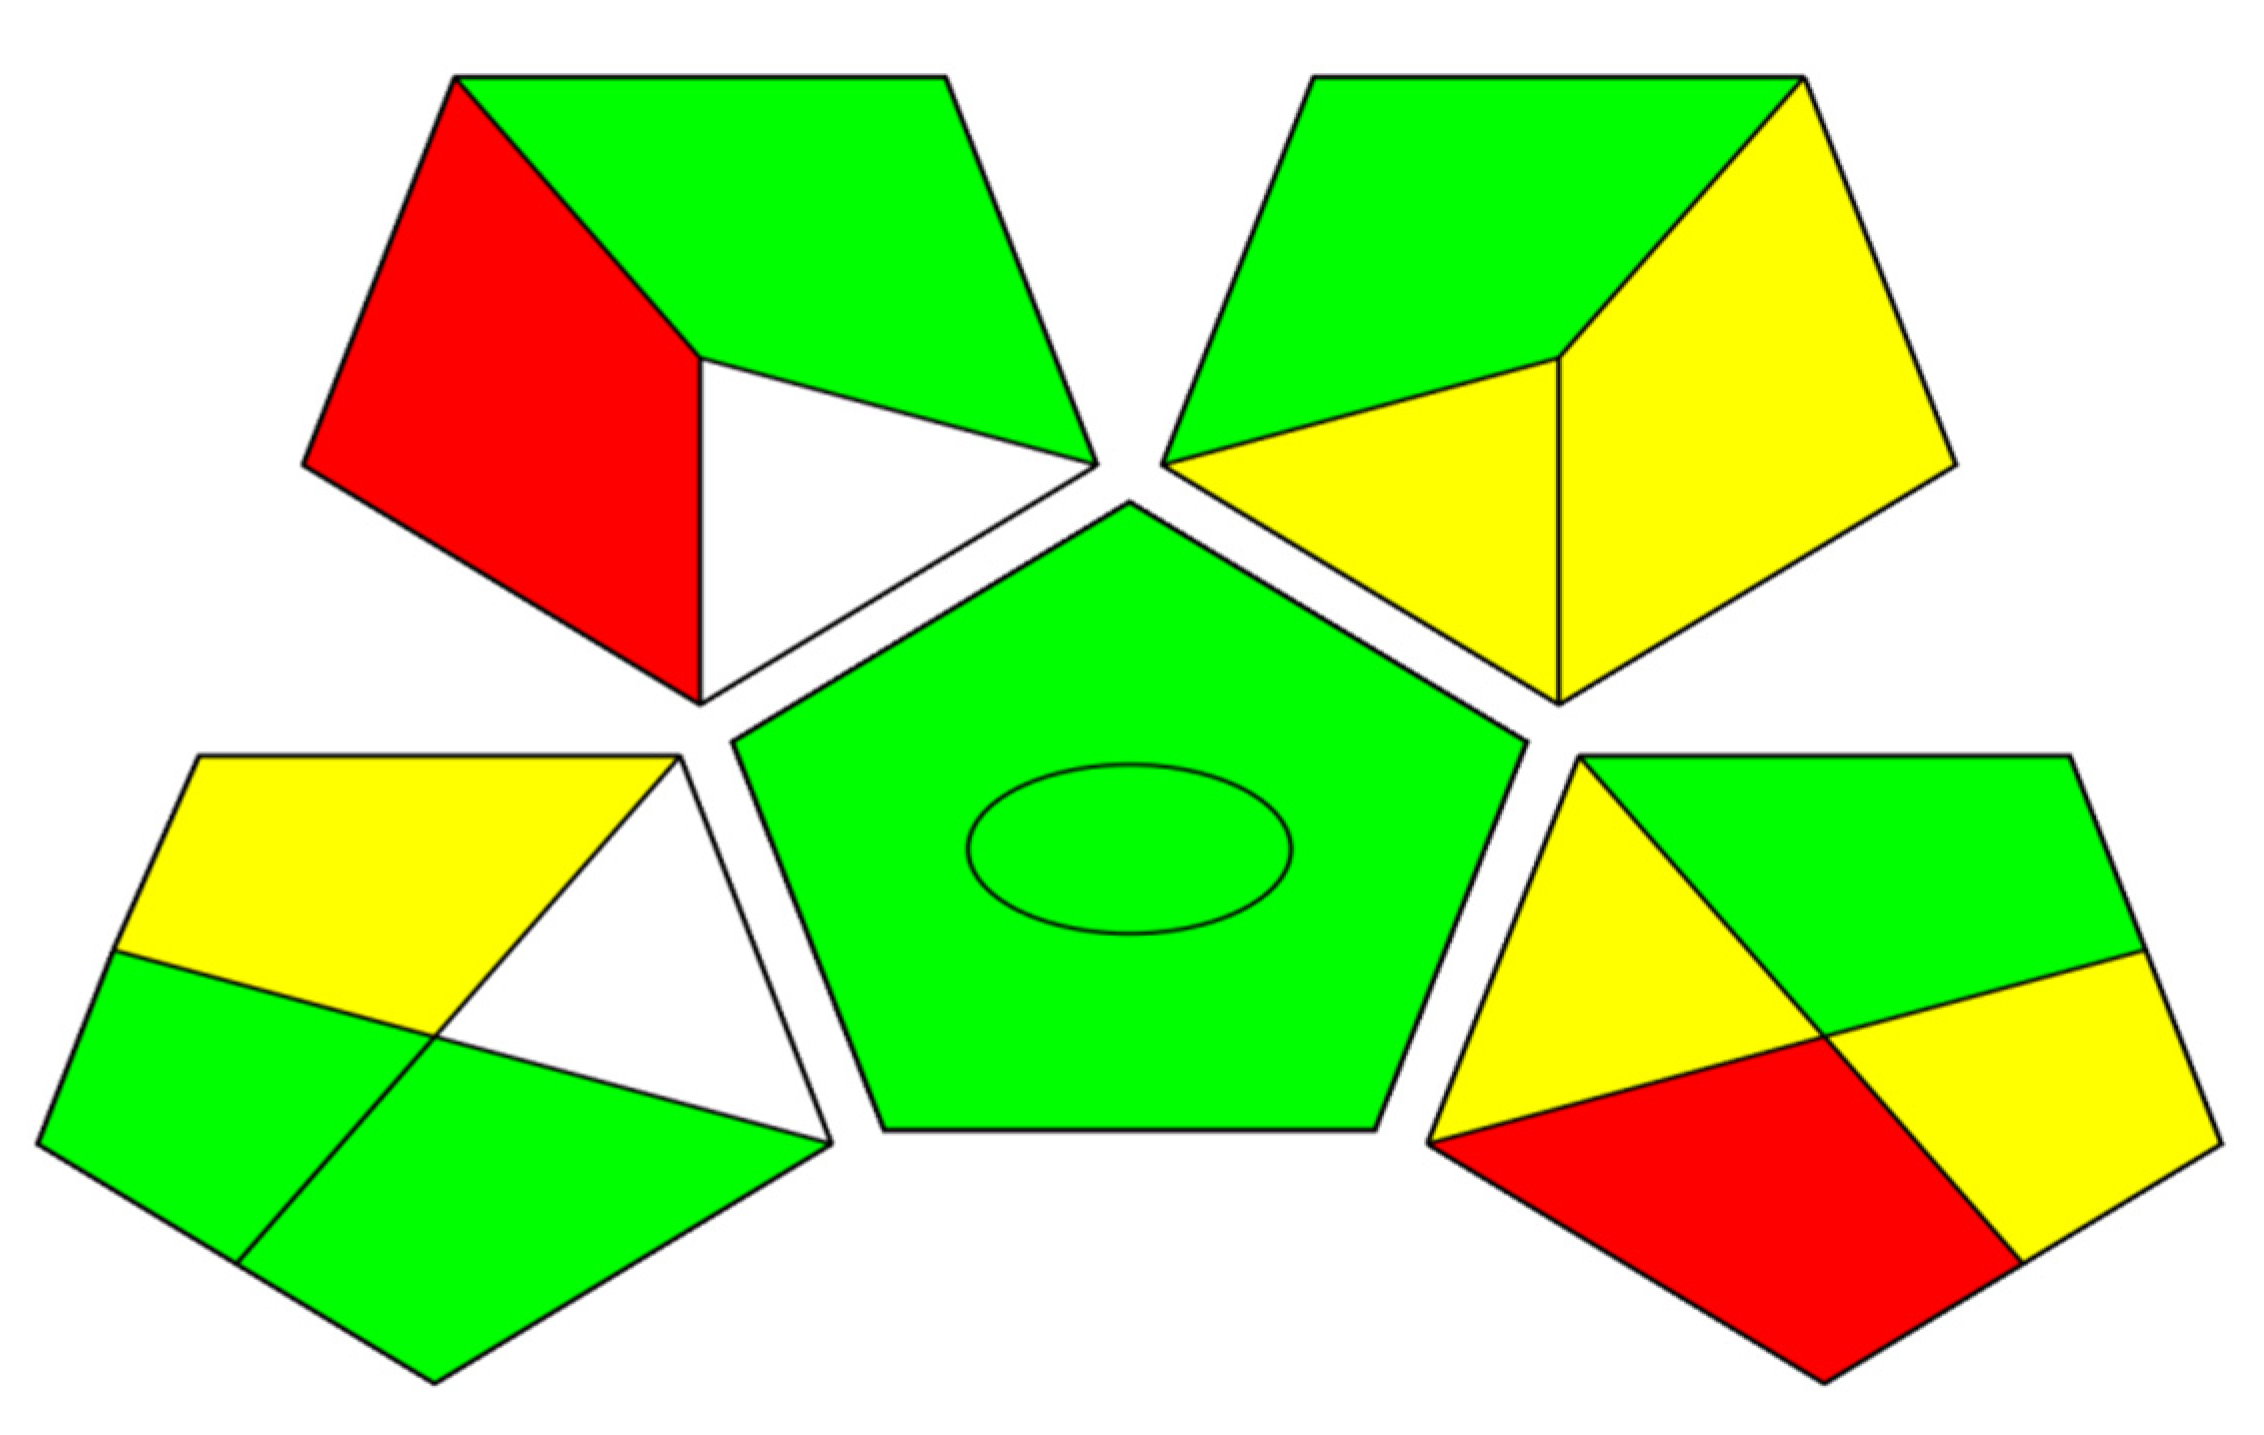
Concerning the UPLC approach, the authors did their best to utilize greener ethanol instead of methanol. However, inconvenient outcomes were obtained in terms of peak resolution and shape. Therefore, methyl alcohol was mandatory for a successful chromatogram, with the UPLC approach’s AGREE [26] total score of 0.7 indicating the relative greenness features, as illustrated in Figure 4. The majority of subsections in the GAPI pictogram [27] were in green, as demonstrated in Figure 5, referring to overall green features too. Only two red subdivisions were recorded: subdivision 7, because some of the reagents were relatively non-ecofriendly, and subdivision 15, where no waste treatment was performed for the novel UPLC method.
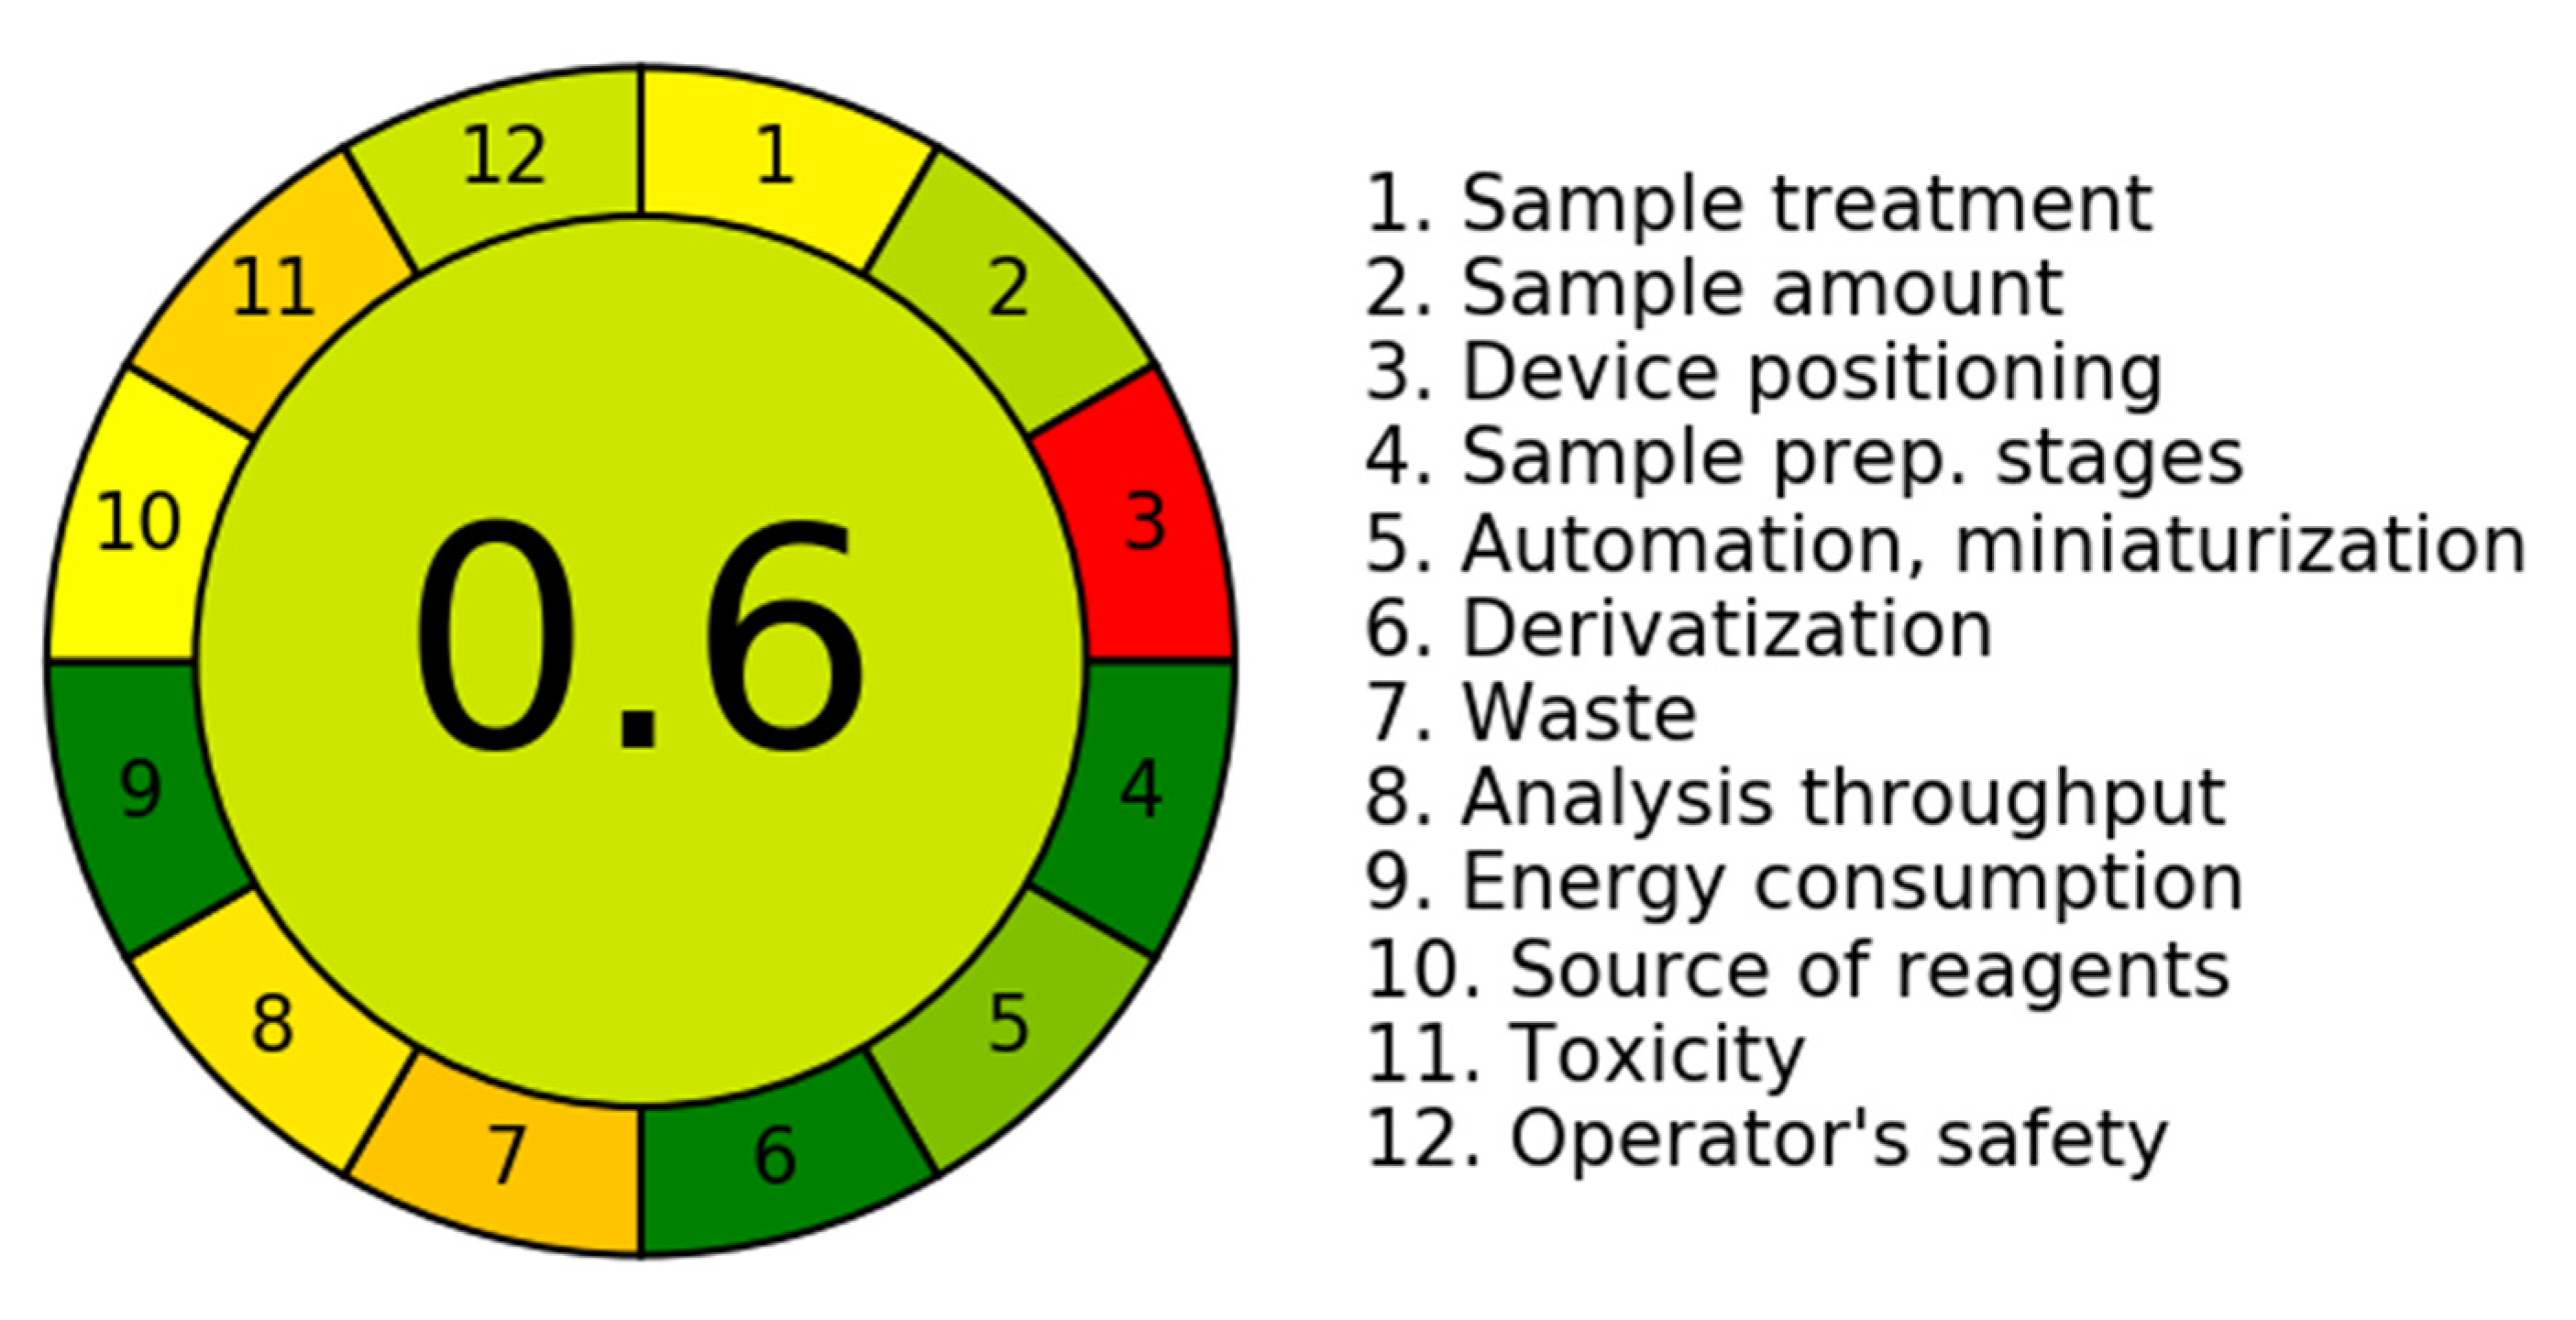
On the other hand, regarding the TLC approach, as seen in Figure 6 and Figure 7, the TLC approach’s AGREE score of 0.6 reveals acceptable eco-friendlessness qualities. Remarkably, two red subsections, 7 and 15 in the recoded GAPI figure, refer to the hazardous mandatory ethyl acetate and solvent waste non-handling for the TLC method. Generally, according to the AGREE scores, UPLC is greener than the TLC approach.

3.3. Investigation of the Methods Functionalities Using Blue Applicability Grade Index (BAGI) Software

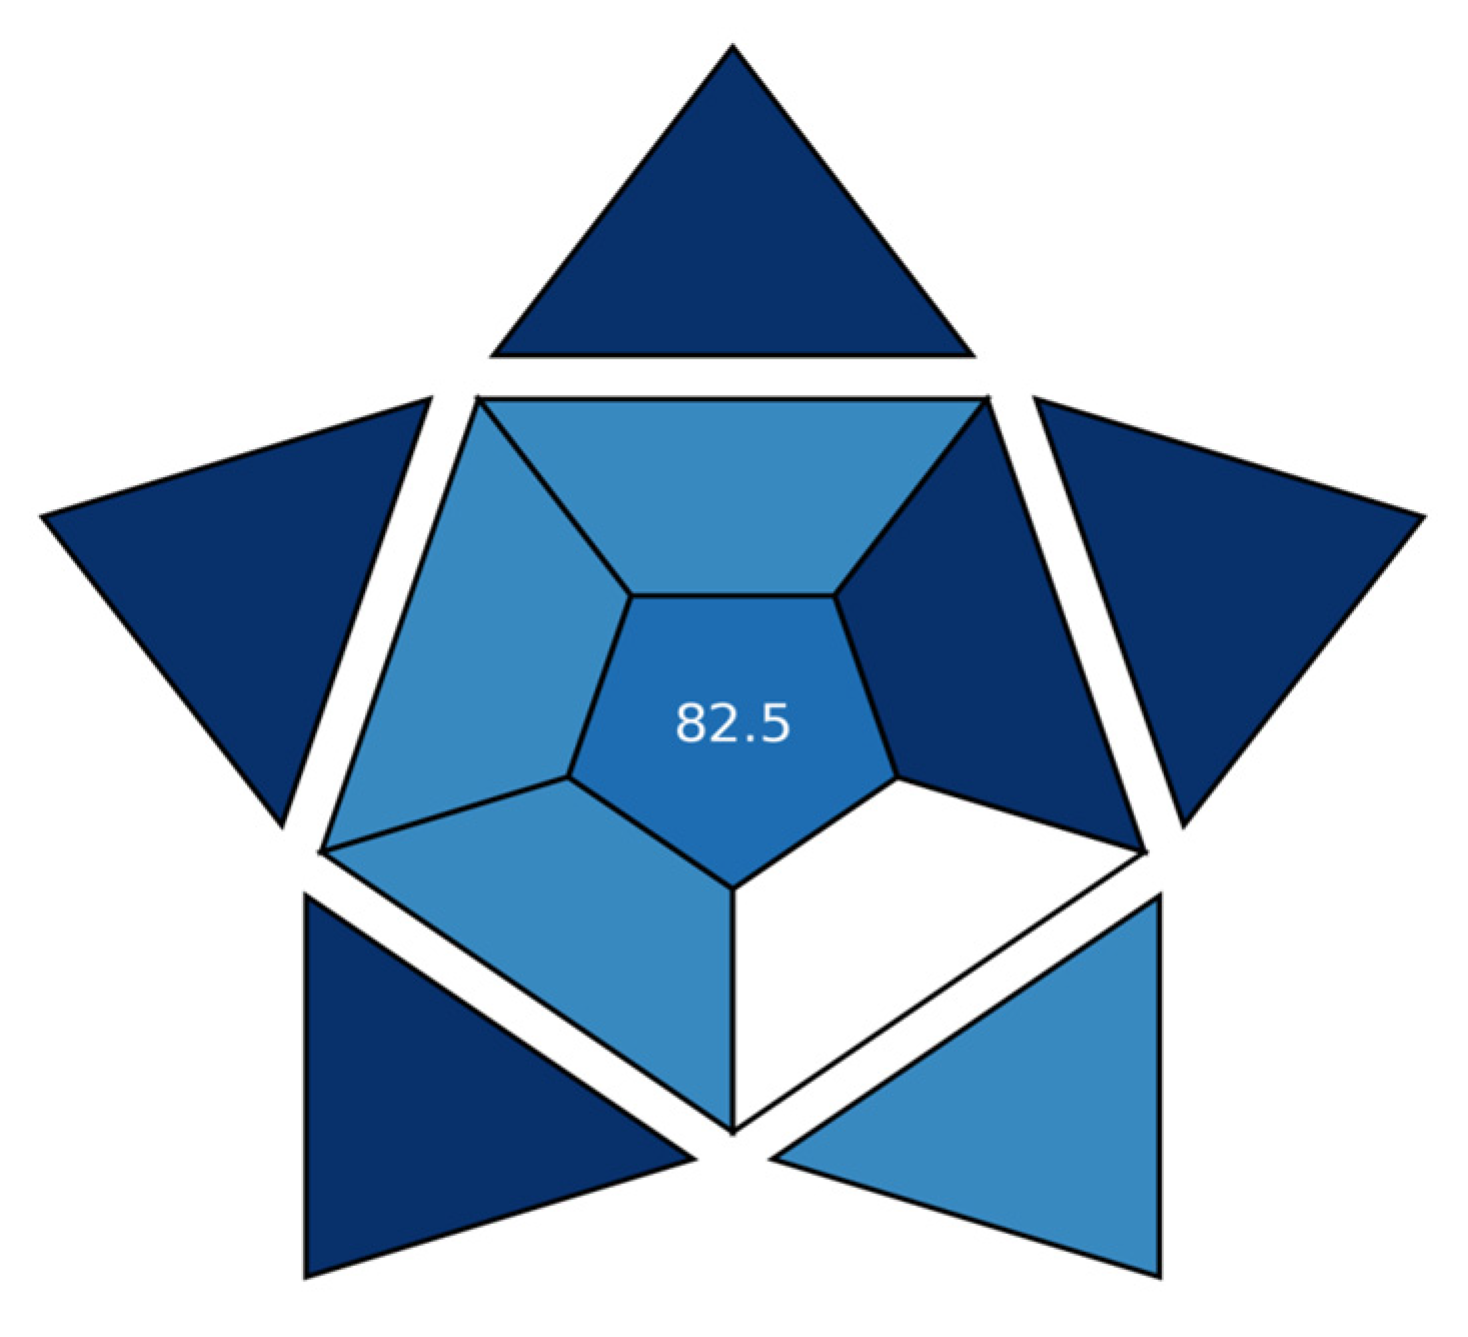
To appraise the methods’ workability, the innovative (BAGI) software program was used [28]. The BAGI tool assesses the analytical method using ten features to produce an index score and an image mimicking an asteroid. The BAGI approach has lately been reported in many publications to assess methods’ functionality [29,30,31,32]. Herein, the total BAGI scores were 82.5 and 77.5 for the UPLC and TLC approaches, respectively, representing the workability and functionality of the new chromatographic approaches, as seen in Figure 8 and Figure 9. This convenient score and many intense blue subsections because of the medicine and its main toxic impurity were assayed in a single chromatographic run using the same mobile phases. One clear disadvantage was that only one sample could be prepared for one Avil ampoule. Therefore, the white subdivision 4 was noticed. Indeed, the UPLC approach achieved a higher BAGI score than the TLC one because of the shorter analysis time for the UPLC approach, where more than ten samples could be analyzed per 60 min.
Concisely, the greenness features were slightly achieved as a result of the usage of methanol and ethyl acetate in the mobile phases. In contrast, the usefulness of the novel UPLC and TLC approaches was assured via concurrent analysis of the drug and its main toxic impurity using fast and straight analytical processes.

3.4. Validation

In agreement with the ICH guidelines, validation protocols for the suggested TLC and RP-UHPLC approaches were developed.

3.4.1. Linearity

Linearity is a more specific validation component that ensures the relationship between the drug concentrations (independent variable) and measured peak areas (dependent variable) are truly linear within a certain range. Using the UPLC approach, a linear range between the peak areas and PAM and BNZ concentrations was identified. The UPLC technique was linear in the ranges of 5–70 and 0.05–10 µg/mL for PAM and BNZ, correspondingly (Table 2). Moreover, using the TLC approach (Table 2), linearity was demonstrated in the ranges of 0.5–8.0 and 0.1–3.0 μg/band for PAM and BNZ, respectively.

3.4.2. Accuracy Assessment and Application to Avil Ampoule Formulation

The proposed approaches’ accuracy was checked and proved after the analysis of pure samples of PAM and BNZ at different concentrations. Then, using the corresponding formula, the PAM and BNZ concentrations were accurately calculated.
Standard addition procedures were applied to the Avil® pharmaceutical dosage form to ensure the proposed methods’ accuracy (Table 3). Satisfactory outcomes were reported based on the closeness of average recoveries to 100% and low values of SD that were less than 1.5.

3.4.3. Repeatability and Intermediate Precision

Table 2 displays the estimation of the new approaches’ precision based on repeatability and intermediate precision. Satisfactory outcomes are reported in Table 2, based on the closeness of average recoveries to 100% and low values of RSD that are less than 1.5.
-
Repeatability
By analyzing PAM and BNZ at three different levels throughout three trials conducted on the same day, the repeatability was verified. The concentrations used were 10, 20, and 30 μg/mL for PAM while BNZ concentrations were 0.5, 1.0, and 2.5 μg/mL. Good repeatability was verified with acceptable % RSD values.
In the TLC method, repeatability was checked by analysis of PAM and BNZ at three different concentrations, three times on the same day. The concentrations used were 4, 5, and 7 μg/band for PAM and 0.6, 1.0, and 2.5 μg/band for BNZ. Good repeatability was verified by the resulting satisfactory % RSD values, as illustrated in Table 2.
-
Intermediate Precision
PAM and BNZ were measured for analysis using the same three mentioned concentration in repeatability, three times, but over three successive days (interdaily). Acceptable % RSD values were obtained.

3.4.4. Selectivity

The optimum separation of PAM and BNZ components proved the selectivity of the new approaches. Selectivity was also verified by the application of the chromatographic techniques to the Avil® ampoule, and no interference from the excipients was detected (Table 3).

3.4.5. Robustness

In selected chromatographic conditions of the proposed methods, very small changes were applied to prove the robustness, including the ratio of methanol, scanning wavelength, and flow rate for the UPLC method, and the ratio of ethyl acetate, scanning wavelength, and saturation time for the TLC method. There were not any critical changes in peak areas in either of the two methods, as detailed in Table 4.

3.4.6. Assessment of Chromatographic System Suitability

To ensure the efficiency of the chosen systems in the novel methods both before and during the analysis process, system suitability parameters were measured. The operated tests were capacity, resolution, and tailing factors; selectivity; height of theoretical plate; and column efficiency. The results were within the reference range, ensuring the acceptance of the novel methods, as proven in Table 5.

3.5. Comparisons between Novel UPLC and TLC Methods and Those of Previously Reported LC and TLC Methods

Statistical analysis, including common significance testing, such as the t-test, was performed to determine if there was a significant difference in accuracy and precision between the novel chromatographic approaches and the reported reference LC-DAD method [1]. Furthermore, the variances of two or more groups are typically compared using the F-test. A statistical comparison was made between the outcomes obtained by applying the novel approaches to Avil ampoules and the published LC one [1]; Table 6 shows information on the determined pheniramine maleate by the stated HPLC method using phosphate buffer and acetonitrile solvents [1]. Furthermore, if the t-statistic and F-statistic are less than the critical values, it is concluded that there are no significant differences between the results, as in our case, listed in Table 6.
Additionally, Table 7 summarizes the comparison of the linear ranges between the novel UPLC and TLC methods and those of previously reported LC and TLC methods [1,18] in the literature. The novel UPLC method can detect as low as 5 and 0.05 μg/mL, while the old LC [1] can detect 10 and 10 μg/mL for PAM and BNZ, respectively. Furtermore, the novel TLC method can detect as low as 0.5 and 0.1 μg/band, while the old TLC [18] can detect 10 and 2 μg/band for PAM and BNZ, respectively. Remarkably, the two novel methods are more sensitive than the old ones.
Concerning the mobile system’s composition, the novel UPLC liquid phase was composed of methanol and water, while in the old HPLC one [1], it was composed of acetonitrile and phosphate buffer. As methanol is less toxic than acetonitrile [33], the novel UPLC approach is greener. Additionally, the novel TLC liquid phase was composed of ethanol, ethyl acetate, and liquid ammonia, while in the old TLC one [18], it was composed of methanol, ethyl acetate, and 33.0 percent ammonia. As ethanol is greener than methanol [33], the novel TLC approach is greener. Concerning the total analysis time in the new UPLC, it was less than 5 min, while in the reported HPLC one [1], the total chromatographic time was about 30 min. However, the previously reported HPLC method’s [1] long analysis time is attributed to assessment of naphazoline HCl along with two impurities in addition to PAM and BNZ. The total run time in the reported TLC method [18] and the new TLC one was relatively the same, as listed in Table 7.
Generally, the new UPLC and TLC methods outperform the old ones in terms of quickness, greenness, and sensitivity.

3.6. Merits of the Two Novel UPLC and TLC Methods

UPLC particle sizes are smaller if compared to traditional HPLC. Therefore, higher pressures could be applied with higher flow rates, leading to significantly faster analysis times. This is very crucial when high throughput is required in pharmaceutical company quality control laboratories [34]. UPLC chromatograms are characterized by sharper symmetrical peaks and lower limits of detection. Therefore, its sensitivity is greatly enhanced, particularly for trace analysis [34]. The UPLC instrument has the ability to separate closely related drugs and their impurities more effectively, demonstrating better resolution [35].
The key merits of the novel UPLC technique over traditional HPLC are (1) faster analysis time; (2) enhanced sensitivity, particularly for trace analysis, such as BNZ impurity; (3) it provides better resolution; (4) it reduces the overall solvent consumption; therefore, it is more environmentally friendly and cost-effective; (5) smaller sample volumes can efficiently be analyzed using the UPLC instrument [34,35].
The modern TLC technique has long been used in analytical laboratories due to its simplicity, affordability, cost, and versatility. Its ability to efficiently separate and identify compounds in a short time has made it a precious and economic tool for a wide range of applications, including pharmaceutical assays. TLC has become more and more popular in recent years, especially when coupled with innovative microextraction methods. When coupled with TLC, these techniques provide a powerful and synergistic approach for analyzing trace-level components. By combing microextraction with TLC, chemists can achieve rapid and accurate assessments, even for challenging samples with trace-level concentrations [36,37].

4. Conclusions

Novel, rapid, eco-friendly, and selective chromatographic UPLC and TLC approaches were successfully adapted for the assessment of pheniramine maleate and its toxic impurity, 2-benzyle pyridine. The techniques succeeded well in analyzing pheniramine maleate in its pharmaceuticals without the involvement of excipients or additives. Furthermore, the UPLC and TLC approaches’ AGREE total scores of 0.7 and 0.6 indicate the relative greenness features. Finally, total BAGI scores were 82.5 and 77.5 for the UPLC and TLC approaches, respectively, representing the workability and functionality of the new chromatographic approaches.

Study Limitations and Future Prospects

In terms of the UPLC methods greenness, ethanol is regarded as the most desirable solvent after water because of its greenness aspects. So, mixtures of ethanol and deionized water as a mobile phase were principally tested in diverse ratios, but low selectivity was obtained between PAM and BNZ. Replacement of the methyl alcohol portion in the mobile phase with ethanol will greatly improve greenness characteristics for the novel UPLC approach. Unfortunately, this could not be achieved in this UPLC study. In contrast, concerning the TLC approach, replacement of ammonia with greener alternatives such as triethylamine or diethylamine will enrich greenness aspects for the TLC approach. Indeed, they were not available during the TLC practical chromatographic assessment. Furthermore, more pharmaceutical formulations containing PAM should be evaluated, such as antihistaminic and common cold tablets, ampoules, and syrups, using the aforementioned chromatographic approaches to investigate the presence of the toxic impurity (BNZ).

Author Contributions

Conceptualization, N.S.A., E.A.A. and D.A.A.E.E.; methodology, H.S.A., F.K.A. and A.M.M.; software, H.S.A. and F.K.A.; validation, N.S.A., E.A.A., D.A.A.E.E. and M.G.; formal analysis, H.S.A., F.K.A. and A.M.M.; investigation and resources, N.S.A., E.A.A. and D.A.A.E.E.; data curation, H.S.A., F.K.A. and M.G.; writing—original draft preparation, A.M.M., N.S.A. and E.A.A.; writing—review and editing, M.G., H.S.A. and F.K.A.; supervision, F.K.A. and D.A.A.E.E.; project administration, N.S.A.; funding acquisition, H.S.A. All authors have read and agreed to the published version of the manuscript.

Funding

This research was funded by Princess Nourah bint Abdulrahman University Researchers Supporting Project, number PNURSP2024R185, Princess Nourah bint Abdulrahman University, Riyadh, Saudi Arabia.

Institutional Review Board Statement

Not applicable for studies not involving humans or animals.

Informed Consent Statement

Not applicable.

Data Availability Statement

All the data presented (e.g., in the figures or tables) are original and included in the main article. Many software programs were used to assess the methods’ greenness and blueness. The references for these software programs are included in the reference list.

Acknowledgments

Princess Nourah bint Abdulrahman University Researchers Supporting Project number PNURSP2024R185, Princess Nourah bint Abdulrahman University, Riyadh, Saudi Arabia.

Conflicts of Interest

The researchers declare no conflicts of interest regarding this analytical chemistry project.

References

  1. Kelani, K.M.; Hegazy, M.A.; Hassan, A.M.; Tantawy, M.A. Determination of naphazoline HCl, pheniramine maleate and their official impurities in eye drops and biological fluid rabbit aqueous humor by a validated LC-DAD method. RSC Adv. 2021, 11, 7051–7058. [Google Scholar] [CrossRef] [PubMed]
  2. Huang, T.; Chen, N.; Wang, D.; Lai, Y.; Cao, Z. A validated stability-indicating HPLC method for the simultaneous determination of pheniramine maleate and naphazoline hydrochloride in pharmaceutical formulations. Chem. Cent. J. 2014, 8, 7. [Google Scholar] [CrossRef] [PubMed]
  3. Sweetman, S.C. Martindale: The Complete Drug Reference; Pharmaceutical Press: London, UK, 2009; Volume 3709. [Google Scholar]
  4. British Pharmacopoeia. Pheniramine Maleate Monograph. 2013. Available online: https://search.worldcat.org/title/British-pharmacopoeia-2013/oclc/809536883 (accessed on 1 October 2024).
  5. Raghu, M.; Basavaiah, K. Rapid and Sensitive Extraction-Free Spectrophotometric Methods for the Determination of Pheniramine Maleate Using Three Sulphonthalein Dyes. Proc. Natl. Acad. Sci. India Sect. A Phys. Sci. 2012, 82, 187–196. [Google Scholar] [CrossRef]
  6. Raghu, M.; Basavaiah, K. Two charge-transfer complexation reactions for spectrophotometric determination of pheniramine maleate using π-acceptors. J. Sci. Ind. Res. 2011, 70, 851–858. [Google Scholar]
  7. Raghu, M.S.; Basavaiah, K.; Ramesh, P.J.; Abdulrahman, S.A.; Vinay, K.B. Development and validation of a uv-spectrophotometric method for the determination of pheniramine maleate and its stability studies. J. Appl. Spectrosc. 2012, 79, 131–138. [Google Scholar] [CrossRef]
  8. Mehmood, Y.; Saleem, N.; Mahmood, R.K.; Riaz, H.; Raza, S.A. Analytical Method Development and Validation of Pheniramine Maleate Injection. International J. Drug Dev. Res. 2016, 8, 044–048. [Google Scholar]
  9. Raghu, M.S.; Basavaiah, K.; Abdulrahaman, S.A.; Prashanth, K.N.; Vinay, K.B. Sensitive and selective spectrophotometric methods for the determination of pheniramine maleate in bulk drug and in its formulations using sodium hypochlorite. J. Anal. Chem. 2013, 68, 969–976. [Google Scholar] [CrossRef]
  10. Fattah, S.A.; Kelany, K.O.; El-Zeany, B.A.; El-Tarras, M.F. Analysis of Pheniramine Naleate and Cblorpheniramine Maleate Via Their Fe (III) Cohplexes. Anal. Lett. 1987, 20, 1667–1678. [Google Scholar] [CrossRef]
  11. Raghu, M.S.; Basavaiah, K.; Prashanth, K.N.; Vinay, K.B. Acid-base titrimetric assay of pheniramine maleate in pharmaceuticals in hydro-alcoholic medium. Der Pharm. Lett. 2012, 4, 1523–1529. [Google Scholar]
  12. Pandey, A.K.; Dwivedi, D. Titrimetric assay of some antihistamine drugs with pyridinium fluoro chromate (pfc) reagent. J. Drug Deliv. Ther. 2018, 8, 407–410. [Google Scholar] [CrossRef]
  13. Caglar, H.; Buyuktuncel, S. HPLC method development and validation: Simultaneous determination of active ingredients in cough and cold pharmaceuticals. Int. J. Pharm. Pharm. Sci. 2014, 6, 421–428. [Google Scholar]
  14. Dongala, T.; Katari, N.K.; Palakurthi, A.K.; Jonnalagadda, S.B. Development and validation of a generic RP-HPLC PDA method for the simultaneous separation and quantification of active ingredients in cold and cough medicines. Biomed. Chromatogr. 2019, 33, e4641. [Google Scholar] [CrossRef] [PubMed]
  15. Liu, Y.; Zhu, B.; Xue, M.; Jiang, Z.; Guo, X. Studies on the chiral separation of pheniramine and its enantioselective pharmacokinetics in rat plasma by HPLC-MS/MS. Microchem. J. 2020, 156, 104989. [Google Scholar] [CrossRef]
  16. Zheng, R.; Wu, Y.H.; Jiang, D.X.; Zhang, D. Determination of metabolite of nicergoline in human plasma by high-performance liquid chromatography and its application in pharmacokinetic studies. J. Pharm. Anal. 2012, 2, 62–66. [Google Scholar] [CrossRef] [PubMed]
  17. Subramaniyan, S.P.; Das, S.K. Rapid identification and quantification of chlorpheniramine maleate or pheniramine maleate in pharmaceutical preparations by thin-layer chromatography-densitometry. J. AOAC Int. 2004, 87, 1319–1322. [Google Scholar] [CrossRef]
  18. Kelani, K.M.; Hegazy, M.A.; Hassan, A.M.; Tantawy, M.A. A green TLC densitometric method for the simultaneous detection and quantification of naphazoline HCl, pheniramine maleate along with three official impurities. BMC Chem. 2022, 16, 24. [Google Scholar] [CrossRef]
  19. Mikuš, P.; Valášková, I.; Havránek, E. Enantioselective determination of pheniramine in pharmaceuticals by capillary electrophoresis with charged cyclodextrin. J. Pharm. Biomed. Anal. 2005, 38, 442–448. [Google Scholar] [CrossRef]
  20. Phatthiyaphaibun, K.; Som-Aum, W.; Srisa-Ard, M.; Threeprom, J. Determination of pheniramine enantiomers in eye drop by capillary electrophoresis using hydroxypropyl-β-cyclodextrin as chiral selector. J. Anal. Chem. 2010, 65, 755–759. [Google Scholar] [CrossRef]
  21. Ribeiro, M.M.; Marra, M.C.; Costa, B.M.; Oliveira, T.C.; Batista, A.D.; Muñoz, R.A.; Richter, E.M. Sub-Minute Method for Determination of Naphazoline in the Presence of Diphenhydramine, Pheniramine or Chlorpheniramine by Capillary Electrophoresis. J. Braz. Chem. Soc. 2018, 29, 1959–1964. [Google Scholar] [CrossRef]
  22. Jain, R.; Sharma, S. Glassy carbon electrode modified with multi-walled carbon nanotubes sensor for the quantification of antihistamine drug pheniramine in solubilized systems. J. Pharm. Anal. 2012, 2, 56–61. [Google Scholar] [CrossRef]
  23. Kelani, K.M.; Hegazy, M.A.; Hassan, A.M.; Tantawy, M.A. Application of multivariate chemometrics tools for spectrophotometric determination of naphazoline HCl, pheniramine maleate and three official impurities in their eye drops. Sci. Rep. 2023, 13, 19678. [Google Scholar] [CrossRef] [PubMed]
  24. Elzanfaly, E.S.; Hegazy, M.A.; Saad, S.S.; Salem, M.Y.; Abd El Fattah, L.E. Validated green high-performance liquid chromatographic methods for the determination of coformulated pharmaceuticals: A comparison with reported conventional methods. J. Sep. Sci. 2015, 38, 757–763. [Google Scholar] [CrossRef] [PubMed]
  25. Gamal, M.; Naguib, I.A.; Panda, D.S.; Abdallah, F.F. Comparative study of four greenness assessment tools for selection of greenest analytical method for assay of hyoscine N -butyl bromide. Anal. Methods 2021, 13, 369–380. [Google Scholar] [CrossRef] [PubMed]
  26. Pena-Pereira, F.; Wojnowski, W.; Tobiszewski, M. AGREE-Analytical GREEnness Metric Approach and Software. Anal. Chem. 2020, 92, 10076–10082. [Google Scholar] [CrossRef] [PubMed]
  27. Płotka-Wasylka, J. A new tool for the evaluation of the analytical procedure: Green Analytical Procedure Index. Talanta 2018, 181, 204–209. [Google Scholar] [CrossRef]
  28. Manousi, N.; Wojnowski, W.; Płotka-Wasylka, J.; Samanidou, V. Blue applicability grade index (BAGI) and software: A new tool for the evaluation of method practicality. Green Chem. 2023, 25, 7598–7604. [Google Scholar] [CrossRef]
  29. Elbordiny, H.S.; Elonsy, S.M.; Daabees, H.G.; Belal, T.S. Design of Trio-colored Validated HPLC Method for Synchronized Multianalyte quantitation of Four Top Selling Antihyperlipidemic Drugs in Different Fixed-Dose Combined Tablets. Green Anal. Chem. 2024, 8, 100100. [Google Scholar] [CrossRef]
  30. Yenduri, S.; Varalakshm, H.N.I. Assessment and comparison of sustainability aspects of UV-spectroscopy methods for simultaneous determination of anti-hypertensive combination. Green Anal. Chem. 2024, 9, 100108. [Google Scholar] [CrossRef]
  31. Habib, N.M.; Tony, R.M.; AlSalem, H.S.; Algethami, F.K.; Gamal, M. Evaluation of the Greenness, Whiteness, and blueness profiles of stability indicating HPLC method for determination of Denaverine hydrochloride and benzyl alcohol in pharmaceuticals. Microchem. J. 2024, 201, 110733. [Google Scholar] [CrossRef]
  32. Abdelfatah, R.M.; Abd Elhalim, L.M.; Darwish, H.W.; Ayoub, B.M.; Tony, R.M.; Gamal, M. A stability-indicating HPLC assay of ten different vitamins in a food supplement: Appraisal of the method’s greenness, whiteness, and blueness. Talanta 2024, 277, 126324. [Google Scholar] [CrossRef]
  33. Joshi, D.R.; Adhikari, N. An overview on common organic solvents and their toxicity. J. Pharm. Res. Int. 2019, 28, 1–18. [Google Scholar] [CrossRef]
  34. Swetha, S.R.; Sri, K.B.; Mounika, C. A Review on Comparative study of HPLC and UPLC. Res. J. Pharm. Technol. 2020, 13, 1570–1574. [Google Scholar]
  35. Kumar, A.; Saini, G.; Nair, A.; Sharma, R. UPLC: A preeminent technique in pharmaceutical analysis. Acta Pol. Pharm. 2012, 69, 371–380. [Google Scholar] [PubMed]
  36. Faraji, H.; Mirzaie, A.; Waqif-Husain, S. Liquid phase microextraction-ion exchange-high performance thin layer chromatography for the preconcentration, separation, and determination of plasticizers in aqueous samples. J. Sep. Sci. 2013, 36, 1486–1492. [Google Scholar] [CrossRef]
  37. Faraji, H.; Saber-Tehrani, M.; Mirzaie, A.; Waqif-Husain, S. Application of liquid-liquid microextraction-high-performance thin-layer chromatography for preconcentration and determination of phenolic compounds in aqueous samples. JPC–J. Planar Chromatogr. –Mod. TLC 2011, 24, 214–217. [Google Scholar] [CrossRef]
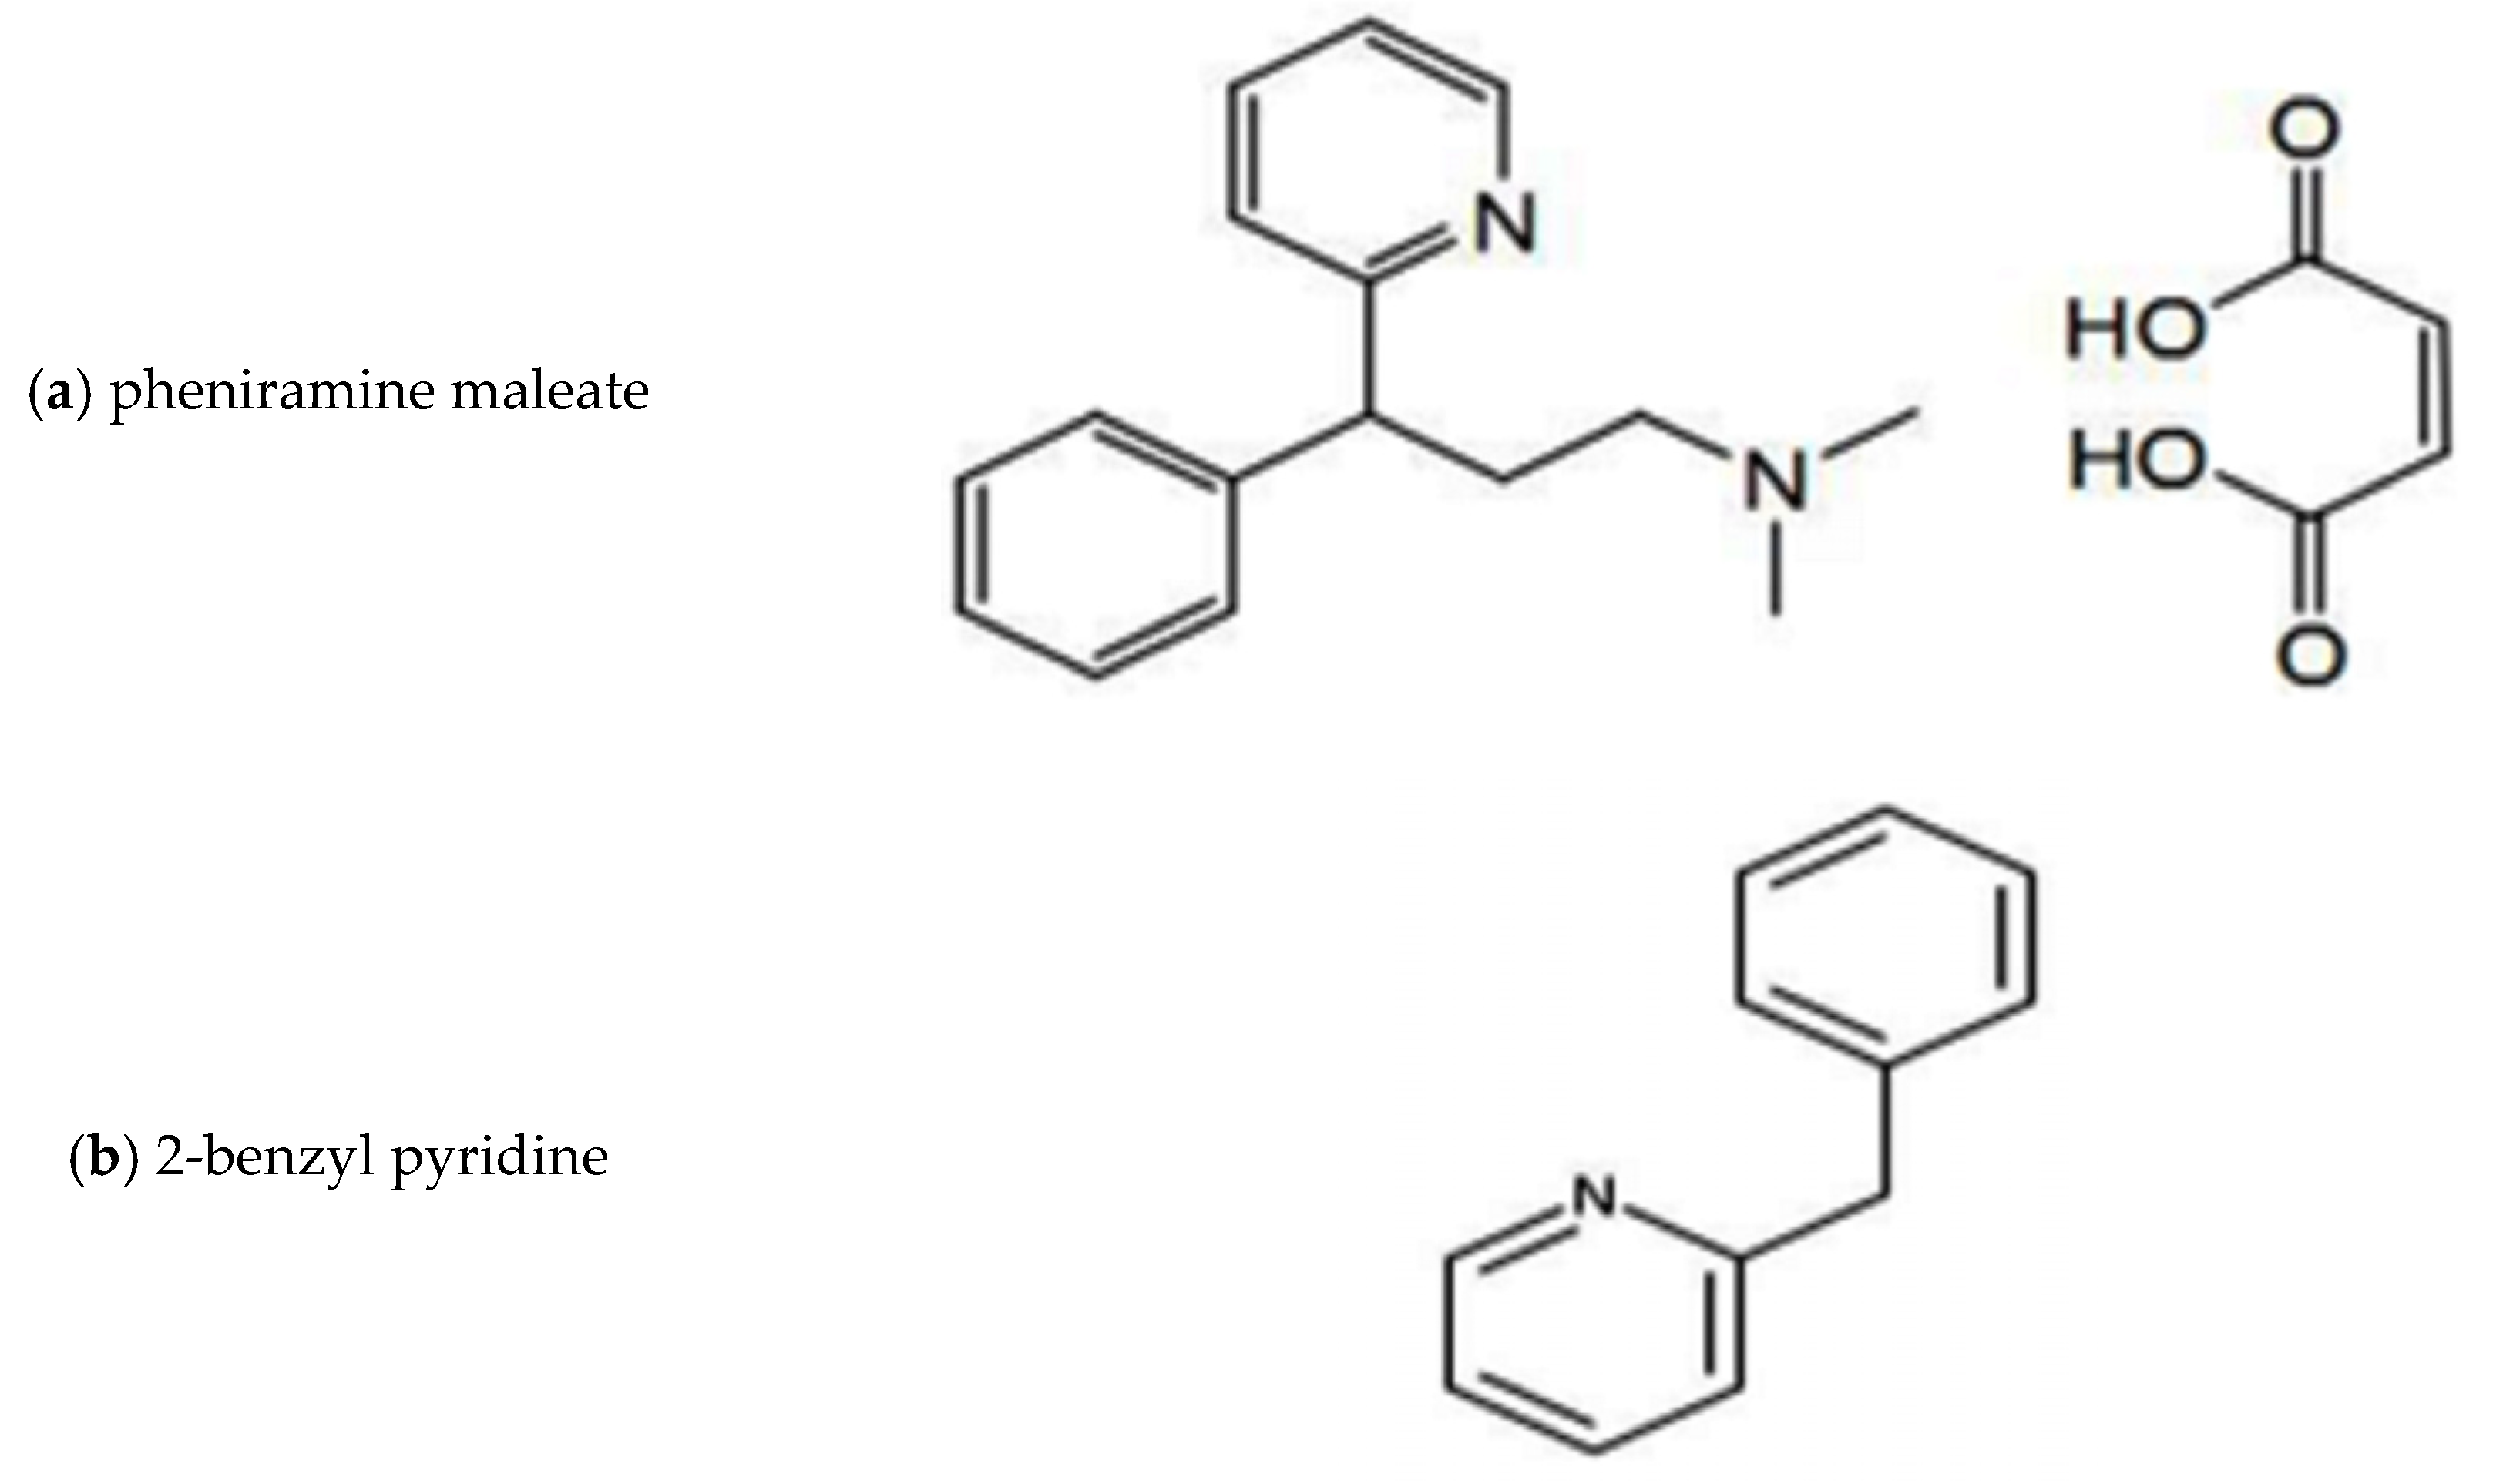
Figure 1. Structural formula of pheniramine maleate and 2-benzyl pyridine.
Chemosensors 12 00206 g001
Figure 2. RP-UPLC chromatogram of mixture of pheniramine maleate and 2-benzyl-pyridine with concentration 10 µg/mL. The mobile phase used was methanol/water (60:40 v/v).
Chemosensors 12 00206 g002
Figure 3. Two-dimensional TLC densitogram of binary mixture of PAM and BNZ, using developed system of ethanol/ethyl acetate/ammonia (8:2:0.1, by volume) at room temperature and scanned at 265 nm.
Chemosensors 12 00206 g003
Figure 4. AGREE pictogram for the novel RP-UPLC method using mobile phase of methanol/water (60:40 v/v).
Chemosensors 12 00206 g004
Figure 5. GAPI pictogram for the novel RP-UPLC method using mobile phase of methanol/water (60:40 v/v), Each criterion is assigned a green, yellow, or red rating based on its environmental significance. White sections mean not applicable.
Chemosensors 12 00206 g005
Figure 6. AGREE pictogram for the novel TLC method using mobile phase of ethanol/ethyl acetate/ammonia (8:2:0.1, by volume).
Chemosensors 12 00206 g006
Figure 7. GAPI pictogram for the novel TLC method using mobile phase of ethanol/ethyl acetate/ammonia (8:2:0.1, by volume).
Chemosensors 12 00206 g007
Figure 8. BAGI pictogram for the novel UPLC approach. Scales of dark blue to white indicate compliance levels, with dark blue representing the highest and white the lowest.
Chemosensors 12 00206 g008
Figure 9. BAGI pictogram for the novel TLC approach.
Chemosensors 12 00206 g009
Table 1. The green profile of suggested and reported UPLC and TLC methods during simultaneous determination of pheniramine maleate and 2-benzyl-pyridine.
MethodsMobile PhaseRun Time
(min)
Flow Rate
(mL/min)
Waste * (g/run)Greenness
Profile **
Developed UHPLCMethanol/water (60:40 v/v)3.900.10.39Chemosensors 12 00206 i001
Developed TLCEthanol/ethyl acetate/ammonia (8:2:0.1, by volume) 0.9 g/sampleChemosensors 12 00206 i001
Published HPLC for pheniramine maleate determination [1]Phosphate buffer pH 6.0/acetonitrile (70:30, v/v)301.0030Chemosensors 12 00206 i002
Published TLC for pheniramine maleate determination [2]Methanol/ethyl acetate/33.0% ammonia (2.0: 8.0: 1.0, by volume) Chemosensors 12 00206 i001
* Waste = (number of samples on TLC plate/volume of mobile phase per run). ** Four key profile criteria terms—PBT (persistent; bio-accumulative; toxic), hazardous, corrosive, and waste—per sample.
Table 2. Regression and validation parameters of the proposed RP-UPLC and TLC methods for determination of PAM and BNZ.
ParameterUPLCTLC
PAMBNZPAMBNZ
Linearity range (μg/mL)5.00–70.000.05–10.000.5–80.1–3
Slope0.05662.84950.82030.7319
Intercept0.86450.40621.04181.9246
Correlation coefficient0.99980.99990.99990.9999
Accuracy99.2898.0799.5499.12
Precision (RSD%) *
repeatability0.630.340.630.49
Intermediate precision0.730.410.730.65
LOD (µg/mL) **1.590.007 0.130.02
LOQ (µg/mL) **4.770.02 0.410.08
* The intraday precision (n = 3), % RSD, of the results obtained from three different concentrations repeated three times within a day; the interday precision (n = 3), % RSD, of the results obtained from three different concentrations repeated three times in three successive days. ** LOD = (3.3 × SD)/slope, and LOQ = (10 * SD)/slope.
Table 3. Determination of pheniramine maleate in its pharmaceutical formulation (Avil® ampoule) by UPLC method and application of standard addition procedures.
MethodAvil® Ampoule, Labeled to Contain 45.5 mg/2 mL, Batch No. 9EG060
Dosage formStandard Addition
Taken
(µg/mL)
Found (µg/mL)%Recovery *Added
(µg/mL)
Found
(µg/mL)
%Recovery **
RP-UPLC45.0045.71101.57 ± 0.7315.0015.00100.00
20.0020.30101.50
25.0025.25101.00
Mean ± SD100.83 ± 0.52
TLC5.005.00100.00 ±
0.57
0.500.50100.00
1.001.01101.00
2.002.02101.00
Mean ± SD100.67 ± 0.64
* refers to average of 6 measurements, and ** refers to average of 3 measurements.
Table 4. Results of robustness study of the proposed UPLC and TLC methods for determination of pheniramine maleate and 2-benzyl pyridine.
UPLCDrugRatio of methanol
60 ± 0.1 mL
Wavelength
215 ± 2 nm
Flow rate
0.1 ± 0.01 mL/min
PAM0.01 *1.010.01
BNZ0.02 *0.010.00
TLCDrugRatio of ethyl acetate
2.00 ± 0.03 mL
Wavelength 265 ± 2 nmSaturation time
20 ± 5 min
PAM0.010.000.00
BNZ0.020.040.02
* % RSD of the peak areas obtained upon making small changes in different parameters.
Table 5. UPLC parameters of system suitability testing data during determination of pheniramine maleate and 2-benzyl-pyridine.
UPLC MethodTLC Method
ParametersPAMBNZReference Value [3]PAMBNZReference Value [3]
(T) Tailing factor1.001.10<1.500.981.00<1.50
(K′) Capacity factor1.404.701.00–10.00
(N) Column efficiency3249.005760.00Increase the efficiency of separation
(H) HETP *0.0010.0008The smaller the value the higher the efficiency column
(α) Selectivity3.35α > 1.0013.00α > 1.00
(R) Resolution11.00R > 1.506.00R > 1.50
* Refers to height equivalent to a theoretical plate, (centimeters per plate).
Table 6. Statistical comparison between the developed methods and the reported method upon their application to Avil® ampoule.
ParametersUPLCTLCReported Method [1]
Mean101.57100.0099.52
SD0.730.571.06
Variance0.350.331.12
n666
t-test (2.220) *1.851.891-
F-test (5.050) *2.113.39-
* Parentheses indicate the relevant t and F values from the table at a p-value of 0.05.
Table 7. Comparisons of the linear ranges between the novel UPLC and TLC methods and the reported ones.
MethodMobile Phase/Total Run TimePAMBNZReference
Novel UPLCMethanol/water (60:40, in volume)/less than 5 min5–70 μg/mL0.05–10 μg/mL
Novel TLCEthanol/ethyl acetate/liquid ammonia (8: 2: 0.1, in volume)/5 min0.5–8 μg/band0.1–3 μg/band
Reported LCPhosphate buffer pH 6.0/acetonitrile (70:30, in volume)/30 min 10–110 μg/mL10–70 μg/mL[1]
Reported TLCMethanol/ethyl acetate/33.0% ammonia (2.0: 8.0: 1.0, in volume)/6 min10–110 μg/band2–5 μg/band[18]
Reported direct spectrophotometry at 265 nmWater5–25 μg/mL------------[8]
Disclaimer/Publisher’s Note: The statements, opinions and data contained in all publications are solely those of the individual author(s) and contributor(s) and not of MDPI and/or the editor(s). MDPI and/or the editor(s) disclaim responsibility for any injury to people or property resulting from any ideas, methods, instructions or products referred to in the content.