The Effect of Doping rGO with Nanosized MnO2 on Its Gas Sensing Properties

 ,
,  , ,
, ,  , , ,
, , ,  and
and 
Abstract
1. Introduction
2. Materials and Methods
2.1. Preparation of Reduced Graphene Oxide Doped with MnO2
2.2. Substrates Choice, Preparation, and Material Deposition
2.3. Material Characterisation and Gas Sensing Measurements
3. Results
3.1. Sensitive Layer Characterisation
3.1.1. Raman
3.1.2. FESEM
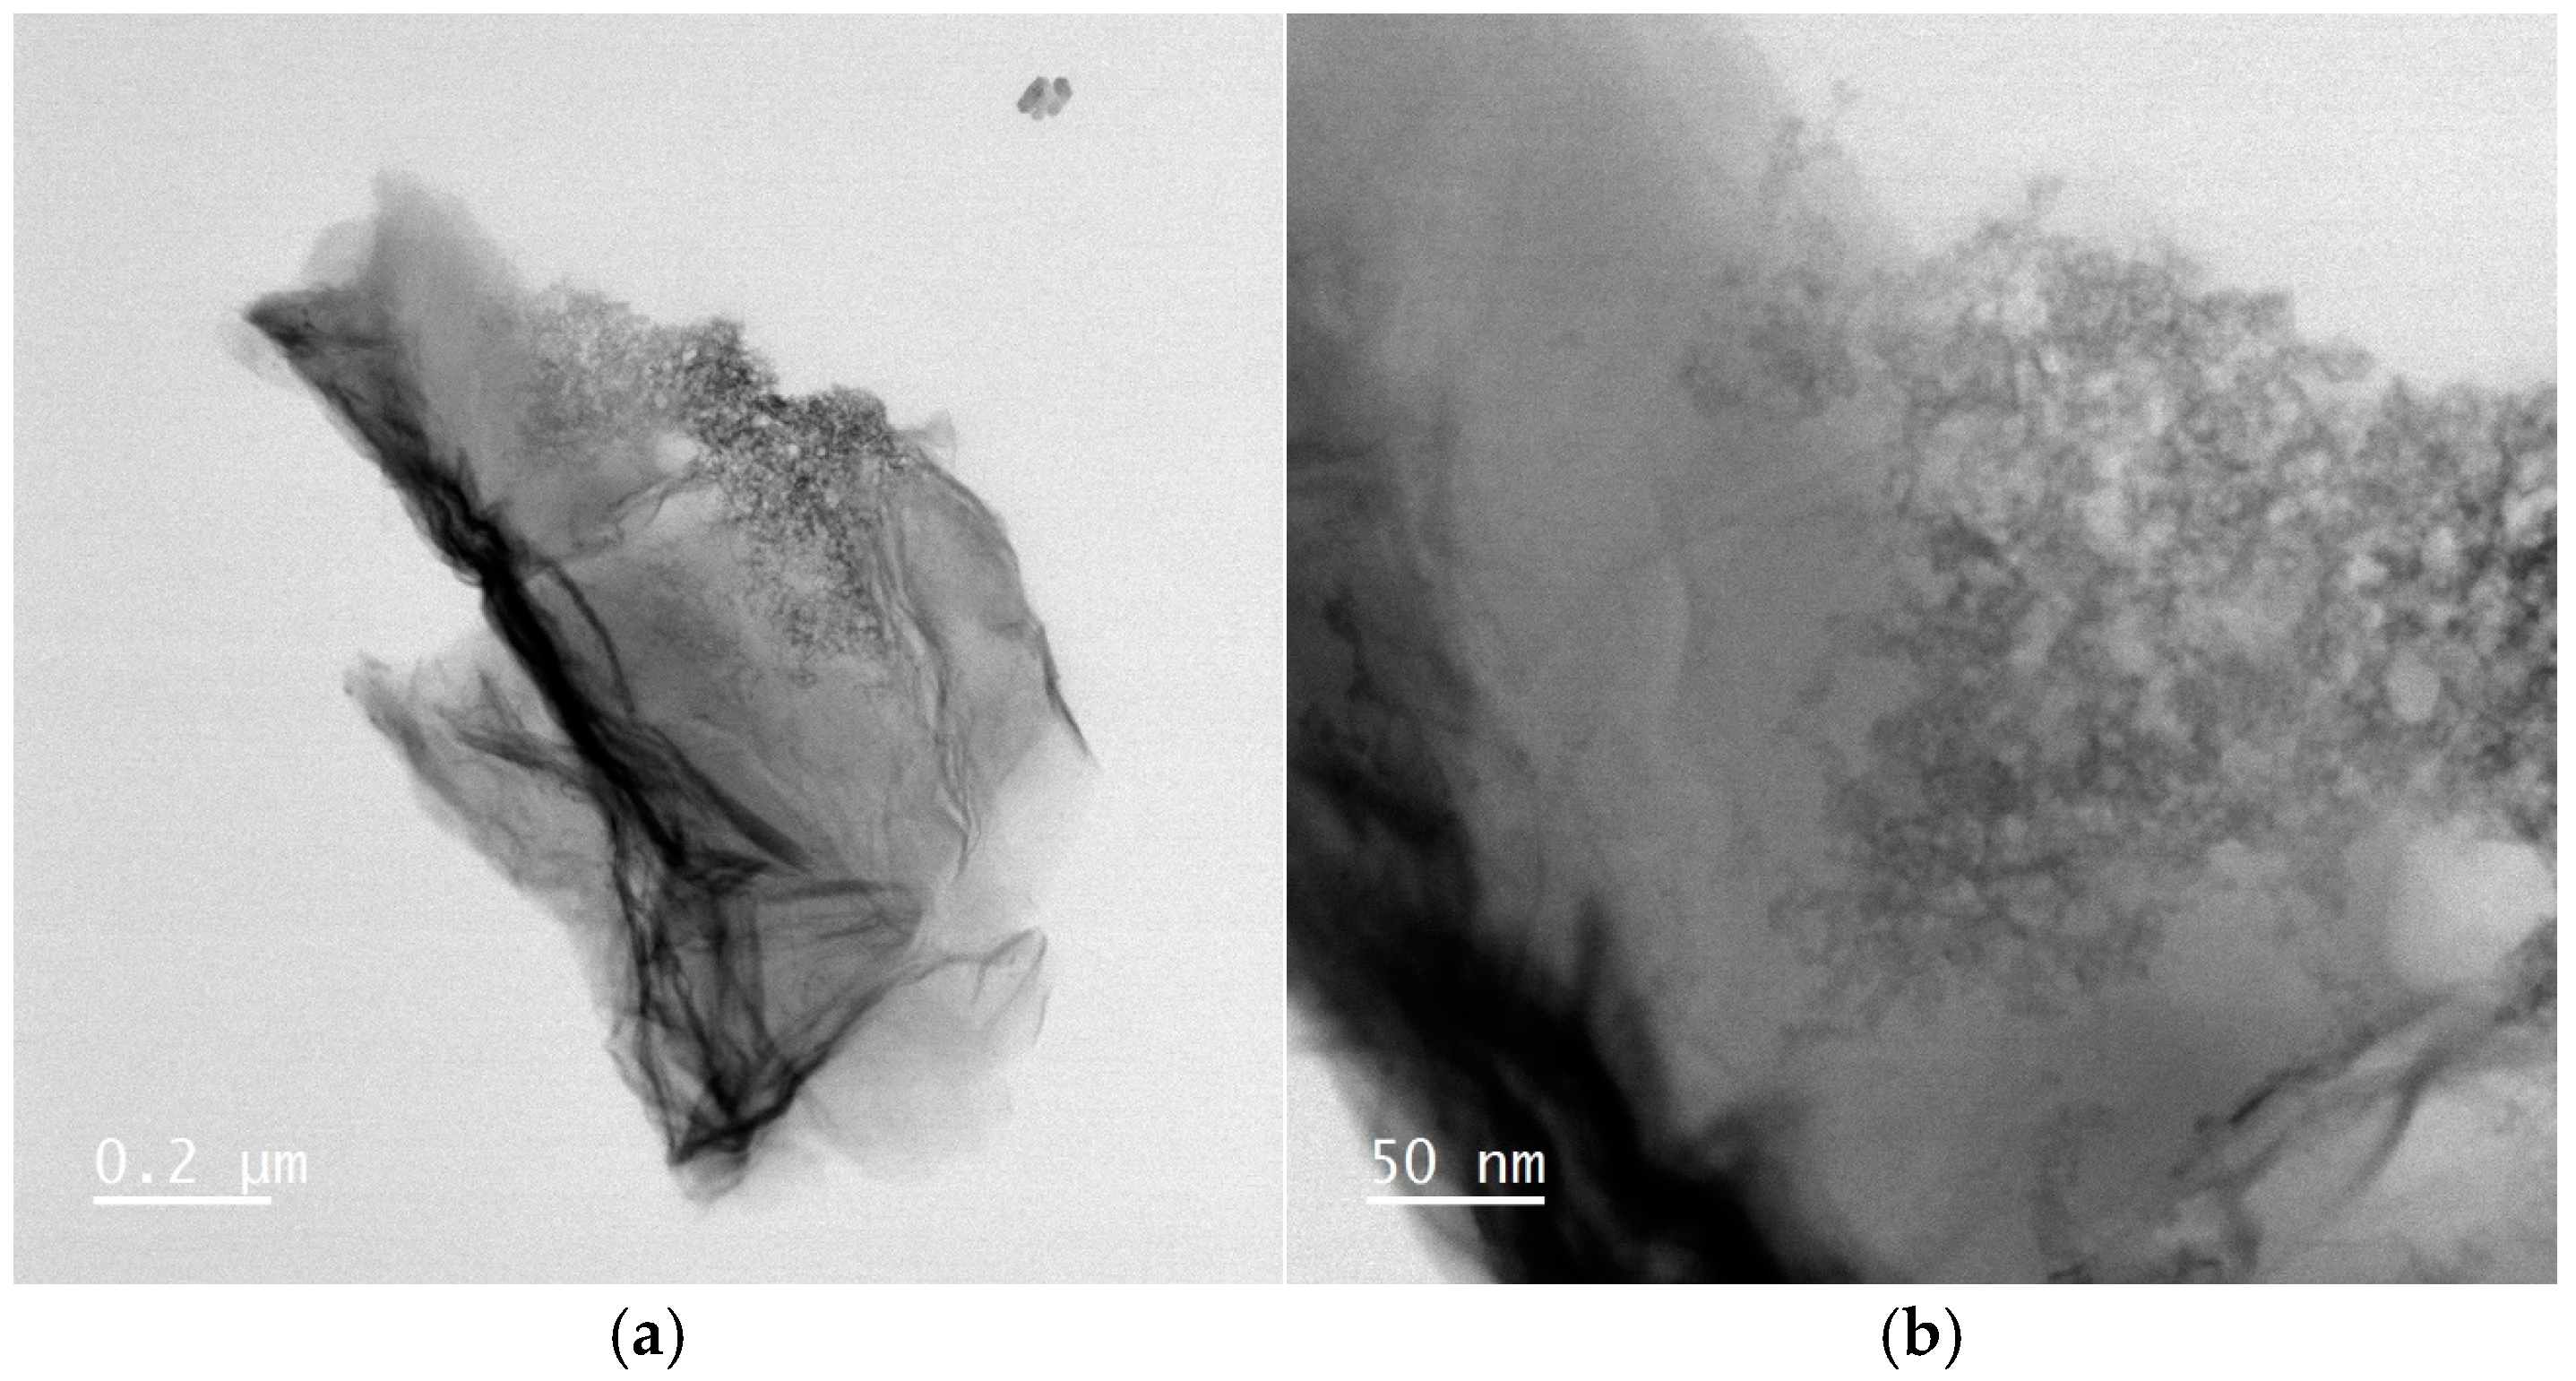
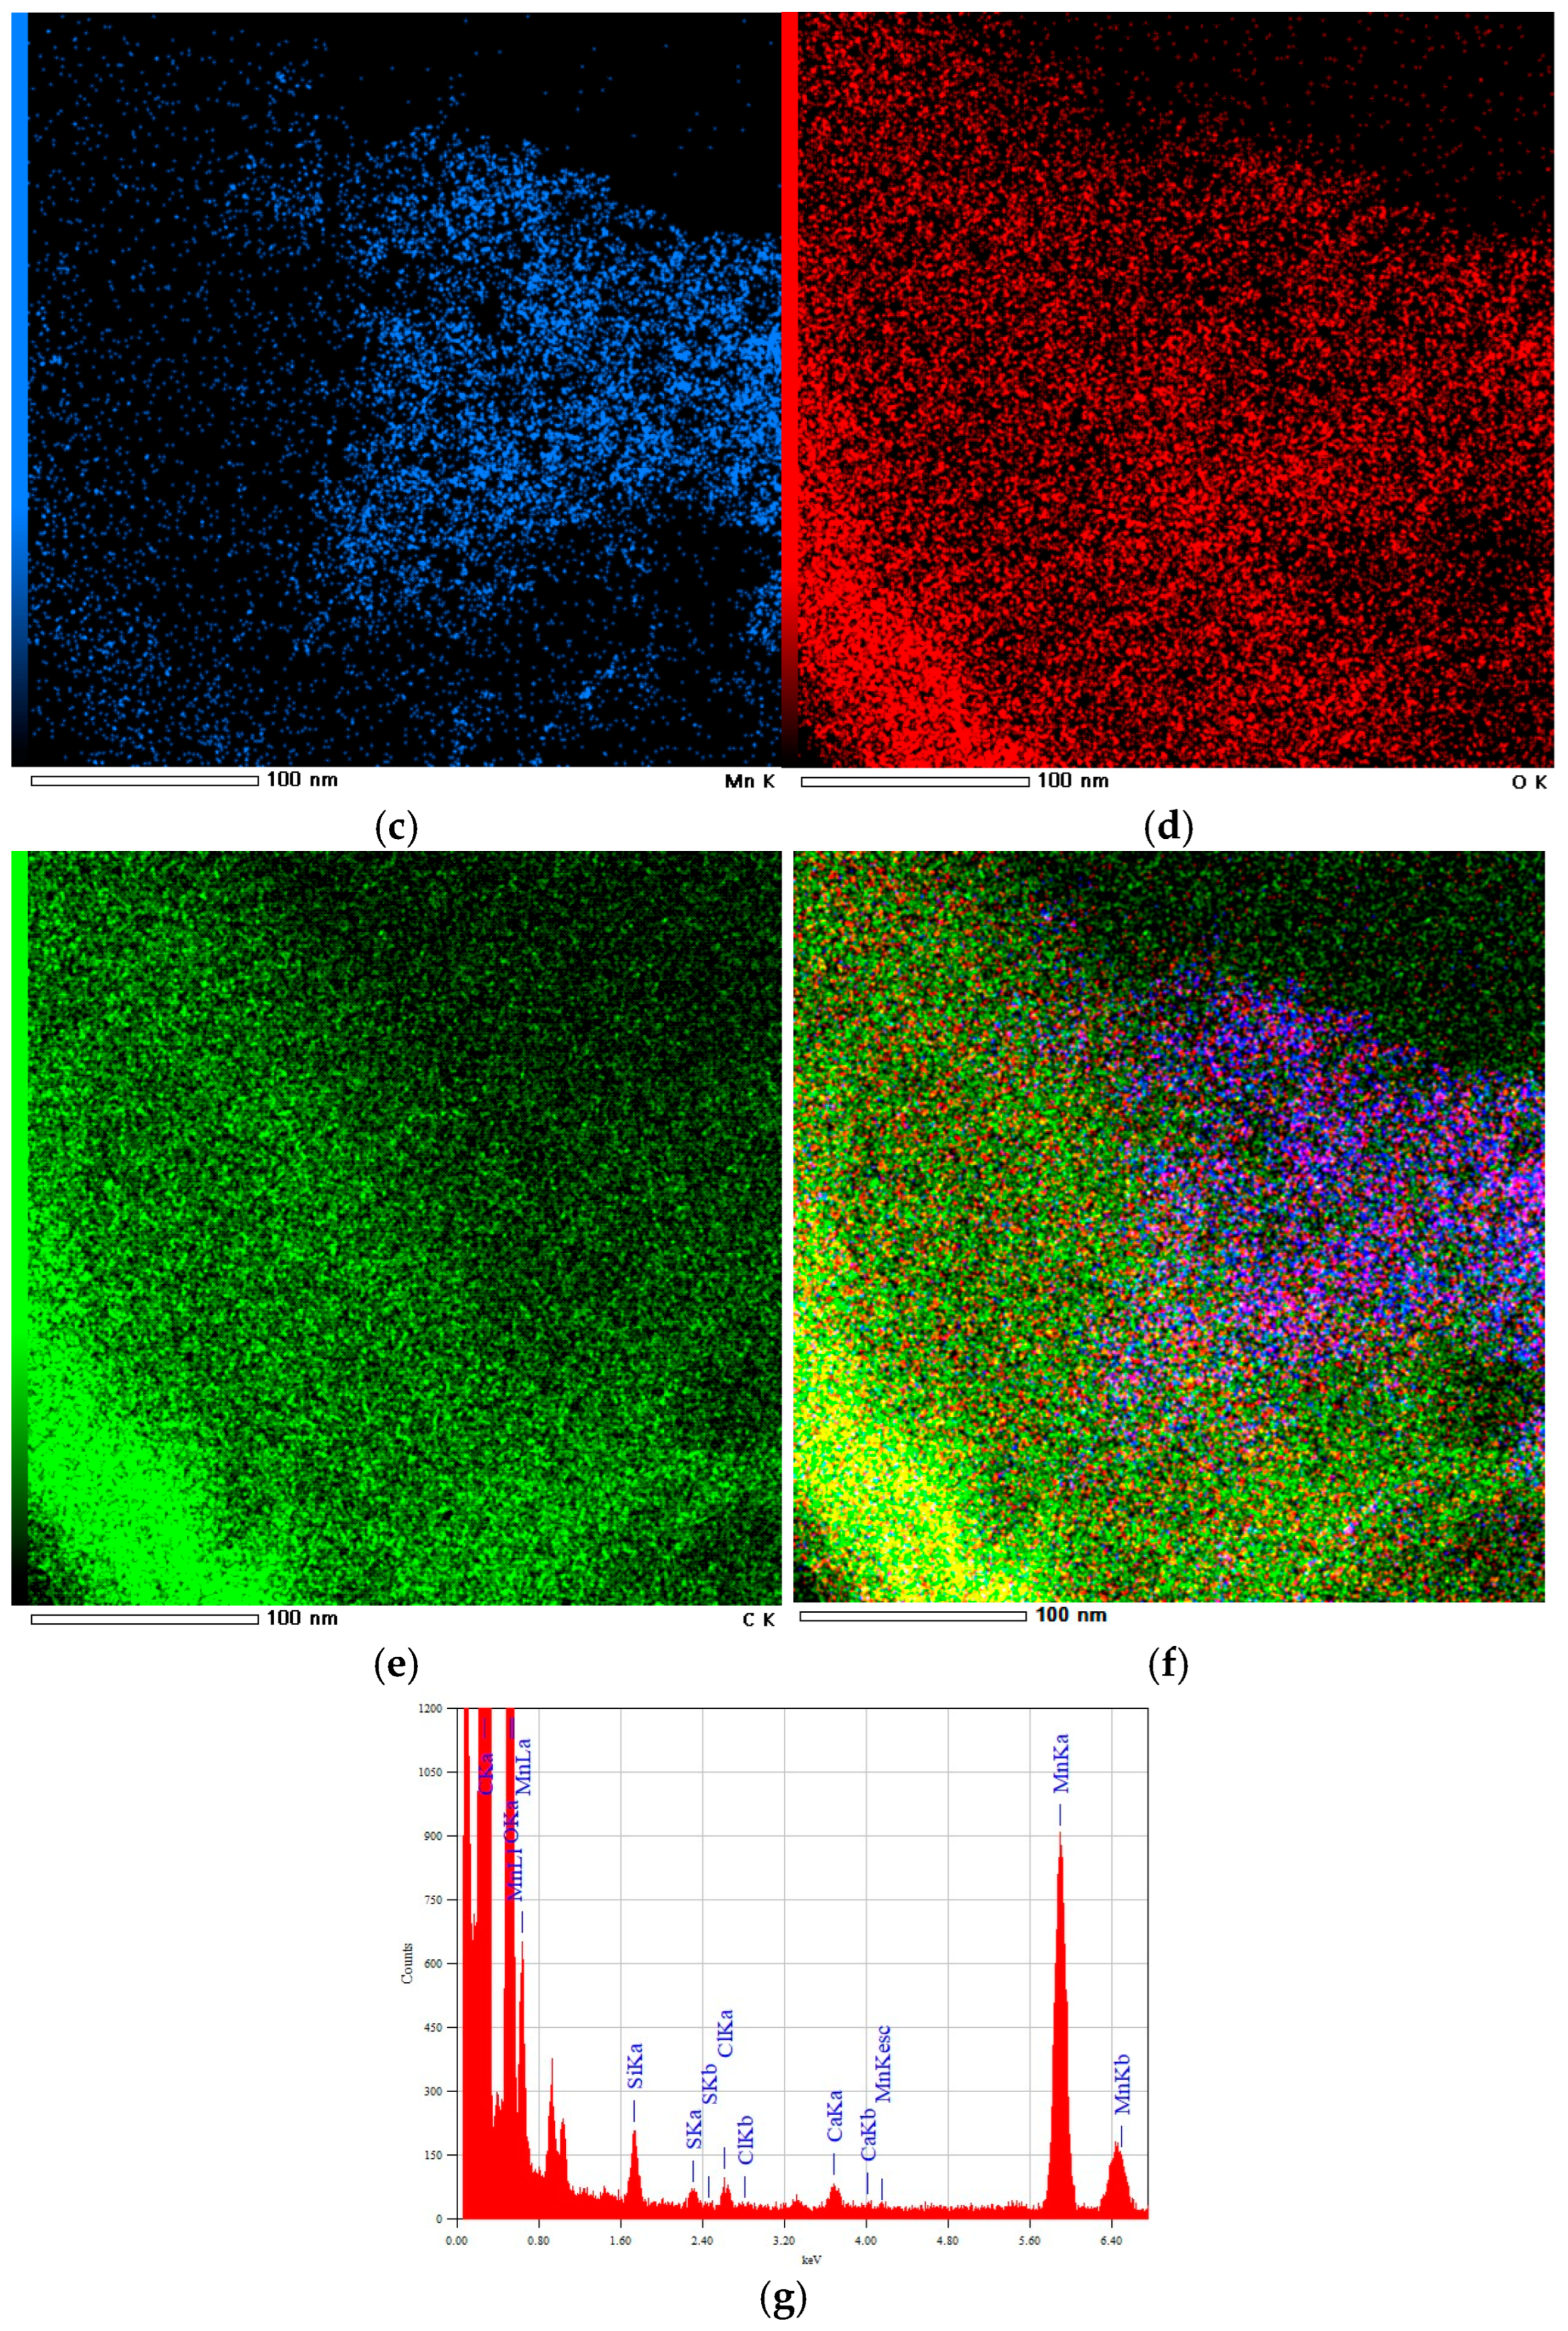
3.1.3. HRTEM
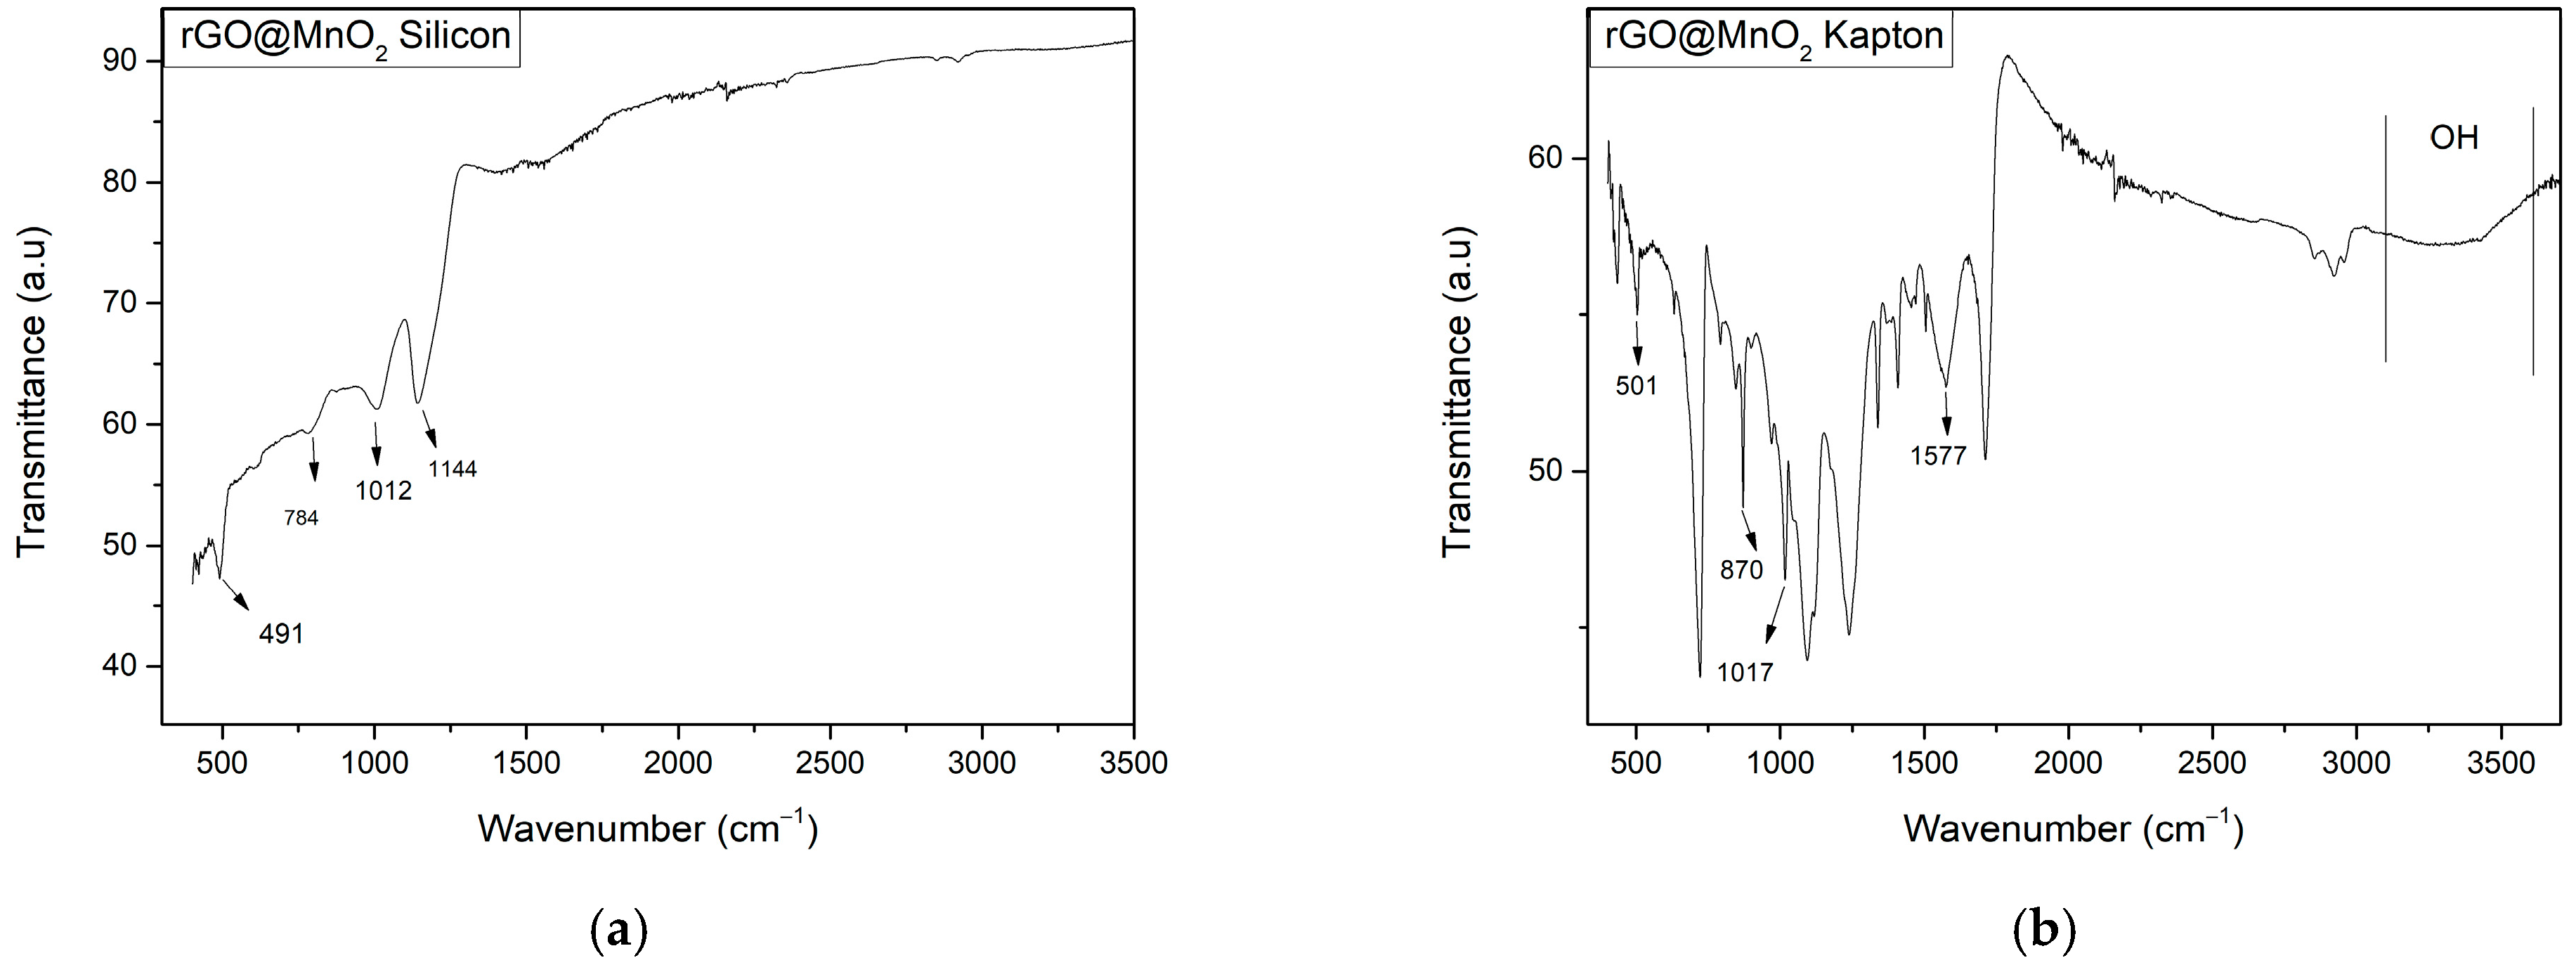
3.1.4. ATR-IR
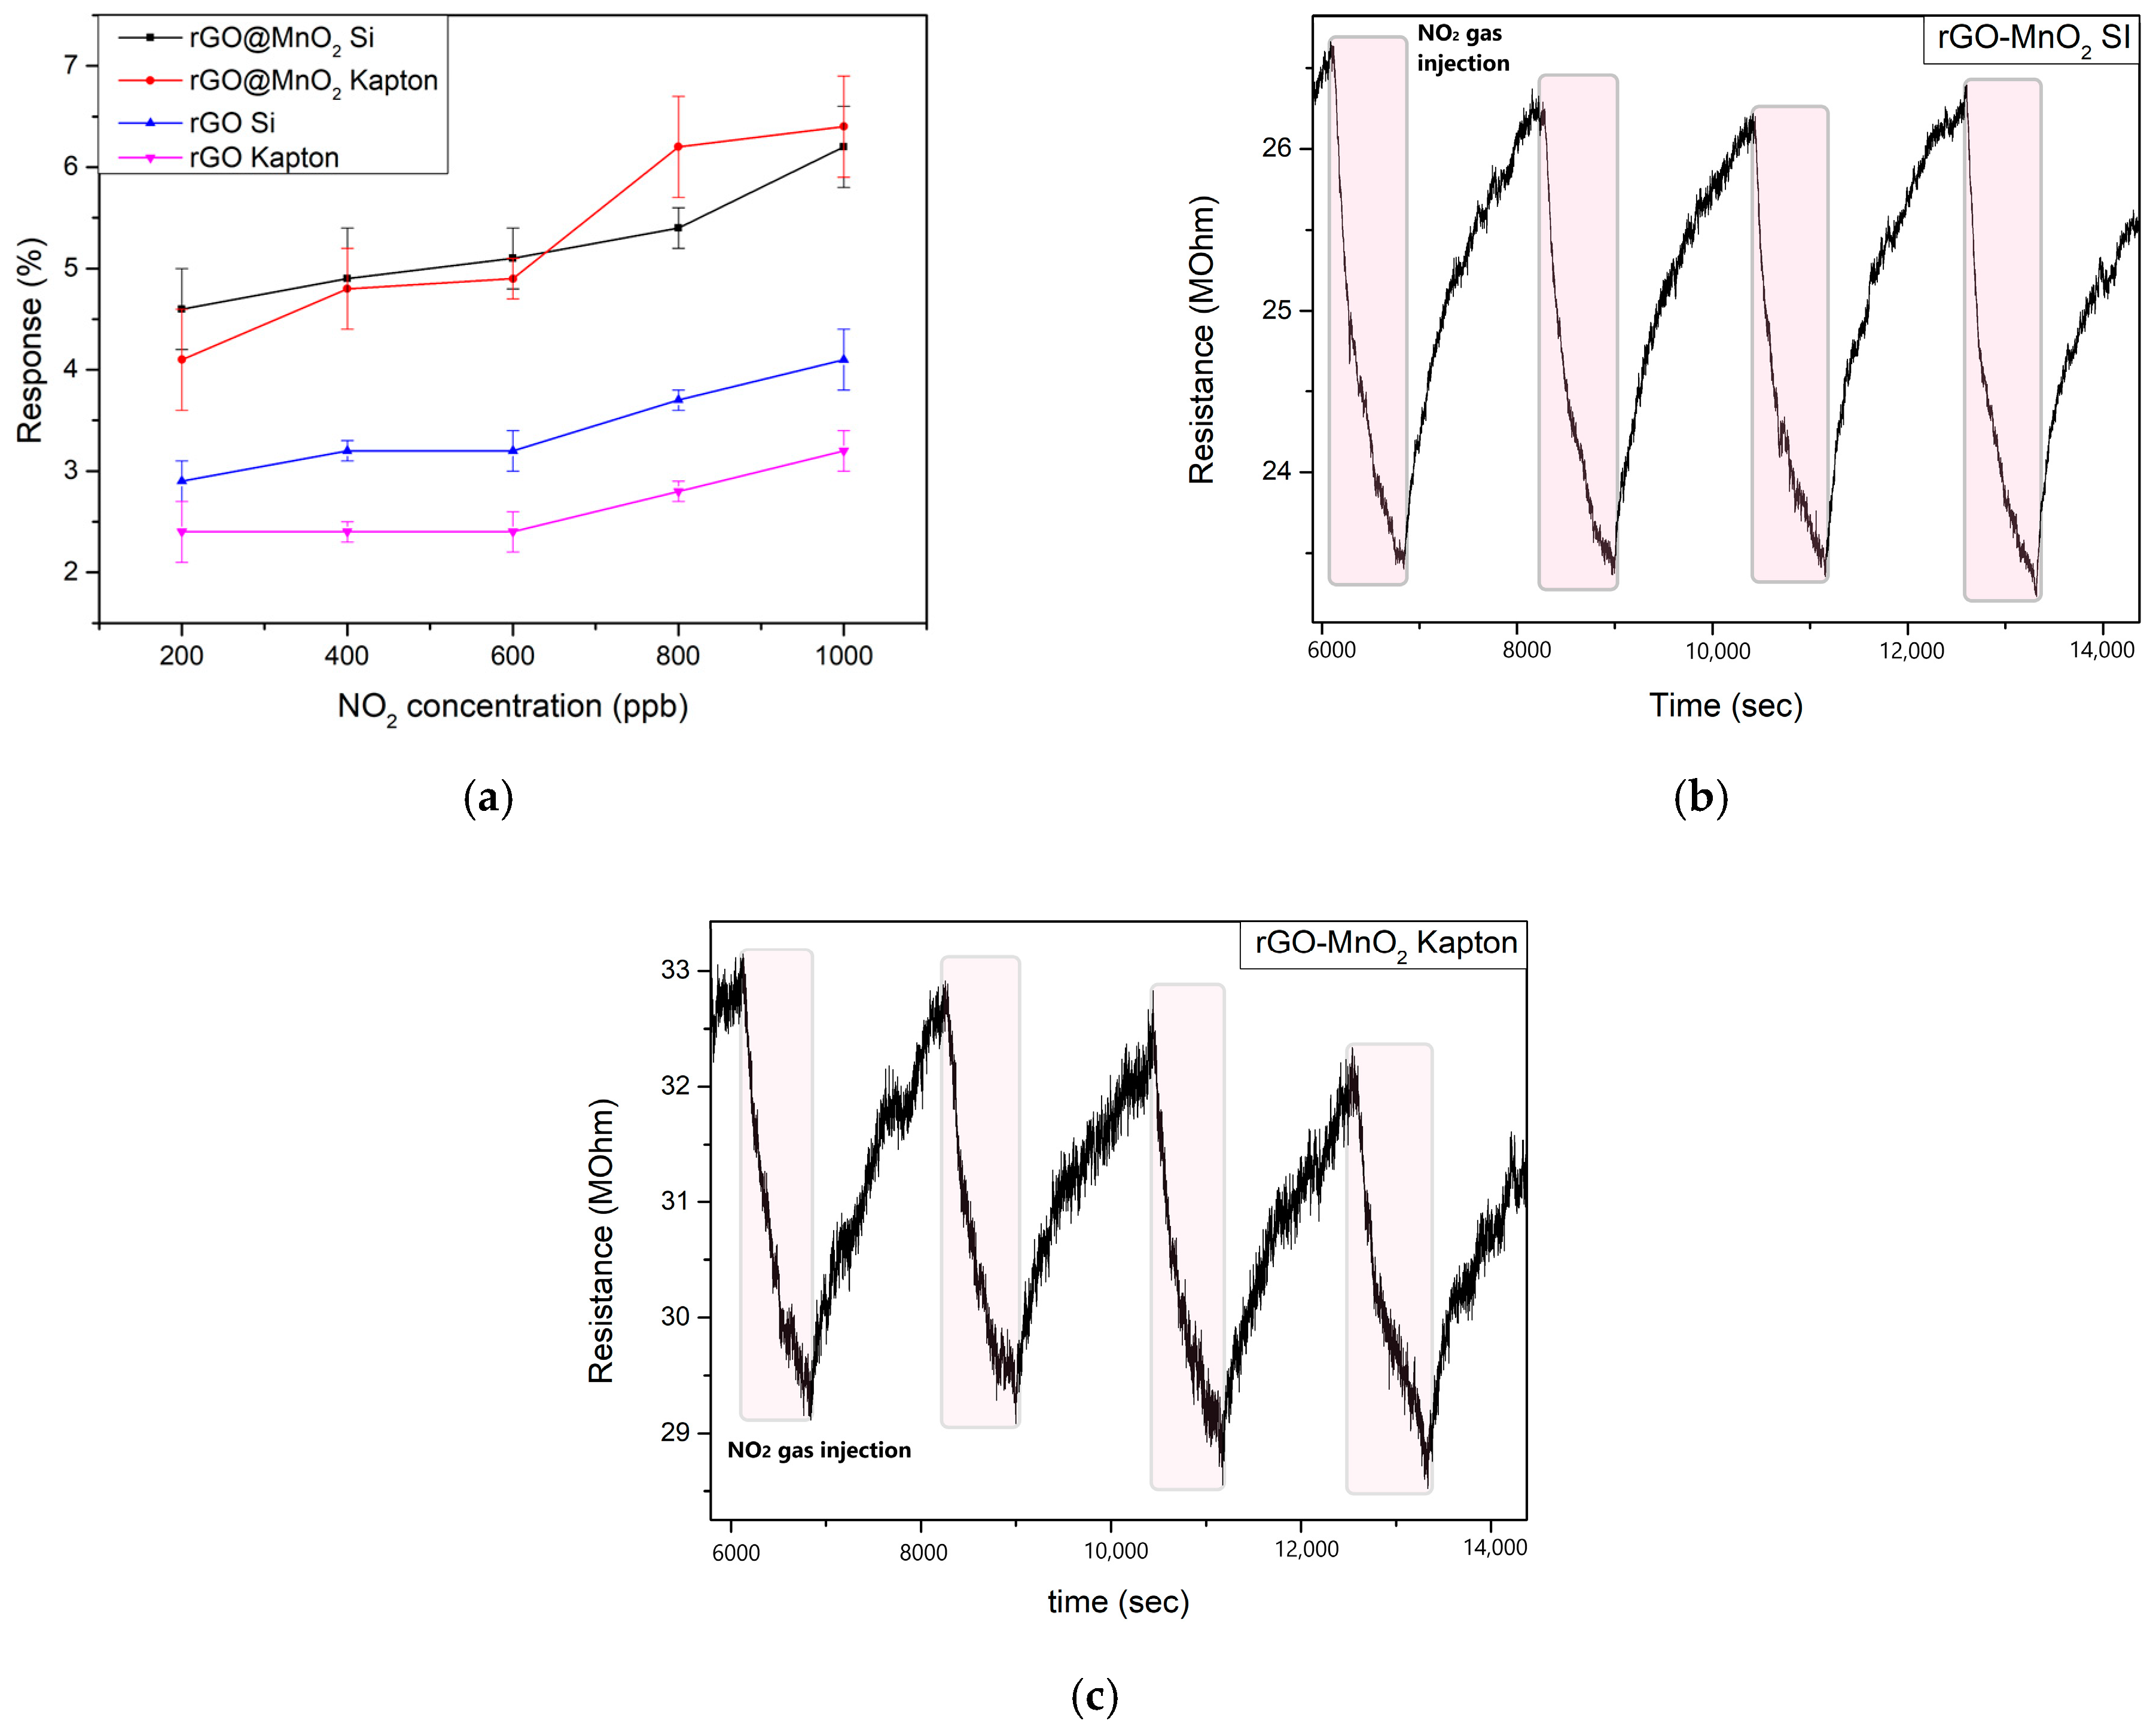
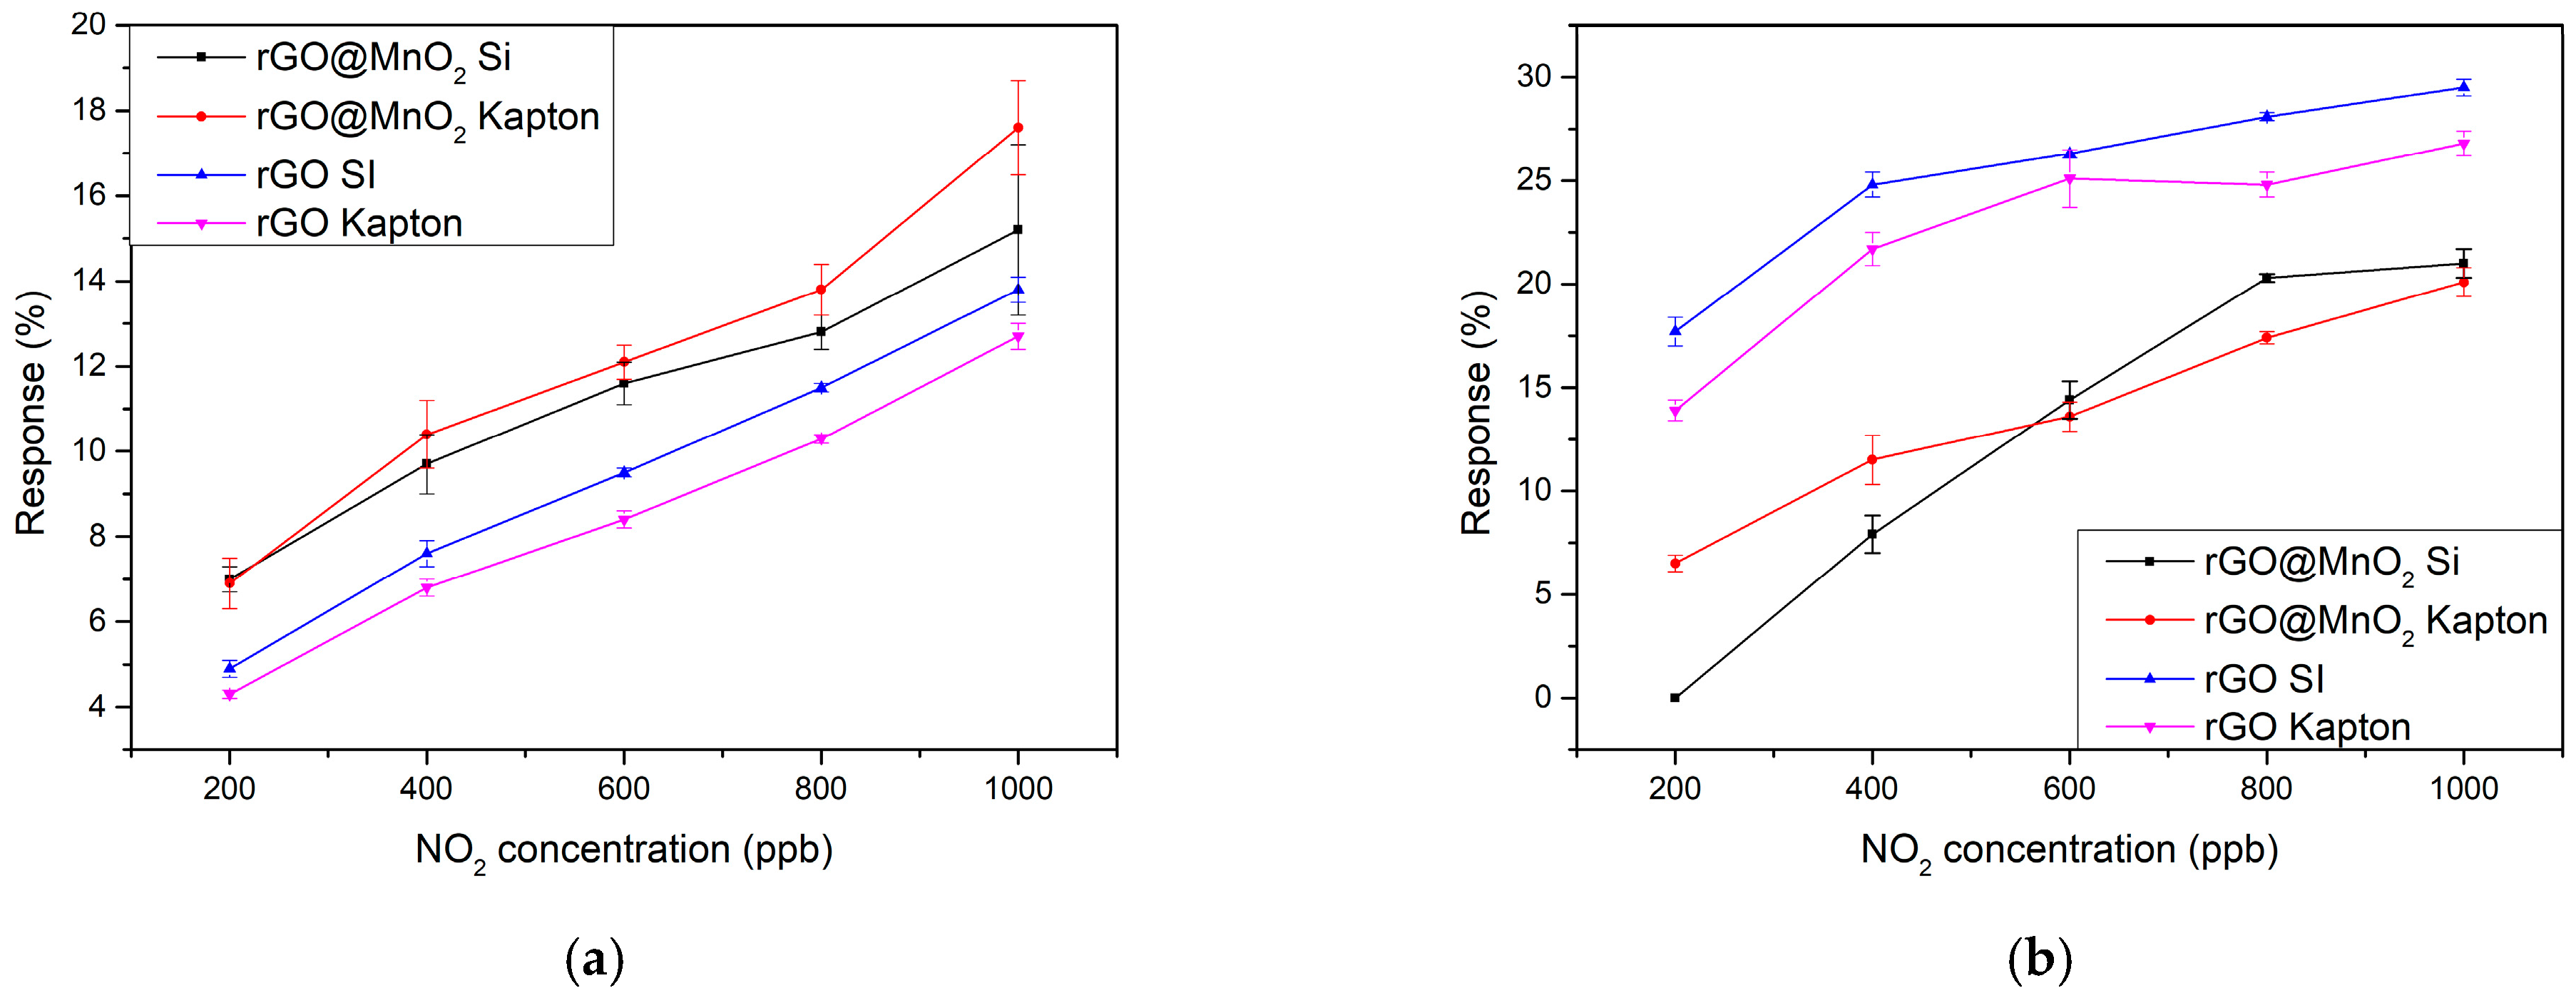
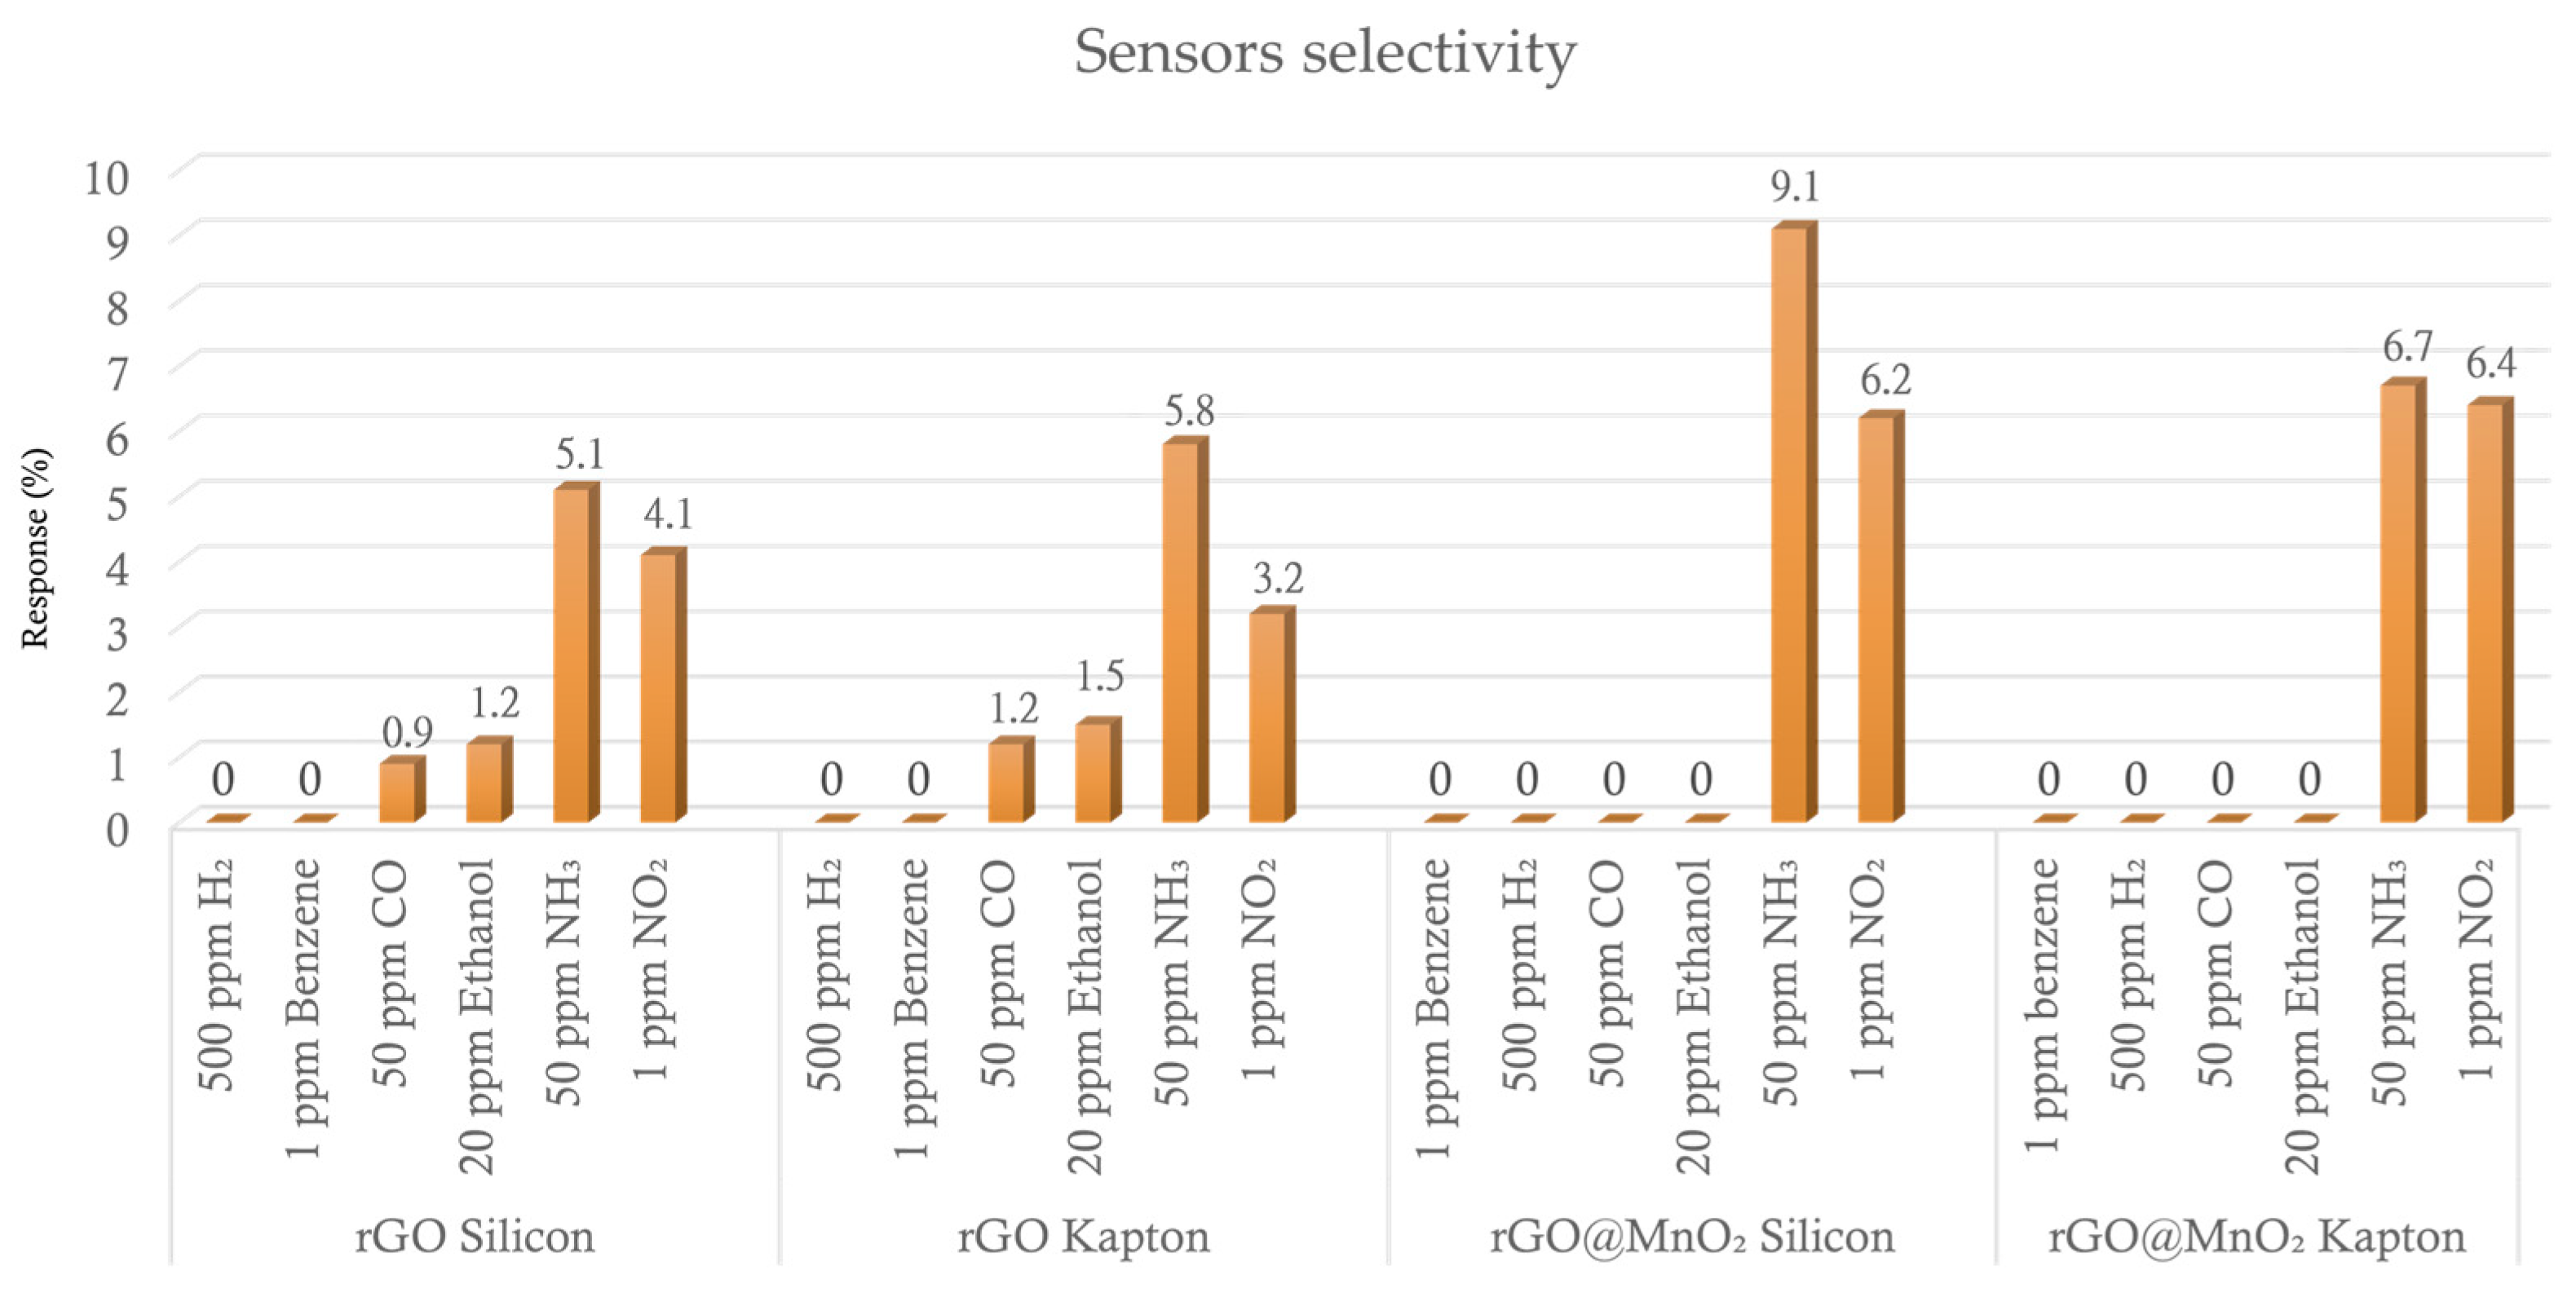
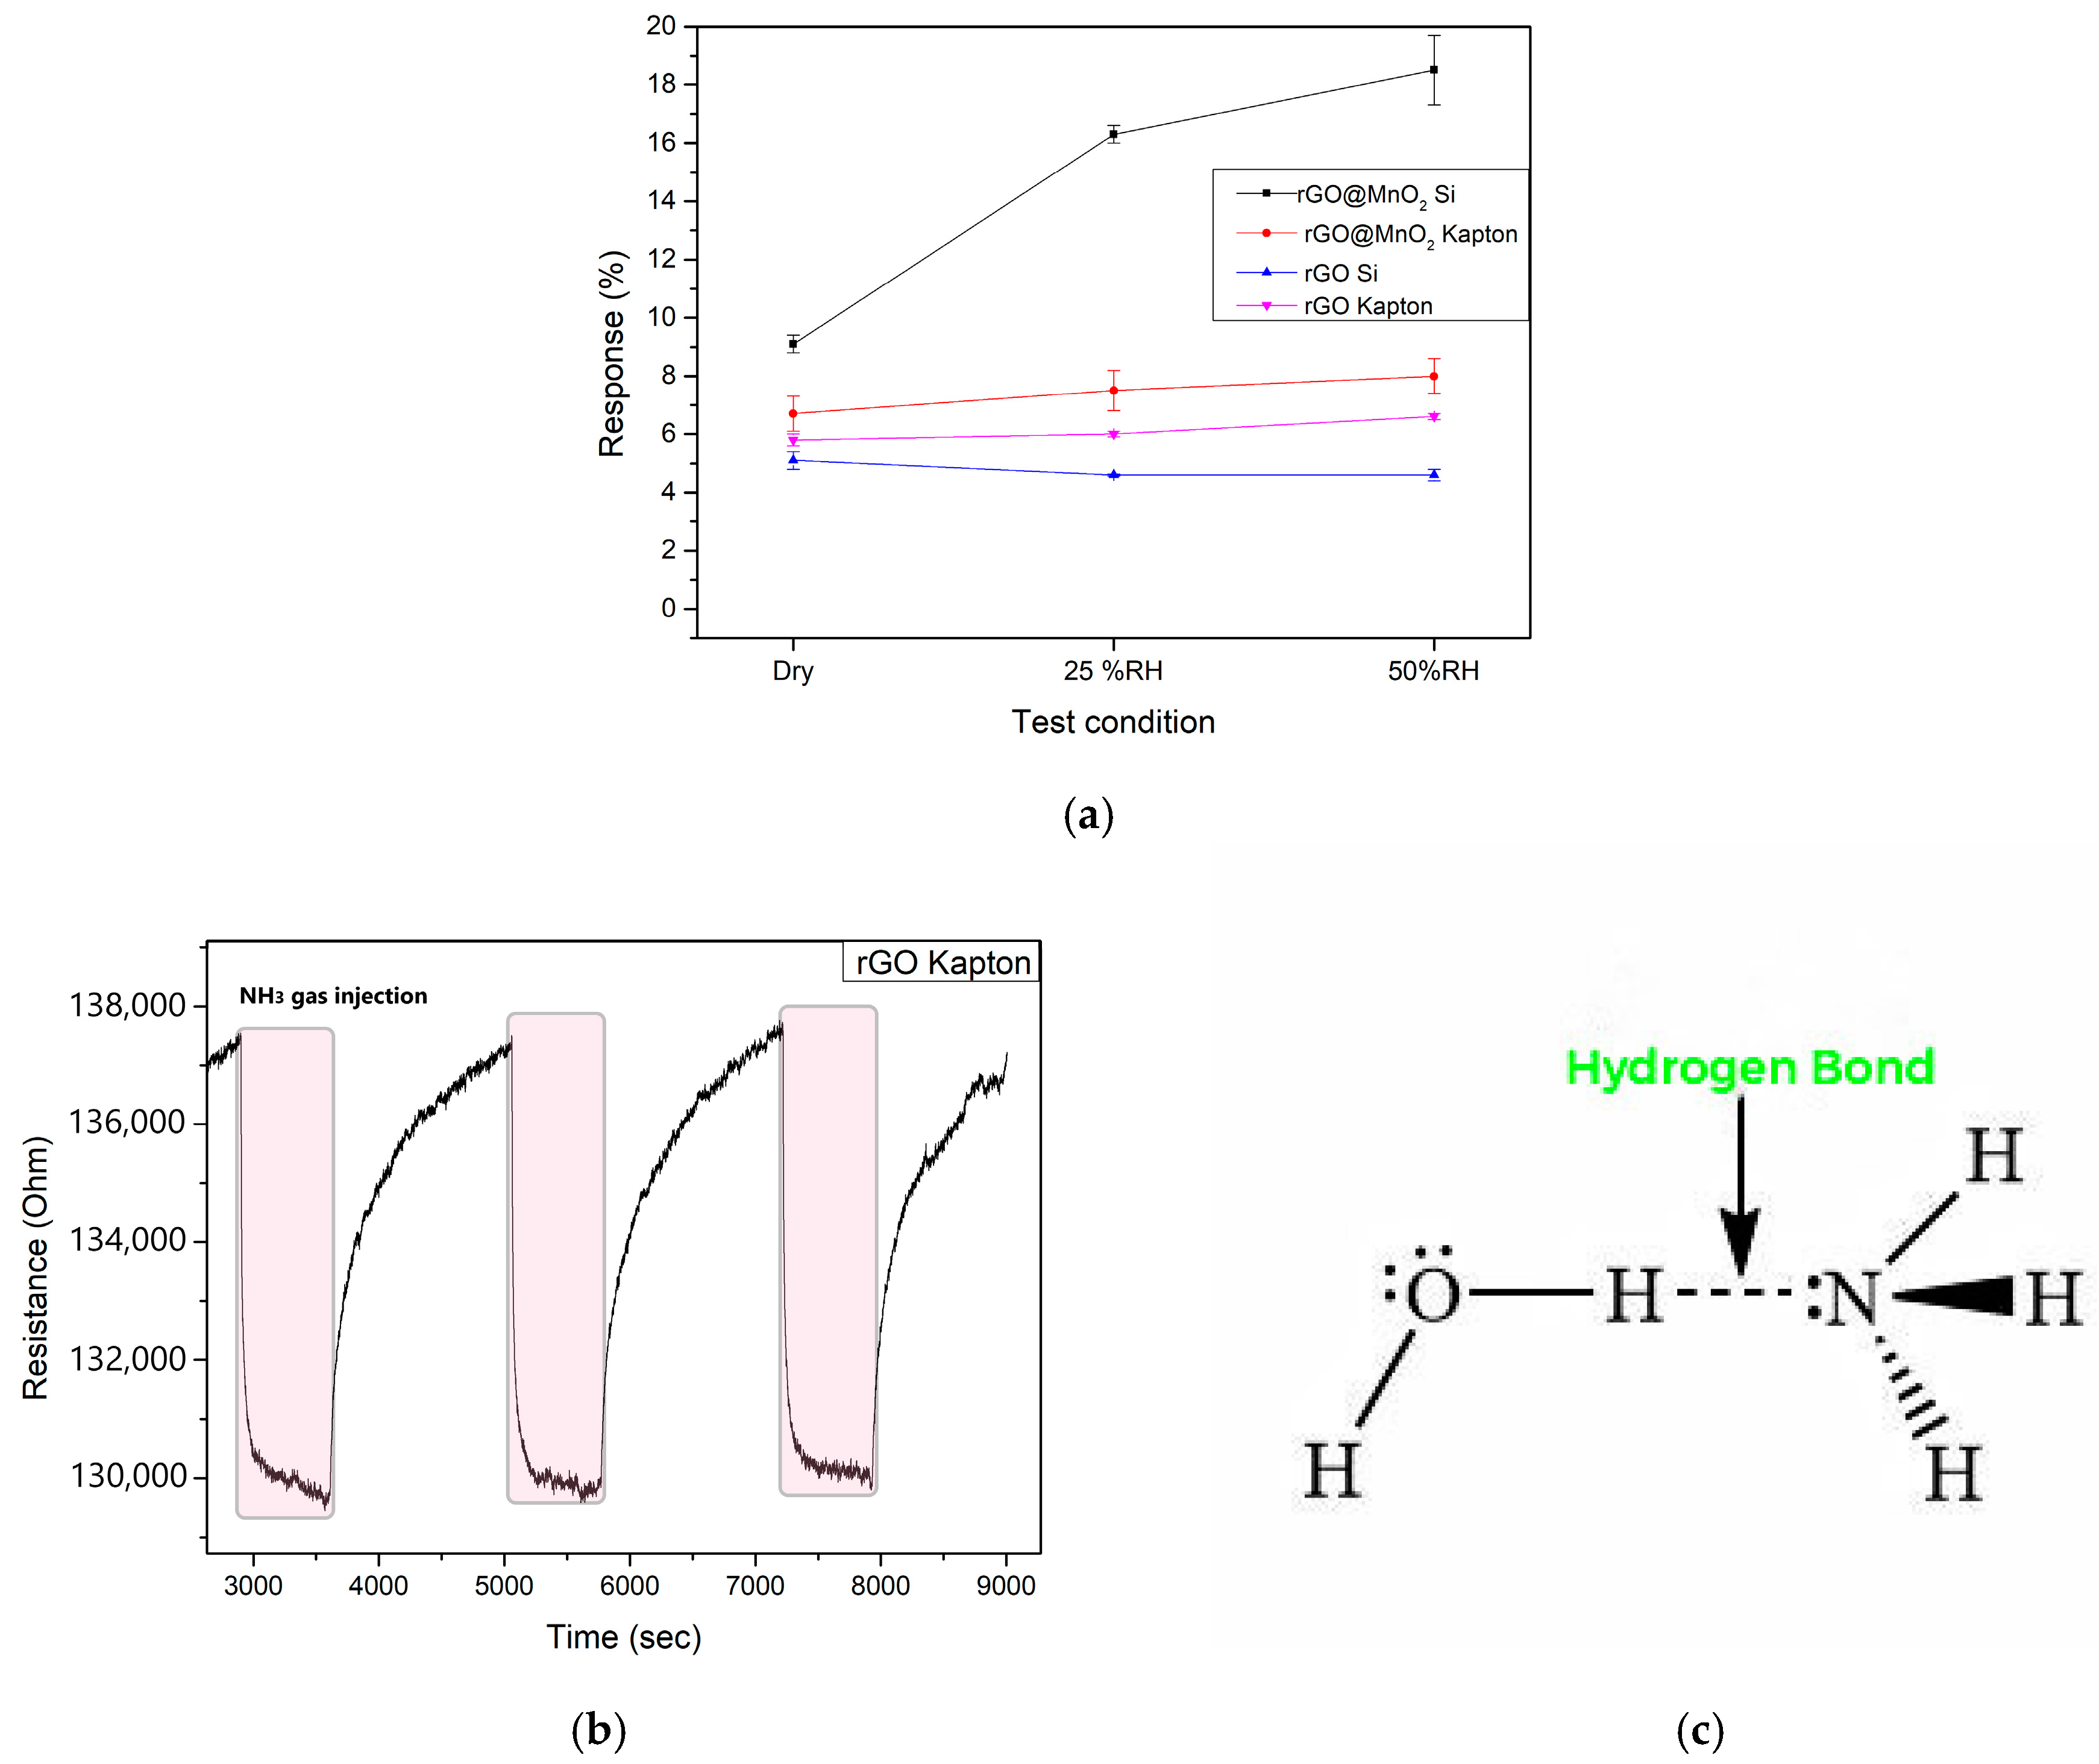
3.2. Gas Sensing Results
3.3. Sensing Mechanism
4. Conclusions
Supplementary Materials
Author Contributions
Funding
Data Availability Statement
Acknowledgments
Conflicts of Interest
References
- Zhang, C.; Luo, Y.; Xu, J.; Debliquy, M. Room temperature conductive type metal oxide semiconductor gas sensors for NO2 detection. Sens. Actuators A Phys. 2019, 289, 118–133. [Google Scholar] [CrossRef]
- Chen, Q.; Wang, S.; Bai, S.; Shen, L.; Peng, J.; Zhang, Y.; Cui, X.; Yu, C.; Zhang, R.; Li, Y.; et al. Sub-ppt NH3 detection by MoS2@sulfur nanosheets. J. Alloys Compd. 2024, 985, 174070. [Google Scholar] [CrossRef]
- Naseem, N.; Tariq, F.; Malik, Y.; Zahid, W.A.; El-Fattah, A.A.; Ayub, K.; Iqbal, J. Sensing ability of carbon nitride (C6N8) for the detection of carbon monoxide (CO) and carbon dioxide (CO2). Sens. Actuators A Phys. 2024, 366, 114947. [Google Scholar] [CrossRef]
- Namduri, H.; Nasrazadani, S. Quantitative analysis of iron oxides using Fourier transform infrared spectrophotometry. Corros. Sci. 2008, 50, 2493–2497. [Google Scholar] [CrossRef]
- Shi, J.; Jiang, Y.; Duan, Z.; Li, J.; Yuan, Z.; Tai, H. Designing an optical gas chamber with stepped structure for non-dispersive infrared methane gas sensor. Sens. Actuators A Phys. 2024, 367, 115052. [Google Scholar] [CrossRef]
- Okoffo, E.D.; Thomas, K.V. Quantitative analysis of nanoplastics in environmental and potable waters by pyrolysis-gas chromatography–mass spectrometry. J. Hazard. Mater. 2024, 464, 133013. [Google Scholar] [CrossRef]
- Gaiardo, A.; Novel, D.; Scattolo, E.; Crivellari, M.; Picciotto, A.; Ficorella, F.; Iacob, E.; Bucciarelli, A.; Petti, L.; Lugli, P.; et al. Optimization of a Low-Power Chemoresistive Gas Sensor: Predictive Thermal Modelling and Mechanical Failure Analysis. Sensors 2021, 21, 783. [Google Scholar] [CrossRef]
- Sun, K.; Zhan, G.; Zhang, L.; Wang, Z.; Lin, S. Highly sensitive NO2 gas sensor based on ZnO nanoarray modulated by oxygen vacancy with Ce doping. Sens. Actuators B Chem. 2023, 379, 133294. [Google Scholar] [CrossRef]
- Krishna, K.G.; Umadevi, G.; Parne, S.; Pothukanuri, N. Zinc Oxide based gas sensors and their derivatives: A critical review. J. Mater. Chem. C 2023, 11, 3906–3925. [Google Scholar] [CrossRef]
- Kong, Y.; Li, Y.; Cui, X.; Su, L.; Ma, D.; Lai, T.; Yao, L.; Xiao, X.; Wang, Y. SnO2 nanostructured materials used as gas sensors for the detection of hazardous and flammable gases: A review. Nano Mat. Sci. 2022, 4, 339–350. [Google Scholar] [CrossRef]
- Liu, P.; Wang, J.; Jin, H.; Ge, M.; Zhang, F.; Wang, C.; Sun, Y.; Dai, N. SnO2 mesoporous nanoparticle-based gas sensor for highly sensitive and low concentration formaldehyde detection. RSC Adv. 2023, 13, 2256–2264. [Google Scholar] [CrossRef] [PubMed]
- Staerz, A.; Somacescu, S.; Epifani, M.; Kida, T.; Weimar, U.; Barsan, N. WO3-Based Gas Sensors: Identifying Inherent Qualities and Understanding the Sensing Mechanism. ACS Sens. 2020, 5, 1624–1633. [Google Scholar] [CrossRef] [PubMed]
- Mazur, M.; Kapuścik, P.; Weichbrodt, W.; Domaradzki, J.; Mazur, P.; Kot, M.; Flege, J.I. WO3 Thin-Film Optical Gas Sensors Based on Gasochromic Effect towards Low Hydrogen Concentrations. Materials 2023, 16, 3831. [Google Scholar] [CrossRef] [PubMed]
- Morrison, S.R. Semiconductor gas sensors. Sens. Actuators 1981, 2, 329–341. [Google Scholar] [CrossRef]
- Schedin, F.; Geim, A.K.; Morozov, S.V.; Hill, E.W.; Blake, P.; Katsnelson, M.I.; Novoselov, K.S. Detection of individual gas molecules adsorbed on graphene. Nat. Mater. 2007, 6, 652–655. [Google Scholar] [CrossRef]
- Novoselov, K.S.; Geim, A.K.; Morozov, S.V.; Jiang, D.; Zhang, Y.; Dubonos, S.V.; Grigorieva, I.V.; Firsov, A.A. Electric field effect in atomically thin carbon films. Science 2004, 306, 666–669. [Google Scholar] [CrossRef]
- Gautam, M.; Jayatissa, A.H. Ammonia gas sensing behaviour of graphene surface decorated with gold nanoparticles. Solid-State Electron. 2012, 78, 159–165. [Google Scholar] [CrossRef]
- Ko, G.; Kim, H.-Y.; Ahn, J.; Park, Y.-M.; Lee, K.-Y.; Kim, J. Graphene-based nitrogen dioxide gas sensors. Curr. Appl. Phys. 2010, 10, 1002–1004. [Google Scholar] [CrossRef]
- Long, H.; Harley-Trochimczyk, A.; Pham, T.; Tang, Z.; Shi, T.; Zettl, A.; Carraro, C.; Worsley, M.; Maboudian, R. High Surface Area MoS2/Graphene Hybrid Aerogel for Ultrasensitive NO2 Detection. Adv. Funct. Mater. 2016, 26, 5158–5165. [Google Scholar] [CrossRef]
- Zhang, H.; Feng, J.; Fei, T.; Liu, S.; Zhang, T. SnO2 nanoparticles-reduced graphene oxide nanocomposites for NO2 sensing at low operating temperature. Sens. Actuators B Chem. 2014, 190, 472–478. [Google Scholar] [CrossRef]
- Xia, Y.; Wang, J.; Xu, J.-L.; Li, X.; Xie, D.; Xiang, L.; Komarneni, S. Confined Formation of Ultrathin ZnO Nanorods/Reduced Graphene Oxide Mesoporous Nanocomposites for High-Performance Room-Temperature NO2 Sensors. ACS Appl. Mater. Interfaces 2016, 8, 35454–35463. [Google Scholar] [CrossRef] [PubMed]
- Wu, Z.; Chen, X.; Zhu, S.; Zhou, Z.; Yao, Y.; Quan, W.; Liu, B. Enhanced sensitivity of ammonia sensor using graphene/polyaniline nanocomposite. Sens. Actuators B Chem. 2013, 178, 485–493. [Google Scholar] [CrossRef]
- Karaduman, I.; Er, E.; Çelikkan, H.; Erk, N.; Acar, S. Room-temperature ammonia gas sensor based on reduced graphene oxide nanocomposites decorated by Ag, Au and Pt nanoparticles. J. Alloys Compd. 2017, 722, 569–578. [Google Scholar] [CrossRef]
- Andre, R.; Shimizu, F.; Miyazaki, C.; Riul Jr, A.; Manzani, D.; Ribeiro, S.; Oliveira, O.; Mattoso, L.; Correa, D. Hybrid layer-by-layer (LbL) films of polyaniline, graphene oxide and zinc oxide to detect ammonia. Sens. Actuators B Chem. 2016, 238, 795–801. [Google Scholar] [CrossRef]
- Wang, J.; Rathi, S.; Singh, B.; Lee, I.; Joh, H.; Kim, G. Alternating Current Dielectrophoresis Optimization of Pt-Decorated Graphene Oxide Nanostructures for Proficient Hydrogen Gas Sensor. ACS App. Mater. Interfaces 2015, 7, 13768–13775. [Google Scholar] [CrossRef]
- Esfandiar, A.; Ghasemi, S.; Irajizad, A.; Akhavan, O.; Gholami, M. The decoration of TiO2/reduced graphene oxide by Pd and Pt nanoparticles for hydrogen gas sensing. Int. J. Hydrogen Energy 2012, 37, 15423–15432. [Google Scholar] [CrossRef]
- Li, D.; Lu, J.; Zhang, X.; Jin, D.; Jin, H. Engineering of ZnO/rGO towards NO2 Gas Detection: Ratio Modulated Sensing Type and Heterojunction Determined Response. Nanomaterials 2023, 13, 917. [Google Scholar] [CrossRef]
- Fellah, M.F. The reduced graphene oxide/WO3: Sensing properties for NO2 gas detection at room temperature. Diam. Relat. Mater. 2021, 119, 108593. [Google Scholar] [CrossRef]
- Thomas, A.; Jeyaprakash, B.G. Selective detection of ammonia by rGO decorated nanostructured ZnO for poultry and farm field applications. Synth. Met. 2022, 290, 117140. [Google Scholar] [CrossRef]
- Naresh, B.; Sreekanth, T.; Krishna, K.G.; Kumar, K.S.; Suma, C.; Yoo, K.; Kim, J. Enhanced ammonia detection using rGO-wrapped Zn3V2O8 nanostructures. Sens. Actuators A Phys. 2024, 379, 115928. [Google Scholar] [CrossRef]
- Meng, F.-L.; Guo, Z.; Huang, X.-J. Graphene-based hybrids for chemiresistive gas sensors. Trends Anal. Chem. 2015, 68, 37–47. [Google Scholar] [CrossRef]
- Majhi, S.M.; Mirzaei, A.; Kim, H.W.; Kim, S.S. Reduced Graphene Oxide (rGO)-Loaded Metal-Oxide Nanofiber Gas Sensors: An Overview. Sensors 2021, 21, 1352. [Google Scholar] [CrossRef] [PubMed]
- Tripathi, D.; Chauhan, P.; Rawat, R. A synergistic approach to enhance sensitivity and selectivity of room temperature operable ammonia gas sensor with humidity assistance using RGO/WO3 nanocomposite. Nanotechnology 2023, 35, 065503. [Google Scholar] [CrossRef] [PubMed]
- Daneshnazar, M.; Jaleh, B.; Eslamipanah, M.; Varma, R.S. Optical and gas sensing properties of TiO2/RGO for methanol, ethanol and acetone vapors. Inorg. Chem. Commun. 2022, 145, 110014. [Google Scholar] [CrossRef]
- Abideen, Z.U.; Kim, H.W.; Kim, S.S. An ultra-sensitive hydrogen gas sensor using reduced graphene oxide-loaded ZnO nanofibers. Chem. Commun. 2015, 51, 15418–15421. [Google Scholar] [CrossRef] [PubMed]
- Lee, J.-H.; Katoch, A.; Choi, S.-W.; Kim, J.-H.; Kim, H.W.; Kim, S.S. Extraordinary Improvement of Gas-Sensing Performances in SnO2 Nanofibers Due to Creation of Local p–n Heterojunctions by Loading Reduced Graphene Oxide Nanosheets. ACS App. Mater. Interfaces 2015, 7, 3101–3109. [Google Scholar] [CrossRef]
- Hingangavkar, G.M.; Kadam, S.A.; Ma, Y.-R.; Bandgar, S.S.; Mulik, R.N.; Patil, V.B. Tailored formation of WO3-rGO nanohybrids for dependable low temperature NO2 sensing. Ceram. Int. 2023, 49, 38866–38876. [Google Scholar] [CrossRef]
- Zhang, Q.Z.; Zhang, D.; Miao, Z.C.; Zhang, X.L.; Chou, S.L. Research Progress in MnO-Carbon Based Supercapacitor Electrode Materials. Small 2018, 14, e1702883. [Google Scholar] [CrossRef]
- Wu, M.; Hou, P.; Dong, L.; Cai, L.; Chen, Z.; Zhao, M.; Li, J. Manganese dioxide nanosheets: From preparation to biomedical applications. Int. J. Nanomed. 2019, 14, 4781–4800. [Google Scholar] [CrossRef]
- Malook, K.; Khan, H.; Shah, M.; Haque, I.-U. Highly selective and sensitive response of Polypyrrole–MnO2 based composites towards ammonia gas. Polym. Compos. 2019, 40, 1676–1683. [Google Scholar] [CrossRef]
- Zhang, H.; Ou, K.; Guan, R.; Cao, Y.; Sun, Y.; Li, X. A Highly Sensitive Room-Temperature NO2 Gas Sensor based on Porous MnO2 /rGO Hybrid Composites. Curr. Nanosci. 2022, 19, 401–409. [Google Scholar] [CrossRef]
- Zöpfl, A.; Lemberger, M.-M.; König, M.; Ruhl, G.; Matysik, F.-M.; Hirsch, T. Reduced graphene oxide and graphene composite materials for improved gas sensing at low temperature. Faraday Discuss 2014, 173, 403–414. [Google Scholar] [CrossRef] [PubMed]
- Ghosal, S.; Bhattacharyya, P. Fabrication, Characterization, and Gas Sensing Performance of Pd, RGO, and MnO2 Nanoflowers-Based Ternary Junction Device. IEEE Trans. Electron Devices 2019, 66, 3982–3987. [Google Scholar] [CrossRef]
- Umar, A.; Akbar, S.; Kumar, R.; Ahmed, F.; Ansari, S.A.; Ibrahim, A.A.; Alhamami, M.A.; Almehbad, N.; Algadi, H.; Almas, T.; et al. Unveiling the potential of PANI@MnO2@rGO ternary nanocomposite in energy storage and gas sensing. Chemosphere 2024, 349, 140657. [Google Scholar] [CrossRef] [PubMed]
- Rezaei, I.; Haghverdi, A.B.; Soldoozy, A.; Aghaee, T.; Biabanifard, S. Wearable Kapton graphene biosensor for detection of toxic gases. J. Hazard. Mater. Adv. 2024, 15, 100452. [Google Scholar] [CrossRef]
- Yin, F.; Wu, S.; Wang, Y.; Wu, L.; Yuan, P.; Wang, X. Self-assembly of mildly reduced graphene oxide monolayer for enhanced Raman scattering. J. Solid State Chem. 2016, 237, 57–63. [Google Scholar] [CrossRef]
- Hurtado, R.B.; Cortez-Valadez, M.; Aragon-Guajardo, J.R.; Cruz-Rivera, J.J.; Martínez-Suárez, F.; Flores-Acosta, M. One-step synthesis of reduced graphene oxide/gold nanoparticles under ambient conditions. Arab. J. Chem. 2020, 13, 1633–1640. [Google Scholar] [CrossRef]
- Yavuz, S.; Bandaru, P.R. Ag nanowire coated reduced graphene oxide/n-silicon Schottky junction based solar cell. In Proceedings of the IEEE Conference on Technologies for Sustainability (SusTech), Phoenix, AZ, USA, 9–11 October 2016; pp. 265–269. [Google Scholar] [CrossRef]
- Hidayah, N.M.S.; Nur, H.; Liu, W.W.; Lai, C.W.; Noriman, N.Z.; Khe, C.-S.; Hashim, U.; Lee, H.C. Comparison on graphite, graphene oxide and reduced graphene oxide: Synthesis and characterization. AIP Conf. Proc. 2017, 1892, 150002. [Google Scholar]
- Ma, B.; Rodriguez, R.D.; Ruban, A.; Pavlov, S.; Sheremet, E. The correlation between electrical conductivity and second-order Raman modes of laser-reduced graphene oxide. Phys. Chem. Chem. Phys. 2019, 21, 10125–10134. [Google Scholar] [CrossRef]
- Sharma, M.; Rani, S.; Pathak, D.K.; Bhatia, R.; Kumar, R.; Sameera, I. Temperature dependent Raman modes of reduced graphene oxide: Effect of anharmonicity, crystallite size and defects. Carbon 2021, 184, 437–444. [Google Scholar] [CrossRef]
- Rajguru, G.M.; Mishra, R.K.; Kharat, P.B.; Khirade, P.P. Structural, microstructural and optical characteristics of rGO-ZnO nanocomposites via hydrothermal approach. Opt. Mater. 2024, 154, 115720. [Google Scholar] [CrossRef]
- Papadopoulou, E.; Morselli, D.; Prato, M.; Barcellona, A.; Athanassiou, A.; Bayer, I.S. An Efficient Pure Polyimide Ammonia, Sensor. J. Mater. Chem. C 2016, 4, 7790–7797. [Google Scholar] [CrossRef]
- Susee, S.K.; Sandhya, S.; Kumar, M.S.; Chidhambararajan, B. Reduced graphene oxide–MnO2 nanocomposites by hydrothermal method for histamine sensor and photocatalytic activity. J. Mater. Sci. Mater. Electron. 2024, 35, 1–12. [Google Scholar] [CrossRef]
- Muhammad, Y.; Shah, M.; Safi, M.A.; Khattak, S.G.; Aziz, A.; Hassan, H. highly selective and sensitive humidity sensor using reduced graphene oxide-based iron oxide nanocomposites. Mater. Sci. Eng. 2024, 303, 117324. [Google Scholar] [CrossRef]
- Li, Z.; Gardner, D.W.W.; Xia, Y.; Zhao, S.; Pan, A.; Goel, N.; Bart, S.; Liu, C.; Yi, J.; Carraro, C.; et al. Ordered porous RGO/SnO2 thin films for ultrasensitive humidity detection. J. Mater. Chem. C Mater. 2023, 11, 9586–9592. [Google Scholar] [CrossRef]
- Fahmy, A.; Saeed, A.M.; Dawood, U.; Abdelbary, H.; Altmann, K.; Schönhals, A. Nano-MnO2/xanthan gum composite films for NO2 gas sensing. Mater. Chem. Phys. 2023, 296, 127277. [Google Scholar] [CrossRef]
- Pedowitz, M.D.; Kim, S.; Lewis, D.I.; Uppalapati, B.; Khan, D.; Bayram, F.; Daniels, K.M. Fast Selective Sensing of Nitrogen-Based Gases Utilizing δ -MnO2-Epitaxial Graphene-Silicon Carbide Heterostructures for Room Temperature Gas Sensing. J. Microelectromech. Syst. 2020, 29, 846–852. [Google Scholar] [CrossRef]
- Lu, J.; Li, D.; Chen, X. ZnO/reduced graphene oxide nanocomposite with synergic enhanced gas sensing performance for the effective detection of NO2 at room temperature. J. Nanopart. 2022, 24, 265. [Google Scholar] [CrossRef]
- Kacem, K.; Ameur, S.; Casanova-Chafer, J. Bio-reduction of graphene oxide using pomegranate peels for NO2 sensing and photocatalysis applications. J. Mater. Sci. Mater. Electron. 2022, 33, 16099–16112. [Google Scholar] [CrossRef]
- Hasanov, B.E.; Casanova-Chafer, J.; Deokar, G.; Gouveia, J.D.; Nematulloev, S.; Gomes, J.R.; Llobet, E.; Costa, P.M. Amplified sensing of nitrogen dioxide with a phosphate-doped reduced graphene oxide powder. Carbon 2024, 226, 119207. [Google Scholar] [CrossRef]
- Liang, J.; Wu, W.; Lou, Q. Room temperature NO2 sensing performance enhancement of VO2(B) composited rGO structure. J. Mater. Sci. Mater. Electron. 2022, 33, 15473–15482. [Google Scholar] [CrossRef]
- Sovizi, M.R.; Mirzakhani, S. highly sensitive detection of ammonia gas by 3D flower-like ɤ-MnO2 nanostructure chemiresistor. J. Taiwan Inst. Chem. Eng. 2020, 111, 293–301. [Google Scholar] [CrossRef]
- Ganesan, M.; Ganapathi, B.; Parasuraman, B.; Thangavelu, P. Sensitivity enhancement of ammonia gas sensor based on NiFe2O4/rGO nanocomposite. Chem. Phys. Impact 2024, 8, 100616. [Google Scholar] [CrossRef]
- Jeevitha, G.; Abhinayaa, R.; Mangalaraj, D.; Ponpandian, N.; Meena, P.; Mounasamy, V.; Madanagurusamy, S. Porous reduced graphene oxide (rGO)/WO3 nanocomposites for the enhanced detection of NH3 at room temperature. Nanoscale Adv. 2019, 1, 1799–1811. [Google Scholar] [CrossRef]
- Zhang, H.; Li, Y.; Yuan, Z.; Lei, Y.; Li, X.; Meng, F. Enhanced Ammonia Sensing Performance Based on FeCo2O4/WO3/rGO Ternary Nanocomposites. IEEE Sens. J. 2023, 23, 25698–25707. [Google Scholar] [CrossRef]
- Ganesan, M.; Ganapathi, B.; Govindasamy, P.; Parasuraman, B.; Shanmugam, P.; Boddula, R.; Pothu, R.; Thangavelu, P. CoFe2O4/rGO nanocomposite: Synthesis and enhanced ammonia gas sensing properties at room temperature. Results Chem. Chem. 2024, 7, 101342. [Google Scholar] [CrossRef]
- Alouani, M.A.; Casanova-Cháfer, J.; Güell, F.; Peña-Martín, E.; Ruiz-Martínez-Alcocer, S.; de Bernardi-Martín, S.; García-Gómez, A.; Vilanova, X.; Llobet, E. ZnO-Loaded Graphene for NO2 Gas Sensing. Sensors 2023, 23, 6055. [Google Scholar] [CrossRef]
- Umar, A.; Ibrahim, A.A.; Kumar, R.; Albargi, H.; Zeng, W.; Alhmami, M.A.M.; Alsaiari, M.A.; Baskoutas, S. Gas sensor device for high-performance ethanol sensing using α-MnO2 nanoparticles. Mater. Lett. 2021, 286, 129232. [Google Scholar] [CrossRef]
- Chatterjee, S.G.; Chatterjee, S.; Ray, A.K.; Chakraborty, A.K. Graphene–metal oxide nanohybrids for toxic gas sensor: A review. Sens. Actuators B Chem. 2015, 221, 1170–1181. [Google Scholar] [CrossRef]
- Zhang, D.; Liu, A.; Chang, H.; Xia, B. Room-temperature high-performance acetone gas sensor based on hydrothermal synthesized SnO2-reduced graphene oxide hybrid composite. RSC Adv. 2015, 5, 3016–3022. [Google Scholar] [CrossRef]
- Xiao, X.; Jin, W.; Tang, C.; Qi, X.; Li, R.; Zhang, Y.; Zhang, W.; Yu, X.; Zhu, X.; Ma, Y.; et al. Thermal reduced graphene oxide-based gas sensor for rapid detection of ammonia at room temperature. J. Mater. Sci. 2023, 58, 11016–11028. [Google Scholar] [CrossRef]
- Han, D.; Wang, Y.; Wang, Y.; Duan, Q.; Li, D.; Ge, Y.; He, X.; Zhao, L.; Wang, W.; Sang, S. Machine-learning-assisted n-GaN-Au/PANI gas sensor array for intelligent and ultra-accurate ammonia recognition. Chem. Eng. J. 2024, 495, 153705. [Google Scholar] [CrossRef]
- Lv, C.; Hu, C.; Luo, J.; Liu, S.; Qiao, Y.; Zhang, Z.; Song, J.; Shi, Y.; Cai, J.; Watanabe, A. Recent Advances in Graphene-Based Humidity Sensors. Nanomaterials 2019, 9, 422. [Google Scholar] [CrossRef]
- Casanova-Cháfer, J.; Navarrete, E.; Noirfalise, X.; Umek, P.; Bittencourt, C.; Llobet, E. Gas Sensing with Iridium Oxide Nanoparticle Decorated Carbon Nanotubes. Sensors 2019, 19, 113. [Google Scholar] [CrossRef]


| Material | Target Gas | Gas Concentration (ppm) | Operating Condition | Response (%) | Ref. |
|---|---|---|---|---|---|
| Graphene/MoS2 hybrid aerogel | NO2 | 0.5 | 200 °C | 9 | [19] |
| rGO/SnO2 nanoparticles | NO2 | 5 | 50 °C | 3.31 | [20] |
| ZnO nanorods/rGO) mesoporous nanocomposites | NO2 | 1 | RT | 119 | [21] |
| Graphene nanoplatelets/polyaniline nanocomposite | NH3 | 1 | RT | 0.7 | [22] |
| rGO/PtNPs nanocomposite | NH3 | 1 | RT | 2.87 | [23] |
| Polyaniline (PANI)/graphene oxide (GO)/ZnO hybrid LbL film | NH3 | 50 | 65% RH | 3 | [24] |
| Graphene oxide | H2 | 200 | RT | 10 | [25] |
| rGO/TiO2 decorated by Pd/Pt nanoparticles | H2 | 500 | 180 °C | 92% | [26] |
| Parameter | Dimension |
|---|---|
| Electrodes dimension | 15.00 × 2.87 nm |
| Active area dimension | 2.78 × 6.00 mm |
| Size of fingers | 0.216 mm |
| Number of fingers | 5 |
| Gap between fingers | 0.3 mm |
| Material | Sensitivity (% ppm−1) | Relative Humidity (%) |
|---|---|---|
| rGO-MnO2 Silicon | 9.8 | 25 |
| 27.2 | 70 | |
| rGO-MnO2 Kapton | 12.4 | 25 |
| 16.6 | 70 | |
| rGO Silicon | 10.9 | 25 |
| 13.5 | 70 | |
| rGO Kapton | 10.2 | 25 |
| 14.5 | 70 |
| Material | NO2 Concentration (ppm) | Response (%) | Condition | Sensitivity (%ppm−1) | T (°C) | Ref. |
|---|---|---|---|---|---|---|
| Nano-MnO2/xanthan | 7 | 1.21 | Dry | 0.17 | RT | [57] |
| δ-MnO2-Epitaxial Graphene-Silicon Carbide Heterostructures | 5 | 0.27 | 55% RH | 0.14 | RT | [58] |
| Porous MnO2 /rGO | 50 | 5.9 | Dry | 0.118 | RT | [41] |
| ZnO/rGO | 10 | 5.1 | Dry | 0.51 | RT | [59] |
| rGO pomegranate peels | 1 | 3.04 | Dry | 2.94 | 100 | [60] |
| Phosphate doped rGO | 1 | 4.5 | Dry | 4.5 | RT | [61] |
| VO2/rGO | 5 | 1.63 | Dry | 0.326 | RT | [62] |
| MnO2 doped rGO | 1 | 6.2 | Dry | 9.8 | RT | This work |
| MnO2 doped rGO | 1 | 21 | 70% RH | 27.2 | RT | This work |
| Material | NH3 Concentration (ppm) | Response (%) | Condition | T (°C) | Ref. |
|---|---|---|---|---|---|
| PANI@MnO2@rGO | 50 | 15.5 | Dry | 100 | [44] |
| NiFe2O4/rGO | 50 | 1.17 | Dry | 0 | [64] |
| rGO/WO3 | 40 | 8.03 | 55% RH | 35 | [65] |
| FeCo2O4/WO3/rGO | 100 | 19.8 | Dry | 200 | [66] |
| CoFe2O4/rGO | 25 | 1.06 | Dry | RT | [67] |
| rGO@MnO2 | 50 | 18.6 | 50% RH | RT | This work |
Disclaimer/Publisher’s Note: The statements, opinions and data contained in all publications are solely those of the individual author(s) and contributor(s) and not of MDPI and/or the editor(s). MDPI and/or the editor(s) disclaim responsibility for any injury to people or property resulting from any ideas, methods, instructions or products referred to in the content. |
© 2024 by the authors. Licensee MDPI, Basel, Switzerland. This article is an open access article distributed under the terms and conditions of the Creative Commons Attribution (CC BY) license (https://creativecommons.org/licenses/by/4.0/).
Share and Cite
Alouani, M.A.; Casanova-Chafer, J.; de Bernardi-Martín, S.; García-Gómez, A.; Salehnia, F.; Santos-Ceballos, J.C.; Santos-Betancourt, A.; Vilanova, X.; Llobet, E. The Effect of Doping rGO with Nanosized MnO2 on Its Gas Sensing Properties. Chemosensors 2024, 12, 256. https://doi.org/10.3390/chemosensors12120256
Alouani MA, Casanova-Chafer J, de Bernardi-Martín S, García-Gómez A, Salehnia F, Santos-Ceballos JC, Santos-Betancourt A, Vilanova X, Llobet E. The Effect of Doping rGO with Nanosized MnO2 on Its Gas Sensing Properties. Chemosensors. 2024; 12(12):256. https://doi.org/10.3390/chemosensors12120256
Chicago/Turabian StyleAlouani, Mohamed Ayoub, Juan Casanova-Chafer, Santiago de Bernardi-Martín, Alejandra García-Gómez, Foad Salehnia, José Carlos Santos-Ceballos, Alejandro Santos-Betancourt, Xavier Vilanova, and Eduard Llobet. 2024. "The Effect of Doping rGO with Nanosized MnO2 on Its Gas Sensing Properties" Chemosensors 12, no. 12: 256. https://doi.org/10.3390/chemosensors12120256
APA StyleAlouani, M. A., Casanova-Chafer, J., de Bernardi-Martín, S., García-Gómez, A., Salehnia, F., Santos-Ceballos, J. C., Santos-Betancourt, A., Vilanova, X., & Llobet, E. (2024). The Effect of Doping rGO with Nanosized MnO2 on Its Gas Sensing Properties. Chemosensors, 12(12), 256. https://doi.org/10.3390/chemosensors12120256