Article

Influence of Synthesis Method and Electrode Geometry on GHG-Sensing Properties of 5%Gd-Doped SnO2

by
Cristian Eugen Simion
1,
Catalina Gabriela Mihalcea
1,2,
Alexandra Corina Iacoban
1,
Ion Viorel Dinu
1,
Daniela Predoi
1,
Ioana Dorina Vlaicu
1,
Ovidiu Gabriel Florea
1 and
Adelina Stanoiu
1,*
1
Laboratory of Atomic Structures and Defects in Advanced Materials, National Institute of Materials Physics, Atomistilor 405A, 077125 Magurele, Romania
2
Faculty of Physics, University of Bucharest, Atomistilor 405, 077125 Magurele, Romania
*
Author to whom correspondence should be addressed.
Chemosensors 2024, 12(8), 148; https://doi.org/10.3390/chemosensors12080148
Submission received: 14 May 2024 / Revised: 25 July 2024 / Accepted: 29 July 2024 / Published: 1 August 2024

Abstract

:
This study investigates the influence of synthesis methods and electrode geometry on the physico-chemical properties of 5%Gd-doped SnO2. Two distinct synthesis routes, co-precipitation and hydrothermal growth, were employed, resulting in powders denoted as SnO2: Gd 5%-CP and SnO2: Gd 5%-HT. Morpho-structural and textural analyses reveal a uniform morphology consisting of quasi-spherical nanoparticles with dimensions of ~6 nm and mesoporosity for CP and a non-uniform morphology with larger nanoparticles of ~42 nm, with irregular shapes and macroporosity for the HT sample, respectively. The powders were deposited onto alumina substrates equipped with platinum interdigital electrodes with alternative gaps of 200 μm and 100 μm. The back-side heater allows for variation in the temperature of the layer. Sensing properties assessed under in-field-like atmospheres simulated by a computer-controlled Gas Mixing System reveal higher sensitivity to methane compared to carbon dioxide. Although the sensor signals did not differ quantitatively, they exhibited distinct saturation tendencies with an increasing methane concentration, attributed to the morpho-structure and porosity induced by the synthesis method. Differentiation was achieved by varying the interdigital gap of the electrodes, highlighting different sensor signals and conduction mechanisms, determined by the specific size of the crystallites.

1. Introduction

It has been observed in the past decades that the atmospheric abundance of greenhouse gases (GHGs) has exhibited a continuous increase [1]. In direct relation, the overall Earth’s temperature has shown a subsequent rise, with September 2023 reported as the warmest month in the past 174 years [2]. The primary GHGs of concern are carbon dioxide (CO2), methane (CH4), and nitrous oxide (N2O) [3]. While the main constituents of the Earth’s atmosphere are nitrogen and oxygen, which are symmetric molecules without a dipole moment, the main GHGs, CO2 and CH4, exhibit a permanent dipole moment leading to IR adsorption [4,5]. Accordingly, IR technologies play crucial roles in monitoring GHGs in the atmosphere, despite the high costs of periodic maintenance and data acquisition subsystems. Thus, the challenge lies in the development of simple devices, i.e., sensors capable of selectively monitoring GHG emissions. Among various sensing techniques, metal oxide semiconductor (MOS)-based chemo-resistive sensors have shown better performance than spectroscopic ones, with high sensor response, low fabrication costs, ease of operation, and low power consumption [6]. Their problem remains the selective sensitivity to a gas compared to other potential interfering gases. The main interferent, humidity, is often neglected, although it is permanently present in the “in-field” atmosphere. Regarding CO2 and CH4, selective detection allows specific measures to reduce different pollution factors, although they are present simultaneously. More specifically, CO2 emissions are mainly due to factories, combustion sources, and heavy traffic, while CH4 emissions are due to anaerobic soils, forest fires, coal mines, oil and gas fields, the digesting processes of ruminant animals, landfills, and other waste management facilities. Furthermore, CH4 is a long-lasting GHG with a higher warming potential than CO2 [7].
So, the challenge of selectivity is complex; it concerns both the potential noxes and the relative humidity (%RH) of the air. In the case of chemo-resistive sensors, this challenge is addressed by examining the intrinsic properties of the MOS-sensitive element, which can be modulated by the synthesis method determining morphological aspects such as grain shape and size, by doping, or by using adaptative heterostructures [8]. Various MOS-based sensors have shown promising sensing properties for GHG detection [9,10]. However, considering the additional applicative requirements such as good sensor signal (response) and selectivity, fast transients, and simple device integration for direct use under in-field conditions, there is a continuous need for further improvements in MOS-based sensors for GHG detection [11]. It should be emphasised that although interest in GHG detection has increased, the potential interferences have generally not been considered. Table 1 presents a survey of gas sensing performances of SnO2-based gas sensors. The sensor signals were calculated as the ratio between the reference electrical resistance value in air and the resistance value after exposure to the respective test gas.
Besides SnO2, there is a recent focus on rare-earth oxycarbonates Ln2O2CO3, which are unstable, and rare-earth oxides Ln2O3, which exhibit sensor signals to CO2 ranging between 1 and 10, depending on the lanthanide element (Nd, Sm, Gd, Dy, Er, and Yb). Among these, Gd2O3 has demonstrated the highest sensitivity; however, its selectivity towards methane has not been analysed [17]. Our recent study reported the sensing properties of SnO2, Gd2O3, and Gd-doped SnO2 for in-field conditions with variable RH. All powders were prepared by using the wet chemical co-precipitation method. Structural analyses revealed that 5% Gd represents the doping limit, beyond which the incipient secondary phase of Gd2O3 appears. The selection of materials was based on the CO2 sensor signal criterion and Gd-doped SnO2 was excluded from the selectivity study against methane [18].
Apart from doping the base material with different ions or cations, the geometry of interdigital electrodes should be considered an important factor that significantly contributes to the overall gas sensing performances of MOS-based gas sensors [19]. During operation under field atmospheres, the role of the interdigital electrodes manifests through charge transport within the polycrystalline sensing material. Several studies report on how the width and gap of interdigital electrodes affect gas sensitivity [20]. For instance, in the case of SnO2-based sensors, the response to NO2 was significantly influenced by the interdigital gap; namely, sensors with wider gaps (30 μm) demonstrated good sensitivity to high concentrations of NO2, whereas those with smaller gaps (1 μm) exhibited the opposite effect, with increased sensitivity and faster transients to lower NO2 concentrations [21]. Gardner et al. [22] reported an exponential increase in thin film WO3 sensitivity as the gap between electrodes decreased from 0.8 to 0.1 μm, as detailed in a study on the impact of the electrode gap on NO2 sensing capabilities [23]. This result was attributed to the reduced number of WO3 grains between the electrodes as the gap narrowed, leading to a decrease in grain boundary resistance during charge conduction.
The present work focuses on the possibility of modulating the sensing properties of 5%Gd-doped SnO2 based on the following aspects: the synthesis method (co-precipitation versus hydrothermal), the operating temperature of the sensitive layer, and the interdigital electrode gap (200 μm versus 100 μm) of the layer substrate. The sensor signal is calculated from the variation in electrical resistance induced by the presence of the main GHGs (CO2 and CH4) in the atmosphere, considering the RH specific to in-field situations.

2. Materials and Methods

2.1. Powders Synthesis

Starting from the premise that depending on the preparation method, the materials present different morphologies [24], 5%Gd-doped SnO2 was synthesised using two alternative methods: (i) Co-precipitation: Sn4+ and Gd3+ precursor solutions (containing the amounts corresponding to the formula Sn1−xGdxO(4−x)/2 and the doping amount of 5 at. %Gd) were precipitated with NaOH at a temperature of 80 °C in the presence of CTAB (cetyltrimethylammonium bromide) surfactant for 3 h. The resulting precipitate was separated by centrifugation, washed repeatedly with double-distilled water, and subsequently dried at 80 °C in air. The powder was finally calcined at 550 °C for 2 h. (ii) Hydrothermal: Sn4+ and Gd3+ precursor solutions were mixed with NaOH at room temperature for half an hour in a Teflon vessel. The vessel was then kept at a temperature of 160 °C for 18 h in a steel enclosure. The precipitate resulting from the hydrothermal synthesis was separated by centrifugation and repeatedly washed with double-distilled water. The process was completed by drying the powder at 120 °C and heat treatment at 550 °C for 2 h.
The obtained powders were labelled as SnO2: Gd 5%-CP and SnO2: Gd 5%-HT.

2.2. Structural and Morphological Investigations

X-ray diffraction (XRD) was performed with a Bruker D8 Advance X-ray diffractometer (Cu anode and Ni filter, λ = 1.54184 Å) in a Bragg–Brentano configuration at room temperature, in the range of 2θ from 20° to 120°. The XRD data were analysed using MAUD version 2.99 software for determining the lattice parameters and average crystallite size through Rietveld refinement.
Conventional transmission electron microscopy (CTEM), selected area electron diffraction (SAED), high-resolution transmission electron microscopy (HRTEM), and scanning TEM combined with energy-dispersive X-ray spectroscopy (STEM-EDS) were performed using a JEOL JEM-2100 transmission electron microscope. The microscope was operated at 200 kV and equipped with an X-ray detector for EDS investigations.

2.3. Textural Analysis

Textural properties were determined using the ASAP 2020 physisorption analyser (Micromeritics GmbH, Unterschleißheim, Germany). The samples were degassed at 300 °C for 10 h before nitrogen adsorption. The N2 adsorption–desorption experiments were conducted at 77 K. The BET (Brunauer–Emmett–Teller) model was utilised to calculate the surface area of the obtained samples. Additionally, the BJH (Barrett–Joyner–Halenda) model was employed to determine the average pore size.

2.4. Layer Deposition and Sensing Investigations

SnO2: Gd 5%-CP and SnO2: Gd 5%-HT powders were mixed with 1,2 Propanediol and mortared for 15 min to obtain a medium-viscosity paste. This paste was then screen-printed as thick layers onto commercial alumina substrates. The resulting sensors were slowly dried at 60 °C and heat-treated at 500 °C in the air. This process allows the complete removal of the organic solvent, ensuring the layer’s porosity and promoting the adhesion of the layer to the substrate. The substrates used for the sensors are based on planar technology from Innovative Sensor Technology, Switzerland, and are equipped with platinum (Pt) electrodes and a back-side heater, with gold socket contacts. The Pt thickness deposition of both the interdigital electrodes and heater is 5 µm. The interdigital electrodes on the substrate have gaps of 200 μm and 100 μm, respectively. The heater’s electrical resistance is 15 Ohm ± 15% at 25 °C. The chip dimensions are 25 × 4 mm and 0.7 mm thick. The sensitive layer deposited above the interdigital electrodes (marked in yellow in Figure 1a) is 7 µm thick and 3.5 × 7 mm (LxW). The temperature of the sensing layer is controlled by varying the electrical power through the heater, allowing for modulation of the chemical interaction between the MOS layer and the test gases.
To simulate the in-field atmosphere, a Gas Mixing System (GMS) controlled by dedicated Keysight VEE software was employed. The GMS consists of eleven gas channels equipped with Bronkhorst El-Flow mass flow controllers, solenoid valves, and high-purity gas bottles. It operates in a dynamic regime with a total flow rate of 200 mL/min. RH control is achieved through a separate channel with a gas washing bottle filled with wet Chromosorb P-NAW. The electrical resistance changes of the sensors placed into a high-grade PTFE sensor chamber were acquired in real-time using a Keithley 6517A Electrometer (Keithley, OH, USA) (Figure 1a).

3. Results and Discussions

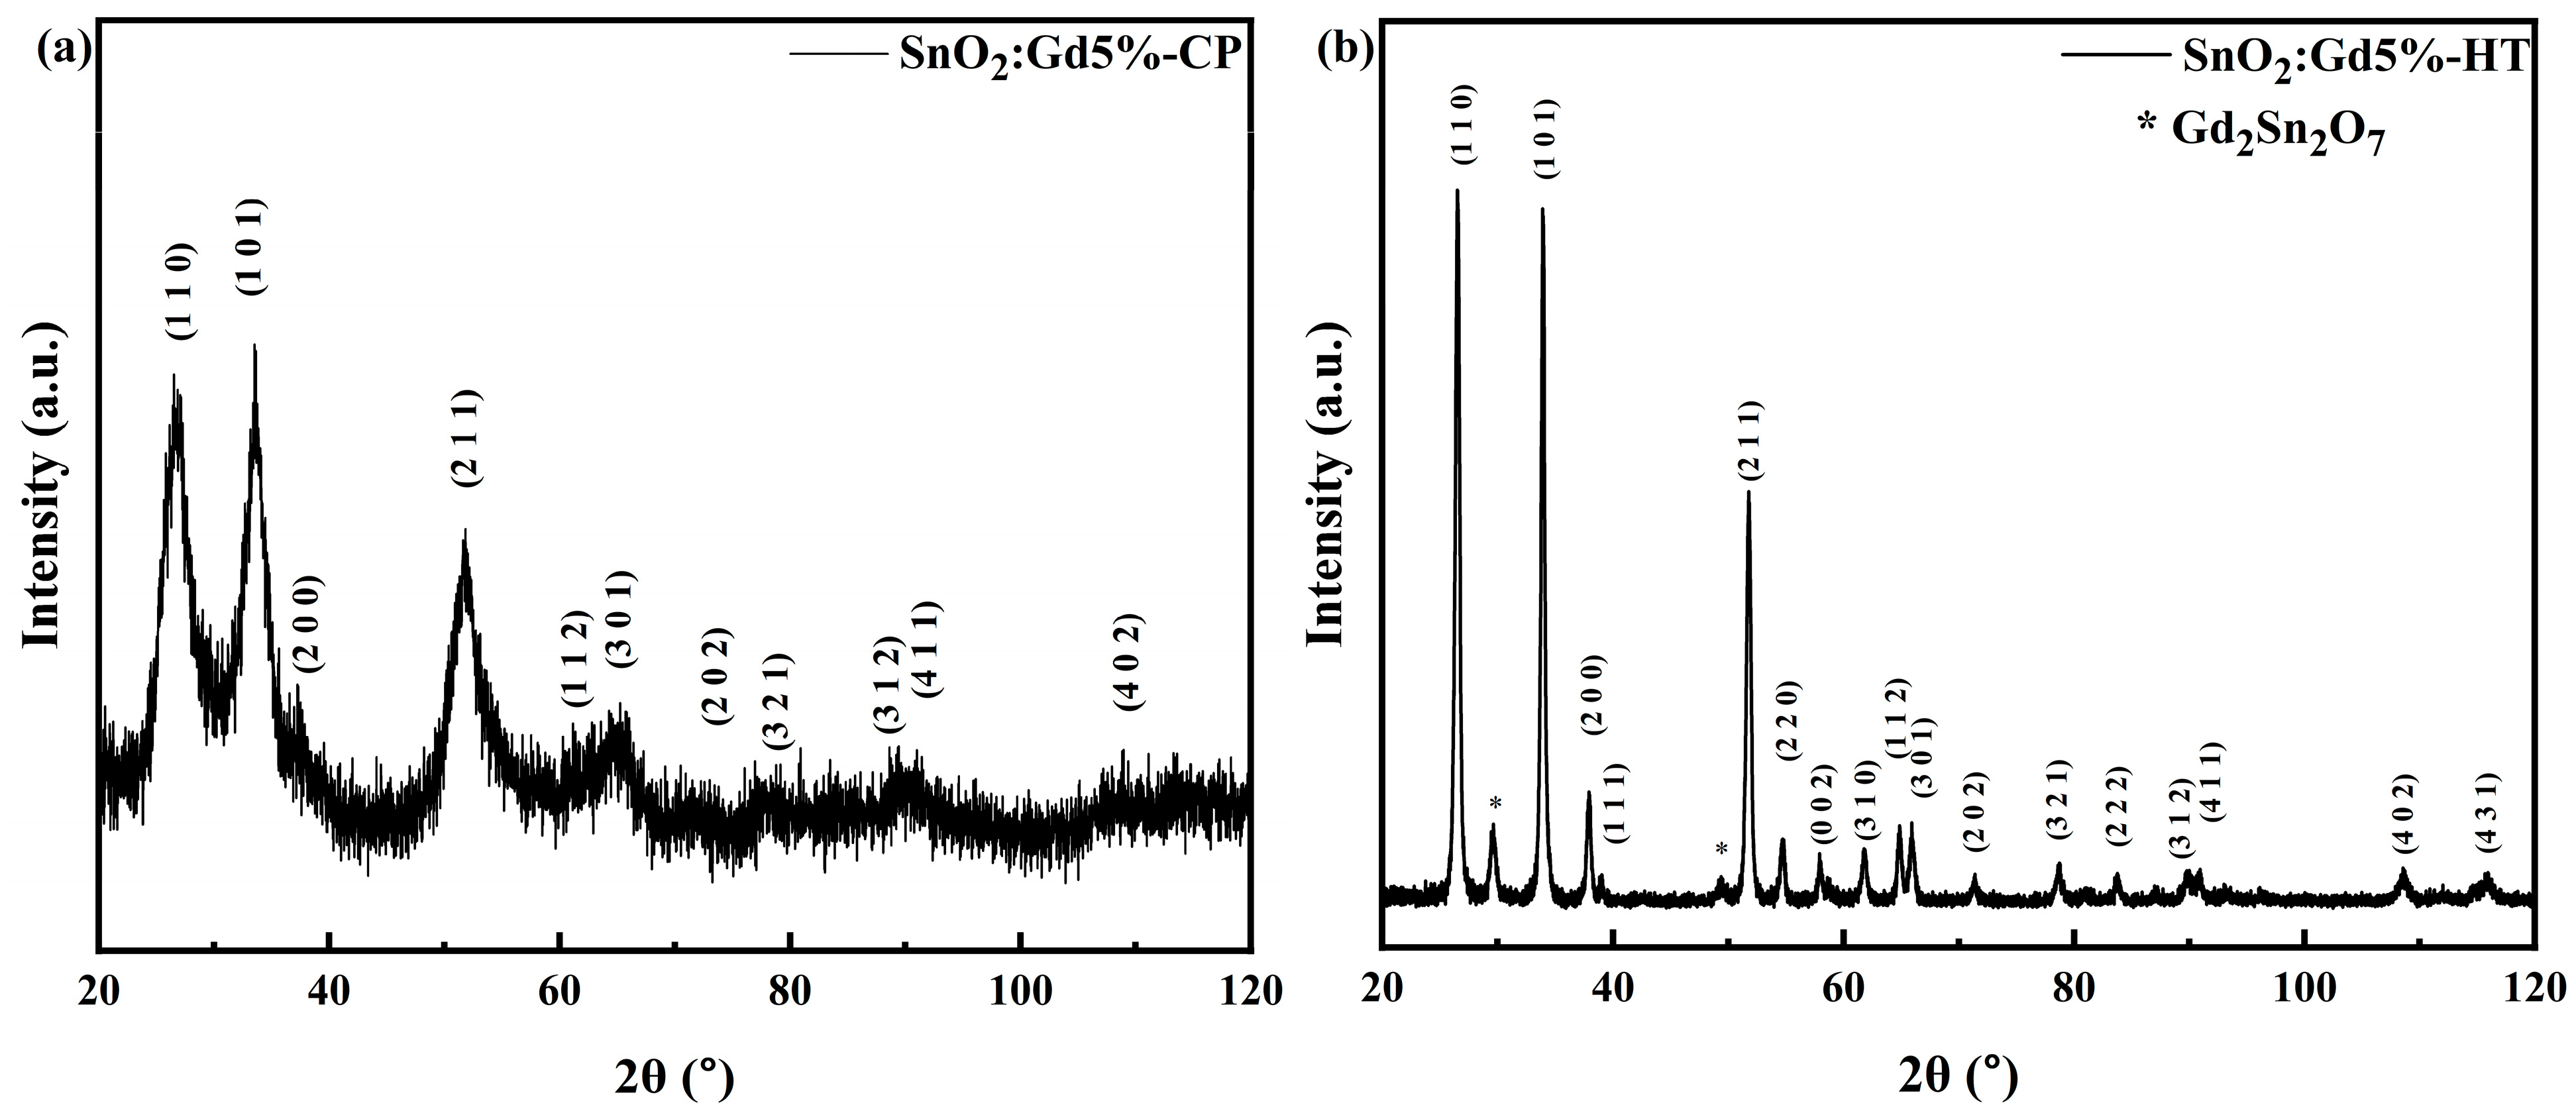
3.1. XRD Characterisation

Powder X-ray diffraction (XRD) patterns of SnO2: Gd 5%-CP and SnO2: Gd 5%-HT are depicted in Figure 2a,b. Both diffractograms exhibit the characteristic diffraction pattern of the SnO2 crystalline phase, with a tetragonal structure and a symmetry space group of P42/mnm, according to cif no. 1526637 from the COD database.
In the case of the hydrothermal sample, two additional peaks (noted with * in Figure 2b) can be observed along with the SnO2 diffraction peaks. The secondary phase was identified by Rietveld refinement analysis as a stannate pyrochlore corresponding to the digadolinium distannate (Gd2Sn2O7) crystalline phase, with a cubic structure and a symmetry space of Fd 3 ¯ m. Compared with the reference data in the cif used for Rietveld refinement analysis, it was observed that the lattice parameters were not significantly modified in the case of the co-precipitation sample. However, there is a slight variation for the hydrothermal sample, which can be attributed to the Gd doping effect.
The average crystallite sizes were determined to be d = 3.63 ± 0.03 nm for the SnO2: Gd 5%-CP sample and d = 42.06 ± 0.1 nm for the SnO2: Gd 5%-HT, as obtained by Rietveld refinement analysis (Table 2).

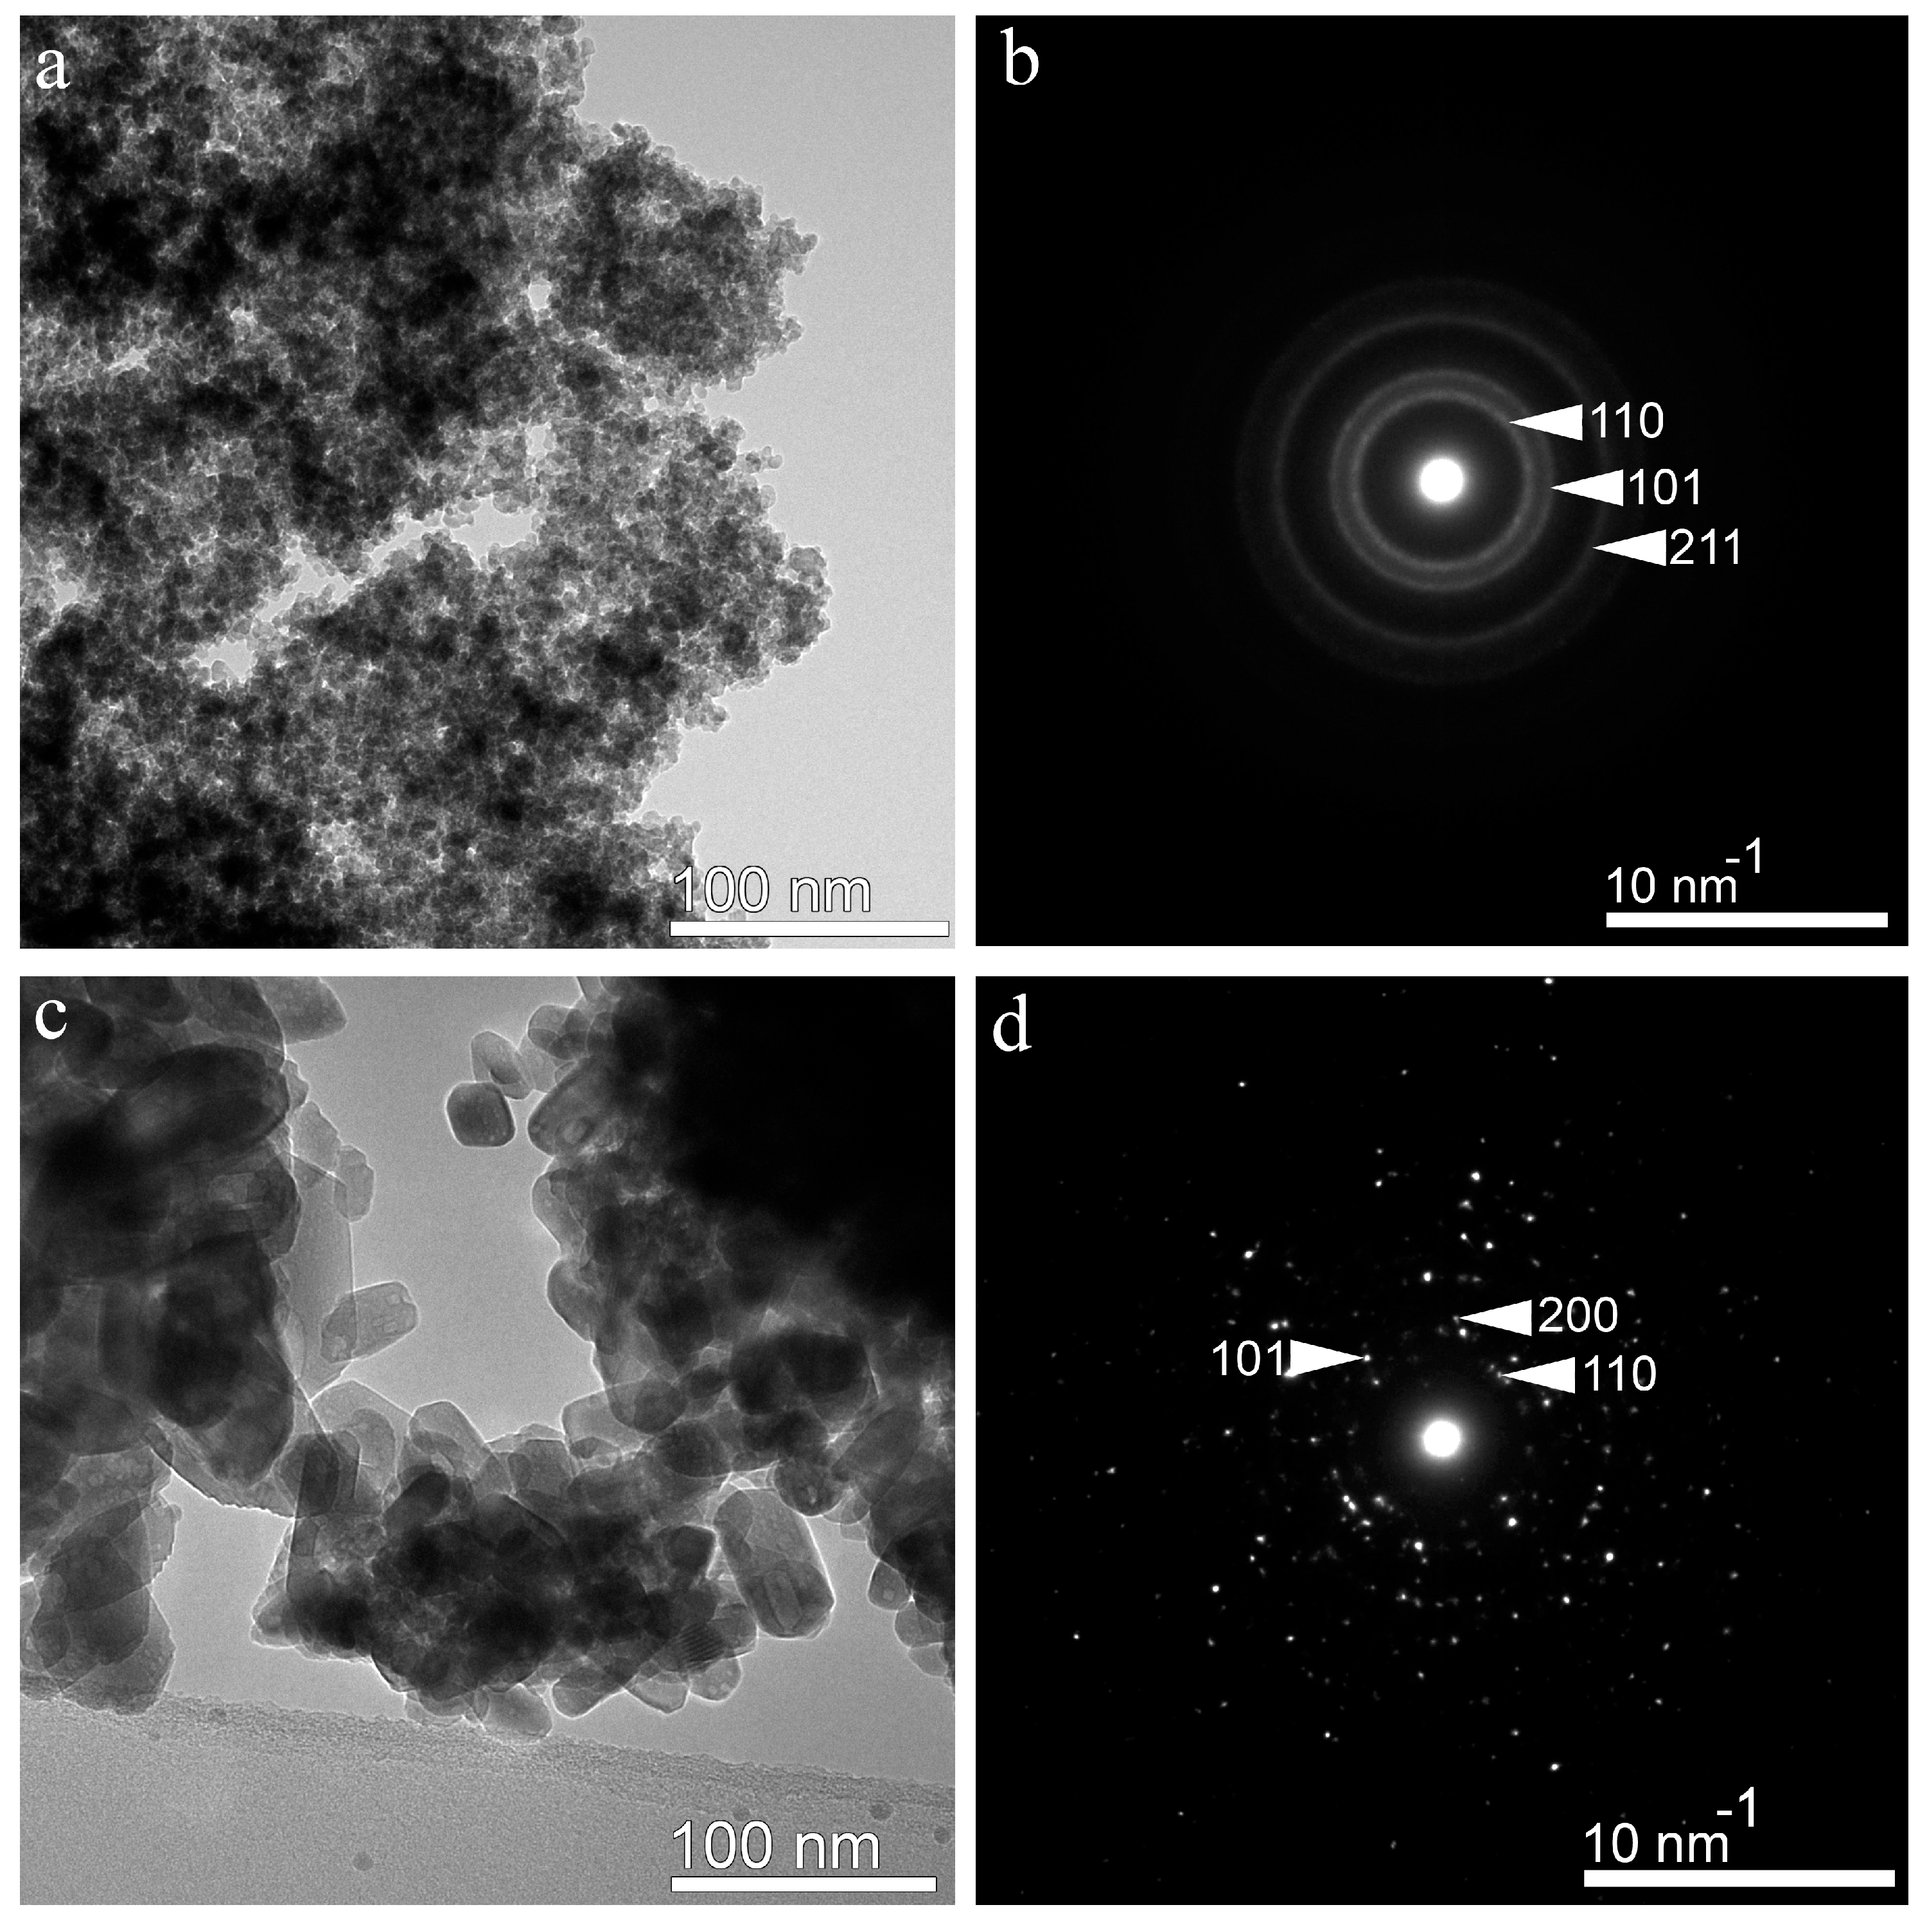
3.2. Analytical TEM Characterisation

The low-magnification TEM image obtained for SnO2: Gd 5%-CP (Figure 3a) reveals a uniform morphology: quasi-spherical nanoparticles with dimensions of approximately 6 nm. On the other hand, SnO2: Gd 5%-HT is characterized by a non-uniform morphology, with larger nanoparticles of approximately 42 nm, with irregular shapes (Figure 3c). The white arrows from the SAED patterns shown in Figure 3b,d indicate the diffraction rings corresponding to the (110), (101), (211), and (200) lattice planes of tetragonal SnO2. The patterns consist of concentric diffraction rings, typical for diffraction on polycrystalline materials.
STEM-EDS mapping was performed to observe the spatial distribution of the two elements (Sn and Gd).
Thus, the elemental maps shown in Figure 4 reveal a uniform distribution for SnO2: Gd 5%-CP (Figure 4a) and an agglomeration tendency for Gd in the SnO2 matrix for SnO2: Gd 5%-HT (Figure 4b).
To confirm the Rietveld information regarding the presence of digadolinium distannate (Gd2Sn2O7) as a secondary phase, additional TEM analyses were required. Figure 5a illustrates a TEM image showing a supplementary morphology, consisting in smaller nanoparticles (~7 nm). A further investigation of this area, using SAED (Figure 5b), points towards the (222), (400) and (440) crystallographic planes of Gd2Sn2O7. Elemental STEM-EDS mapping (Figure 5c,d) shows an agglomeration tendency in the area of smaller nanoparticles associated with the Gd2Sn2O7 secondary phase.
High-resolution TEM investigations (HRTEM) offer information regarding the porosity and the shape of the nanoparticles. Pores are visible at different magnifications for SnO2: Gd 5%-HT (Figure 6c) compared to the sample SnO2: Gd 5%-CP (Figure 6a).
Regarding the shape, Figure 6b reveals two SnO2 nanoparticles oriented along the [1-1-1] axis, faceting along the (110) and (101) crystallographic planes for SnO2: Gd 5%-CP, and Figure 6d shows an elongated SnO2 nanoparticle oriented along the [1-1-1] axis and well-defined facets along the (110) and (101) planes, for SnO2: Gd 5%-HT.
In summary, the TEM investigations confirm the Rietveld refinement analysis of the XRD patterns and highlight the main differences between the two samples. SnO2: Gd 5%-CP exhibits a uniform morphology characterised by ~6 nm quasi-spherical nanoparticles and a uniform distribution of Gd in the SnO2 matrix. SnO2: Gd 5%-HT, on the other hand, has larger quasi-spherical and elongated nanoparticles (~42 nm), an uneven distribution of Gd in the Sn matrix, and higher porosity, which is easily visible at different magnifications.

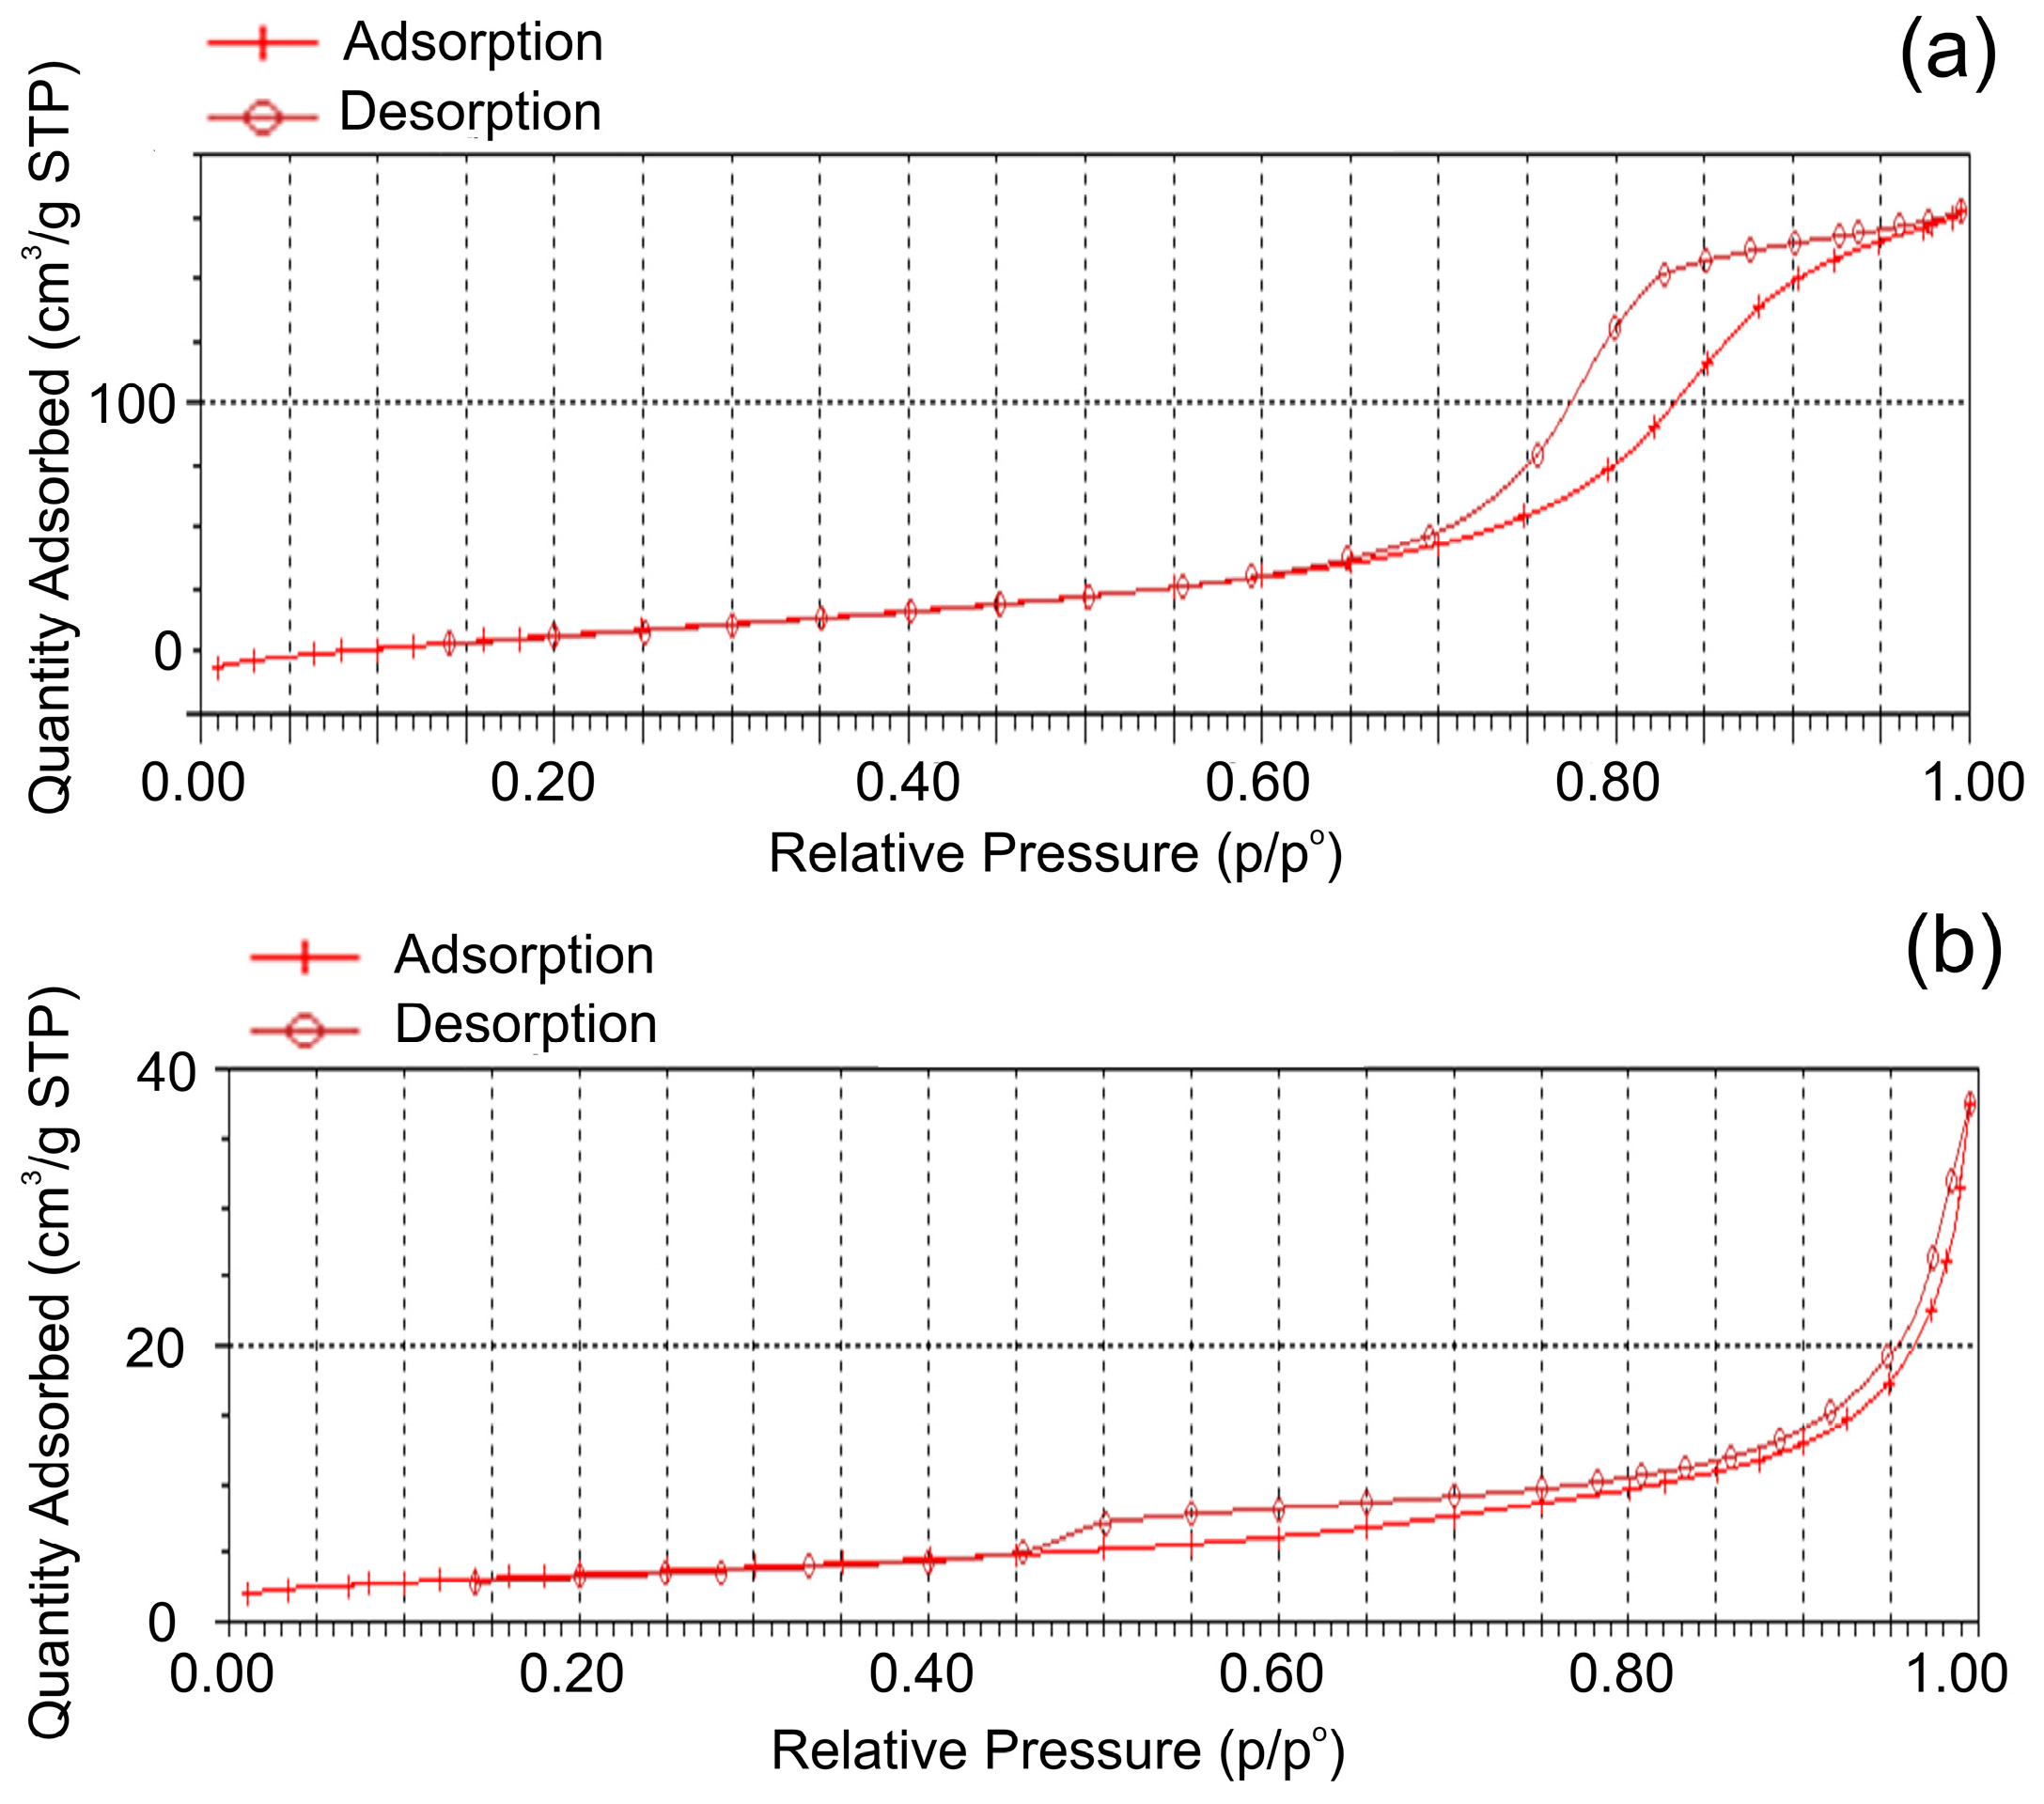
3.3. Textural Characterisation

The specific surface area (SBET) and porosity of SnO2: Gd 5%-CP and SnO2: Gd 5%-HT samples were determined using N2 adsorption/desorption isotherms, confirming the porous nature of the samples (Figure 7a,b). According to the International Union for Pure and Applied Chemistry (IUPAC) classification, these isotherms exhibit type IV behaviour for both samples.
The N2 adsorption/desorption isotherms of the SnO2: Gd 5%-CP sample suggest mesoporosity, while those of the SnO2: Gd 5%-HT sample indicate monolayer adsorption at low pressure and multilayer adsorption at high pressure [25], suggesting macroporosity. This behaviour is consistent with previously reported studies [26]. The fitting curves of the BET surface area of samples CP and HT were linearly correlated (Figure 8a,b), with correlation coefficients of RCP2 = 0.9999 for SnO2: Gd 5%-CP and RHT2 = 0.9997 for SnO2: Gd 5%-HT.
The specific surface area (SBET) was calculated using the BET theory [27]. Thus, SBET was 91.32 m2·g−1 for sample CP, while for sample HT it was 12.48 m2·g−1. The average pore diameter was determined using the Barrett–Joyner–Halenda (BJH) model. The average pore diameter was 10.93 nm for sample CP and 18.53 for sample HT.
The BET surface area, total pore volumes, average, and BJH pore diameter are summarised in Table 3.
Along with the increase in the pore size, the specific surface area decreased in the case of sample HT compared to sample CP, where a decrease in the pore size was observed. This behaviour could be due to the blocking of several micropores as a result of the presence of very small nanoparticles. The results obtained agree with those previously presented by Cai et al. [28]. According to Pandey et al. [29], the size/crystallinity of the particles is inversely proportional to the surface area. The XRD and TEM studies confirm that the particle size is smaller in the case of sample SnO2: Gd 5%-CP. The broadening of the diffraction maxima in the case of sample CP is due to the smaller size of the particles.

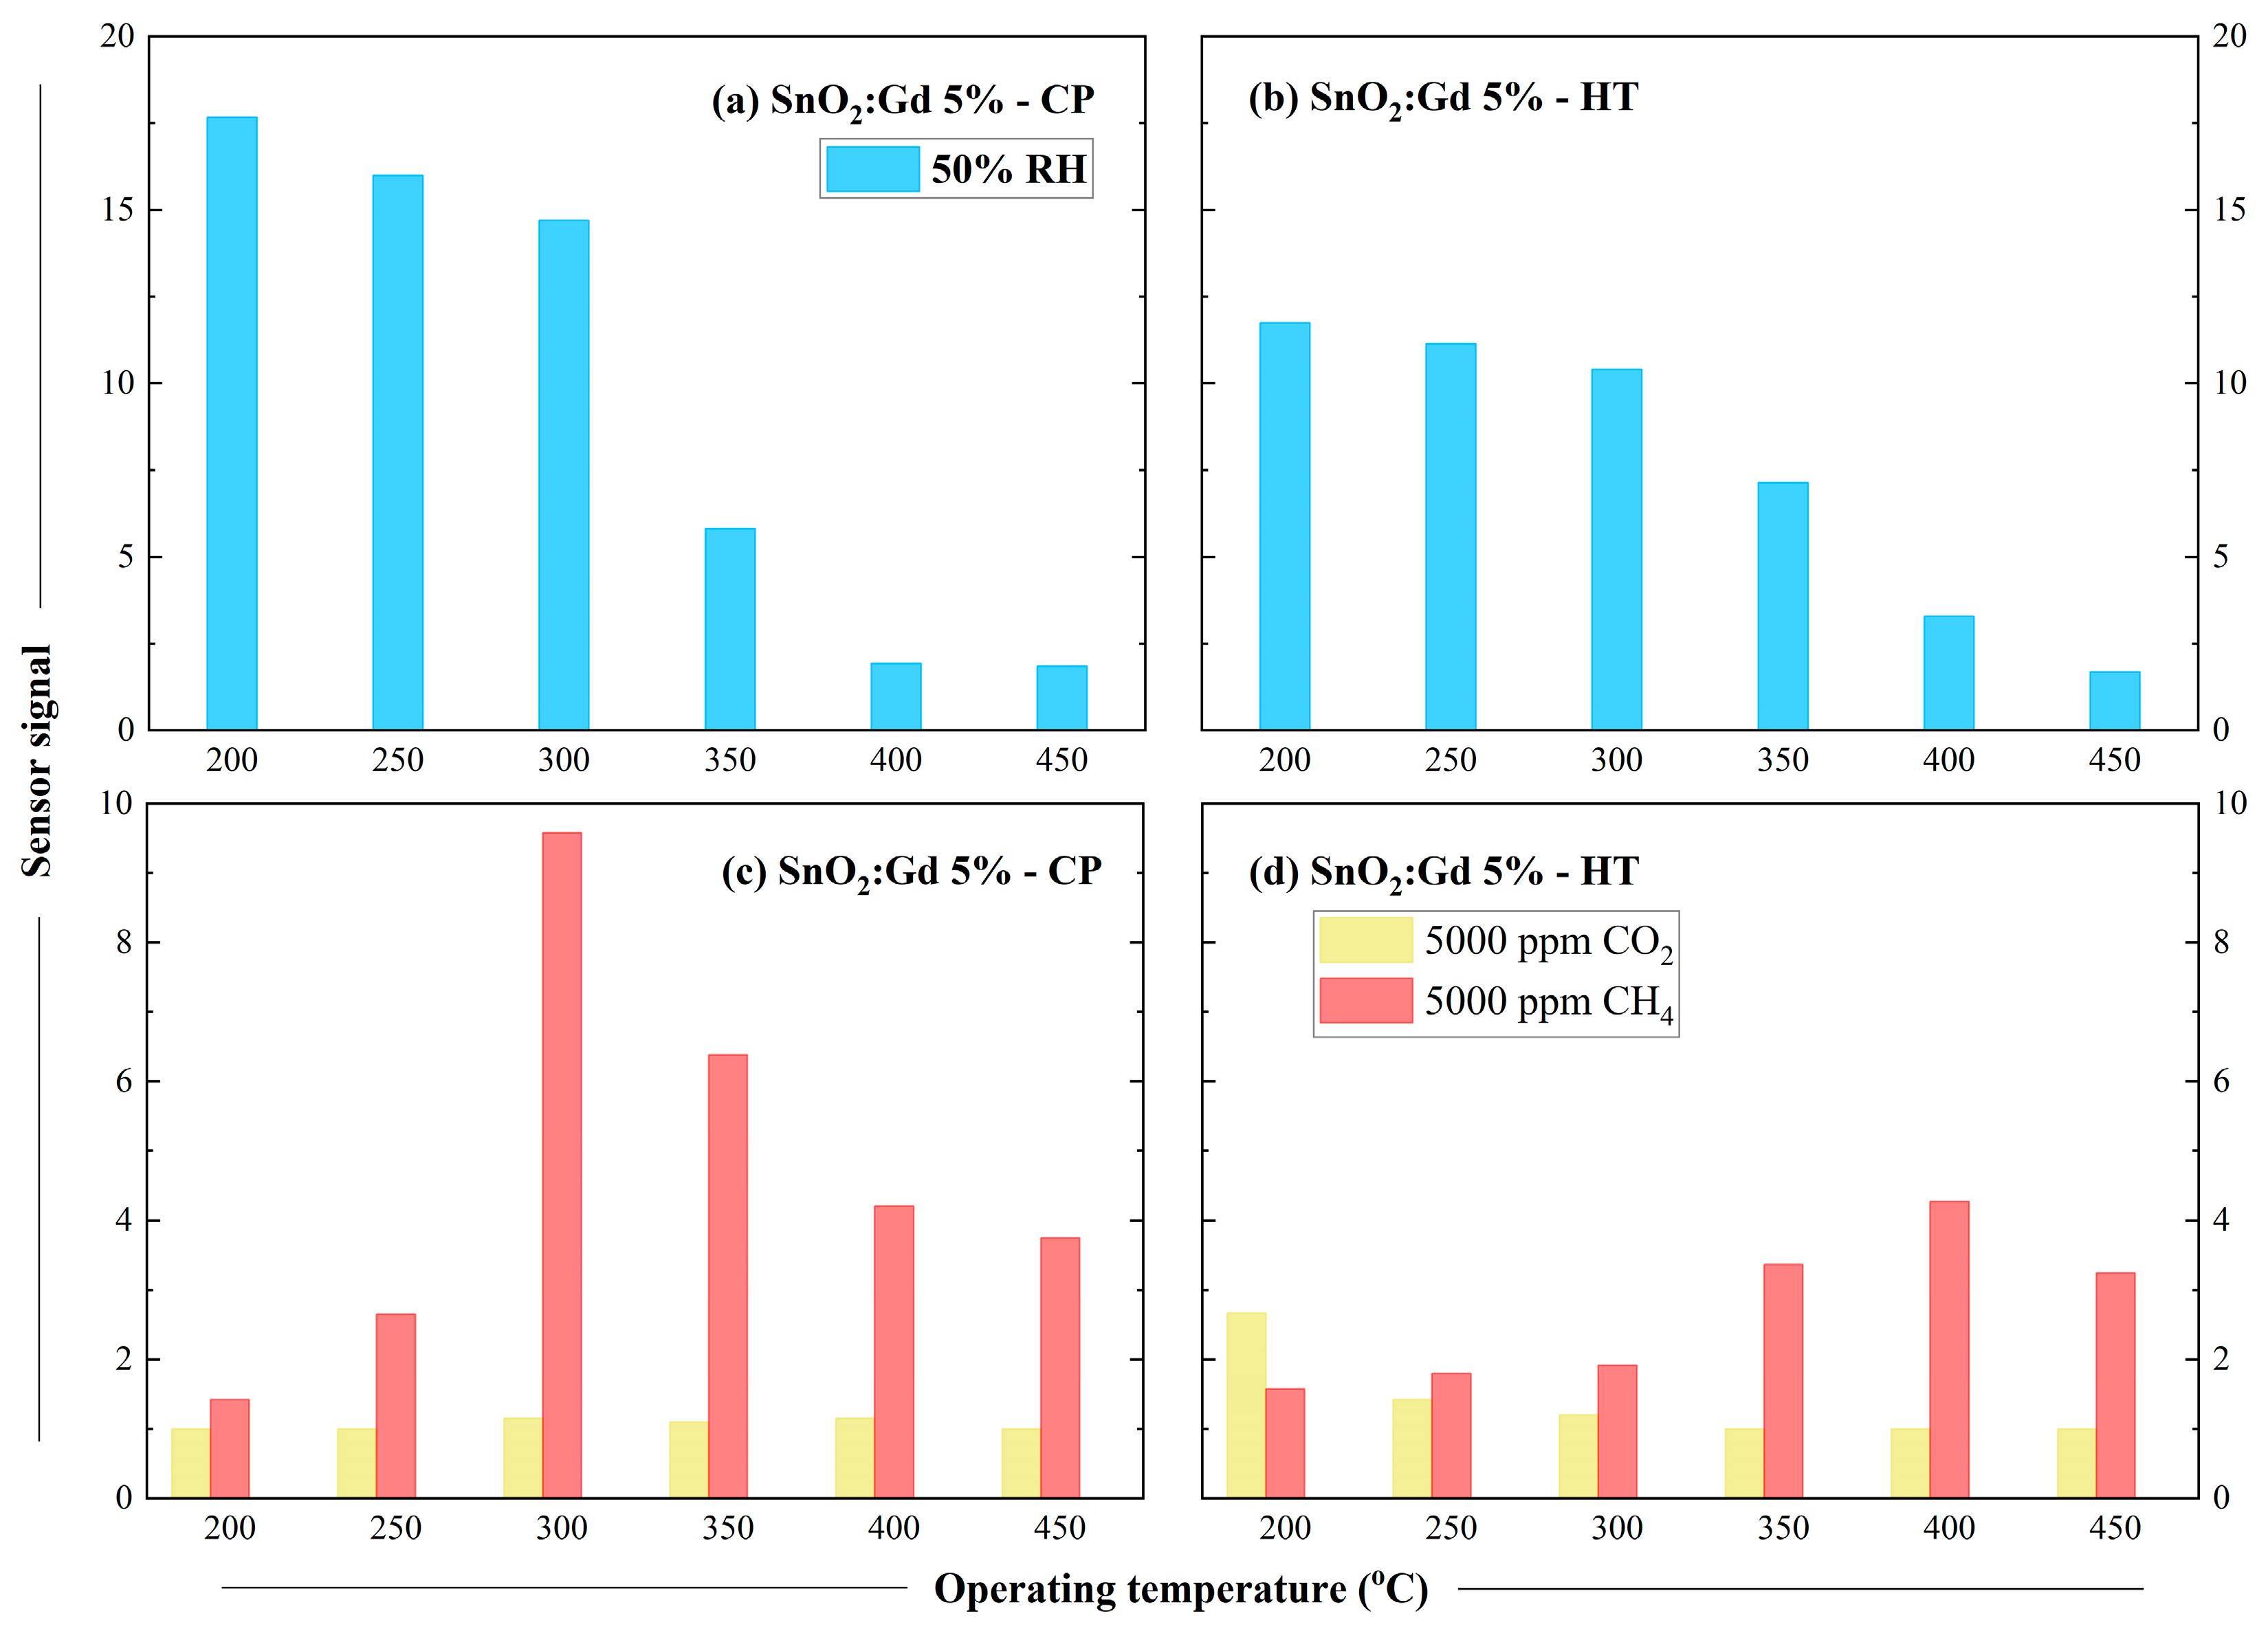
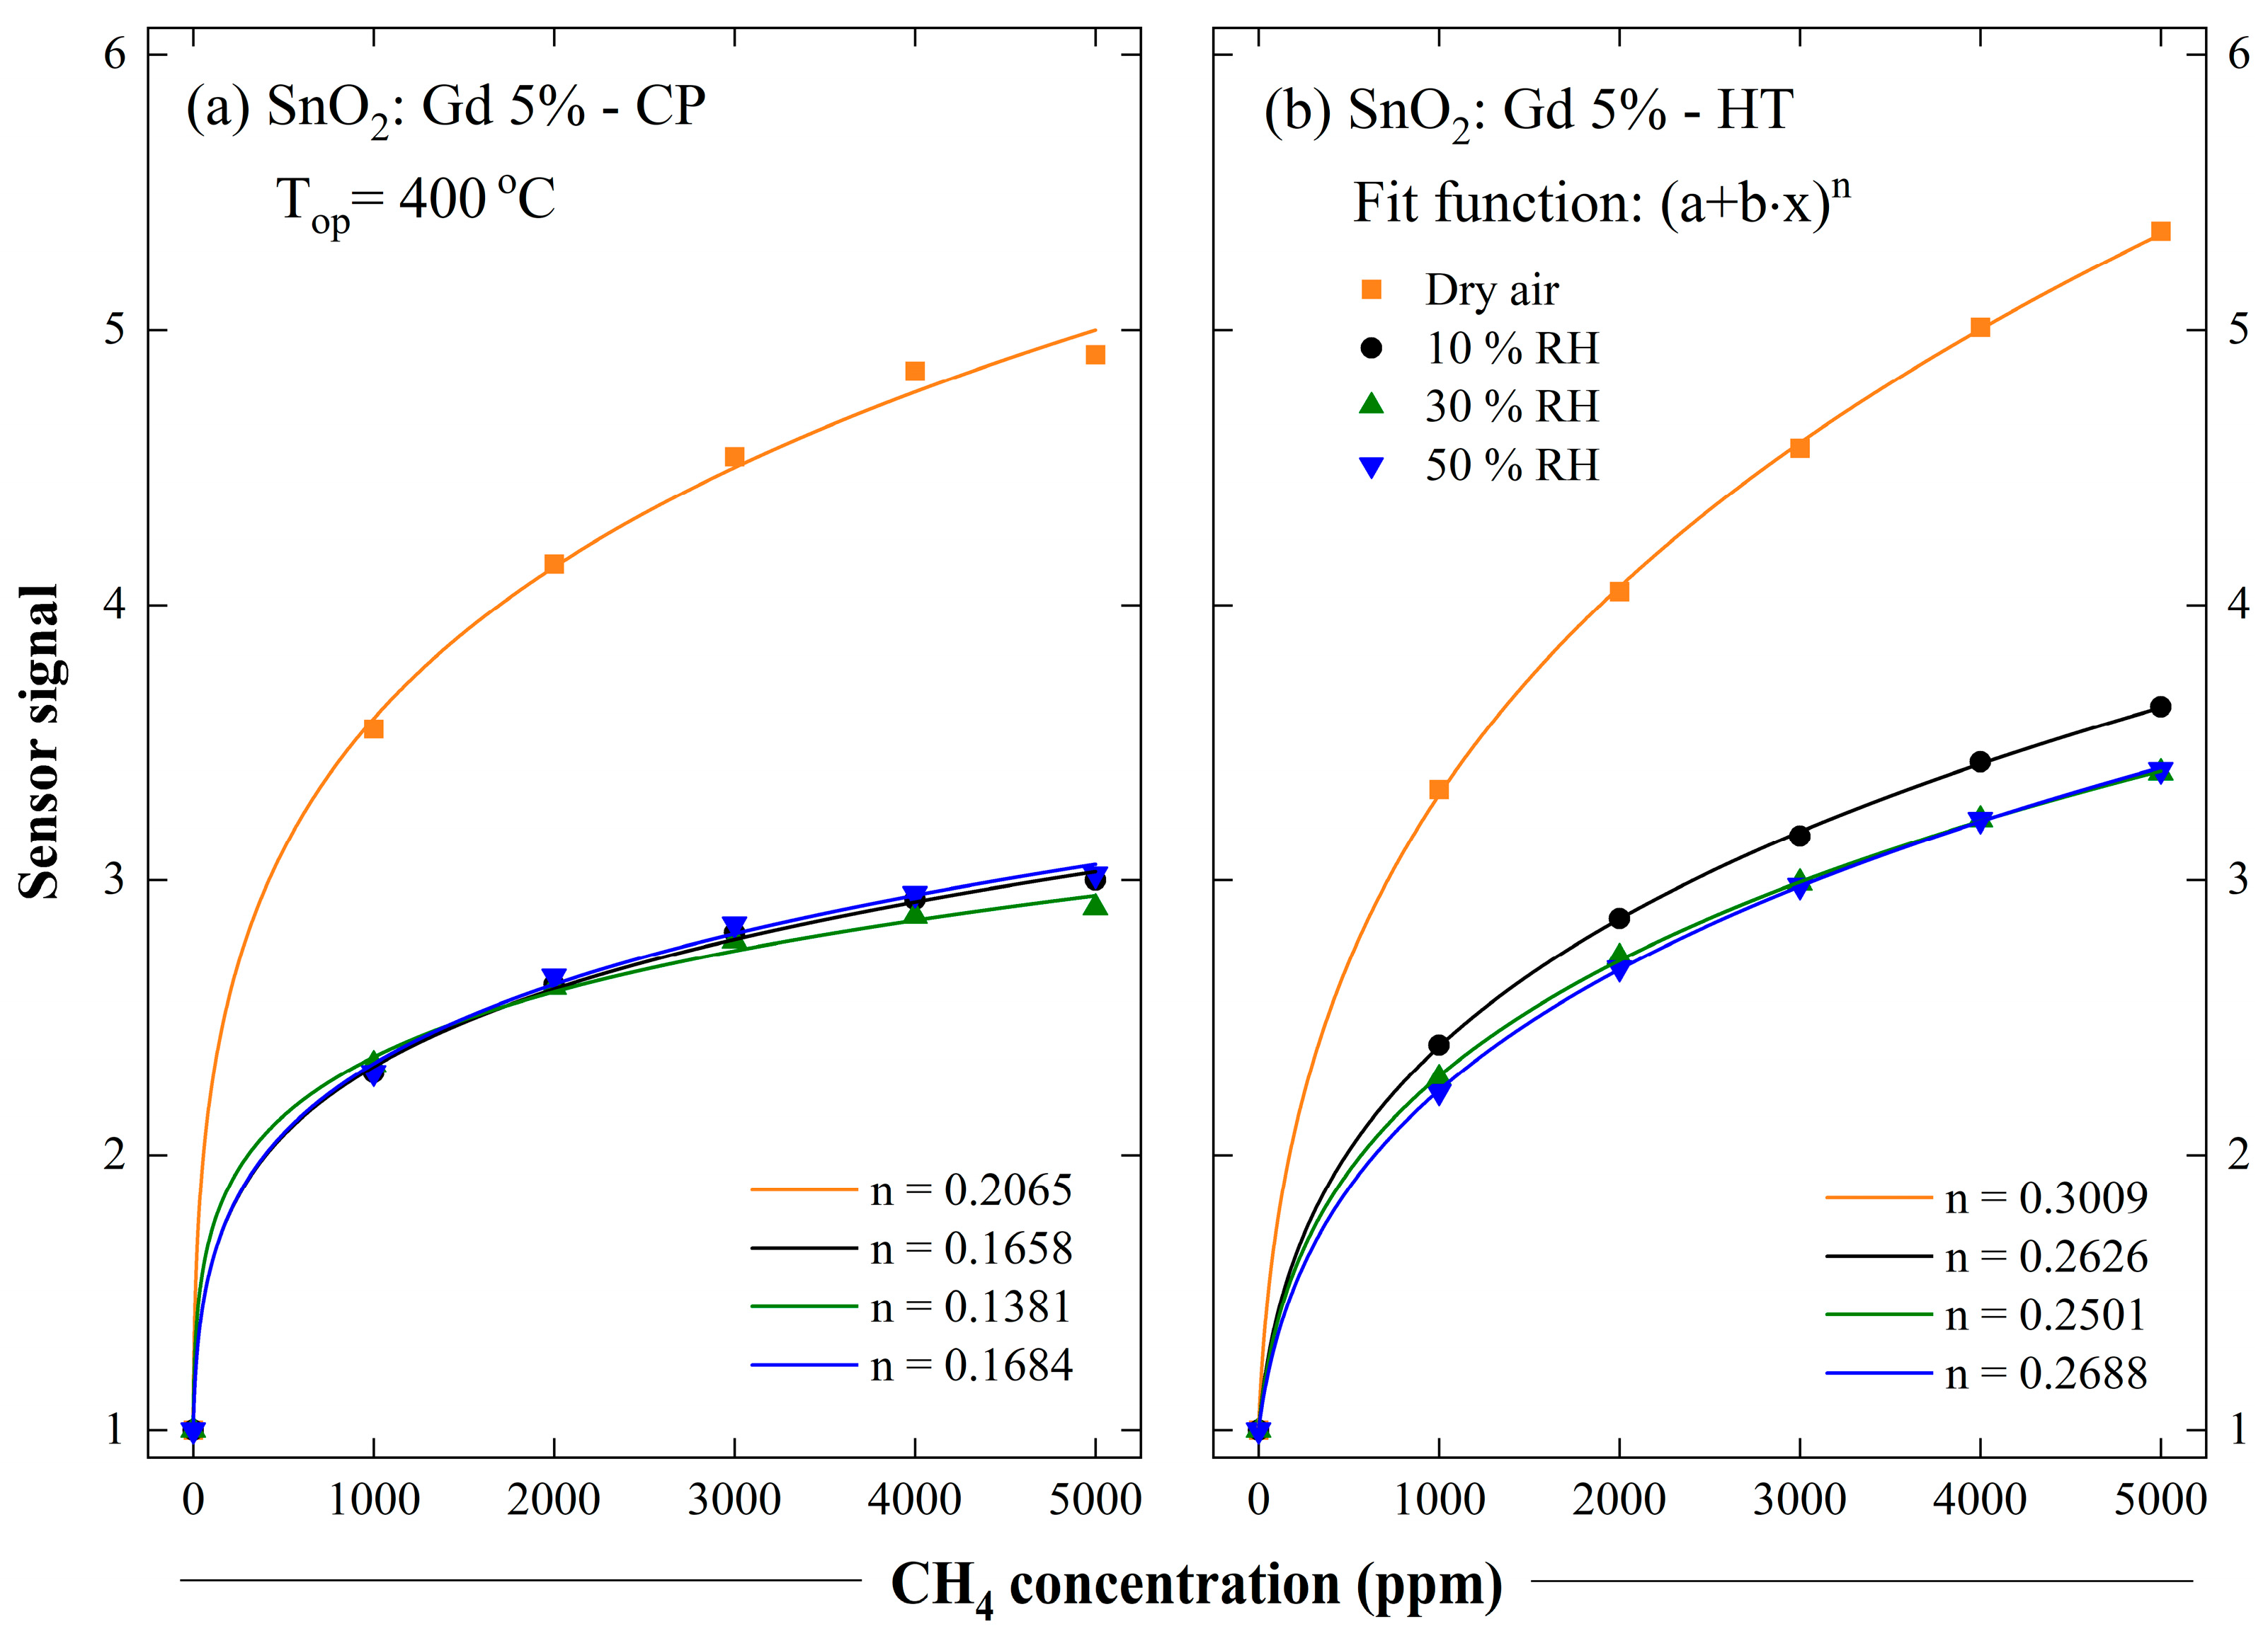
3.4. Sensing Characterisation

Commencing from the widely acknowledged premise that temperature modulates chemical interactions involving charge exchange between the sensitive material and the gases in the ambient atmosphere [30], the first step in material selection was related to the operating temperature. Thus, the SnO2: Gd 5%-CP and SnO2: Gd 5%-HT sensors were consecutively exposed to 50%RH, 5000 ppm CO2, and 5000 ppm CH4, across a range of temperatures from 200 to 450 °C (Figure 9).
The sensor signals were calculated as the ratio between the initial reference electrical resistance value (measured in dry synthetic air with 5.0 purity grade) and the resistance value after exposure to the test gases. Specifically, for each temperature, water vapours were dosed to achieve an average in-field relative humidity of 50% RH (Figure 9a,b) and the change in resistance in moist air compared to dry air was monitored. CO2 and CH4 were also dosed at concentrations specific to their detection limits (Figure 9c,d).
The results highlight the decrease in the influence of water with the increase in temperature, different maximum sensitivity to CH4 depending on the operating temperature, and better sensitivity to CO2 for SnO2: Gd 5%-HT only at 200 °C.
The second step in material selection was related to selectivity. Corroborating the individual dependencies from Figure 9, one can notice that the sensitivity to CH4 is higher relative to both CO2 and RH at the operating temperature of 400 °C. Therefore, the simultaneous impact of CH4 (within a concentration range of 1000 to 5000 ppm) and RH (within 0 to 50%) was monitored for both samples at this temperature (Figure 10).
As can be observed, there are differences between dry and humid air but the RH level (10–50%) does not affect the sensor signals for CH4. This observation holds significant applicative relevance, as long as in-field humidity varies around the average value of 50%. The power law dependence of the signals on CH4 concentration reveals varying exponents, indicating a more pronounced tendency toward saturation for SnO2: Gd 5%-CP. The exponent n is correlated with surface band-bending; the higher the sensor signal for CH4, the higher the value of n [31]. Although the differences between signals are subtle, they become more pronounced when the curves are extrapolated to the lower explosion limit of 5 vol% in air (equivalent to 50,000 ppm CH4). It is important to emphasise that, apart from its explosive potential, high methane levels reduce the amount of oxygen in the air, impacting human breathing and heart rate [32,33]. Lastly, methane has a higher heat trapping capacity than CO2, contributing significantly to a more detrimental greenhouse effect [6,34].
Referring back to Figure 10a,b, the slight differences between the sensor signals can be explained based on the morpho-structural properties induced by the chemical synthesis method. In the case of SnO2: Gd 5%-CP, the saturation tendency observed during CH4 exposure might be attributed to the crystallite characteristics. The thick polycrystalline sensing layer consists of successive planes of small crystallites in close contact, obstructing the micropores and hindering gas diffusion. This results in the limitation of chemisorption, a phenomenon known as the Weisz limitation [35,36]. On the other hand, for SnO2: Gd 5%-HT, the gradual effect of CH4 is due to the un-localised surface chemisorption [37], facilitated by the irregular shapes (e.g., more surface defects) and the porosity of the crystallites, as revealed by morpho-structural and textural investigations.
To improve the methane sensitivity, the focus was oriented towards the influence of the electrode geometry. According to the literature, the overall electrical resistance and the sensitivity can be tuned by changing the aspect ratio of the interdigital electrodes [38]. In our study, commercial planar substrates with an interdigital electrode gap of 100 μm were used as an alternative to the previous samples obtained using an interdigital electrode gap of 200 μm. The results for both materials, SnO2: Gd 5%-CP and SnO2: Gd 5%-HT, are presented in Figure 11a,b.
The differences are obvious; as the interdigitated distance decreases, the signal for CH4 decreases for SnO2: Gd 5%-CP and increases for SnO2: Gd 5%-HT sensors. For simplicity of exposition, Table 4 shows the sensor signals for both 5000 ppm CH4 and 5000 ppm CO2. For comparison, the presentation is similar to Table 1.
Analysis of these behaviours begins with the assumption of a linear arrangement of grains between the interdigital electrodes. Their gap can be approximated as d ≈ N × g, where N represents the number of grains and g denotes the average grain size.
In the case of SnO2: Gd 5%-CP, due to the small average crystallite size of ~6 nm and to the operating temperature of 400 °C, a complete grain depletion of free charge carriers can be considered, according to Barsan et al. [31]. The flat band conditions determine the transport of electrons along the surface, whose length is represented by d. Therefore, as d increases, both N and the sensor signal increase similarly. This explains the behaviour observed for SnO2: Gd 5%-CP (Figure 11a). In terms of transients, this is reflected in short response time (~10 s), and recovery time (~6 min), where the response time is the interval required to reach 90% of the equilibrium resistance value after exposure to CH4 and the recovery time is the interval required to return to 90% of the resistance value before exposure to CH4.
In the case of SnO2: Gd 5%-HT, featuring an average crystallite size of ~42 nm, charge exchange chemical interactions take place on the surface of the grains, resulting in the formation of a double potential barrier between adjacent grains [39]. As a result of the applied electric field, the electrons move from one grain to another, leaping over the intergranular barriers. Subsequent interactions induce changes in the surface energetic band-bending, leading to variations in overall electrical conductance (resistance). Using the Schottky approximation, one can write the overall surface band-bending as:
Ngb × qΔVs = −kBT × lnSN
where Ngb is the number of grain boundaries (barriers) = N − 1 ≈ d/g − 1; q is the electron charge; Vs is the band-bending changes; kB is the Boltzmann constant; T is the operating temperature; and SN is the overall sensor signal defined as Rair/RCH4. Thus, the smaller d is, the higher the sensor signal is. In other words, the electrical signal is collected more efficiently with smaller-gap electrodes because barrier-limited conduction lessens its impact on the electrical current. This explains the behaviour of SnO2: Gd 5%-HT (Figure 11b). In terms of transients, this is reflected in longer response times (~40 s) and longer recovery times (~19 min).
The obtained results create the premises for the development of applications, with the miniaturization of the sensor being the future technological objective.

4. Conclusions

The samples SnO2: Gd 5%-CP and SnO2: Gd 5%-HT were obtained by alternative synthesis methods, co-precipitation and hydrothermal growth. XRD patterns corresponded to the SnO2 crystalline phase, with a tetragonal structure. The broadening of the diffraction maxima of sample CP is attributable to the smaller size of the particles.
TEM investigations confirmed the Rietveld refinement analysis of the XRD patterns and highlighted the uniform morphology observed in SnO2: Gd 5%-CP, characterised by quasi-spherical nanoparticles with a consistent distribution of Gd within the SnO2 matrix. In contrast, SnO2: Gd 5%-HT displayed quasi-spherical and elongated nanoparticles, an uneven distribution of Gd within the Sn matrix, and a higher porosity.
Textural analysis associated the reduction in pore size in sample CP with micropore blocking caused by the presence of very small nanoparticles. To highlight the sensitive selectivity, electrical resistance measurements were conducted in the temperature range of 200–450 °C, under conditions of 50% RH, 5000 ppm CO2, and 5000 ppm CH4.
Analysis of the sensor signals indicated a temperature of 400 °C for further investigations at different CH4 concentrations. The distinct exponents observed in the power law dependence explain the more pronounced tendency towards saturation for SnO2: Gd 5%-CP, following Weisz’s limitation. Conversely, for SnO2: Gd 5%-HT, the impact of CH4 is promoted by size, irregular shapes, and porosity of the crystallites.
If the synthesis method does not cause significant changes in the sensor signal, the electrode technology, i.e., the way of reading the sensor signal, does. This was demonstrated using commercial substrates with electrode interdigital gaps of 200 and 100 μm. The different conduction mechanisms, mediated by the crystallite sizes determined by the chemical synthesis method, explained the obvious differences in the sensor signal.

Author Contributions

Methodology, writing—review and editing, C.E.S.; investigation, writing—original draft, C.G.M.; investigation, writing—original draft, A.C.I.; formal analysis, writing—review and editing, I.V.D.; investigation, writing—original draft, D.P.; methodology, writing—original draft, I.D.V.; investigation, validation, O.G.F.; conceptualization, writing—original draft, writing—review and editing, funding acquisition, A.S. All authors have read and agreed to the published version of the manuscript.

Funding

This research was funded by the Ministry of Research, Innovation and Digitization CNCS-UEFISCDI through the project PN-III-P4-PCE-2021-0384 within PNCDI III and the Core Program within the National Research Development and Innovation Plan 2022–2027, carried out with the support of the Ministry of Research, Innovation and Digitization, project no. PC1-PN23080101. The contribution of Catalina G. Mihalcea (C.G.M.) to this work is part of the PhD “Nanostructured materials for gas sensing: correlations between functional, electronic and microstructural properties” supported by CERIC-ERIC.

Institutional Review Board Statement

Not applicable.

Informed Consent Statement

Not applicable.

Data Availability Statement

Data are available on request from the authors.

Conflicts of Interest

The authors declare no conflicts of interest.

References

  1. World Meteorological Organization. Greenhouse Gas Concentrations Hit Record High. Again. Available online: https://wmo.int/news/media-centre/greenhouse-gas-concentrations-hit-record-high-again (accessed on 6 May 2024).
  2. National Oceanic and Atmospheric Administration—NOOA. Topping the Charts: September 2023 was Earth’s Warmest September in 174-Year Record. Available online: https://www.noaa.gov/news/topping-charts-september-2023-was-earths-warmest-september-in-174-year-record (accessed on 6 May 2024).
  3. Chataut, G.; Bhatta, B.; Joshi, D.; Subedi, K.; Kafle, K. Greenhouse gases emission from agricultural soil: A review. J. Agric. Food Res. 2023, 11, 100533. [Google Scholar] [CrossRef]
  4. Ahmed, R.; Liu, G.; Yousaf, B.; Abbas, Q.; Ullah, H.; Ali, M.U. Recent advances in carbon-based renewable adsorbent for selective carbon dioxide capture and separation―A review. J. Clean. Prod. 2020, 242, 118409. [Google Scholar] [CrossRef]
  5. Jatmiko, A.R.; Suryani, E.; Octabriyantiningtyas, D. The Analysis of Greenhouse Gas Emissions Mitigation: A System Thinking Approach (Case Study: East Java). Procedia Comput. Sci. 2019, 161, 951–958. [Google Scholar] [CrossRef]
  6. Dutta, T.; Noushin, T.; Tabassum, S.; Mishra, S.K. Road Map of Semiconductor Metal-Oxide-Based Sensors: A Review. Sensors 2023, 23, 6849. [Google Scholar] [CrossRef] [PubMed]
  7. Shakoor, A.; Shakoor, S.; Rehman, A.; Ashraf, F.; Abdullah, M.; Shahzad, S.M.; Farooq, T.H.; Ashraf, M.; Manzoor, M.A.; Altaf, M.M.; et al. Effect of animal manure, crop type, climate zone, and soil attributes on greenhouse gas emissions from agricultural soils—A global meta-analysis. J. Clean. Prod. 2021, 278, 124019. [Google Scholar] [CrossRef]
  8. Paul, R.; Das, B.; Ghosh, R. Novel approaches towards design of metal oxide based hetero-structures for room temperature gas sensor and its sensing mechanism: A recent progress. J. Alloys Compd. 2023, 941, 168943. [Google Scholar] [CrossRef]
  9. Gautam, Y.K.; Sharma, K.; Tyagi, S.; Ambedkar, A.K.; Chaudhary, M.; Singh, B.P. Nanostructured metal oxide semiconductor-based sensors for greenhouse gas detection: Progress and challenges. R. Soc. Open Sci. 2021, 8, 201324. [Google Scholar] [CrossRef]
  10. Tyagi, S.; Chaudhary, M.; Ambedkar, A.K.; Sharma, K.; Gautam, Y.K.; Singh, B.P. Metal oxide nanomaterial-based sensors for monitoring environmental NO2 and its impact on the plant ecosystem: A review. Sens. Diagn. 2022, 1, 106. [Google Scholar] [CrossRef]
  11. Abdullah, A.N.; Kamarudin, K.; Kamarudin, L.M.; Adom, A.H.; Mamduh, S.M.; Juffry, Z.H.M.; Bennetts, V.H. Correction Model for Metal Oxide Sensor Drift Caused by Ambient Temperature and Humidity. Sensors 2022, 22, 3301. [Google Scholar] [CrossRef]
  12. Xue, D.; Wang, P.; Zhang, Z.; Wang, Y. Enhanced methane sensing property of flower-like SnO2 doped by Pt nanoparticles: A combined experimental and first-principle study. Sens. Actuators B Chem. 2019, 296, 126710. [Google Scholar] [CrossRef]
  13. Shi, J.; Liu, S.; Zhang, P.; Sui, N.; Cao, S.; Zhou, T.; Zhang, T. Sb/Pd co-doped SnO2 nanoparticles for methane detection: Resistance reduction and sensing performance studies. J. Nanotechnol. 2021, 32, 475506. [Google Scholar] [CrossRef] [PubMed]
  14. Hoefer, U.; Kühner, G.; Schweizer, W.; Sulz, G.; Steiner, K. CO and CO2 thin-film SnO2 gas sensors on Si substrates. Sens. Actuators B Chem. 1994, 22, 115–119. [Google Scholar] [CrossRef]
  15. Singh, A.; Yadav, B.C. Photo-responsive highly sensitive CO2 gas sensor based on SnO2@CdO heterostructures with DFT calculations. Surf. Interfaces 2022, 34, 102368. [Google Scholar] [CrossRef]
  16. Kuncser, A.C.; Vlaicu, I.D.; Dinu, I.V.; Simion, C.E.; Iacoban, A.C.; Florea, O.G.; Stanoiu, A. The impact of the synthesis temperature on SnO2 morphology and sensitivity to CO2 under in-field conditions. Mater. Lett. 2022, 325, 132855. [Google Scholar] [CrossRef]
  17. Suzuki, T.; Sackmann, A.; Lauxmann, F.; Berthold, C.; Weimar, U.; Bȃrsan, N. CO2 sensing with gas sensors based on rare-earth compounds: Material exploration. Sens. Actuators B Chem. 2020, 317, 128128. [Google Scholar] [CrossRef]
  18. Ghica, C.; Mihalcea, C.G.; Simion, C.E.; Vlaicu, I.D.; Ghica, D.; Dinu, I.V.; Florea, O.G.; Stanoiu, A. Influence of relative humidity on CO2 interaction mechanism for Gd-doped SnO2 with respect to pure SnO2 and Gd2O3. Sens. Actuators B Chem. 2022, 368, 132130. [Google Scholar] [CrossRef]
  19. Lee, S.P. Electrodes for semiconductor gas sensors. Sensors 2017, 17, 683. [Google Scholar] [CrossRef] [PubMed]
  20. Williams, D.E.; Pratt, K.F.E. Theory of self-diagnostic sensor array devices using gas-sensitive resistors. J. Chem. Soc. Faraday Trans. 1995, 91, 1961–1966. [Google Scholar] [CrossRef]
  21. Shaalan, N.M.; Yamazaki, T.; Kikuta, T. Effect of micro-electrode geometry on NO2 gas-sensing characteristics of one-dimensional tin dioxide nanostructure microsensors. Sens. Actuators B Chem. 2011, 156, 784–790. [Google Scholar] [CrossRef]
  22. Gardner, J.W. Intelligent gas sensing using an integrated sensor pair. Sens. Actuators B Chem. 1995, 27, 261–266. [Google Scholar] [CrossRef]
  23. Tamaki, J.; Miyaji, A.; Makinodan, J.; Ogura, S.; Konishi, S. Effect of micro-gap electrode on detection of dilute NO2 using WO3 thin film microsensors. Sens. Actuators B Chem. 2005, 108, 202–206. [Google Scholar] [CrossRef]
  24. Meng, Z.; Kitagawa, C.; Takahashu, A.; Okochi, Y.; Tamaki, J. WO3 Crystals and Their NO2-Sensing Properties. Sens. Mater. 2009, 21, 259–264. [Google Scholar] [CrossRef]
  25. Cui, H.J.; Shi, J.W.; Yuan, B.; Fu, M.L. Synthesis of porous magnetic ferrite nanowires containing Mn and their application in water treatment. J. Mater. Chem. A 2013, 1, 5902–5907. [Google Scholar] [CrossRef]
  26. Shaikh, S.F.; Mane, R.S.; Min, B.K.; Hwang, Y.J.; Joo, O. D-sorbitol-induced phase control of TiO2 nanoparticles and its application for dye-sensitized solar cells. Sci. Rep. 2016, 6, 20103. [Google Scholar] [CrossRef] [PubMed]
  27. Brunauer, S.; Emmett, P.H.; Teller, E. Adsorption of Gases in Multimolecular Layers. J. Am. Chem. Soc. 1938, 60, 309–319. [Google Scholar] [CrossRef]
  28. Cai, Z.; Kim, K.-K.; Park, S. Room Temperature Detection of NO2 Gas under UV Irradiation Based on Au Nanoparticle-Decorated Porous ZnO Nanowires. J. Mater. Res. Technol. 2020, 9, 16289–16302. [Google Scholar] [CrossRef]
  29. Pandey, M.; Singh, M.; Wasnik, K.; Gupta, S.; Patra, S.; Gupta, P.S.; Pareek, D.; Chaitanya, N.S.N.; Maity, S.; Reddy, A.B.M.; et al. Targeted and Enhanced Antimicrobial Inhibition of Mesoporous ZnO−Ag2O/Ag, ZnO−CuO, and ZnO−SnO2 Composite Nanoparticles. ACS Omega 2021, 6, 31615–31631. [Google Scholar] [CrossRef]
  30. Barsan, N.; Tomescu, A. The temperature dependence of the response of SnO2-based gas sensing layers to O2, CH4 and CO. Sens. Actuators B Chem. 1995, 26, 45–48. [Google Scholar] [CrossRef]
  31. Barsan, N.; Weimar, U. Conduction Model of Metal Oxide Gas Sensors. J. Electroceram. 2001, 7, 143–167. [Google Scholar] [CrossRef]
  32. Jo, J.Y.; Kwon, Y.S.; Lee, J.W.; Park, J.S.; Rho, B.H.; Choi, W.I. Acute respiratory distress due to methane inhalation. Tuberc. Respir. Dis. 2013, 74, 120–123. [Google Scholar] [CrossRef]
  33. Mar, K.A.; Unger, C.; Walderdorff, L.; Butle, T. Beyond CO2 equivalence: The impacts of methane on climate, ecosystems, and health. Environ. Sci. Policy 2022, 134, 127–136. [Google Scholar] [CrossRef]
  34. Sobanaa, M.; Prathiviraj, R.; Selvin, J.; Prathaban, M. A comprehensive review on methane’s dual role: Effects in climate change and potential as a carbon–neutral energy source. Environ. Sci. Pollut. Res. 2024, 31, 10379–10394. [Google Scholar] [CrossRef] [PubMed]
  35. Weisz, P.B. Effects of Electronic Charge Transfer between Adsorbate and Solid on Chemisorption and Catalysis. J. Chem. Phys. 1953, 21, 1531–1538. [Google Scholar] [CrossRef]
  36. Geistlinger, H. Electron theory of thin-film gas sensors. Sens. Actuators B Chem. 1993, 17, 47–60. [Google Scholar] [CrossRef]
  37. Gopel, W. Chemisorption and charge transfer at ionic semiconductor surfaces: Implications in designing gas sensors. Prog. Surf. Sci. 1985, 20, 9–103. [Google Scholar] [CrossRef]
  38. Alcantara, G.P.; Andrade, C.G.M. A short review of gas sensors based on interdigital electrode. In Proceedings of the 12th IEEE International Conference on Electronic Measurement & Instruments, Qingdao, China, 16–18 July 2015. [Google Scholar] [CrossRef]
  39. Barsan, N.; Huebner, M.; Weimar, U. Conduction mechanism in semiconducting metal oxide sensing films: Impact on transduction. Semiconductor Gas Sensors, 2nd ed.; Woodhead Publishing: Sawston, UK, 2020; Chapter 2, pp. 39–69; ISBN 9780081025598. [Google Scholar] [CrossRef]
Figure 1. Gas Mixing System block diagram (a) and details of the substrates and electrode area (b).
Chemosensors 12 00148 g001
Figure 2. XRD patterns of SnO2: Gd 5% powder prepared by co-precipitation (a) and hydrothermal method (b).
Chemosensors 12 00148 g002
Figure 3. Low-magnification TEM images and the SAED patterns obtained for SnO2: Gd 5%-CP (a,b) and SnO2: Gd 5%-HT (c,d) samples.
Chemosensors 12 00148 g003
Figure 4. STEM-EDS map showing the spatial distribution of elements Sn (red) and Gd (green), corresponding to SnO2: Gd 5%-CP (a) and SnO2: Gd 5%-HT (b) samples.
Chemosensors 12 00148 g004
Figure 5. Low-magnification TEM image, where smaller nanoparticles can be observed (a), the corresponding SAED pattern (b), and the STEM-EDS maps (c,d).
Chemosensors 12 00148 g005
Figure 6. Different-magnification HRTEM images, obtained for SnO2: Gd 5%-CP sample (a,b) and SnO2: Gd 5%-HT sample (c,d). The double white lines indicate the (101) and (110) lattice planes.
Chemosensors 12 00148 g006
Figure 7. N2 adsorption/desorption isotherms of SnO2: Gd 5%-CP (a) and SnO2: Gd 5%-HT (b) samples.
Chemosensors 12 00148 g007
Figure 8. The fitting curve of the BET surface area of samples SnO2: Gd 5%-CP (a) and SnO2: Gd 5%-HT (b) samples.
Chemosensors 12 00148 g008
Figure 9. Comparative sensor signals to RH, CO2, and CH4 at different operating temperatures for SnO2: Gd 5%-CP- (a,c) and SnO2: Gd 5%-HT-based (b,d) sensors obtained using substrates with an interdigital electrode gap of 200 μm.
Chemosensors 12 00148 g009
Figure 10. Sensor signal dependence for 0–5000 ppm CH4 and 0–50% RH for SnO2: Gd 5%-CP- (a) and SnO2: Gd 5%-HT-based (b) sensors.
Chemosensors 12 00148 g010
Figure 11. The influence of the electrode interdigital gap on the sensor signal for CH4 for SnO2: Gd 5%-CP- (a) and SnO2: Gd 5%-HT-based (b) sensors.
Chemosensors 12 00148 g011
Table 1. Comparison of various MOS-based gas sensors towards GHGs.
Sensing MaterialSensor SignalTarget GasRelative HumidityTemperature
°C
Reference
Pt/SnO23.6CH4Absent100[12]
Sb/Pd/SnO25/1.2CH4/CO2Absent280[13]
Ca/Pt/SnO21.02CO2Present270[14]
SnO2@CdO10.67CO2Absent30[15]
SnO22.48CO2Present200[16]
Table 2. Lattice parameters and crystallite size—Rietveld refinement analysis.
Crystallographic Parameters/Samplea = bcdhkl (nm)
SnO2: Gd 5%-CP4.7304 ± 0.00183.2338 ± 0.00203.63 ± 0.03
SnO2: Gd 5%-HT4.7457 ± 0.00013.1813 ± 0.000141.38 ± 0.34
Table 3. BET surface area, total volumes, average, and BJH pore size.
SampleBET Surface Area (m2/g)Total Pore Volume (cm3/g)Average Pore Diameter (nm)BJH Pore Diameter (nm)
SnO2: Gd 5%-CP91.320.2510.938.35
SnO2: Gd 5%-HT12.480.05818.5313.25
Table 4. Comparison of SnO2: Gd 5%-based sensors towards CH4 relative to CO2 for in-field conditions.
Sensing Material/Electrode GapSensor SignalTarget GasRelative HumidityTemperature
SnO2: Gd 5%-CP/200 μm3.01/1.14CH4/CO250%400 °C
SnO2: Gd 5%-CP/100 μm2.37/1.05
SnO2: Gd 5%-HT/200 μm3.39/1
SnO2: Gd 5%-HT/100 μm4.75/1.5
Disclaimer/Publisher’s Note: The statements, opinions and data contained in all publications are solely those of the individual author(s) and contributor(s) and not of MDPI and/or the editor(s). MDPI and/or the editor(s) disclaim responsibility for any injury to people or property resulting from any ideas, methods, instructions or products referred to in the content.

