Article

A Diagnostic Case Study for Manufacturing Gas-Phase Chemical Sensors

by
Raquel Pimentel Contreras
1,2,
Dylan T. Koch
2,3,
Patrick Gibson
1,2,
Mitchell M. McCartney
1,2,4,
Bradley S. Chew
1,2,
Pranay Chakraborty
1,2,
Daniel A. Chevy
2,3,
Reid Honeycutt
1,2,
Joseph Haun
2,3,
Thomas Griffin
2,3,
Tristan L. Hicks
1,2 and
Cristina E. Davis
1,2,4,*
1
Department of Mechanical and Aerospace Engineering, University of California Davis, Davis, CA 95616, USA
2
UC Davis Lung Center, One Shields Avenue, Davis, CA 95616, USA
3
Department of Electrical Engineering, University of California Davis, Davis, CA 95616, USA
4
VA Northern California Health Care System, 10535 Hospital Way, Mather, CA 95655, USA
*
Author to whom correspondence should be addressed.
Chemosensors 2024, 12(8), 155; https://doi.org/10.3390/chemosensors12080155
Submission received: 19 June 2024 / Revised: 24 July 2024 / Accepted: 30 July 2024 / Published: 7 August 2024

Abstract

:
In this work, we describe the design, manufacturing development, and refinement of a chemical detection platform designed to identify specific odorants in the natural gas industry. As the demand for reliable and sensitive volatile organic compound (VOC) detection systems is growing, our project aimed to construct multiple prototypes to enhance our detection capabilities and provide portable detection platforms. Throughout the development process across nominally identical and duplicated instruments, various failure modes were encountered, which provided insight into the design and manufacturing challenges present when designing such platforms. We conducted a post hoc root cause analysis for each failure mode, leading to a series of design modifications and solutions. This paper details these design and manufacturing challenges, the analytical methods used to diagnose and address them, and the resulting improvements in system performance. In the end, a debugging flow chart is presented to aid future researchers in solving the possible issues that could be encountered. Our findings show the complexities of bespoke chemical sensor design for unique applications and highlight the critical importance of iterative testing and problem-solving in the development of industrial detection technologies. Achieving consistency across devices is essential for optimizing device-to-device efficiency. The work presented is the first step towards ensuring uniform performance across a production run of chemically sensitive devices. In the future, a universal device calibration model will be implemented, eliminating the need to collect data from each individual device.

1. Introduction

Recent advancements in portable volatile organic compound (VOC) detectors have, based on gas chromatography (GC) and/or differential mobility spectrometry (DMS) technologies, led to the development of numerous applications, ranging from the detection of pollutants in ambient air to monitoring biomarkers in clinical settings [1,2,3,4]. Chemical sensing varies across different fields: environmental monitoring focuses on pollutant detection [5,6], clinical applications often involve health-related biomarkers [3,7], and its industrial uses can include quality control manufacturing processes [4,8]. For instance, Fabianowski et al. [1] demonstrated the detection and identification of VOCs using differential mobility spectrometry (DMS), while Fraustro-Vicencio et al. [2] characterized the performance of a compact gas chromatograph–photoionization detector (GC-PID) in the near-real-time analysis and field deployment of benzene, toluene ethylbenzene, and xylene (BTEX) compounds. Gunter et al. [3] explored breath sensors for health monitoring, and Camara et al. [4] detected and quantified natural contaminants in wine using gas chromatography–differential mobility spectrometry (GC-DMS). Other chemical sensing technologies have also been used in environmental monitoring. Metal oxide sensors are often chosen for their sensitivity and accuracy. However, they typically suffer from low selectivity and are limited by the operating temperature range, humidity variations, and their recovery time, as noted by Tereshkov et al. [9]. To address some of these limitations, Li et al. [10] developed a novel NH3 sensor using Pd-decorated ZnO hexagonal microdiscs, showcasing its enhanced sensitivity and selectivity in ammonia detection. NonNDIR detectors are frequently used to sense trace pollutants in gas mixtures but have historically had limitations with sensitivity and cross-interference. Zhang et al. [11] developed a high-sensitivity ethylene gas sensor that addressed sensitivity limitations, with a limit of detection as low as 1 ppm as compared to the 25 to 34 ppm of previous non-dispersive infrared (NDIR) sensors. Xu et al. [12] introduced a multi-gas detection system based on NDIR spectral technology, which provided an effective method for detecting multiple gasses simultaneously and demonstrated good resistance to cross-interference. Previously, our group developed a prototype portable VOC detector designed for enhanced sensitivity and selectivity based on GC-DMS technologies [13]. Building upon that prototype design, we are constructing a fleet of VOC-sensitive devices capable of field deployment and a quality assessment (QA)/quality control (QC) process to accompany this work. At present, this work addresses the first steps to establishing uniformity across production devices by establishing a standardized test and evaluation (T&E) methodology for chemical sensors.
Despite the growing applications of these categories of devices [5,8], the literature remains limited on methodologies for troubleshooting and enhancing chemical sensor system reliability during their manufacturing and assembly. There is little guidance on how to systematically compare the performance of multiple seemingly identical copies of the same chemical sensor device. Studies typically focus on the development and demonstration of a single prototype, leaving a gap in the knowledge regarding the mass production and quality assurance of such devices [6,7]. The integration of complex systems, with many components and sub-systems required for them to function, can be difficult to execute. Building upon the foundation of our earlier work led by Fung et al. [13], this work explores the challenges of scaling from a single prototype to multiple operational units. We present a comprehensive test and evaluation (T&E) approach to the quality assessment/quality control (QA/QC) processes essential for ensuring consistent device performance. Five VOC sensor units were constructed, with component performance and integrated device performance verified along the way. Our objective is to provide a replicable process that can aid researchers and developers in enhancing the reliability and reproducibility of portable chemical detection technologies.

2. Materials and Methods

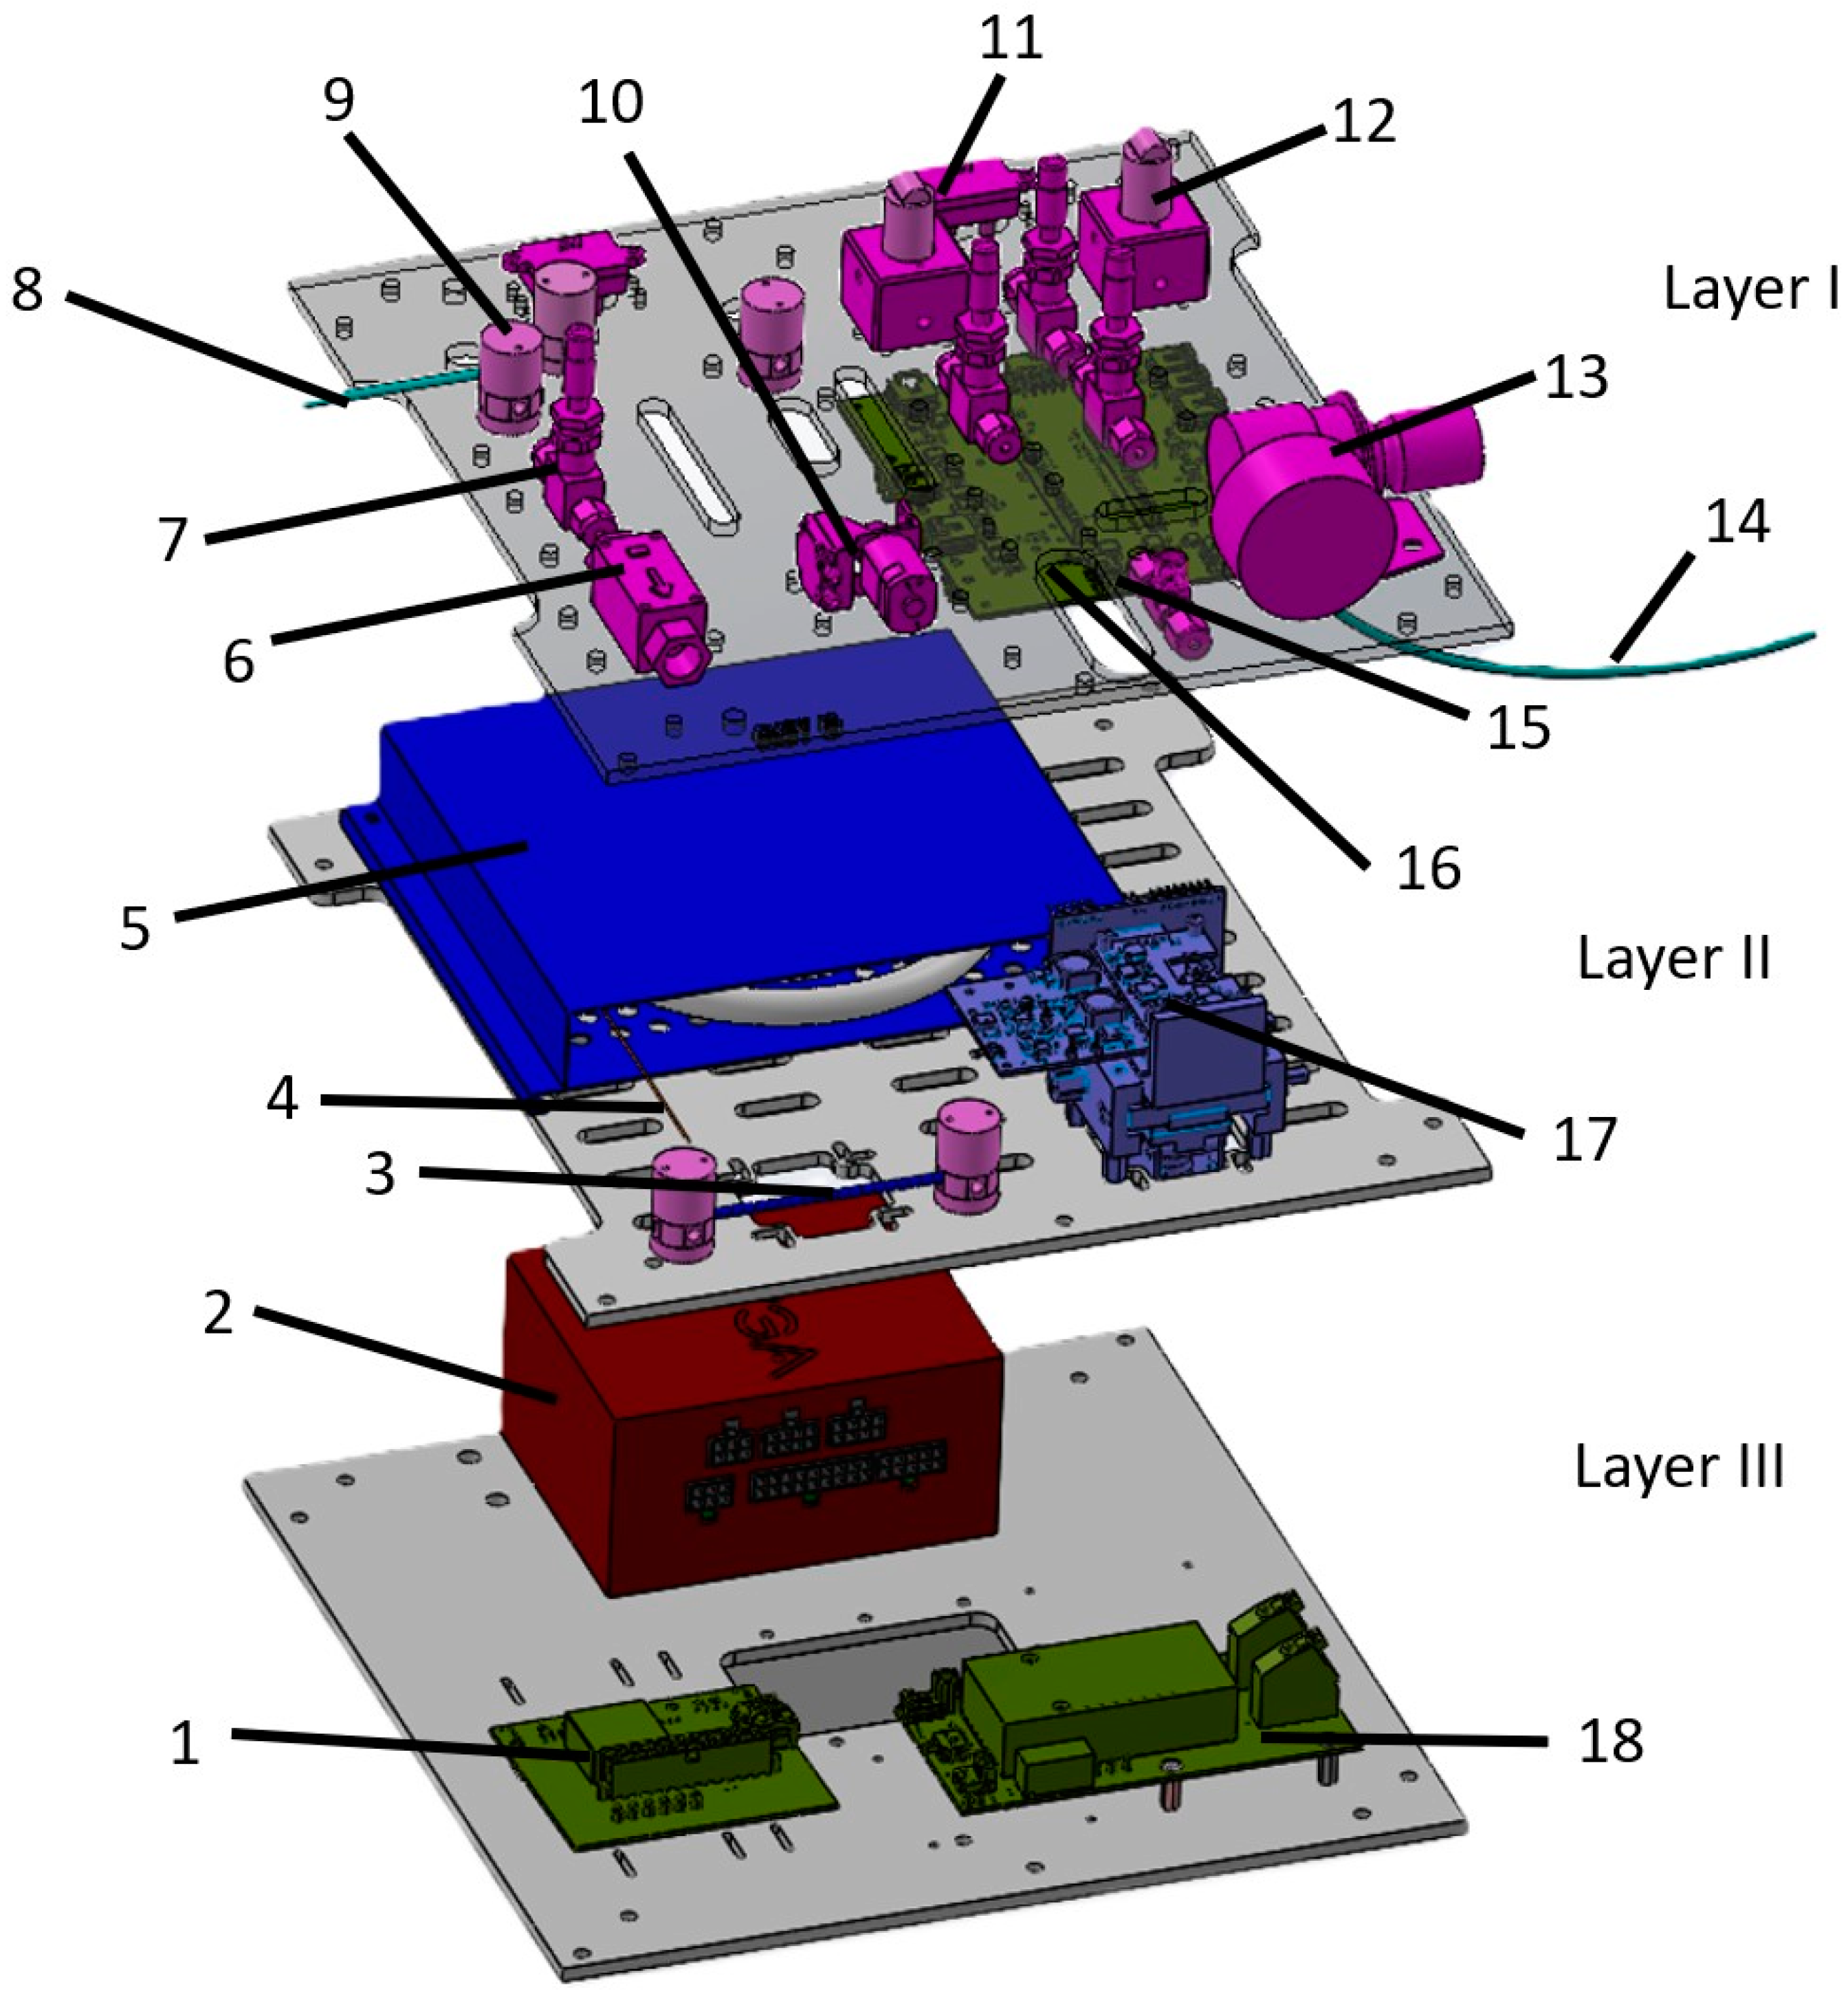
2.1. System Overview of the Device

Our group previously reported a single prototype of a chemical detection platform for natural gas odorants [13]. Similarly, the device reported in this study can be broken down into three major sub-sections: the flow system, the detection system, and the electronics. The flow system consists of pressure regulators (McMaster, Trenton, NJ, USA, 6763K81)—Figure 1, number 13; proportional valves (Norgren, Delaware, CO, USA, D170.0004)—Figure 1, number 12; needle valves (Swagelok, Solon, OH, USA, SS-SS2)—Figure 1, number 7; flow sensors (Honeywell, Charlotte, NC, USA, HAFBLF0750C4AX5, HAFBLF0050CAAX5, and OMRON, D6F-01N2-000)—Figure 1, numbers 6 and 11; and 3-way valves (Clippard, Cincinnati, OH, USA, NR1-3M-12)—Figure 1, number 9. These work together to regulate flows as necessary to sweep chemicals through the various stages of chemical analysis. The detection system consists of a sorbent trap, GC Column (Agilent, Santa Clara, CA, USA, 123-1334LTM) (Figure 1, number 5), and a differential mobility spectrometer detector (Figure 1, number 17). While the GC column is commercially available, the sorbent trap (Figure 1, number 3) and detector are custom components manufactured at UC Davis and detailed in our prior publication [13]. The electronics consist of main power electronics (Figure 1, number 1), main control electronics with an Arduino-based Teensy 3.6 microcontroller (Figure 1, number 16), an ionization power board (Figure 1, number 18), and the device power supply (Figure 1, number 2).
Between iterations, significant modifications were made to the device, improving its functionality. Principally, the gas-flow controlled system for this iteration was significantly overhauled to improve performance. Long-term validation revealed that the mechatronic actuators and sensors responsible for metering a precisely controlled volumetric flow rate were inadequately specified for this task. A traditional mechanical valve was installed in place of the digitally controlled flow system for greater reliability and tunability at low flow rates. In brief, the odorant sensor is a portable platform used to measure odorants from natural gas samples. The device can be connected directly to a pressurized natural gas line, or the sample can be introduced via a sampling canister like Tedlar bags.
Sample analysis is performed in three stages. A sorbent trap, custom-made by the UC Davis team to extract odorants from natural gas; a gas chromatography (GC) column, which separates the odorant species so they can be measured individually; and the differential mobility spectrometer (DMS), which measures the odorants’ abundance. The device measures six chemicals commonly used as natural gas odorants: Tetrahydrothiophene (THT), Isopropyl Mercaptan (IPM), N-Propyl Mercaptan (NPM), Tert-Butyl Mercaptan (TBM), Ethanethiol (ETM), and Dimethyl Sulfide (DMS-odorant). The test was processed with our laboratory AnalyzeIMS or “AIMS” Software Version 1.4 [14,15,16], which converts detector data into a concentration of each mercaptan.

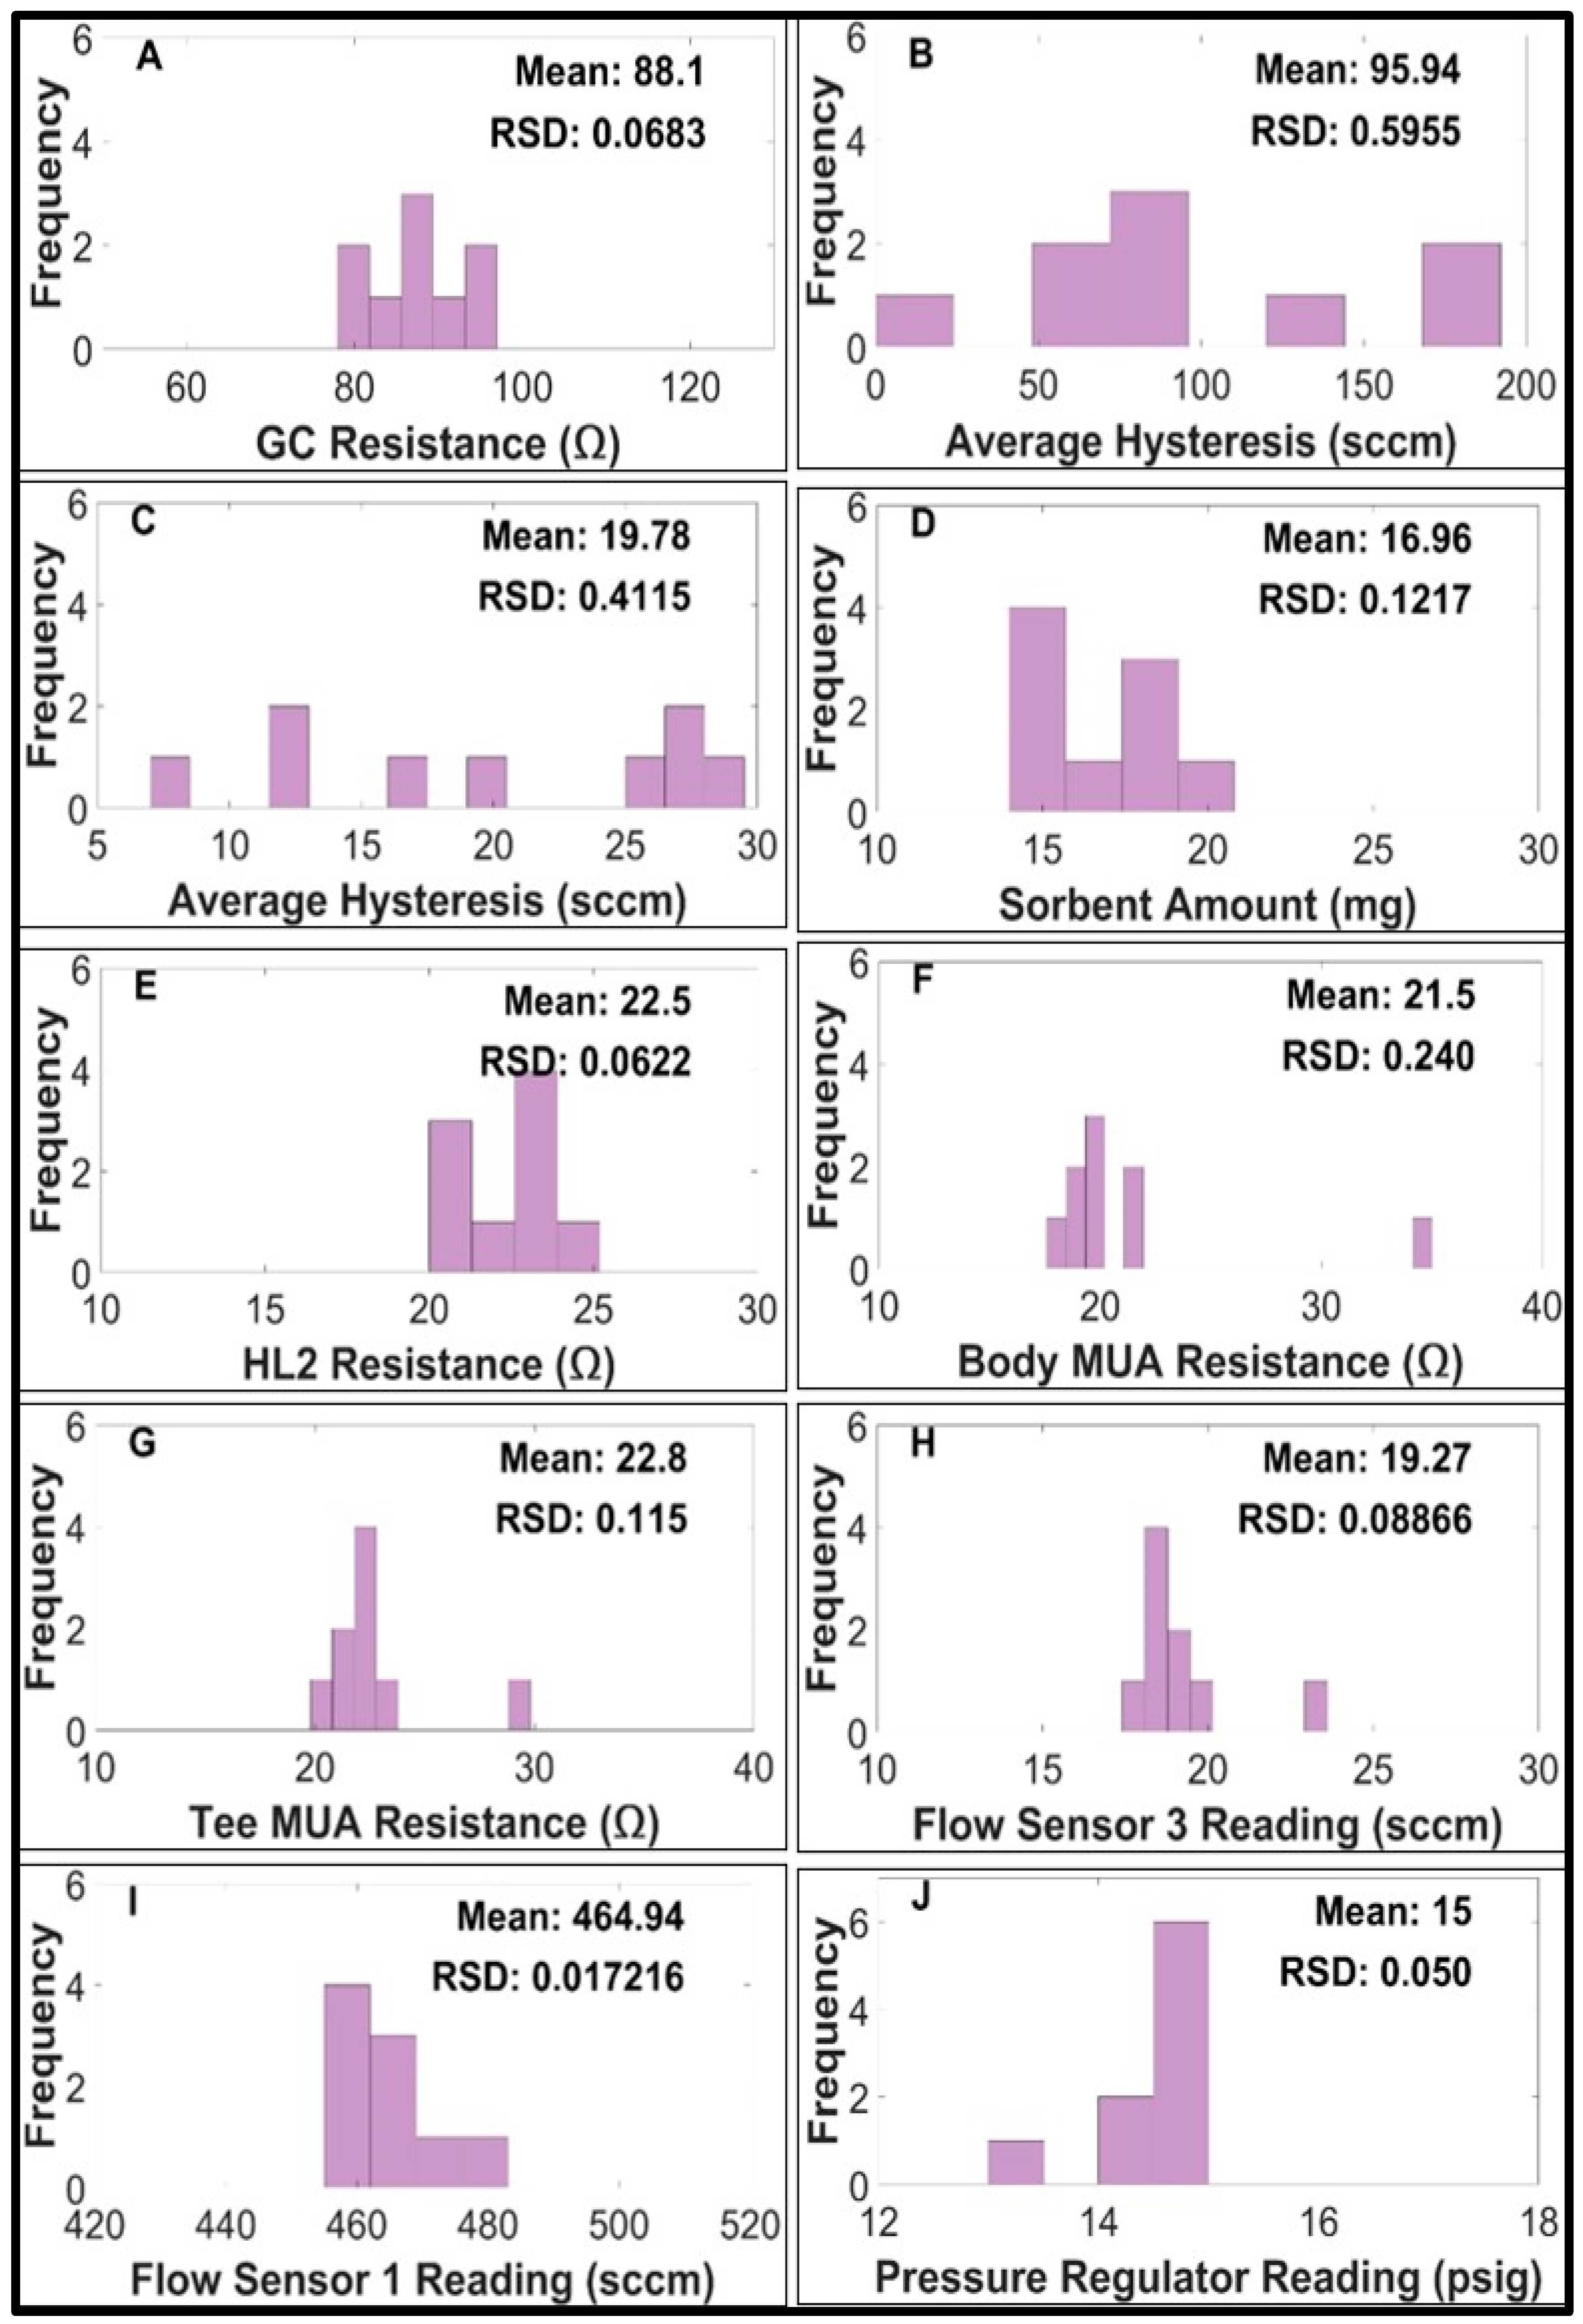
2.2. Case Presentation—Device Components

We present an overview of the device’s components and report component-level performance data prior to device sub-system assembly. In the following section, we demonstrate the experimental result errors observed during the assembly of five units and detail our troubleshooting approach. In total, five units were constructed and had full component-level testing. A system-level layout of the chemical sensor system is shown (Figure 1).
The odorants collected in the sample need to be directed through various sub-systems within the device for analysis. Transportation of the analytes to these stages is controlled by the flow system, consisting of the previously detailed individual components, which generates and controls a flow of nitrogen carrier gas, working in unison to regulate flows as necessary to direct the odorants through the analysis pathway [13].
To minimize the performance variation among devices, individual components of the flow system were subjected to the testing of both their electrical and mechanical properties to meet the acceptance criteria prior to device assembly. Every component was externally verified for each of the five units prior to installation. A completed device was connected to a nitrogen cylinder as the main carrier gas to route odorants through the system for their chemical analysis. The parameters and components we measured as acceptance criteria are summarized in Figure 2, and their locations can be mapped to the system-level layout presented earlier (Figure 1).

2.2.1. Performance of the Gas Chromatography Columns

The GC column (Agilent, 123-1334LTM) is a 30 m coiled fused silica tubing, which has an inner diameter of 0.32 mm. The inside of the tubing is coated with a sorbent material that separates odorants [13]. Odorants elute from the column at different times depending on their chemical and physical properties and their interactions with the lining of the column. The nitrogen flow through the GC column is controlled between 1.5 and 3.0 sccm. The chromatography analysis method developed specifies that the column remains at 40 °C for 1000 s, in which time IPM, NPM, TBM, DMS-odorant, and ETM elute from the column and into the differential mobility spectrometer for detection. After 1000 s, the column is heated to 160 °C so that THT can elute and be detected.
Each GC column includes a resistance temperature detector (RTD) installed by the manufacturer (Agilent) to provide heater control feedback. To reach maximum temperature control accuracy, the RTD is calibrated by placing the column in an oven, raising the temperature from 30 to 110 °C, and measuring the corresponding RTD resistance at set intervals. A linear regression analysis is then performed to generate a calibration slope and intercept for the given GC column. All nine GC columns were calibrated, and then their resistances were calibrated at a temperature of 40 °C (Figure 2A), since this is the temperature used to elute the first five odorants during the chemical detection process. The GC columns used in these devices did not introduce variations in retention times with small changes in the RTD controls.

2.2.2. Proportional Valves

The performance of the proportional valves (Figure 1, number 12) was quantified by varying their commanded duty cycle (between 0 and 4095 bits, from fully shut to fully open) using software in the microcontroller and then measuring the resulting system flow using both an external mass flow controller (APEX, AX-MC-500SCCM-D/GAS-N2,5M,5IN) and internal flow sensors. When testing the proportional control valves, it was found they have a significant amount of hysteresis, resulting in the feedback control system needing to make large, commanded changes to control the flow when moving from increasing to decreasing flow rates. In brief, the system was performing inconsistently due to a combination of sensors and high hysteresis coming from the proportional valves. The proportional valves were introducing a lot of variation into the devices and eventually were not used any more.

2.2.3. Sorbent Trap

The sorbent traps (Figure 1, number 3) are custom-made, as described earlier in the paper [13], and comprise silica gel sorbent packed inside a metal tubing coated in SilicoNert to avoid the degradation of the odorants during analysis. The trap is held at a constant 35 °C while adsorbing the sample and then is rapidly increased in temperature to 180 °C, expelling the trapped chemicals, while the nitrogen carrier gas sweeps them into the gas chromatography column. The trap temperature is then set to 35 °C for the rest of the chemical detection process. Due to the hand-built manufacturing process, individual traps were found to contain between 15.00 and 20.00 mg of sorbent. The decision to use 15.00–20.00 mg of sorbent in the traps was made following the industry standards for mobile detection platforms and field applications. This amount of sorbent ensures consistent operation and reliable performance. Additionally, the construction process focuses on maintaining uniformity across all traps to enhance reproducibility. Similar to the precision found in Chromatotec’s odorization monitoring devices for natural gasses, biogas, and Liquefied Petroleum Gas (LPG), this approach emphasizes the importance of accuracy and reliability in chemical detection [17].

2.2.4. Heated Transfer Lines

The device contains several transfer lines that use the gas flow to direct odorants to different stages of analysis. The lines must be heated during analysis to avoid creating locations in the system where low temperatures can result in the accumulation of chemical to the walls of the tube, resulting in a decrease in signal during the analysis and a contamination of the signal in later runs. This is achieved by wrapping heating wire over the outer diameter of a stainless steel tube, which is insulated with shrink tubing, and installing a thermocouple near the outer surface of the tubing as feedback to a thermal controller to regulate the temperature. Each heated wire was individually measured to have the resistance (25 Ω +/− 5 Ω) needed to reach the desired temperatures. All heated lines remain at a constant 100 °C during the entire chemical flow and detection process. Each heated line is tested using a temperature controller to ensure they reach the desired temperatures in a 20 s window during device start-up. The variation of the heater resistances is shown in Figure 2E–G.

2.2.5. Flow Sensors

The flow sensors (Figure 2H,I) were tested using a high-accuracy external mass flow controller (APEX, AX-MC-500SCCM-D/GAS-N2,5M,5IN). The purpose of this test was to verify that the flow sensors accurately measure flow rates, which are crucial to overall device performance. A specified flow rate was set, and the device’s internal flow sensor reading was compared to the reading given by the external high-accuracy flow meter. The flow sensors had varying levels of accuracy, which resulted in inaccurate and varying flows throughout the system. The level of error for the sensor flow readings vs. the actual flow rate can impact the performance and repeatability of the device, as the flow sensor provides feedback to the flow control system, which uses the proportional valves as the flow control actuators. These sensors introduce variability not only among devices but also among measurements from the same device. Each sensor yielded different readings for the same flow rate. The inaccuracy of flow sensor 1 (Figure 1, number 11), which reads the makeup flow, had a minor effect on the variation of the detector signal’s amplitude because it was only 20–30 sccm. However, the inaccuracy of the desorption line flow sensor had a significant impact on the desorption flow as it was from 1 to 5 sccm, causing retention times to shift if the flows were not consistent.

2.2.6. Pressure Regulator

The mercaptan analyzer uses nitrogen as a carrier gas to drive odorants through the different stages of chemical analysis. Nitrogen enters the device through a pressure regulator (Figure 2J) to ensure that the device is not over- or under-pressurized. The pressure regulator is tested by fluctuating the pressure output from the nitrogen cylinder and ensuring that the pressure in the device’s regulator remains a constant 24 psig even when the pressure in the cylinder’s regulator is greater. The set value of the pressure regulator was then increased to 38 psig to achieve the flow rates necessary for the chemical detection of odorants. In Figure 2J, it can be observed that there is little variation in pressure with 15 psig going into the system when comparing 9 of the devices. The pressure varied from 13 to 15 psig, with 6 out 9 devices reading a perfect 15 psig. It is not believed that this component of the device introduced variation.

2.2.7. Ionization Source

Ionization is a critical step in the measurement of chemical analytes by the DMS detector chip. Briefly, ionization sources provide an electrical charge to mercaptan species prior to entering the DMS detector. As the odorant passes through the DMS detector, the charged particle has an electrical interaction with the detector pad, which results in a measurable signal that the detector records.
UV bulbs are commercially available and provide adequate ionization for the odorants used in this project. We sourced a high-output 10.6 eV UV bulb (Analytical West, Lebanon, PA, USA, 510108-1061). UV bulbs have a maximum lifetime and require periodic replacement. All instruments used in this study had UV sources that were below the initial threshold of their manufacturer-published lifetime usage hours. Their lifetime varies by manufacturer, but typically lasts between 10,000 and 40,000 h of use. The mercaptan analyzer software v1.0 logs how long the device’s UV bulb is on for to allow for replacement as necessary. As of now, this part of the platform has not introduced variation, but, as per the manufacturer, over longer durations of use, it could affect signal intensity as it loses its ability to ionize chemicals due to the decreasing intensity of its UV photons.

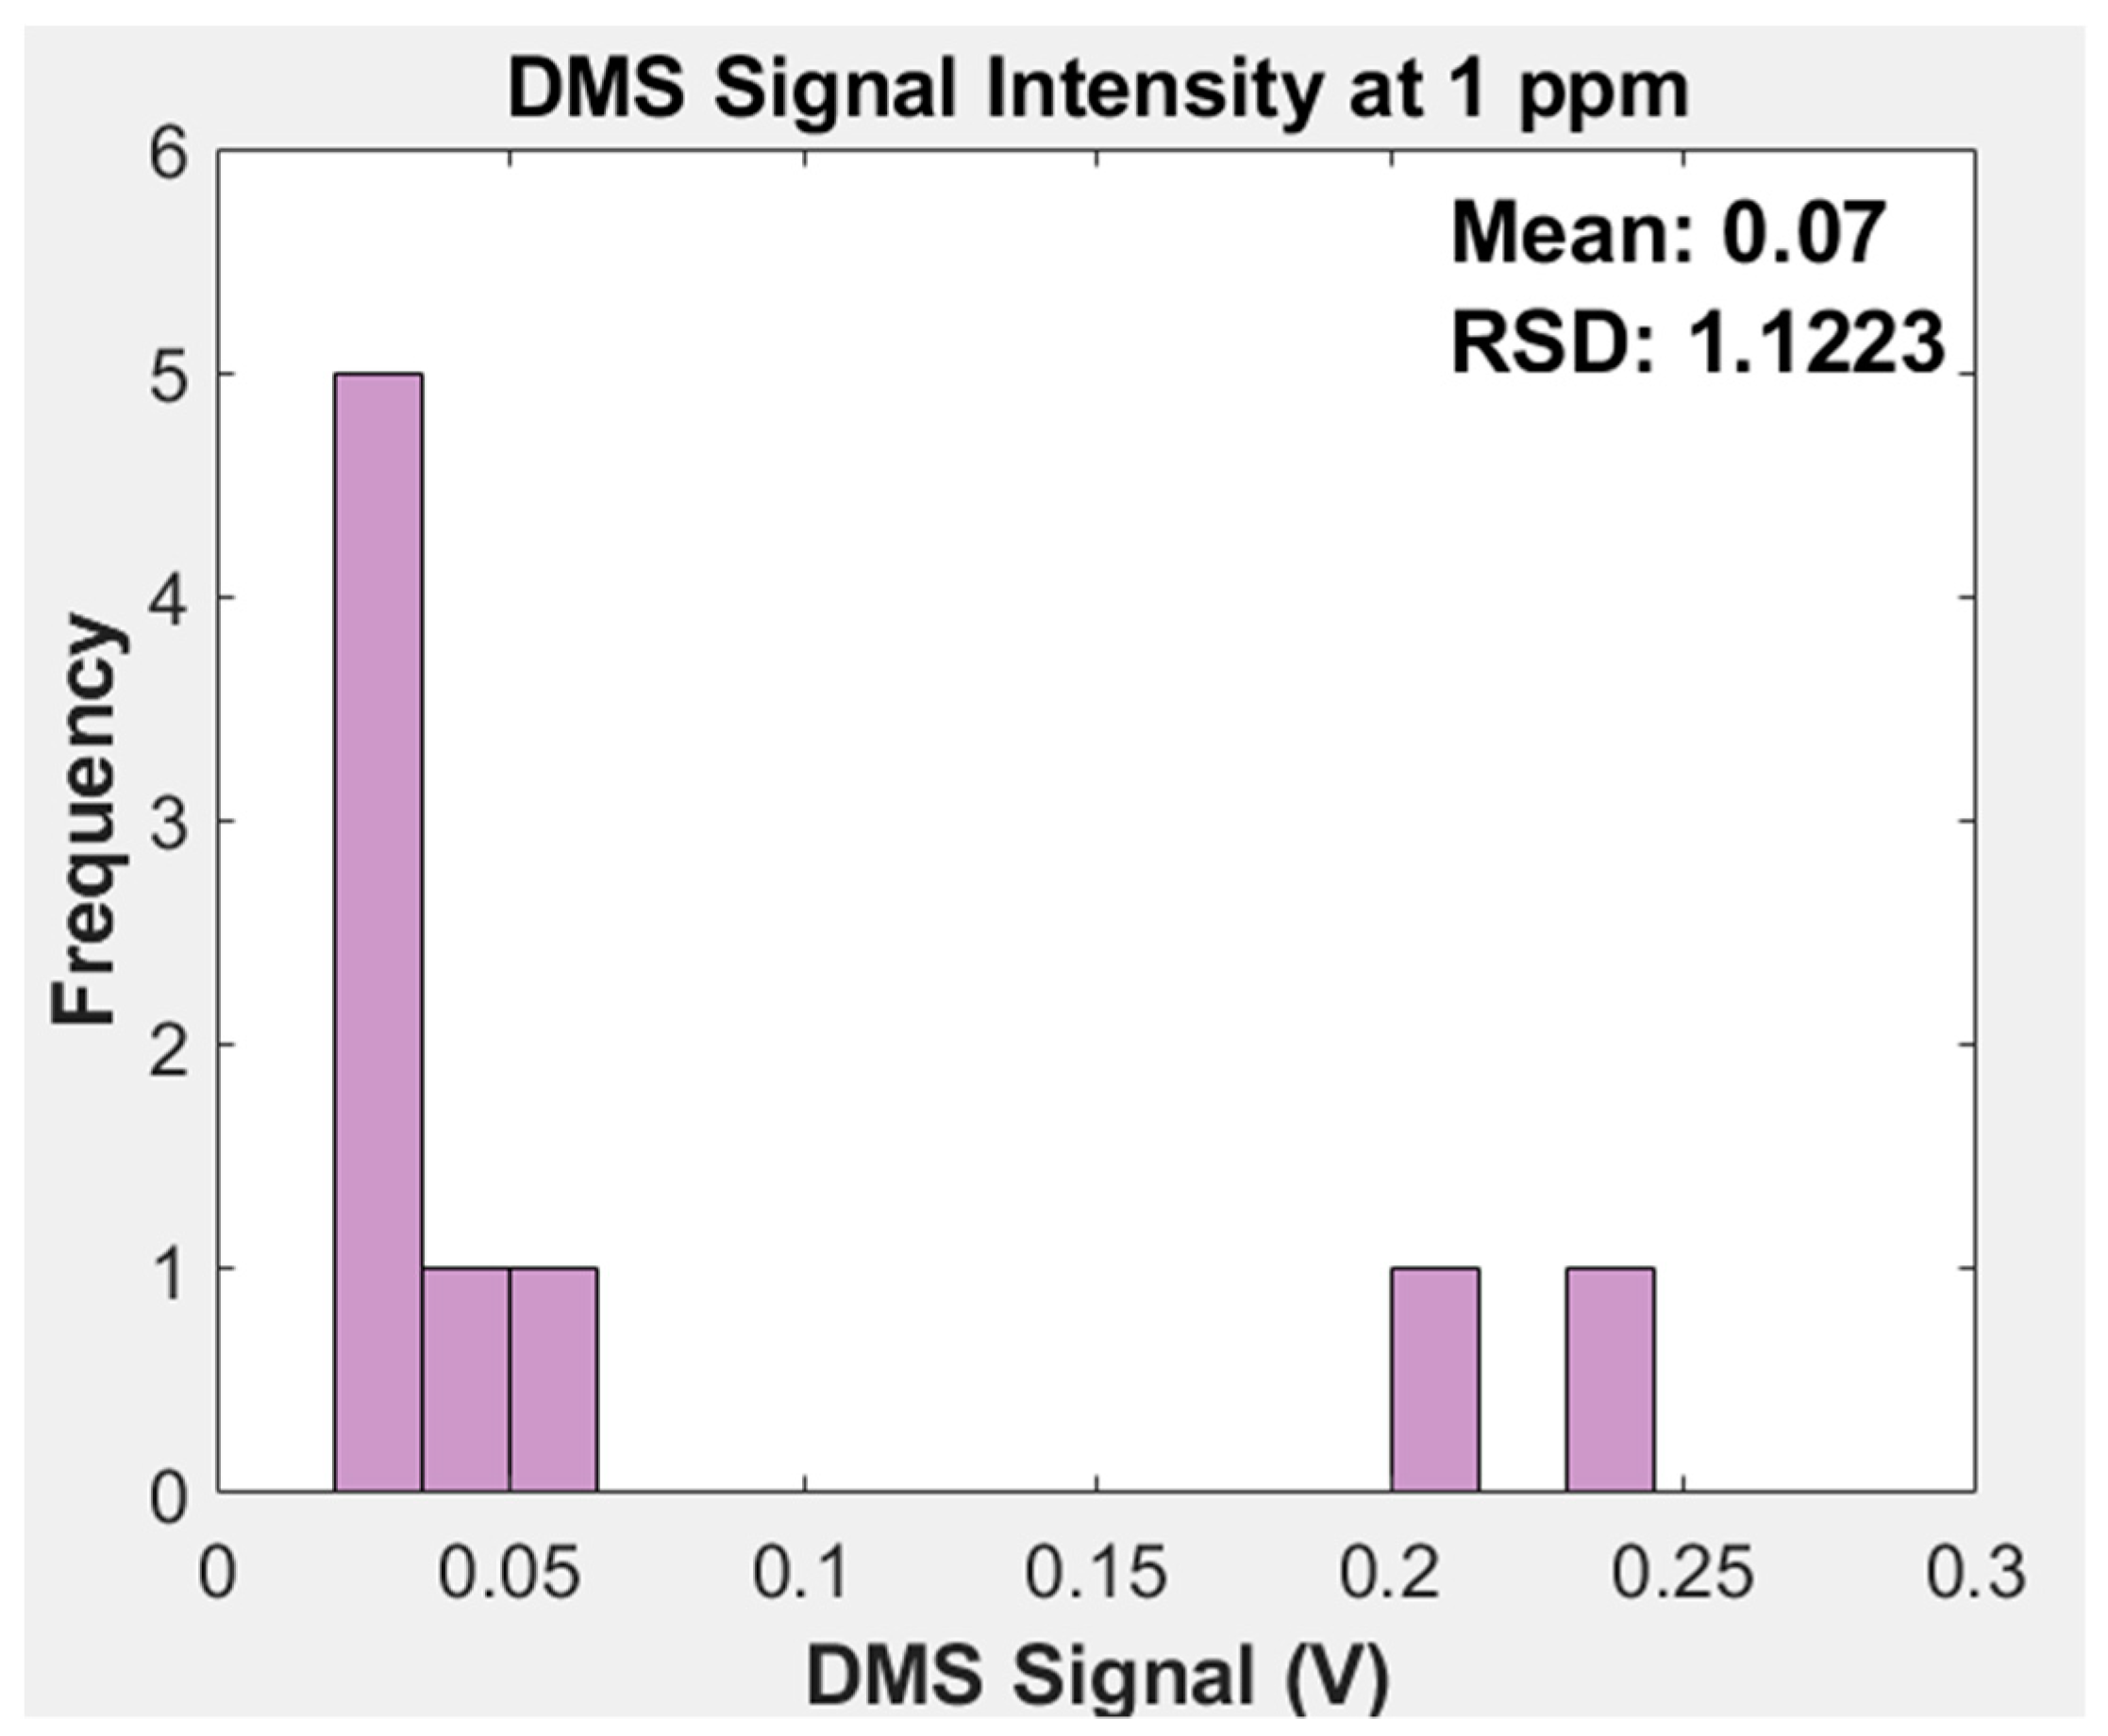
2.2.8. Differential Mobility Spectrometer

The differential mobility spectrometer (DMS) can provide an additional separation of chemical species based on the mobility of their molecules in varying electrical fields, which are generated with an AC separation voltage biased by a DC compensation voltage. However, the AC component of separation was set to 0 V, as the GC column provided adequate separation, and no AC voltage yielded the maximum detector signal. Finally, the DMS chip includes a detector pad and electronics to attract the charged ions and convert the resulting flow of electrical current into a sensed voltage, which can then be translated into a mercaptan concentration by the AIMS software. The detailed working principles of the DMS can be found in several pioneering works by Buryakov et al. and Miller et al. [5,18].
The differential mobility spectrometer (DMS) is assembled into its fixture and tested prior to installation. For verification, a sample of THT mercaptan at 1000 ppm was prepared in a Tedlar bag. The DMS was then connected to a LabView data acquisition system, which controls electrode voltages and reads the detector’s electronics. Then, a heated metal tee was connected to the DMS’s inlet to mix nitrogen and THT, replicating the makeup adapter in the chemical detection platform. THT, at a concentration of 1000 ppm, was injected, using a syringe pump (KD Scientific, Holliston, MA, USA, 789100A), along the flow path at a rate of 12 mL/min, to then be mixed with nitrogen coming into the tee at a 90-degree angle at 500 sccm. Mixing the nitrogen and the THT at these rates resulted in a final concentration of 1 ppm when the analyte reaches the detector pad in the DMS. This setup is presented in Supplemental Figure S2.
When there is no sample going through the DMS other than nitrogen carrier gas, the detector electronics provide a signal baseline of 2.50 V. To determine if the DMS is functioning properly, with adequate sensitivity, we expect a voltage drop from this baseline of 0.15–0.20 V when THT mercaptan is introduced and the ionized THT molecules begin impacting the detector pad. Once it was determined that the DMS had adequate sensitivity, data were recorded for 3 min while the THT–nitrogen mixture was pumped into the DMS continuously. This process was repeated three times to ensure repeatability.
Each DMS device consists of an interface board, main board stack, a chip with a flow path and electrodes, and an ionization UV bulb. The detector board was the source of variation as to whether the DMS device would produce a signal, and, if so, what the signal/concentration gain would be. The 50 GΩ gain resistor (Mouser, Mansfield, TX, USA, 279-RH73X2A50GNTN), which was part of the Op-amp-based current/voltage conversion on the detector board for the DMS, had a +/−30% error, which meant it had a resistance range of 35–65 Ω. If the resistance were to be in the lower end of the range, the signal would be much lower, while if the resistance were to fall in the higher end, it would result in a higher signal.
Figure 3 depicts the range of signal intensities observed when testing DMS units. The data points in the figure represent different DMS units with unique hardware components: a different UV ionization source, chip, fixture, and electronics board. No DMS device that we produced was identical when converting analyte concentration to signal intensity. Despite the fact that the individual parts were purchased from the same commercial manufacturers and the circuit boards were assembled by professional suppliers, the overall complexity of the DMS resulted in an unanticipated variation in DMS performance. Many combinations of components produced no measurable signal. We determined that the signal output must be at least 0.02 volts at a 1 ppm concentration for the DMS to pass this quality check. A DMS reading less than 0.02 volts when installed into the device would not detect any of the odorants.

3. Results

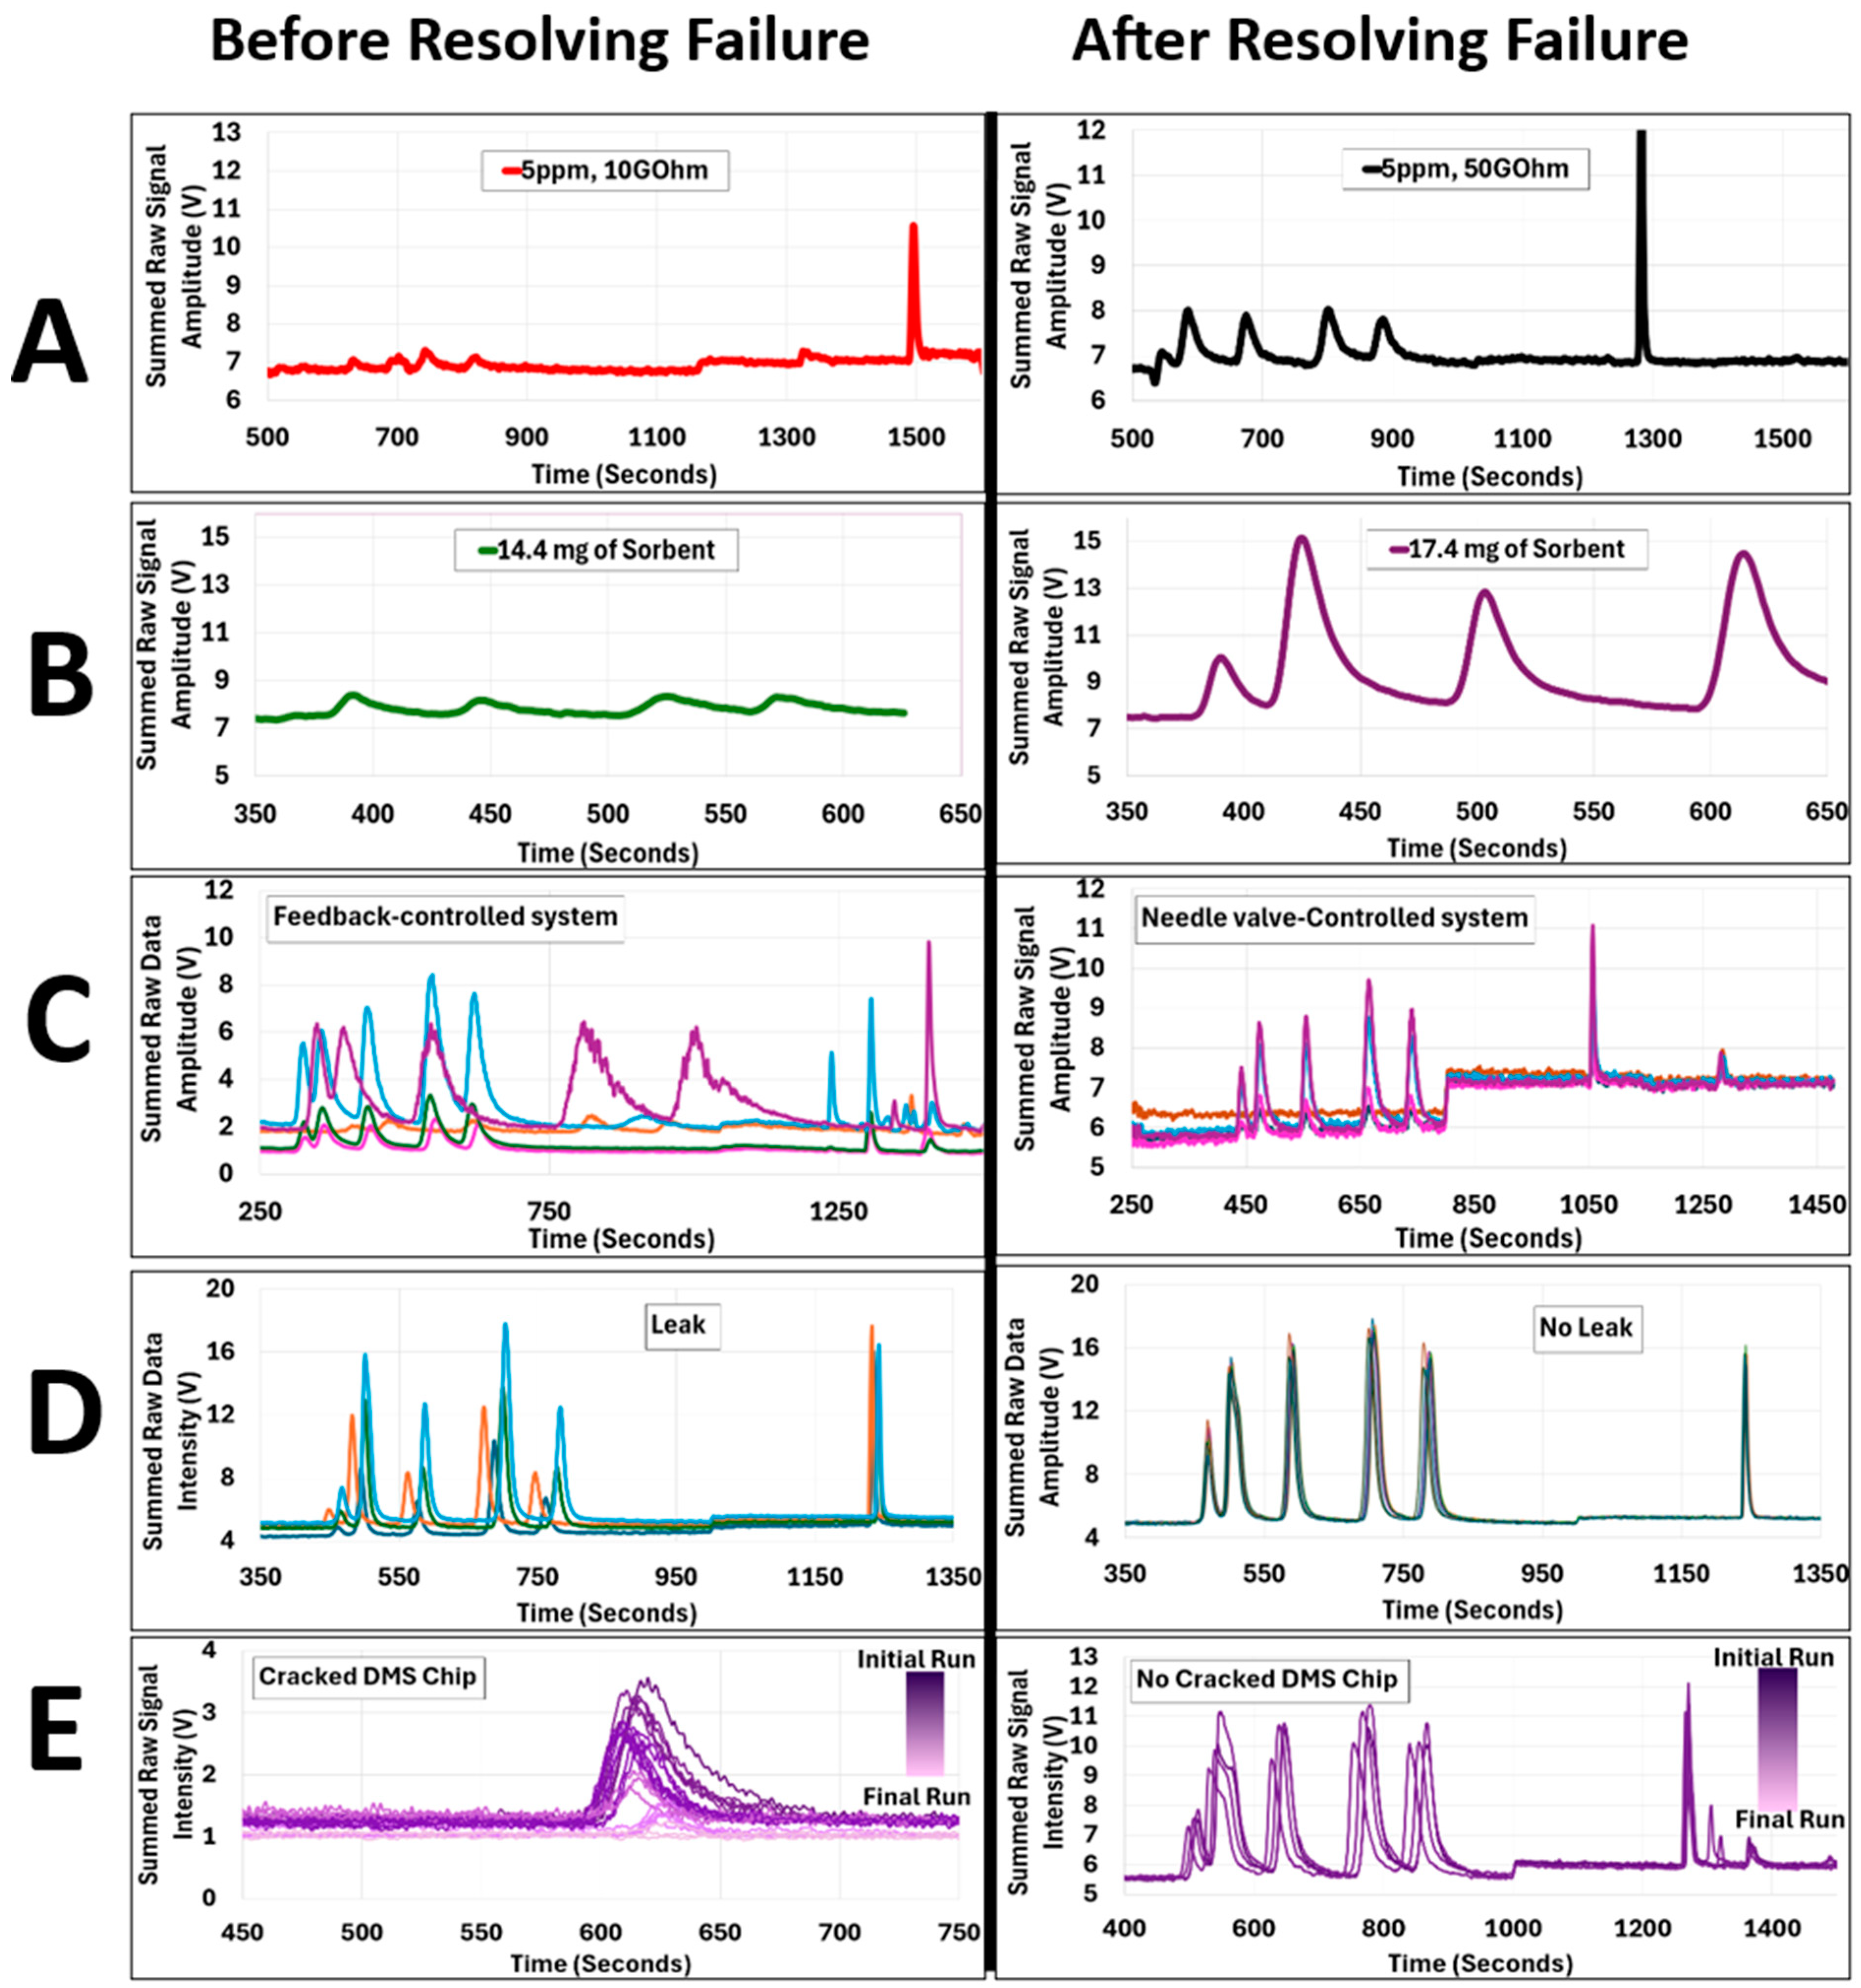
3.1. Device Failure Modes

While in Section 2.2 we described component-level testing prior to device assembly, this section summarizes our efforts to produce five fully assembled devices and our approach to troubleshooting the issues that were observed during assembly.
When testing the devices, one or more presented failure symptoms that caused delays in the production process. Each of these issues was recorded, along with our work to address the root problem.

3.1.1. Failure Mode A: Gain Resistor

As previously mentioned in the discussion of the DMS, the gain of the ion detector amplification circuit is critical to achieving a proper signal for a given concentration of analyte. Our baseline design of this circuit specified a 50 GΩ resistor as the feedback resistor for the primary Op-amp (Supplemental Figure S2). Unfortunately, these surface mount components have no identifying marks, and, during assembly, process errors resulted in the mixing of the stock of the 50 GΩ resistors with the 10 GΩ version. Once soldered into place, there is not a convenient, accurate method to measure the resistance of such a high-resistance component (as it cannot be measured with a standard lab multimeter). As a result, we produced some versions of our DMS with the wrong gain, but some of these systems met the 0.02 V at 1 ppm DMS signal quality check and were built into functional units. Only after a comparison of their performance to that of other units, disassembly, and the development of a method to measure such high resistances were we able to determine that this failure mode was due to assembly quality issues.

3.1.2. Failure Mode B: Sorbent Trap

The traps are made to have anywhere between 15.00 and 20.00 mg of sorbent, which is measured utilizing a high-accuracy scale. Most traps contained roughly 20 mg of sorbent. Though the testing and developing of the traps had been carried out prior to using them in the chemical detection platform, it was observed that lower sorbent amounts impact signal intensity. Figure 4B shows the signal decrease that occurred due to the use of a trap that contained 15 mg of sorbent.

3.1.3. Failure Mode C: Feedback Controlled System Failure Resulting from the Inherent Inaccuracies of Flow Sensors and the Hysteresis of the Proportional Control Valve

The chemical detection platform was originally controlled using a feedback-controlled system, which relied on readings from the flow sensors (Honeywell, HAFBLF-0750C4AX5, HAFBLF0050CAAX5) to operate the proportional valves (Norgren, D170.0004). These resulted in inconsistencies in the flow, specifically in the desorption line, which controls the retention times of each on the odorants. Figure 4C shows the resulting chromatographs, with the inconsistent results due to varying flow rates. Variation in desorption flows impact the retention time of chemicals in the GC column and the sensor’s ability to identify and distinguish individual chemical species. To achieve consistent retention times across multiple devices, desorption flow rates can vary from 1.2 to 3.0 sccm. Thus, a small variation in flow can result in significant changes in retention times. A variation of only 0.5 sccm can change elution times by about 200 s. This can be seen in Supplemental Figure S3.
Further investigation into the flow sensor accuracy issue revealed that the specifications for this device require that the sensors’ maximum operating pressure is 25 psig, above which they do not meet their published accuracy specification. The development of the initial prototype was performed within this pressure limitation. However, it was identified that a more aggressive GC column was required to separate all mercaptan chemical species that appear in natural gas, some of which are created during gas processing, as part of field testing. Consequently, the selection of a more effective GC column led to required operating pressures of 38 psig to achieve the target desorption and recirculation flow rates, meaning that the flow sensors were operating in conditions outside of their manufacturer specifications.

3.1.4. Failure Mode D: Leaks

Any leak in the flow system would either decrease the device’s sensitivity, impact its reproducibility, or completely prohibit analysis. Each device is extensively leak-tested to ensure its flow systems are completely sealed. To complete a leak test, helium is connected directly to the carrier (i.e., nitrogen) inlet of the device. After waiting 3 min for the helium to circulate through the device, a commercial helium leak detector (RESTEK, 28500) can be used to verify that there is flow through the whole system by obtaining a reading at the outlet of the DMS. Finally, to verify that there is no leak, each connection, corner, and line of the flow system is tested using the leak detector. As explained before, the desorption section of the flow system is operated at very low flows, 1.5–3.0 sccm. This section of the flow system is the main area that would impact retention times if it were to vary. A small 0.5 sccm leak can have a similar impact on retention times as a change in desorption flow settings.

3.1.5. Failure Mode E: DMS Chip Failure

DMS chips were manufactured in the CNM2 class 100 cleanroom facility at UC Davis. For the ionization of analytes, a window must be drilled into a borosilicate substrate for UV light to pass through. Larger windows result in more ionization power and more sensitivity; but, because detector chips are made of glass, larger windows were more prone to cracking, resulting in leaks and substantial signal loss. Occasionally, the chips would contain microscopic cracks but pass their visual inspection and leak checking, but the cracks propagated over time, which slowly impacted the detector signal over time (Figure 4E). Drilling smaller ionization windows prevented cracks from forming, but their size did not provide adequate ionization and resulted in poor device performance.

3.2. Management and Outcome

In Figure 4A, we compare the signal intensity of DMS detectors with two different gain resistors (10 GW and 50 GW) and we observe a 15% increment in the signal intensity of samples at a concentration of 5 ppm.
Figure 4B depicts the resulting increase in signal at a 5 ppm concentration of the first five mercaptans after swapping the sorbent trap containing 15 mg for one containing 17 mg. Figure 4B-Before chromatograph showed low sensitivity with a sorbent trap containing 15 mg of sorbent, while utilizing a trap with 17 mg of sorbent dramatically increased the sensitivity of the device, as shown in Figure 4B-After, as more sample was able to be pre-concentrated into the sorbent. In this case, the trap was the focus because the devices that had been previously built all had sorbent traps that contained 16.00+ mg of sorbent and yielded discernible signals for varying sample concentrations.
Figure 4C-Before demonstrated the inconsistent behavior of the flow system when using a feedback-controlled system. As explained before, the flow sensors contain a significant amount of error, and the proportional valves lead to a substantial amount of hysteresis. These issues combined caused inconsistencies in retention times (the time it takes for each mercaptan species to exhaust from the GC column and reach the detector). The prediction algorithm depends on a consistently performing device, as it expects each mercaptan species to be detected within a 35 s window. A minor alteration in flow rate, as small as 0.5 sccm, led to a significant 200 s shift in the retention time. As a remedy, the feedback control that used the proportional valve was replaced with a needle valve-controlled flow system, which is tuned manually.
Figure 4C-After demonstrates the repeatability of the device after the flow system was modified to use manually controlled needle valves. The selected valves were chosen as they operate optimally at low flow rates, e.g., 1.0–300 sccm. Initially the device was set to 1.3 sccm desorption flow and 550 sccm recirculation flow, which are the minimum flow rates for device operation. Then, we conducted an initial run of the device with a standard mixture of mercaptans to establish the relative RTs of target chemicals. We targeted specific retention times for each mercaptan species to ensure consistency across all working devices. Depending on the elution times seen in the data generated from the initial run, the needle valves can be tuned to accelerate or slow down mercaptan elution to meet specifications. If the mercaptans are eluting later than desired, then the flow rates are increased, and if their peaks are eluting earlier and/or have inadequate separation, then the flow rates are reduced. Special attention was given to the mercaptans ETM and DMS-odorant, the first two eluting compounds, as faster flow rates prevented these peaks from separating. The flow was tuned until there was a 5–10 s window between them so that the prediction algorithm could determine their concentrations more accurately. Through the optimization of the signal output, we have observed variations in elution times and flow settings across different devices. This indicates that uniform optimization does not result in consistent performance metrics among all devices. This emphasizes the importance of adequate flow tunning parameters for each device.
Figure 4D shows the chromatographs generated with and without a leak in the system. Leaks impact the resulting data in two ways: (1) signal reduction and (2) varying retention times. The symptoms of a leak are also present in all the other failure modes. Therefore, there is no unique symptom that indicates a leak. A leak in the recirculation line will only result in decreased sensitivity, whereas a leak in the desorption line will result in inconsistent retention times and decreased sensitivity.
The last failure mode, before and after being fixed, can be observed in Figure 4E. When a chip begins to crack, the resulting signal diminishes. If cracks propagate over time, the signal will continue to drop. In this case, a 5 ppm sample using NPM was used to carry out this test. This was done to observe the behavior of a device over a period of 3 days, while only using one chemical to shorten the chemical analysis time. Figure 4E-Before shows the deteriorating signal over time. When there are no cracks in the DMS chip, the signal intensity remains consistent, as shown in Figure 4E-Before.

4. Discussion

Chromatographic technology, while highly effective for gas detection, presents several key technical and scientific challenges that must be addressed to ensure its reliable performance. One of the primary issues is achieving high-resolution separation, which is crucial for distinguishing between similar chemical species, such as different mercaptans. Additionally, maintaining sensitivity to detect low concentrations of VOCs is essential, particularly in applications requiring their precise monitoring and control. Stability and accuracy over extended periods are also critical concerns, as fluctuations in these parameters can lead to inconsistent results and reduced reliability. Our approach leverages industry-standard chromatography, coupled with our solid-state detector, to address these challenges effectively. This combination not only enhances specificity and sensitivity but also meets the stringent requirements of utility companies for individual measurements of each mercaptan species. By focusing on these key issues, we aim to provide a robust and reliable solution for portable VOC detection.
Through this work, we hope to provide troubleshooting guidelines to other teams assembling multiple highly integrated VOC detection platforms using sorbent traps, gas chromatography columns, and chemical detectors. Trying to replicate a device many times over has proven to be quite challenging. Figure 5 depicts a flow chart summarizing each of the failure modes described in this section and their corresponding plausible remedies. The goal is to provide a quick visualization of each of the failure modes, as well as the short- and long-term solutions for each of them.
The first step when trying to troubleshoot a device is to identify the “symptoms” (issues) present. In the case of this project, there were four main issues: (1) low signals, (2) retention time shifts, (3) a loss of signal, and (4) peak shape/width. These symptoms were resolved using short- and long-term solutions.

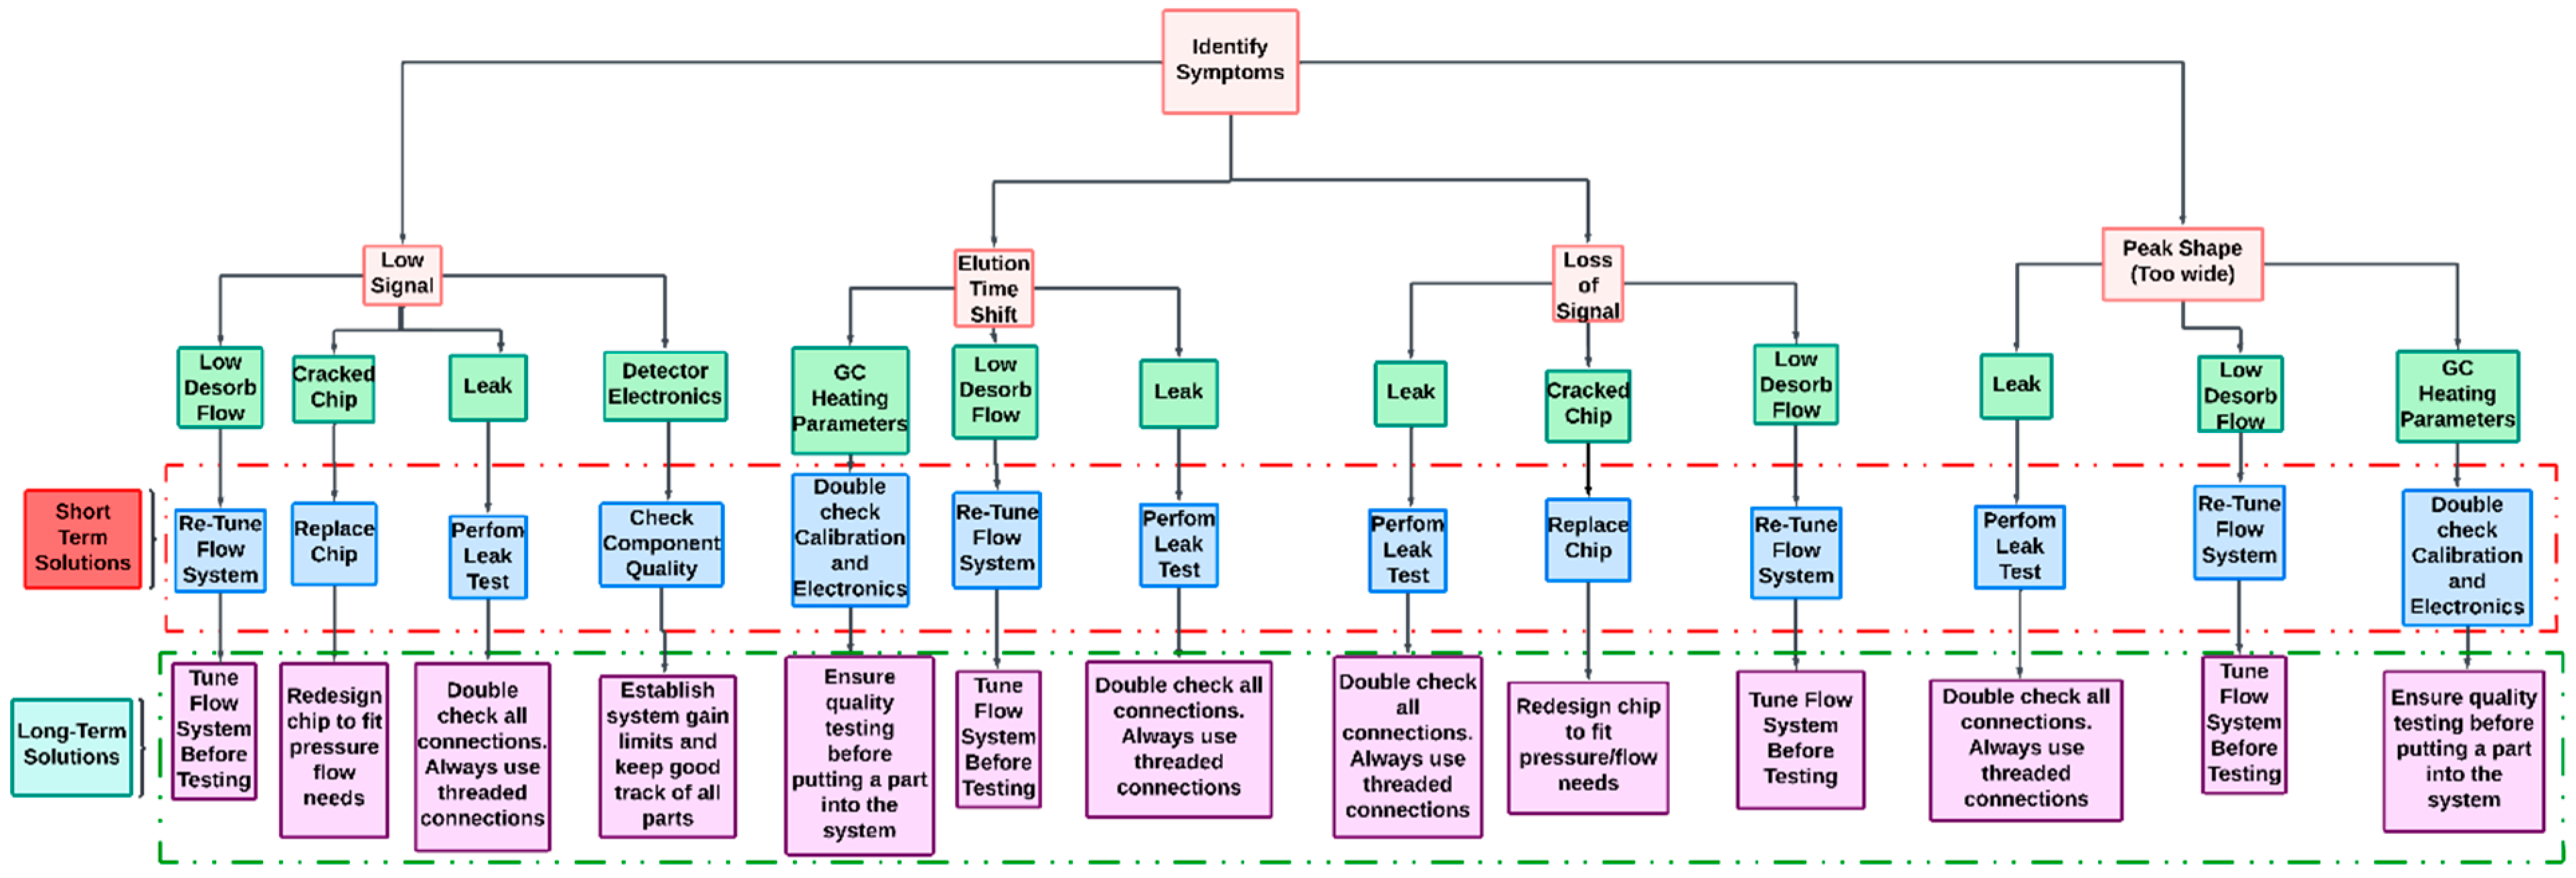
4.1. Symptom: Low Signal

If the issue of low signals were to arise, there are four possible causes we have identified: (1) low or no desorption flow, (2) a cracked DMS chip, (3) a leak in the flow path, or (4) detector electronics issues. To resolve a low desorption flow, the short-term solution is to re-tune the flow system, but to avoid this, it is important to follow the flow tuning process before any chemical detections are carried out. This process can be lengthy because each device requires a different desorption/recirculation flow combination to output the desired signal. A low signal can also be present if there is a cracked DMS chip. As shown before, in Figure 4E, when a chip crack starts to propagate, the signal will decrease over time. A quick solution for this is to replace the DMS chip. In our case, to avoid cracking in future DMS detector chips, these should be redesigned so that there is no need to drill the ionization window into the borosilicate glass substrate.
A leak in the flow path will reduce the signal through the loss of the sample as it is making its way to the detector. The leak test as described earlier is the easiest way to identify a leak and solve it quickly. However, a more permanent solution is to perform leak tests routinely before carrying out any chemical testing to avoid delays.
Finally, issues in the detector’s electronics can alter the intended gain of the system (ionized analyte flow rate vs. signal voltage). Establishing an overall system gain quality check with a pass/fail limit enables the identification of low-gain systems and can trigger more thorough inspection and component quality checks to identify the source of the issue. However, establishing a quality check process with a series of component tests for each electronics board and critical electronic component to prior to assembly would reduce the re-work required by failures in system-level assessments. For even with QA/QC parameters in place, it cannot be guaranteed that the device will perform adequately.

4.2. Symptom: Elution Time Shifts

The second symptom present when troubleshooting these chemical detection platforms was elution time shifts. We identified three root causes of retention time shifts: (1) inconsistent heating control of the gas chromatography column, (2) low desorption flows, and (3) leaks. To resolve GC heating parameters, it is essential to investigate the calibration of the GC column heating system and the RTD feedback for temperature control.
A low desorption flow can also lead to inconsistent retention times due to the inability of the system to fully pressurize in a reasonable amount of time. To avoid this issue, the flow system should undergo flow tuning before carrying out experiments.
A leak can also shift retention times. This is due to the sporadic behavior a leak can have, meaning that exterior factors can cause the leak to be greater or smaller at different ambient conditions. A leak test can help quickly solve this issue, but a more permanent solution is to routinely perform leak testing before performing any chemical analyses and use proper threaded connections.

4.3. Symptom: Loss of Signal

We observed that a loss of signal can happen due to three main causes: (1) a leak in the flow system, (2) a cracked chip, and (3) a low desorption flow. Leaks tend to be a recurring issue when assembling devices. In this case, if there is a leak in the desorption line and most of the flow is coming out from there, then all the chemical sample will be lost to the ambient atmosphere and unable to reach the detector.
A cracked DMS chip was also observed to result in a loss of signal. Based on our experience, not only can the repetitive use of a DMS chip lead to crack initiation and propagation, but changes in ambient conditions can also facilitate these processes. The presence of cracks may not present a deterioration in signal immediately. Thermal or physical stress enlarges existing cracks and rapidly reduces signal quality. Sometimes cracks propagate rather quickly due to a change in ambient conditions (mostly overnight), and the signal becomes lost rapidly as well. Cracks can also propagate slowly, reducing the detector’s signal slowly over time. To resolve the issue quickly, the DMS chip can be replaced, but a more permanent solution could be implemented by re-designing the chip to prevent cracks from occurring by eliminating drilled holes and therefore reducing stress points.

4.4. Symptom: Peak Shape/Width Variation

Peak shape is an important aspect to analyze in mercaptan concentrations. Ideally, the chemical peaks in GC data should be sharp, symmetrical, and Gaussian-shaped [19,20,21]. As peak width increases, the quantification of the chemical concentration becomes increasingly difficult due to the possible overlap of different chemical signals. In our experience, several mercaptan compounds had relatively close retention times in the GC column. If these peaks were unacceptably wide, two mercaptan species could merge (i.e., not resolve) in the resulting data, conflating concentration readings. This was particularly a problem with the mercaptans ETM and DMS-odorant because they elute from the column close to one another, at around 370 s and 410 s, respectively.
A leak can be one of the causes of peaks broadening. This would be specifically a leak in the desorption line. This issue can be fixed using a leak test. Too low of a desorption flow can also broaden peaks because the carrier gas is too slow when carrying analytes through the system. This issue can be resolved by tuning the system to optimal flows and, to avoid this recurring, flow tuning the system before carrying out any chemical testing in the device.
Finally, peaks can be too wide if the GC temperature is not consistent, too high, or too low. If the column is too hot, analytes may co-elute, resulting in shoulder peaks or peak splitting. Conversely, when the column is too cold, analytes linger in the GC column for a longer period of time and disperse, broadening their resulting peak as they reach the detector. Implementing quality checks for all testing will avoid issues with the inconsistent performance of individual parts.

5. Conclusions

Developing a chemical detection platform is not an easy task. It takes a great deal of planning and part interfacing to create a working prototype. Building multiple-chemical detection systems presents an entirely different set of challenges due to the variability each individual component sub-system brings to the project. Although most components likely will not have significant variability, some are more sensitive, and less-perceptible component variability can still significantly impact the behavior and data quality of the device’s system outputs. By sharing our approach to troubleshooting and failure resolution, we hope others now have more guidance for building multiple-chemical detection platforms.
In our experience, meticulous attention to detail during the assembly and calibration phases is crucial for ensuring consistency and reliability across all units. Continuous monitoring and iterative testing are essential to identify and mitigate any discrepancies that arise from component variability. Additionally, implementing a robust QA/QC process helps in maintaining high standards and reducing the potential for errors during production.
Despite our successes, there remain several areas for future improvement. Enhancing the sensitivity and selectivity of the DMS detector will be crucial as we expand the range of detectable chemicals. Designing a flow system that provides the adaptability of the original closed-loop control and the stability of the needle valve control system is necessary. Moreover, the automation of the QA/QC processes could streamline production and minimize human error, making large-scale deployment more feasible.
By addressing these challenges and continuously improving our quality process, the ultimate goal is to develop reliable, high-performance detection systems that can be deployed across a wide range of applications, from environmental monitoring to industrial safety and others uses in the field, fostering innovation and collaboration in the development of the next generation of chemical detection platforms.

Supplementary Materials

The following supporting information can be downloaded at https://www.mdpi.com/article/10.3390/chemosensors12080155/s1, Figure S1: The DMS testing setup is composed of the following: (1) a syringe pump used to inject the chemical sample at a constant rate, (2) a bench power supply controlling the voltages of the DMS electronics and the high-voltage power supply (HVPS), (3) a temperature controller to heat the mixing tee, (4) an HVPS that powers the UV ionization bulb in the DMS, (5) the LabView program used to control all the boards in the DMS, (6) the DMS units under test, (7) the mixing tee being heated to avoid cold traps, and (8) the glass syringe containing the chemical analyte THT at a 1000 ppm concentration. Figure S2: Detector board diagram showing where the gain resistor is located. Figure S3: Chromatograph showing the impact a 0.5 sccm change in the desorption flow can have on retention time.

Author Contributions

Conceptualization, R.P.C., D.T.K., P.G., M.M.M. and C.E.D.; methodology, R.P.C., P.G., M.M.M. and D.T.K.; software, R.H., P.C., P.G. and B.S.C.; validation, C.E.D., M.M.M. and P.G.; formal analysis, R.P.C., M.M.M. and P.G.; investigation, R.P.C., M.M.M., P.G., D.T.K., D.A.C., J.H. and T.G.; resources, C.E.D., M.M.M. and P.G.; data curation, M.M.M., R.H. and T.L.H.; writing—original draft preparation, R.P.C.; writing—review and editing, C.E.D., M.M.M., P.G., P.C., B.S.C. and R.P.C.; visualization, R.P.C., P.G. and B.S.C.; supervision, C.E.D., M.M.M. and P.G.; project administration, C.E.D., M.M.M. and P.G.; funding acquisition, C.E.D. and M.M.M. All authors have read and agreed to the published version of the manuscript.

Funding

This work was funded in part by the Northeast Gas Association (NGA). Periodically, the Northeast Gas Association sponsors product development and field testing efforts, providing funds or input for projects involving product specifications, design, prototype development, and laboratory or field testing. This activity is designed to assist the gas industry by providing new information to all interested parties. None of these entities participated in the planning, evaluation, or analysis of the experimental data presented in this paper. Neither the NGA, nor any of its members, warrant, directly or indirectly, in any way or in any manner, that the reports, products, test results, or information from these activities are accurate, effective, or have application to the gas industry in any particular field setting, if at all. The NGA, its members, and those acting on behalf of the NGA hereby expressly disclaim any and all liability and responsibility, and the damages or claims of any kind or of any nature that may result from use of these reports, products, test results, or the information related thereto, is taken on at the performer’s own risk, without reliance on the fact that NGA and/or its members sponsored these activities. Such an individual, corporation, or other entity assumes any and all liability that may result from such use. This research was funded in part under the Department of Transportation, Pipeline and Hazardous Materials Safety Administration’s Pipeline Safety Research and Development Program, award 693JK32010008POTA [CED]. The views and conclusions contained in this document are those of the authors and should not be interpreted as representing the official policies, either expressed or implied, of the Pipeline and Hazardous Materials Safety Administration or the U.S. Government. This work was partially supported by NIH NCATS awards U18-TR003795, U01-TR004083, and UL1-TR001860 [CED]; NIH Office of the Director award UG3-OD023365; NIH NIEHS award P30-ES023513 [CED]; NIH NHLBI T32-HL07013 [BSC]; US Department of Education Award P200A180054 [DTK]; the Department of Veterans Affairs award I01-BX004965 [CED]; the University of California Tobacco-Related Disease Research Program award T31IR1614 [CED]; NSF award 2200221 [CED]; and the California Firefighter Cancer Research Study funded by the University of California Office of the President award R02CP7431 [CED]. The contents of this manuscript are solely the responsibility of the authors and do not necessarily represent the official views of these funding agencies.

Institutional Review Board Statement

Not applicable.

Informed Consent Statement

Not applicable.

Data Availability Statement

The raw data supporting the conclusions on this article will be made available by the authors upon request. The software code and circuit designs are available on GitHub for non-commercial use. Please refer to Professor Cristina Davis’ webpage for more information. This material is available as an open resource for research and personal use under a Creative Commons Attribution-Non Commercial-No Derivatives 4.0 International Public License (https://creativecommons.org/licenses/by-nc-nd/4.0/). Commercial licensing may be available, and a license fee may be required. The Regents of the University of California own the copyrights to the software. Future published scientific manuscripts or reports using this software and/or hardware designs must cite this original publication (DOI: http://doi.org/10.3390/chemosensors12080155).

Acknowledgments

Part of this study was conducted at the UC Davis Center for Nano and Micro Manufacturing (CNM2).

Conflicts of Interest

The authors declare no conflicts of interest. The funders had no role in the design of the study; in the collection, analyses, or interpretation of the data; in the writing of the manuscript; or in the decision to publish the results.

References

  1. Fabianowski, W.; Maziejuk, M.; Szyposzyńska, M.; Wiśnik-Sawka, M. Detection and identification of vocs using differential ion mobility spectrometry (Dms). Molecules 2021, 27, 234. [Google Scholar] [CrossRef]
  2. Frausto-Vicencio, I.; Moreno, A.; Goldsmith, H.; Hsu, Y.-K.; Hopkins, F.M. Characterizing the performance of a compact btex gc-pid for near-real time analysis and field deployment. Sensors 2021, 21, 2095. [Google Scholar] [CrossRef] [PubMed]
  3. Guntner, A.T.; Abegg, S.; Konigstein, K.; Gerber, P.A.; Schmidt-Trucksass, A.; Pratsinis, S.E. Breath sensors for health monitoring. ACS Sens. 2019, 4, 268–280. [Google Scholar] [CrossRef] [PubMed]
  4. Camara, M.; Gharbi, N.; Lenouvel, A.; Behr, M.; Guignard, C.; Orlewski, P.; Evers, D. Detection and quantification of natural contaminants of wine by gas chromatography–differential ion mobility spectrometry (GC-DMS). J. Agric. Food Chem. 2013, 61, 1036–1043. [Google Scholar] [CrossRef] [PubMed]
  5. Buryakov, I.; Krylov, E.; Nazarov, E.; Rasulev, U.K. A new method of separation of multi-atomic ions by mobility at atmospheric pressure using a high-frequency amplitude-asymmetric strong electric field. Int. J. Mass Spectrom. Ion Process. 1993, 128, 143–148. [Google Scholar] [CrossRef]
  6. Bílek, J.; Maršolek, P.; Bílek, O.; Buček, P. Field test of mini photoionization detector-based sensors—Monitoring of volatile organic pollutants in ambient air. Environments 2022, 9, 49. [Google Scholar] [CrossRef]
  7. Huang, X.; Yang, S.; Li, W.; Nidetz, R.; Sharma, R.; Sivakumar, A.D.; Thota, C.; Zhu, H.; Wu, W.; Jeong, S.-Y. Microfluidic integration of μPID on μcolumn for ultracompact micro-gas chromatography. Sens. Actuators B Chem. 2024, 410, 135717. [Google Scholar] [CrossRef]
  8. Agbroko, S.O.; Covington, J. A novel, low-cost, portable PID sensor for the detection of volatile organic compounds. Sens. Actuators B Chem. 2018, 275, 10–15. [Google Scholar] [CrossRef]
  9. Tereshkov, M.; Dontsova, T.; Saruhan, B.; Krüger, S. Metal Oxide-Based Sensors for Ecological Monitoring: Progress and Perspectives. Chemosensors 2024, 12, 42. [Google Scholar] [CrossRef]
  10. Li, Y.; Zhang, B.; Li, J.; Duan, Z.; Yang, Y.; Yuan, Z.; Jiang, Y.; Tai, H. Pd-decorated ZnO hexagonal microdiscs for NH3 sensor. Chemosensors 2024, 12, 43. [Google Scholar] [CrossRef]
  11. Zhang, Y.; Jiang, P.; Cao, W.; Li, X.; Lai, J. High-sensitivity ethylene gas sensor based on NDIR and dual-channel lock-in amplifier. Optik 2020, 223, 165630. [Google Scholar] [CrossRef]
  12. Xu, M.; Peng, B.; Zhu, X.; Guo, Y. Multi-gas detection system based on non-dispersive infrared (NDIR) spectral technology. Sensors 2022, 22, 836. [Google Scholar] [CrossRef] [PubMed]
  13. Fung, S.; Contreras, R.P.; Fung, A.G.; Gibson, P.; LeVasseur, M.K.; McCartney, M.M.; Koch, D.T.; Chakraborty, P.; Chew, B.S.; Rajapakse, M.Y. Portable chemical detection platform for on-site monitoring of odorant levels in natural gas. J. Chromatogr. A 2023, 1705, 464151. [Google Scholar] [CrossRef] [PubMed]
  14. Yeap, D.; Hichwa, P.T.; Rajapakse, M.Y.; Peirano, D.J.; McCartney, M.M.; Kenyon, N.J.; Davis, C.E. Machine vision methods, natural language processing, and machine learning algorithms for automated dispersion plot analysis and chemical identification from complex mixtures. Anal. Chem. 2019, 91, 10509–10517. [Google Scholar] [CrossRef] [PubMed]
  15. Peirano, D.J.; Pasamontes, A.; Davis, C.E. Supervised semi-automated data analysis software for gas chromatography/differential mobility spectrometry (GC/DMS) metabolomics applications. Int. J. Ion Mobil. Spectrom. 2016, 19, 155–166. [Google Scholar] [CrossRef] [PubMed]
  16. Chakraborty, P.; Rajapakse, M.Y.; McCartney, M.M.; Kenyon, N.J.; Davis, C.E. Machine learning and signal processing assisted differential mobility spectrometry (DMS) data analysis for chemical identification. Anal. Methods 2022, 14, 3315–3322. [Google Scholar] [CrossRef] [PubMed]
  17. Chromatotech. energyMEDOR. Available online: https://chromatotec.com/solutions/auto-gc-866-analyzers-range/sulfur-compounds/energymedor/ (accessed on 23 July 2024).
  18. Miller, R.A.; Nazarov, E.G.; Eiceman, G.A.; King, A.T. A MEMS radio-frequency ion mobility spectrometer for chemical vapor detection. Sens. Actuators A Phys. 2001, 91, 301–312. [Google Scholar] [CrossRef]
  19. Moretti, P.; Vezzani, S.; Garrone, E.; Castello, G. Evaluation and prediction of the shape of gas chromatographic peaks. J. Chromatogr. A 2004, 1038, 171–181. [Google Scholar] [CrossRef] [PubMed]
  20. Gough, D.V.; Bahaghighat, H.D.; Synovec, R.E. Column selection approach to achieve a high peak capacity in comprehensive three-dimensional gas chromatography. Talanta 2019, 195, 822–829. [Google Scholar] [CrossRef] [PubMed]
  21. Wilson, R.B.; Siegler, W.C.; Hoggard, J.C.; Fitz, B.D.; Nadeau, J.S.; Synovec, R.E. Achieving high peak capacity production for gas chromatography and comprehensive two-dimensional gas chromatography by minimizing off-column peak broadening. J. Chromatogr. A 2011, 1218, 3130–3139. [Google Scholar] [CrossRef] [PubMed]
Figure 1. System layout of the three main sub-systems of the chemical detection device. Layer I, layer II, and layer III are the flow control, chemical analysis, and electronics/power sub-systems, respectively. Each of the parts are numbered as follows: (1) main power electronics, (2) power supply, (3) sorbent trap, (4) heated line (HL), (5) gas chromatography columns, (6) odorant sample flow sensor, (7) needle valve, (8) odorant sample inlet, (9) 3-way valve, (10) odorant sample pump, (11) nitrogen flow sensor, (12) proportional valve, (13) pressure regulator, (14) nitrogen inlet, (15) metal tee, (16) device control electronics, (17) differential mobility spectrometer, and (18) ionization power electronics.
Chemosensors 12 00155 g001
Figure 2. The variation of individual components’ test results. Each component was evaluated before being assembled into a device. The tests results include (A) the electrical resistance of the gas chromatography (GC) column’s resistance temperature detector at 40 °C; (B) the average flow hysteresis between increasing and decreasing flow curves for proportional valve 1, which controls the main gas flow; (C) the average flow hysteresis between increasing and decreasing flow curves for proportional valve 2, which controls the gas chromatography (GC) column flow; (D) the sorbent mass contained in each trap; (E) the electrical resistance of the heater wrapped around the transfer line or heated line 2 (HL2), which connects the trap to the GC column; (F) the electrical resistance of the heater wrapped around the flow line of the makeup adapter (MUA), which connects the outlet of the GC to the DMS detector’s makeup flow; (G) the electrical resistance of the heater wrapped around the transfer line, which delivers the makeup flow to the makeup adapter; (H) the reading variation of flow sensor 3 (located in the desorption line), with a 20 sccm setpoint; (I) the reading variation of flow sensor 1 (located in the recirculation line), with a 500 sccm setpoint; (J) the reading variation of the pressure regulator (located at the nitrogen inlet), with a 15 psig setpoint.
Chemosensors 12 00155 g002
Figure 3. The signal intensity variation of differential mobility spectrometers (DMSs) detecting THT at 1 ppm in a balance of N2 for the nine DMS units that were evaluated.
Chemosensors 12 00155 g003
Figure 4. Chromatographs showing the results before and after resolving the failure modes present in one or more devices. (A-Before) (N = 1) is the signal intensity resulting from using a 10 GΩ gain resistor. (A-After) (N = 1) is the resulting increase in signal due to the use of a 50 GΩ gain resistor. (B-Before) (N = 1) is a chromatogram showing a low signal due to the use a trap containing 15 mg of sorbent. (B-After) (N = 1) is the resulting increased signal from using a trap containing 17 mg of sorbent. (C-Before) (N = 5) is the resulting variation in retention times from having an electronically controlled system. (C-After) (N = 5) is the result of swapping over to a needle valve-controlled system. (D-Before) (N = 4) is the resulting variation in retention time due to a leak in the system. (D-After) (N = 5) after is the result of identifying the leak and fixing it. In this case, the device gave such extremely consistent data that all five runs at 5 ppm are stacked on top of each other. (E-Before) (N = 21) is the resulting decrease in signal over time resulting from a cracked chip. (E-After) (N = 4) is the resulting consistent signal intensity seen with a chip with no cracks. Graphs are plotted with different axes for clarity.
Chemosensors 12 00155 g004
Figure 5. Flow chart diagram describing which course of action to take to diagnose the problem with a chemical detection device.
Chemosensors 12 00155 g005
Disclaimer/Publisher’s Note: The statements, opinions and data contained in all publications are solely those of the individual author(s) and contributor(s) and not of MDPI and/or the editor(s). MDPI and/or the editor(s) disclaim responsibility for any injury to people or property resulting from any ideas, methods, instructions or products referred to in the content.

