The Effect of Loading W&V:TiO2 Nanoparticles with Noble Metals for CH4 Detection

 , , ,
, , ,
Abstract
:
1. Introduction
2. Materials and Methods
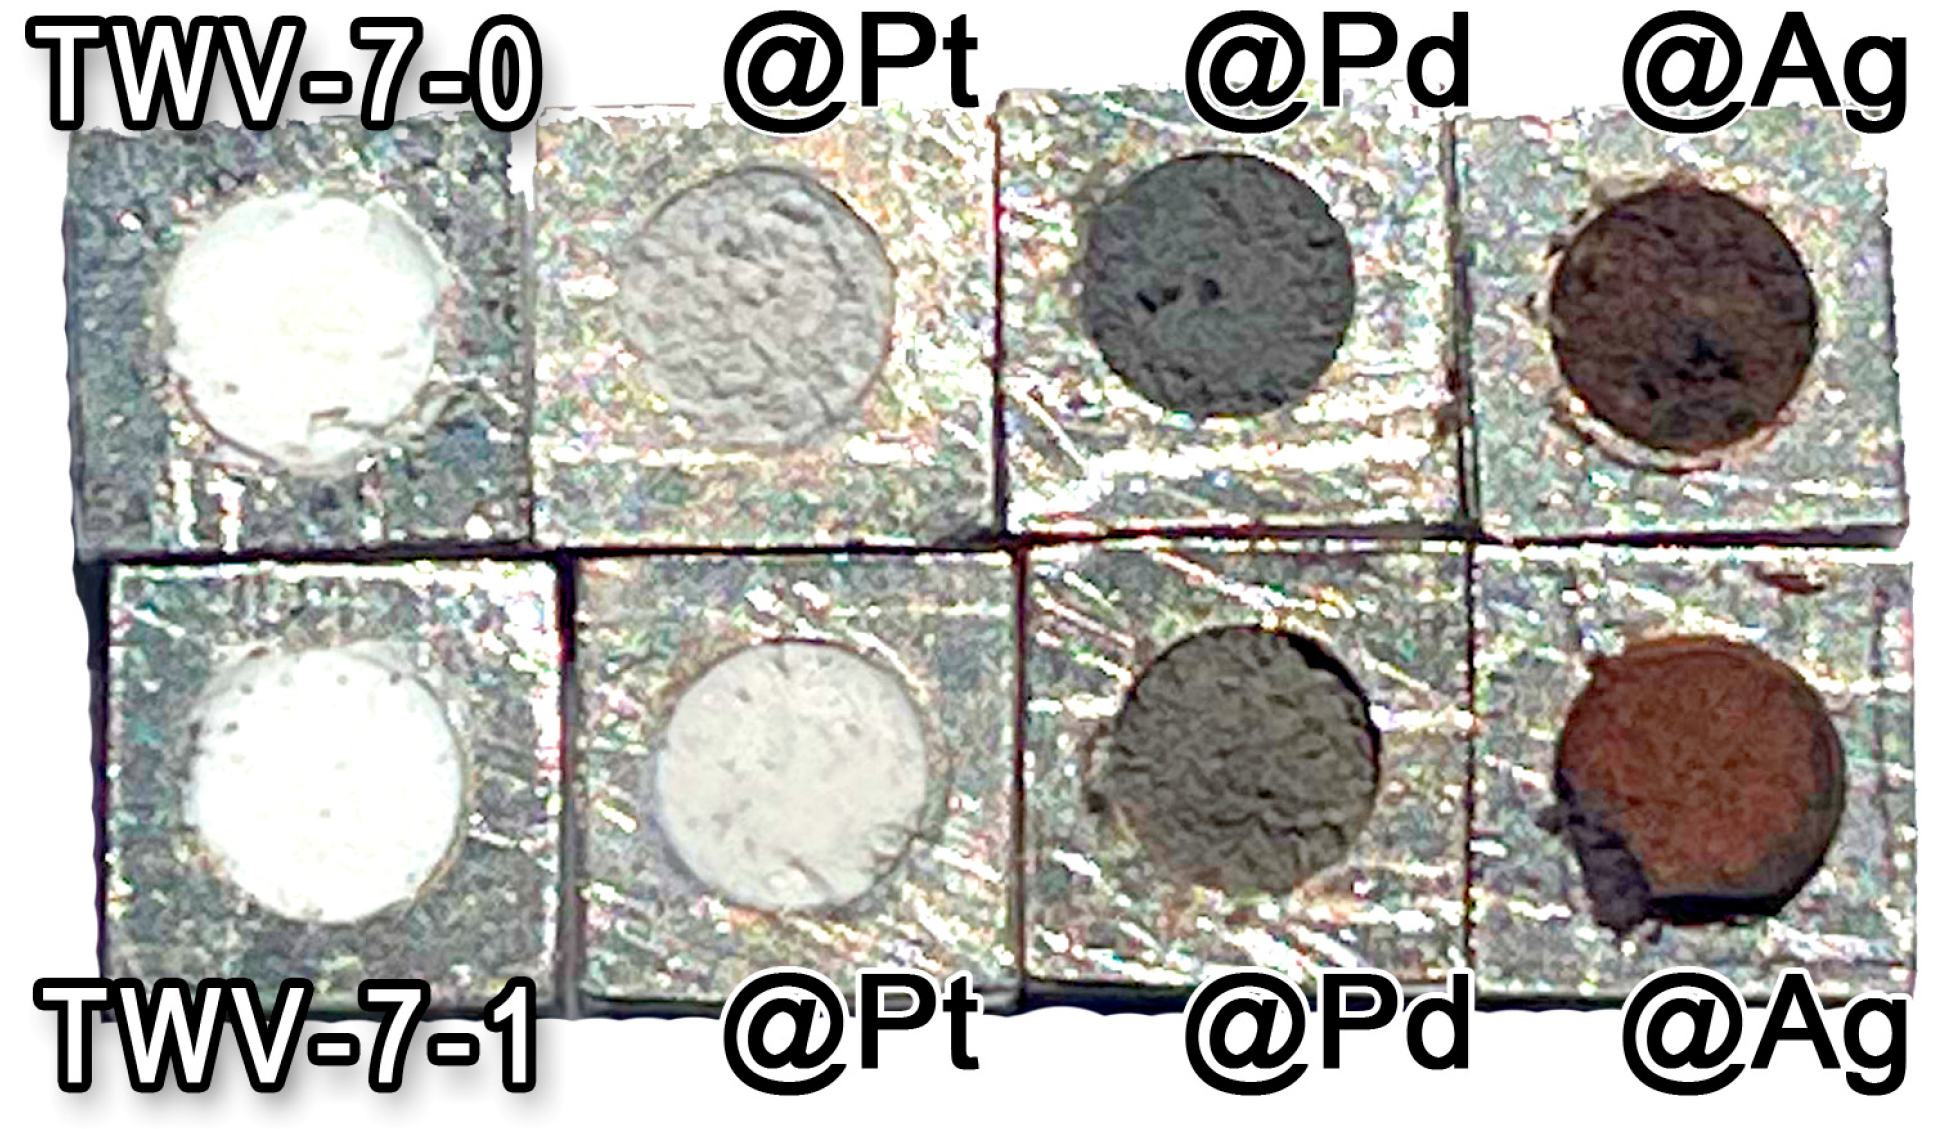
2.1. Synthesis of W:V:TiO2@Ag Nanopowders
2.2. Morphostructural Characterization
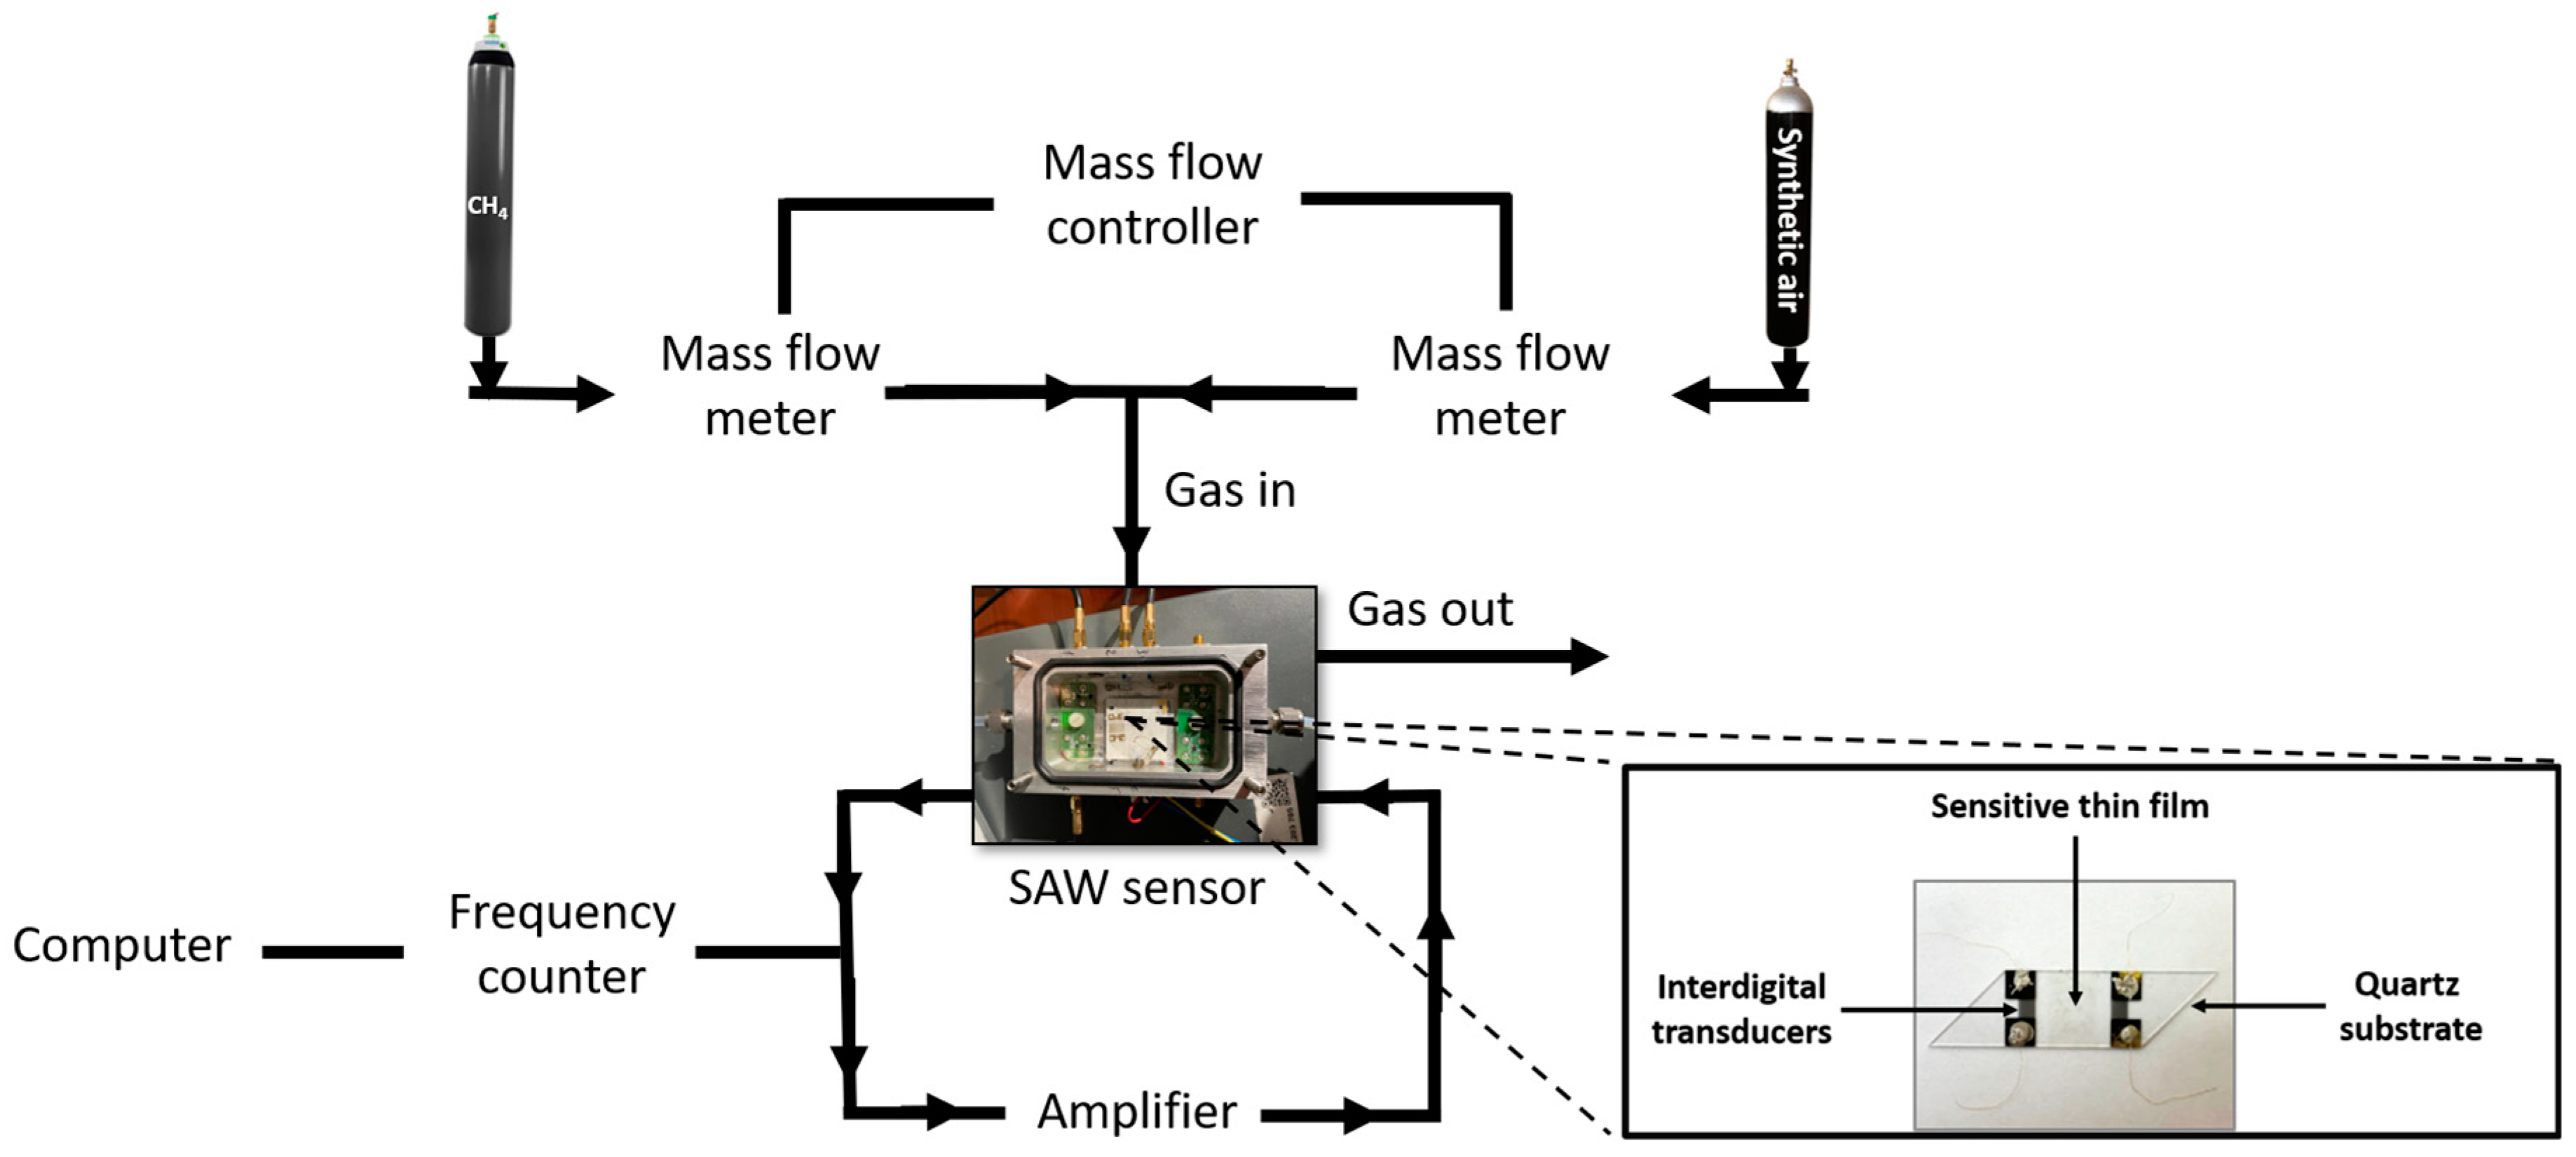
2.3. SAW Sensor Structure and Testing
3. Results and Discussion
3.1. Morphology and Structure
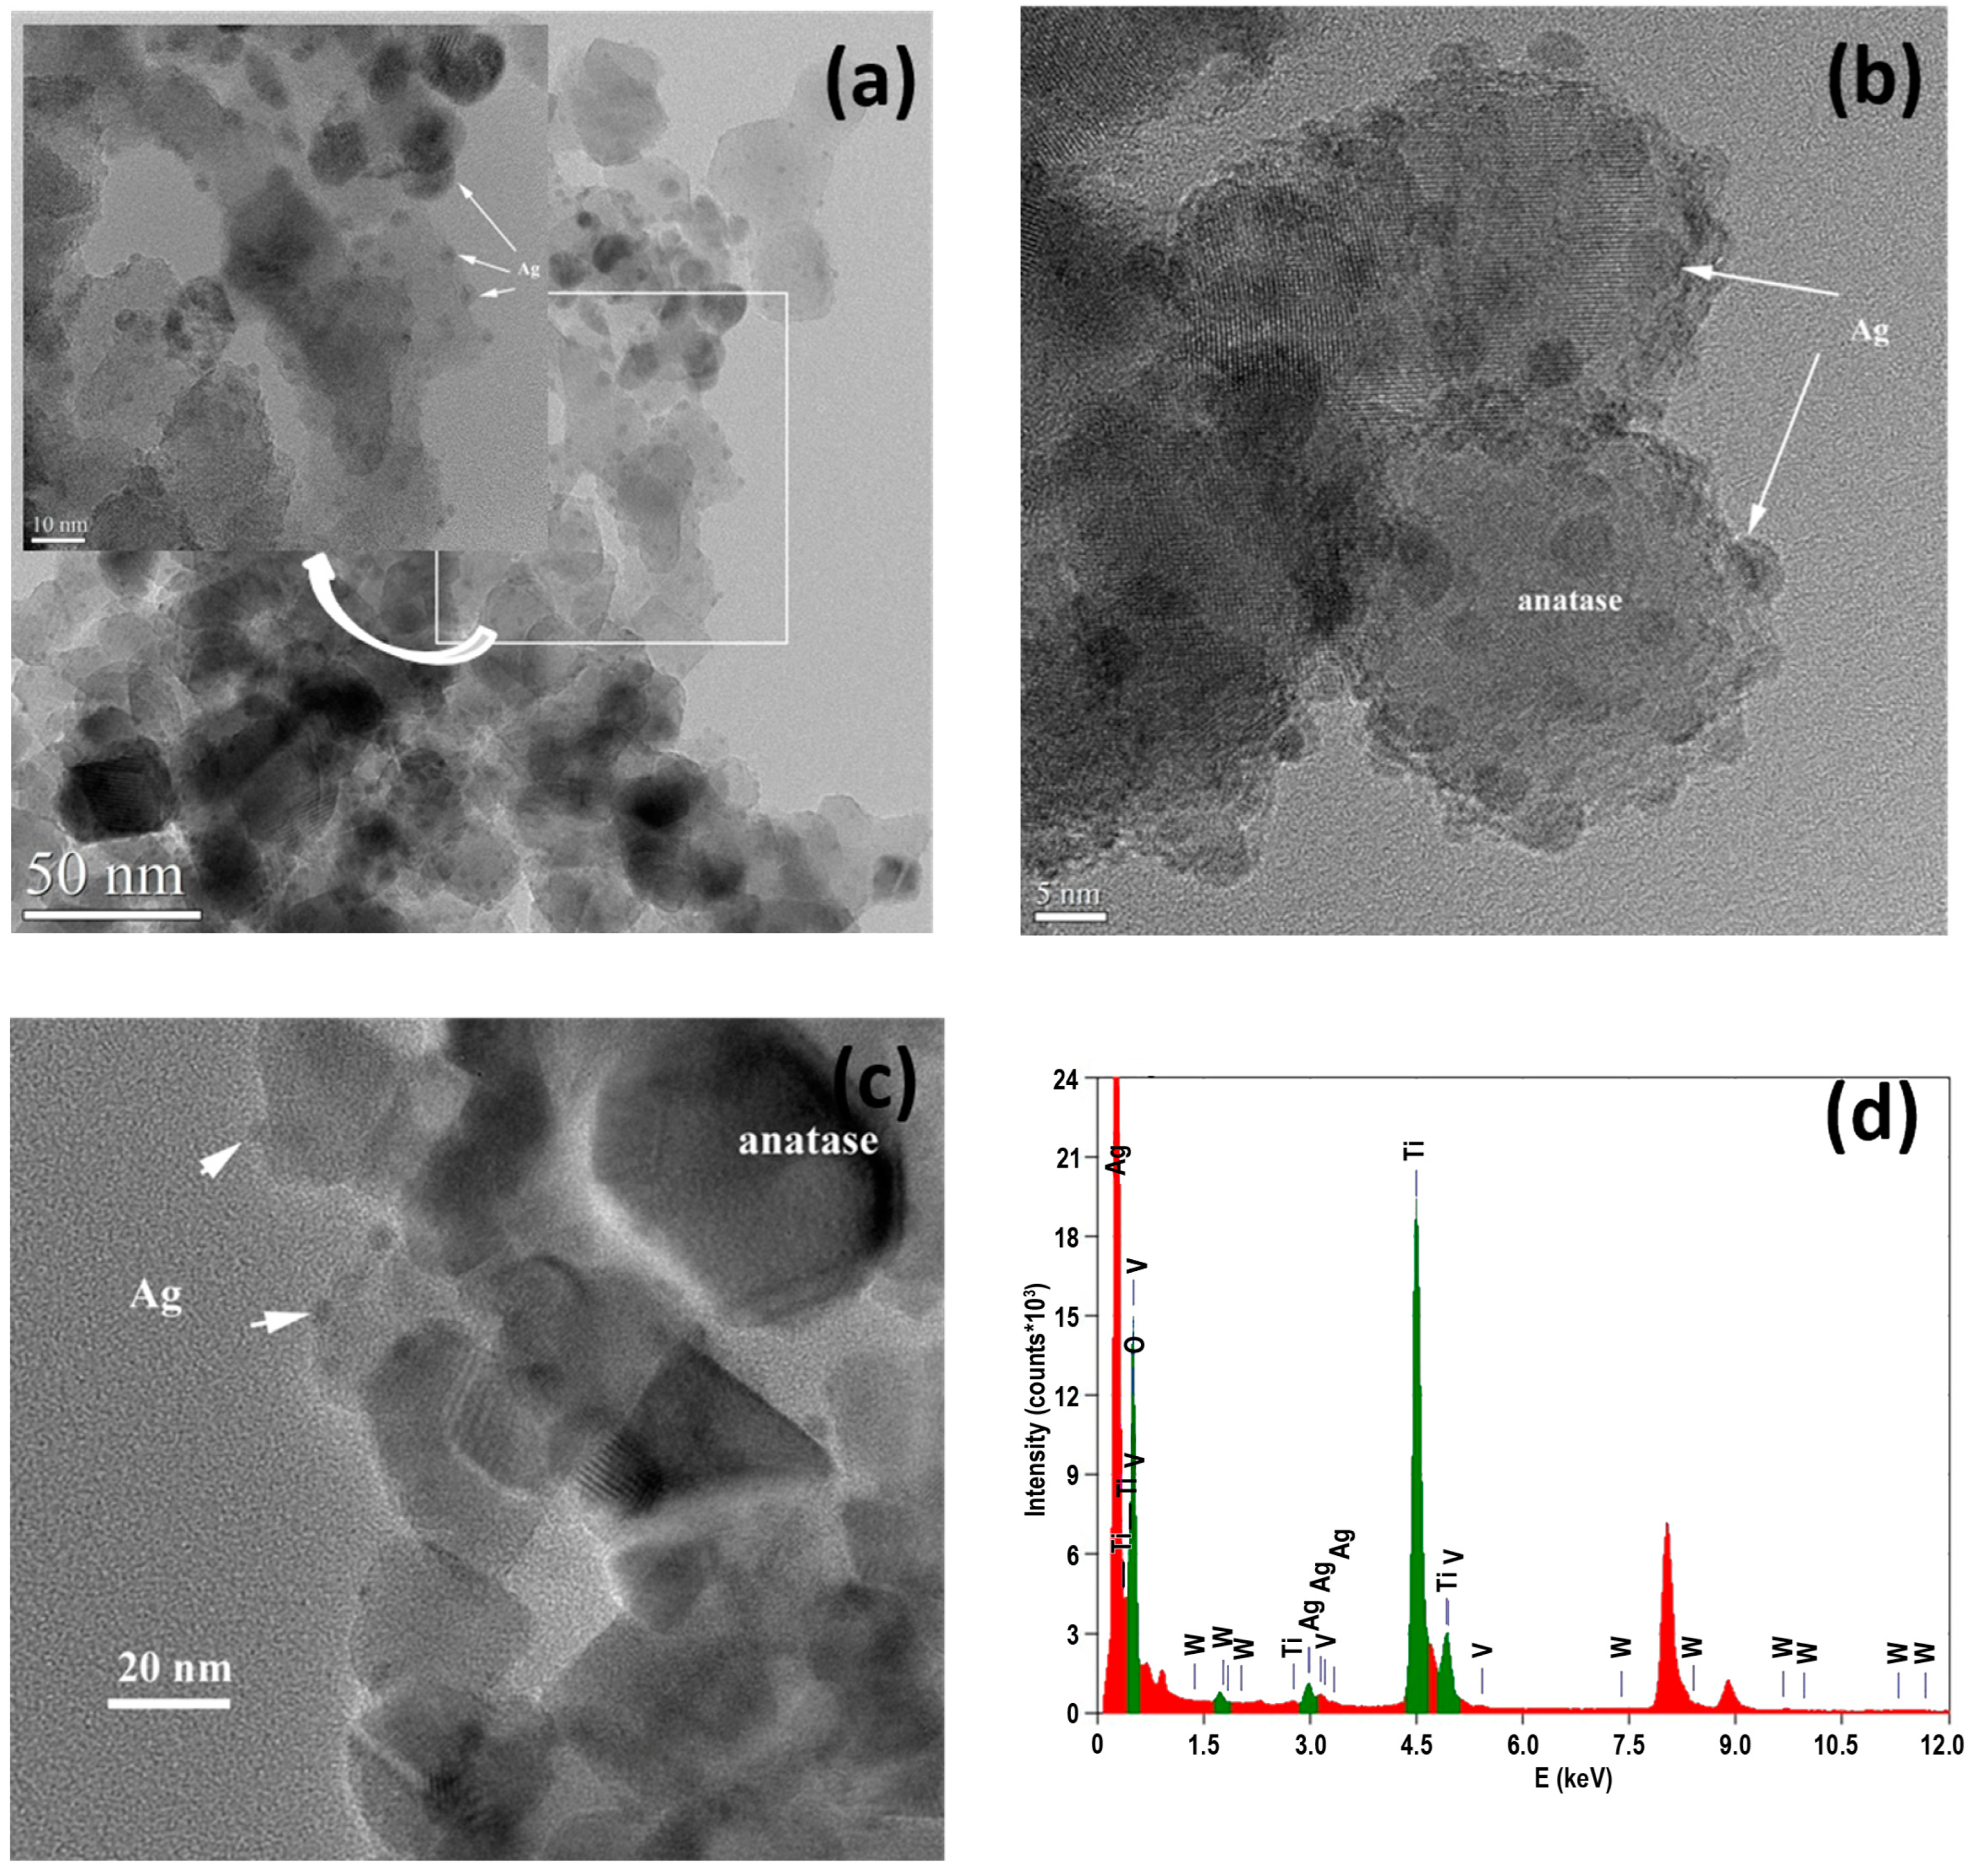
3.1.1. TEM
3.1.2. BET Analysis
3.1.3. EDX Analysis
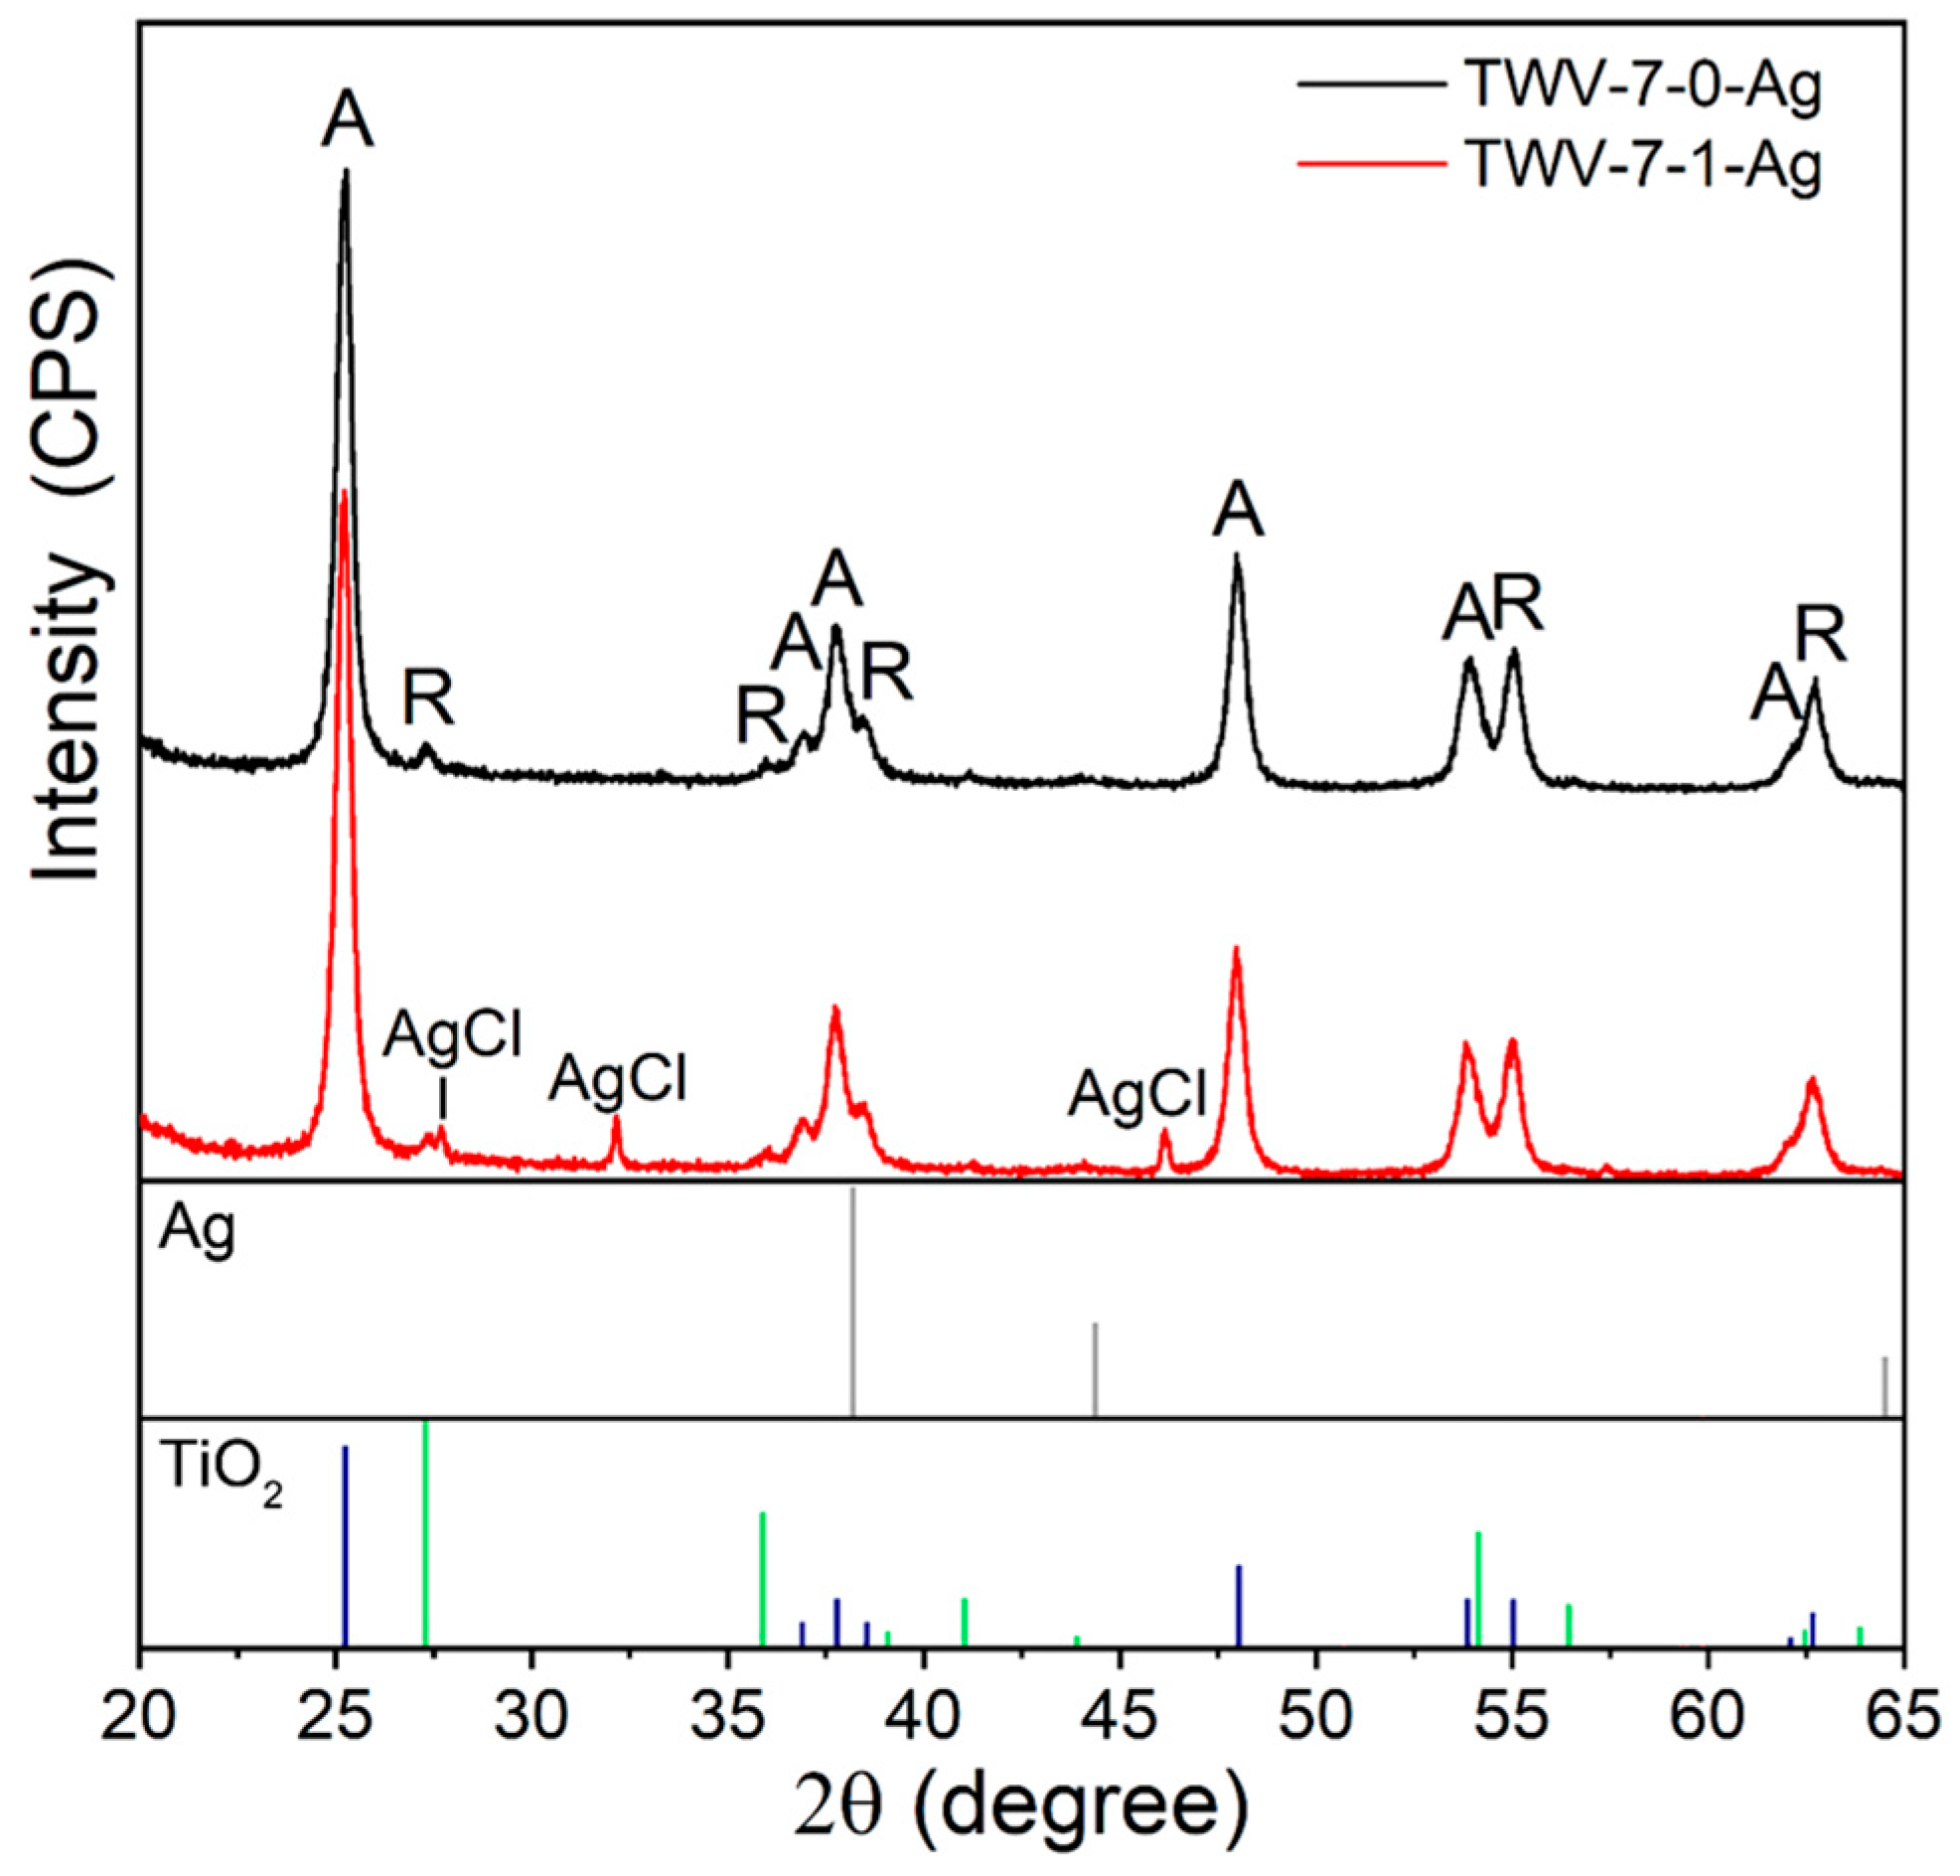
3.1.4. XRD Analysis
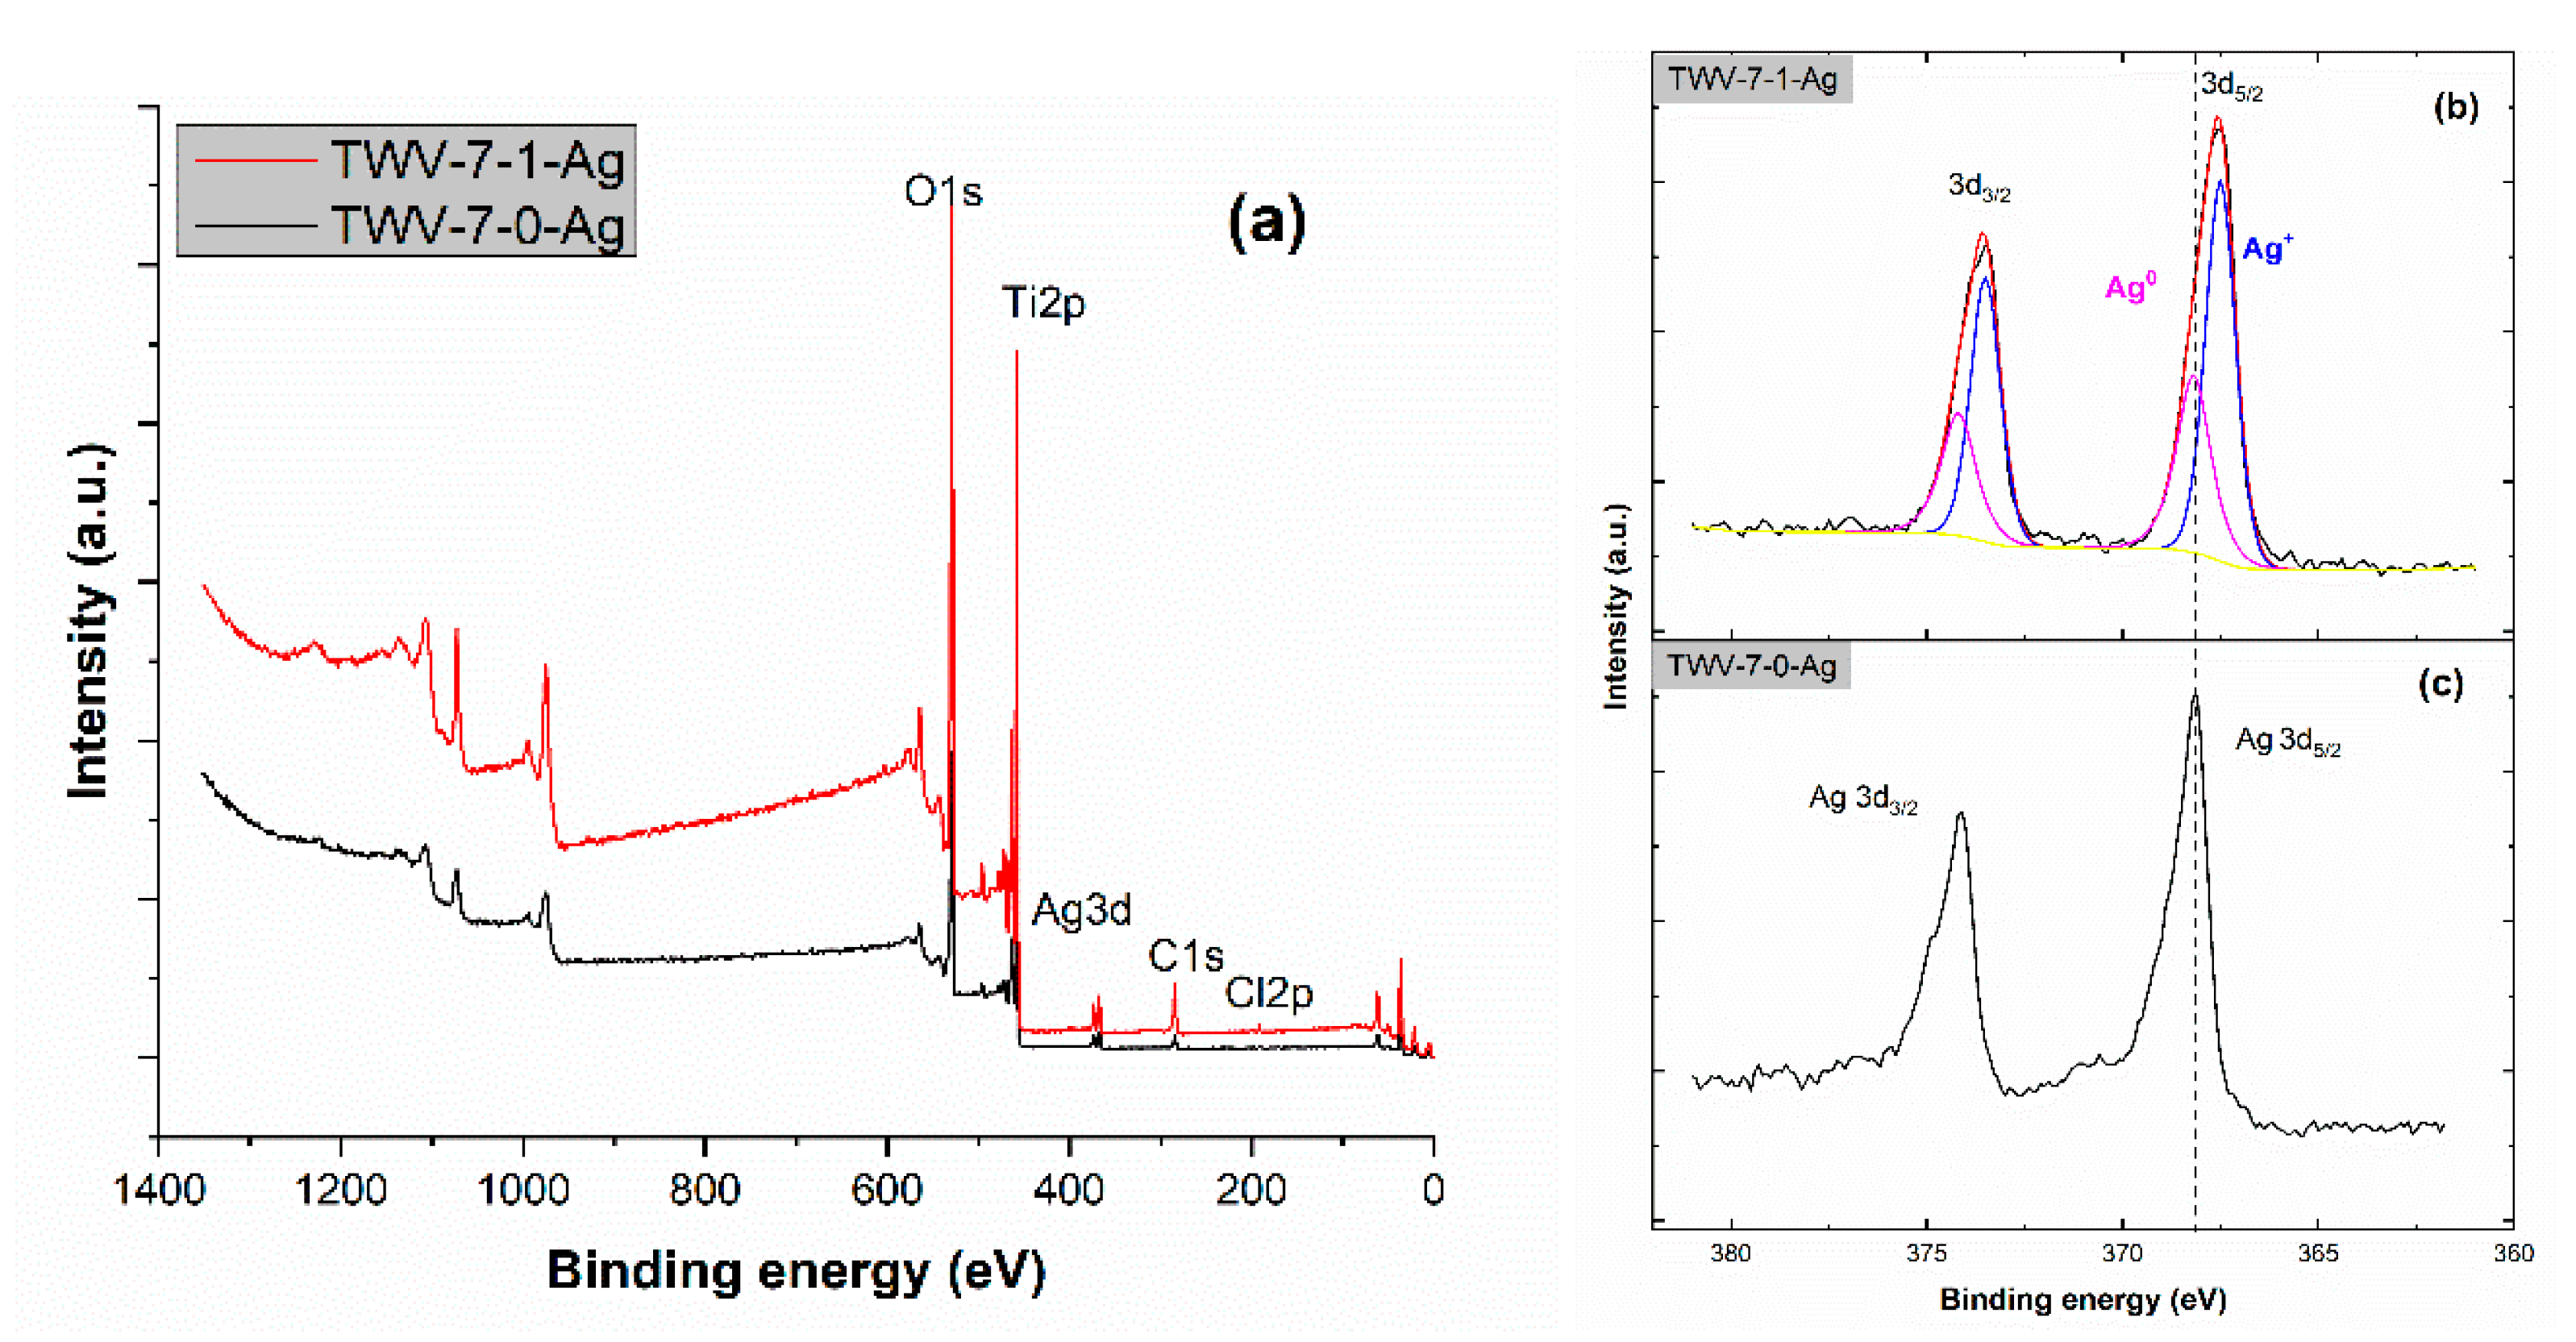
3.1.5. XPS Analysis
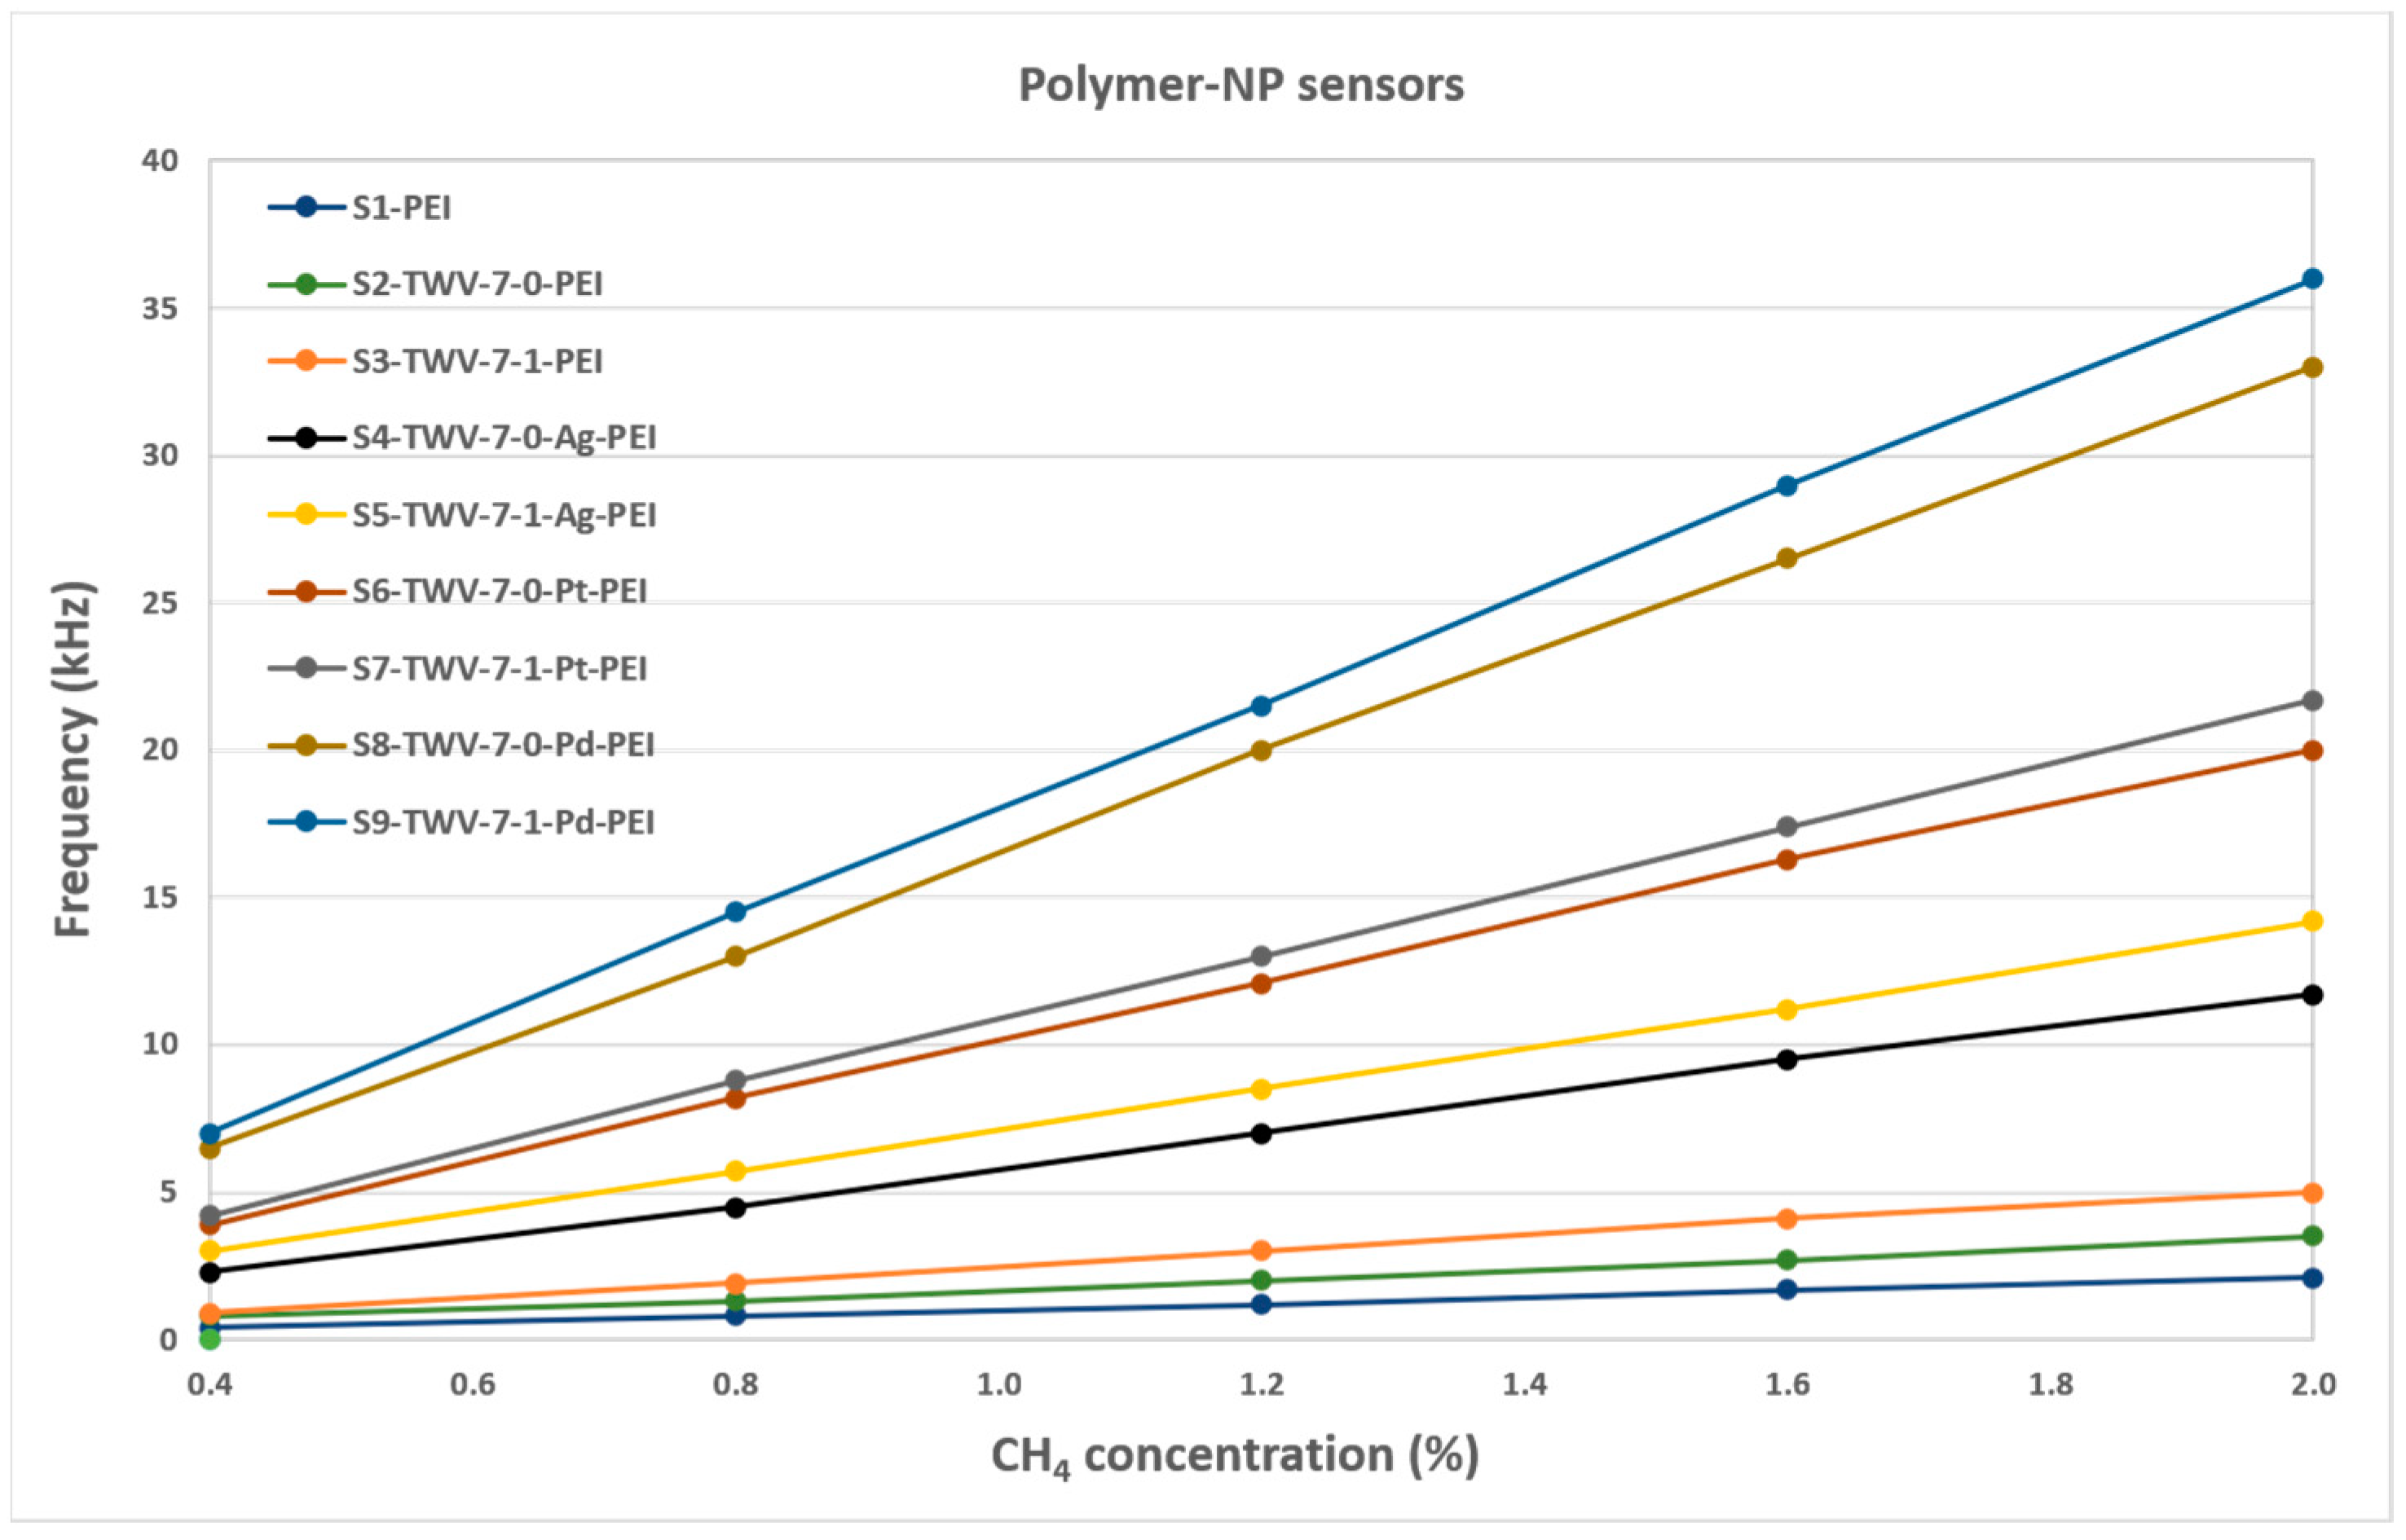
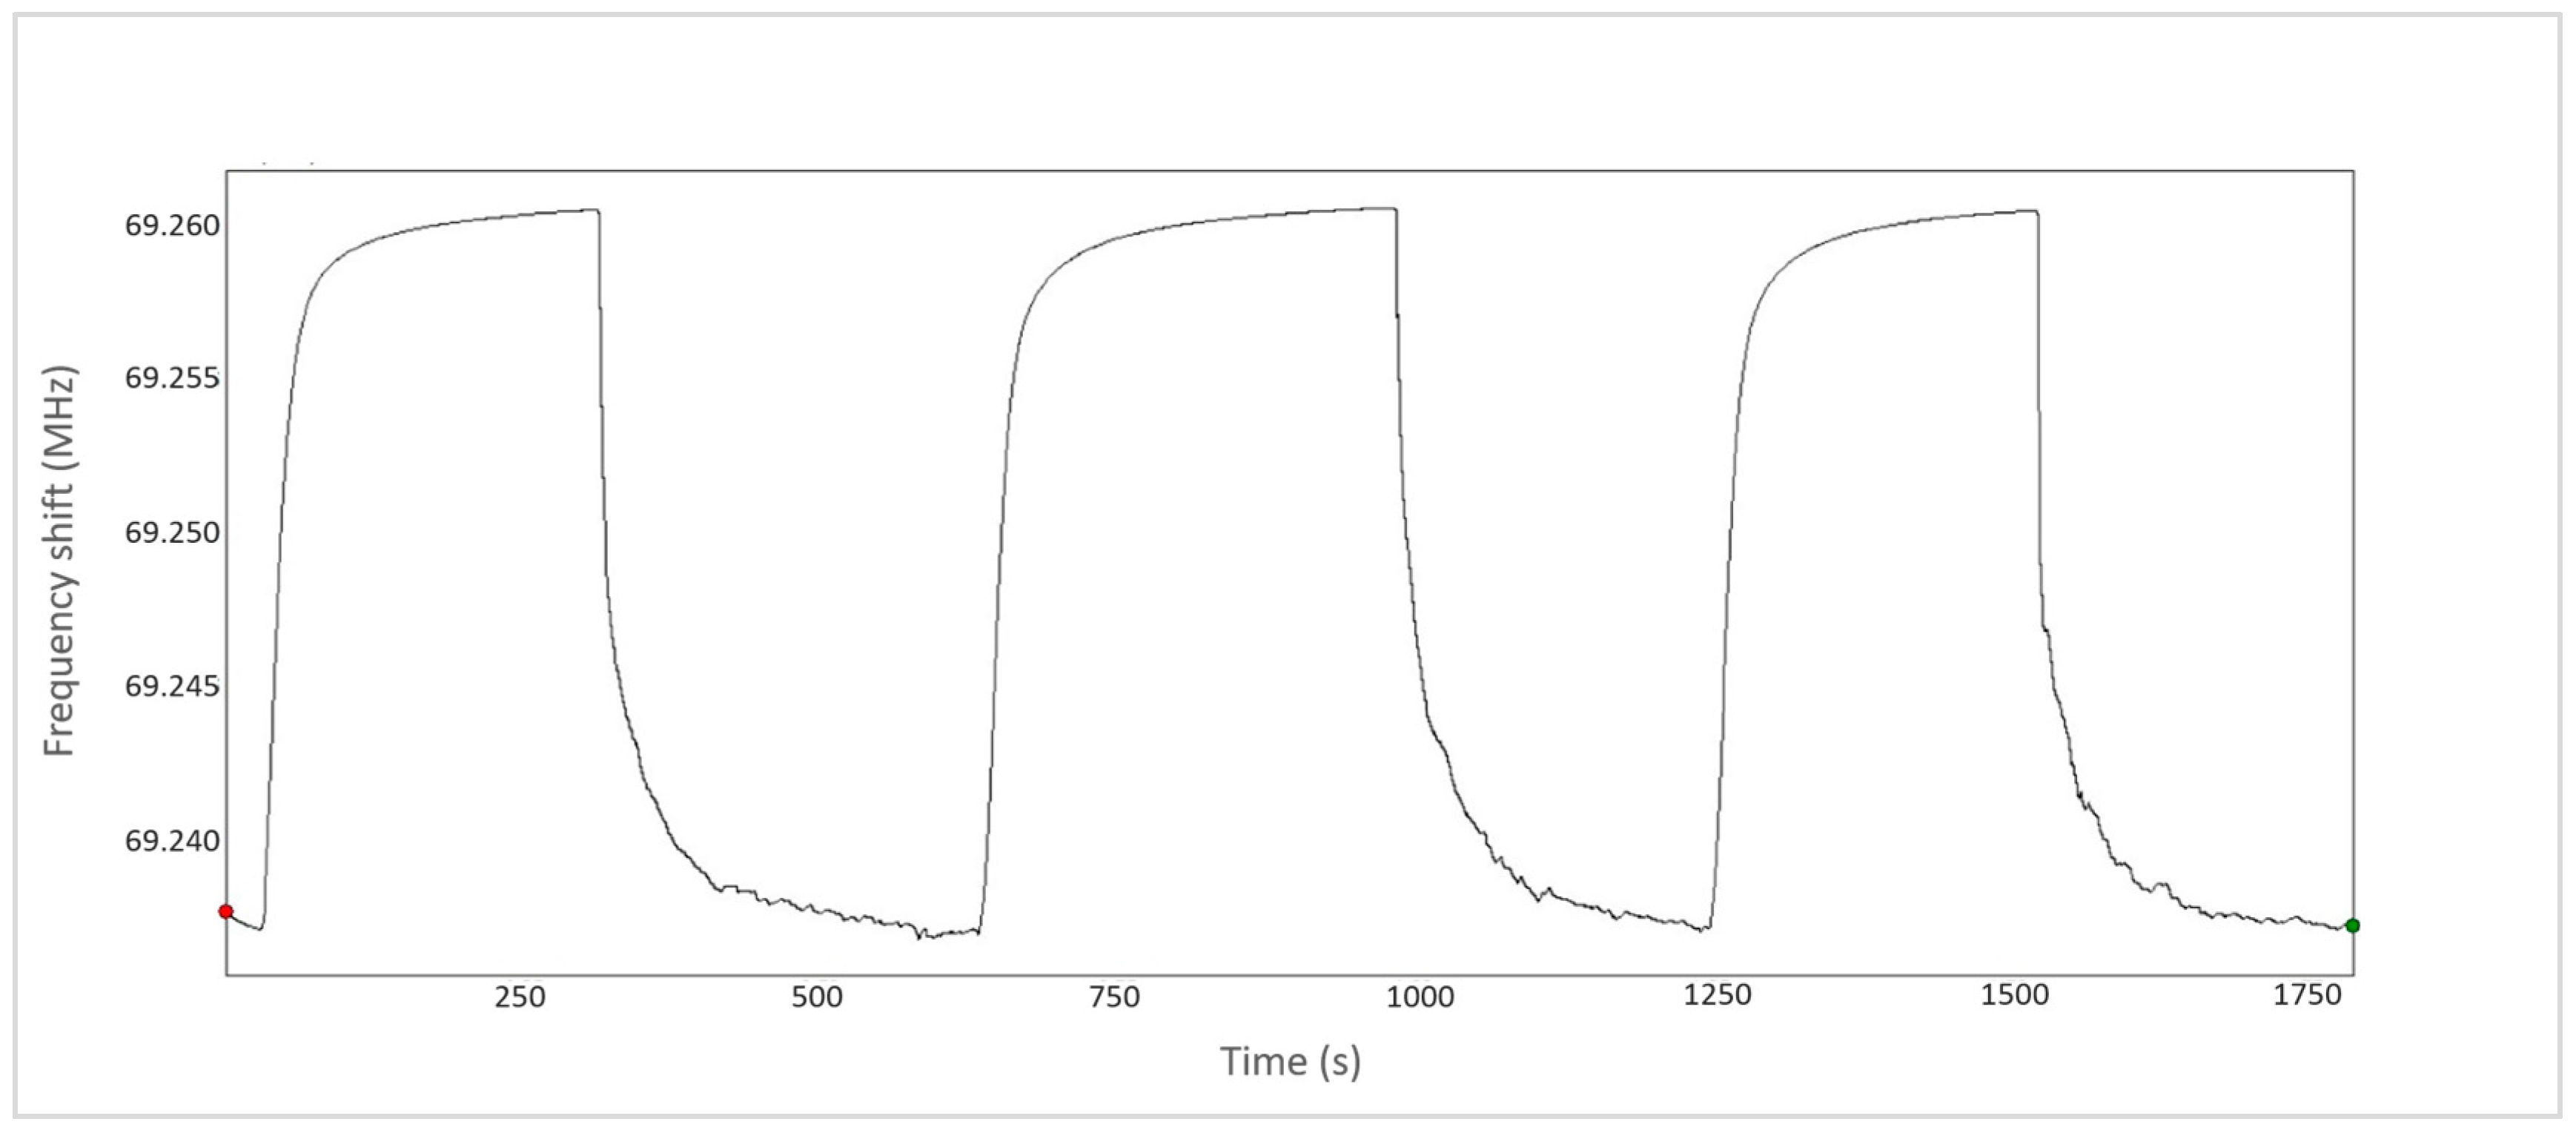
3.2. Characterization of Gas-Sensing Performance
4. Conclusions
Author Contributions
Funding
Data Availability Statement
Acknowledgments
Conflicts of Interest
References
- Aldhafeeri, T.; Tran, M.-K.; Vrolyk, R.; Pope, M.; Fowler, M. A Review of Methane Gas Detection Sensors: Recent Developments and Future Perspectives. Inventions 2020, 5, 28. [Google Scholar] [CrossRef]
- Asadzadeh, S.; de Oliveira, W.J.; de Souza Filho, C.R. UAV-Based Remote Sensing for the Petroleum Industry and Environmental Monitoring: State-of-the-Art and Perspectives. J. Pet. Sci. Eng. 2022, 208, 109633. [Google Scholar] [CrossRef]
- Ramsden, A.E.; Ganesan, A.L.; Western, L.M.; Rigby, M.; Manning, A.J.; Foulds, A.; France, J.L.; Barker, P.; Levy, P.; Say, D.; et al. Quantifying fossil fuel methane emissions using observations of atmospheric ethane and an uncertain emission ratio. Atmos. Chem. Phys. 2022, 22, 3911–3929. [Google Scholar] [CrossRef]
- Nagahage, I.S.P.; Nagahage, E.A.A.D.; Fujino, T. Assessment of the Applicability of a Low-Cost Sensor–Based Methane Monitoring System for Continuous Multi-Channel Sampling. Environ. Monit. Assess. 2021, 193, 509. [Google Scholar] [CrossRef] [PubMed]
- Xue, D.P.; Wang, Y.; Zhang, Z.Y.; Cao, J.L. Porous In2O3 nanospheres with high methane sensitivity: A combined experimental and first-principle study. Sens. Actuators A Phys. 2020, 305, 111944. [Google Scholar] [CrossRef]
- Jiao, M.-Z.; Chen, X.-Y.; Hu, K.-X.; Qian, D.-Y.; Zhao, X.-H.; Ding, E.-J. Recent developments of nanomaterials-based conductive type methane sensors. Rare Met. 2021, 40, 1515–1527. [Google Scholar] [CrossRef]
- Lu, N.; Fan, S.; Zhao, Y.; Yang, B.; Hua, Z.; Wu, Y. A selective methane gas sensor with printed catalytic films as active filters. Sens. Actuators B Chem. 2021, 347, 130603. [Google Scholar] [CrossRef]
- De-Giorgio, F.; Grassi, V.M.; Vetrugno, G.; Rossi, R.; Fucci, N.; d’Aloja, E.; Pascali, V.L. Homicide by methane gas. Forensic Sci. Int. 2012, 221, e1–e3. [Google Scholar] [CrossRef]
- Bezdek, M.J.; Luo, S.X.L.; Ku, K.H.; Swager, T.M. A chemiresistive methane sensor. Proc. Natl. Acad. Sci. USA 2021, 118, e2022515118. [Google Scholar] [CrossRef]
- Vizireanu, S.; Constantinoiu, I.; Satulu, V.; Stoica, D.S.; Viespe, C. High-Sensitivity H2 and CH4 SAW Sensors with Carbon Nanowalls and Improvement in Their Performance after Plasma Treatment. Chemosensors 2023, 10, 566. [Google Scholar] [CrossRef]
- Shi, J.; Jiang, Y.; Duan, Z.; Li, J.; Yuan, Z.; Tai, H. Designing an optical gas chamber with stepped structure for non-dispersive infrared methane gas sensor. Sens. Actuators A Phys. 2024, 367, 115052. [Google Scholar] [CrossRef]
- Dong, W.; Sugai, Y.; Wang, Y.; Zhang, H.; Zhang, X.; Sasaki, K. Experimental Study on Enhanced Methane Detection Using an MEMS-Pyroelectric Sensor Integrated with a Wavelet Algorithm. ACS Omega 2024, 9, 19956–19967. [Google Scholar] [CrossRef] [PubMed]
- Fu, L.; You, S.; Li, G.; Li, X.; Fan, Z. Application of Semiconductor Metal Oxide in Chemiresistive Methane Gas Sensor: Recent Developments and Future Perspectives. Molecules 2023, 28, 6710. [Google Scholar] [CrossRef] [PubMed]
- Zhao, Y.; Wang, S.; Yuan, W.; Fan, S.; Hua, Z.; Wu, Y.; Tian, X. Selective detection of methane by Pd-In2O3 sensors with a catalyst filter film. Sens. Actuators B Chem. 2021, 328, 129030. [Google Scholar] [CrossRef]
- Cao, R.; Ding, H.; Kim, K.-J.; Peng, Z.; Wu, J.; Culp, J.T.; Ohodnicki, P.R.; Beckman, E.; Chen, K.P. Metal-organic framework functionalized polymer coating for fiber optical methane sensors. Sens. Actuators B Chem. 2020, 324, 128627. [Google Scholar] [CrossRef]
- Tian, X.; Cui, X.; Lai, T.; Ren, J.; Yang, Z.; Xiao, M.; Wang, B.; Xiao, X.; Wang, Y. Gas sensors based on TiO2 nanostructured materials for the detection of hazardous gases: A review. Proc. Natl. Acad. Sci. USA 2021, 3, 390–403. [Google Scholar] [CrossRef]
- Parrino, F.; Pomilla, F.R.; Camera-Roda, G.; Loddo, V.; Palmisano, L. Titanium Dioxide (TiO2) and Its Applications, Metal Oxides; Parrino, F., Palmisano, L., Eds.; Elsevier: Amsterdam, The Netherlands, 2021; Chapter 2; pp. 13–66. [Google Scholar]
- Ramanavicius, S.; Jagminas, A.; Ramanavicius, A. Gas Sensors Based on Titanium Oxides. Coatings 2022, 12, 699. [Google Scholar] [CrossRef]
- Comert, B.; Akin, N.; Donmez, M.; Saglam, S.; Ozcelik, S. Titanium Dioxide Thin Films as Methane Gas Sensors. IEEE Sens. J. 2016, 16, 8890–8896. [Google Scholar] [CrossRef]
- Tong, X.; Shen, W.; Chen, X. Enhanced H2S sensing performance of cobalt doped free-standing TiO2 nanotube array film and theoretical simulation based on density functional theory. Appl. Surf. Sci. 2019, 469, 414–422. [Google Scholar] [CrossRef]
- Saruhan, B.; Fomekong, R.L.; Nahirniak, S. Review: Influences of Semiconductor Metal Oxide Properties on Gas Sensing Characteristics. Front. Sens. 2021, 2, 657931. [Google Scholar] [CrossRef]
- Santos, E.; Catto, A.C.; Peterline, A.F.; Avansi, W.J. Transition metal (Nb and W) doped TiO2 nanostructures: The role of metal doping in their photocatalytic activity and ozone gas-sensing performance. Appl. Surf. Sci. 2022, 579, 152146. [Google Scholar] [CrossRef]
- Li, Z.; Ding, D.; Ning, C. p-Type hydrogen sensing with Al- and V-doped TiO2 nanostructures. Nanoscale Res. Lett. 2013, 8, 25. [Google Scholar] [CrossRef] [PubMed]
- Al-Shomar, S.M. Investigation the effect of doping concentration in Ruthenium- TiO2 doped thin films for solar cells and sensors applications. Mater. Res. Express 2020, 7, 036409. [Google Scholar] [CrossRef]
- Conte, F.; Rossetti, I.; Ramis, G.; Vaulot, C.; Hajjar-Garreau, S.; Bennici, S. Low Metal Loading (Au, Ag, Pt, Pd) Photo-Catalysts Supported on TiO2 for Renewable Processes. Materials 2022, 15, 2915. [Google Scholar] [CrossRef] [PubMed]
- Belchi, R.; Habert, A.; Foy, E.; Gheno, A.; Vedraine, S.; Antony, R.; Ratier, B.; Bouclé, J.; Herlin-Boime, N. One-Step Synthesis of TiO2/Graphene Nanocomposites by Laser Pyrolysis with Well-Controlled Properties and Application in Perovskite Solar Cells. ACS Omega 2019, 4, 11906–11913. [Google Scholar] [CrossRef] [PubMed]
- Lertthanaphol, N.; Pienutsa, N.; Chusri, K.; Sornsuchat, T.; Chanthara, P.; Seeharaj, P.; Kim-Lohsoontorn, P.; Srinives, S. One-Step Hydrothermal Synthesis of Precious Metal-Doped Titanium Dioxide–Graphene Oxide Composites for Photocatalytic Conversion of CO2 to Ethanol. ACS Omega 2021, 6, 35769–35779. [Google Scholar] [CrossRef] [PubMed]
- Sathasivam, S.; Bhachu, D.S.; Lu, Y.; Chadwick, N.; Althabaiti, S.A.; Alyoubi, A.O.; Basahel, S.N.; Carmalt, C.J.; Parkin, I.P. Doped TiO2 with Enhanced Photocatalytic and Optoelectrical Properties via Aerosol Assisted Chemical Vapor Deposition. Sci. Rep. 2015, 5, 10952. [Google Scholar] [CrossRef] [PubMed]
- Yang, W.; Sun, C.; Duan, Y.; Li, H.; Guo, H. Surface metal ion doped TiO2 nanowire arrays by low energy ion implantation for en-hanced photoelectrochemical performance. Ceram. Int. 2023, 49, 30395–30402. [Google Scholar] [CrossRef]
- Ngoc, T.A.N.; Ly, T.Q.T.; Vo, V.Q.G.; Nguyen, N.B.; Nguyen, Q.T.; Doan, H.V.; Le, T.K. Sol–gel synthesis of Al-doped TiO2 nanoparticles as UV filters with diminished photocatalytic activity for the application in sunscreen products. J. Sol-Gel Sci. Technol. 2023, 108, 900–911. [Google Scholar] [CrossRef]
- Spreafco, C.; Russo, D.; Degl’Innocenti, R. Laser pyrolysis in papers and patents. J. Intell. Manuf. 2022, 33, 353–385. [Google Scholar] [CrossRef]
- Goncearenco, E.; Morjan, I.P.; Dutu, E.; Scarisoreanu, M.; Fleaca, C.; Gavrila-Florescu, L.; Dumitrache, F.; Banici, A.M.; Teodorescu, V.S.; Anastasescu, C.; et al. The effect of noble metal addition on the properties of oxide semiconductors nanoparticles. J. Solid State Chem. 2022, 307, 122817. [Google Scholar] [CrossRef]
- Constantinoiu, I.; Viespe, C. ZnO Metal Oxide Semiconductor in Surface Acoustic Wave Sensors: A Review. Sensors 2020, 20, 5118. [Google Scholar] [CrossRef] [PubMed]
- Constantinoiu, I.; Miu, D.; Viespe, C. SAW Hydrogen Sensors with Pd/SnO2 Layers. Materials 2022, 15, 8012. [Google Scholar] [CrossRef] [PubMed]
- Ballantine, D.S.; White, R.M.; Martin, S.J.; Ricco, A.J.; Zellers, E.T.; Frye, G.C.; Wohtjen, H. Acoustic Wave Sensors, Theory, Design, and Physico-Chemical Applications; Academic Press: San Diego, CA, USA, 1997. [Google Scholar]
- Mandal, D.; Banerjee, S. Surface Acoustic Wave (SAW) Sensors: Physics, Materials, and Applications. Sensors 2022, 22, 820. [Google Scholar] [CrossRef] [PubMed]
- Wang, W.; Hu, H.; Liu, X.; He, S.; Pan, Y.; Zhang, C.; Dong, C. Development of a Room Temperature SAW Methane Gas Sensor Incorporating a Supramolecular Cryptophane A Coating. Sensors 2016, 16, 73. [Google Scholar] [CrossRef] [PubMed]
- Liu, X.; Shen, B.; Jiang, L.; Yang, H.; Jin, C.; Zhou, T. Study on SAW Methane Sensor Based on Cryptophane-A Composite Film. Micromachines 2023, 14, 266. [Google Scholar] [CrossRef] [PubMed]
- Ali, F.; Khan, S.B.; Asiri, A.M. Enhanced H2 generation from NaBH4 hydrolysis and methanolysis by cellulose micro-fibrous cottons as metal templated catalyst. Int. J. Hydrogen Energy 2018, 43, 6539–6550. [Google Scholar] [CrossRef]
- Goncearenco, E.; Morjan, I.P.; Fleaca, C.; Dutu, E.; Criveanu, A.; Viespe, C.; Galca, A.C.; Maraloiu, A.V.; Stan, M.S.; Fort, C.I.; et al. The Influence of SnO2 and Noble Metals on the Properties of TiO2 for Environmental Sustainability. Sustainability 2024, 16, 2904. [Google Scholar] [CrossRef]
- Dong, P.; Hou, G.; Liu, C.; Zhang, X.; Tian, H.; Xu, F.; Xi, X.; Shao, R. Origin of Activity and Stability Enhancement for Ag3PO4 Photocatalyst after Calcination. Materials 2016, 9, 968. [Google Scholar] [CrossRef]
- Wang, J.; An, C.; Zhang, M.; Qin, C.; Ming, X.; Zhang, Q. Photochemical conversion of AgCl nanocubes to hybrid AgCl–Ag nanoparticles with high activity and long-term stability towards photocatalytic degradation of organic dyes. Can. J. Chem. 2012, 90, 858. [Google Scholar] [CrossRef]
- Chu, S.; Wang, E.; Feng, F.; Zhang, C.; Jiang, J.; Zhang, Q.; Wang, F.; Bing, L.; Wang, G.; Han, D. A Review of Noble Metal Catalysts for Catalytic Removal of VOCs. Catalysts 2022, 12, 1543. [Google Scholar] [CrossRef]
- Wu, R.; Tian, L.; Li, H.; Liu, H.; Luo, J.; Tian, X.; Hua, Z.; Wu, Y.; Fan, S. A selective methane gas sensor based on metal oxide semiconductor equipped with an on-chip microfilter. Sens. Actuators B Chem. 2022, 359, 131557. [Google Scholar] [CrossRef]


| Sensor | NP | Polymer Matrix |
|---|---|---|
| S1 | - | PEI |
| S2 | TWV-7-0 | |
| S3 | TWV-7-1 | |
| S4 | TWV-7-0-Ag | |
| S5 | TWV-7-1-Ag | |
| S6 | TWV-7-0-Pt | |
| S7 | TWV-7-1-Pt | |
| S8 | TWV-7-0-Pd | |
| S9 | TWV-7-1-Pd |
| Samples | TWV-7-0 * | TWV-7-1 * | TWV-7-0-Ag | TWV-7-1-Ag | ||
|---|---|---|---|---|---|---|
| BET results | Specific surface area [m2g−1] | 9.8062 | 16.3626 | 59.623 | 56.7229 | |
| EDS results | Chemical composition [at.%] | Ag | 0 | 0 | 0.44 | 0.31 |
| W | 0.11 | 0.11 | 0.12 | 0.03 | ||
| V | 0 | 0.14 | 0 | 0.12 | ||
| Ti | 31.89 | 33.30 | 31.65 | 25.55 | ||
| O | 66.24 | 64.81 | 67.22 | 73.05 | ||
| Imp. | 1.76 | 1.64 | 0.57 | 0.94 | ||
| XRD results | Phase proportion [%] | A | 95.44 | 95.23 | 95.42 | 97.79 |
| R | 4.56 | 4.77 | 4.58 | 2.21 | ||
| Crystallite size [nm] | A | 21 | 22 | 21 | 22 | |
| R | 33 | 35 | 31 | 32 | ||
| Sensor | Sensitivity (Δf/c) (Hz/ppm) | LOD (3xn)/(Δf/c) (ppm) |
|---|---|---|
| S1-PEI | 0.10 | 294 |
| S2-TWV-7-0-PEI | 0.17 | 173 |
| S3-TWV-7-1-PEI | 0.24 | 123 |
| S4-TWV-7-0-Ag-PEI | 0.58 | 52 |
| S5-TWV-7-1-Ag-PEI | 0.72 | 42 |
| S6-TWV-7-0-Pt-PEI | 1.01 | 30 |
| S7-TWV-7-1-Pt-PEI | 1.08 | 28 |
| S8-TWV-7-0-Pd-PEI | 1.64 | 18 |
| S9-TWV-7-1-Pd-PEI | 1.79 | 17 |
Disclaimer/Publisher’s Note: The statements, opinions and data contained in all publications are solely those of the individual author(s) and contributor(s) and not of MDPI and/or the editor(s). MDPI and/or the editor(s) disclaim responsibility for any injury to people or property resulting from any ideas, methods, instructions or products referred to in the content. |
© 2024 by the authors. Licensee MDPI, Basel, Switzerland. This article is an open access article distributed under the terms and conditions of the Creative Commons Attribution (CC BY) license (https://creativecommons.org/licenses/by/4.0/).
Share and Cite
Scarisoreanu, M.; Constantinoiu, I.; Goncearenco, E.; Morjan, I.P.; Teodorescu, V.S.; Viespe, C. The Effect of Loading W&V:TiO2 Nanoparticles with Noble Metals for CH4 Detection. Chemosensors 2024, 12, 160. https://doi.org/10.3390/chemosensors12080160
Scarisoreanu M, Constantinoiu I, Goncearenco E, Morjan IP, Teodorescu VS, Viespe C. The Effect of Loading W&V:TiO2 Nanoparticles with Noble Metals for CH4 Detection. Chemosensors. 2024; 12(8):160. https://doi.org/10.3390/chemosensors12080160
Chicago/Turabian StyleScarisoreanu, Monica, Izabela Constantinoiu, Evghenii Goncearenco, Iuliana P. Morjan, Valentin Serban Teodorescu, and Cristian Viespe. 2024. "The Effect of Loading W&V:TiO2 Nanoparticles with Noble Metals for CH4 Detection" Chemosensors 12, no. 8: 160. https://doi.org/10.3390/chemosensors12080160