Article

Integrated Application of Risk Management Techniques in Developing an Analysis Method for Traditional Chinese Medicine: A Case Study of a Percolation Solution for Xiaochaihu Capsules

by
Mintong Zhao
1,†,
Yanni Tai
1,†,
Gelin Wu
2,3,*,
Feng Ding
1,
Haibin Qu
1 and
Xingchu Gong
1,4,5,*
1
Pharmaceutical Informatics Institute, College of Pharmaceutical Sciences, Zhejiang University, Hangzhou 310058, China
2
Zhejiang Pralife Pharmaceutical Co., Ltd., Taizhou 318000, China
3
Hangzhou Zansheng Pharmaceutical Co., Ltd., Hangzhou 310052, China
4
Jinhua Institute of Zhejiang University, Jinhua 321016, China
5
National Key Laboratory of Chinese Medicine Modernization, Zhejiang University, Hangzhou 310058, China
*
Authors to whom correspondence should be addressed.
These authors contributed equally to this work.
Chemosensors 2024, 12(8), 161; https://doi.org/10.3390/chemosensors12080161
Submission received: 16 May 2024 / Revised: 18 July 2024 / Accepted: 9 August 2024 / Published: 12 August 2024
(This article belongs to the Section Analytical Methods, Instrumentation and Miniaturization)

Abstract

:
Risk management should run through the entire process of method development, utilization, and maintenance. Based on the analytical quality by design (AQbD) concept, various integrated risk management techniques were used in this study to develop an analysis method for the percolation solution of Xiaochaihu capsules. During the development of the analysis method, risk assessment was conducted using an Ishikawa diagram and failure mode effects analysis, followed by method optimization using experimental design. The probability of nonconformance calculated via an exhaustive Monte Carlo method quantitatively characterized the risk magnitude of method parameter failures, leading to the establishment of a operable design region method based on risk magnitude. Validation experiments and robustness tests of the data were utilized for model refinement and initial risk review. Methodological validation of the developed method was performed, and control strategies for the analysis method were presented through a decision tree. Stability experiments demonstrated that the samples remained stable at 4 °C for 24 h. The average recovery rate fell between 98.8% and 105%, with relative standard deviations ranging from 2.73% to 4.48%. The results showed that the established analysis method exhibited robustness. This analysis method can simultaneously determine the contents of uridine, adenine, 5-hydroxymethylfurfural, and guanosine. This method can also be employed for process control during percolation. This study integrated various risk management techniques to develop and maintain the analysis method, and this approach can potentially be extended to other analytical methods.

1. Introduction

To efficiently develop analytical methods, the concept of analytical quality by design (AQbD) is increasingly being applied in the pharmaceutical industry [1,2,3]. Researchers have utilized AQbD for the development of traditional Chinese medicine (TCM), fingerprinting methods, and content determination methods [4,5,6]. Some researchers have also proposed new processes for the development of analysis methods for TCM [7]. Overall, for complex TCM systems, AQbD has demonstrated advantages such as fewer experimental trials, higher method reliability, deeper process understanding, and time savings [8,9,10].
Risk management is a key aspect of AQbD implementation [11,12,13]. Various risk management techniques are recommended in the ICH Q9 guideline [14]. Ishikawa diagrams are commonly employed due to their simplicity and convenience. Researchers often use Ishikawa diagrams to list all factors that may affect the performance of analytical methods from perspectives such as equipment, materials, operation methods, and environment [15]. Some researchers, based on prior knowledge and preliminary experimental data, utilize failure mode effects analysis (FMEA) [16], failure mode effect and criticality analysis [17], cause-and-effect matrices [18], and red-yellow-green risk matrices [19] for risk analysis to identify potential critical factors affecting critical method attributes (CMAs). Furthermore, researchers have combined techniques such as principal component analysis and design of experiments (DOE) [20] with risk analysis tools to screen critical method parameters (CMPs). For instance, after investigating CMPs through experiment design, risk assessment can be conducted using Pareto charts [21].
Currently, in most research on the development of analytical methods using AQbD, the authors tend to only focus on risk assessment before conducting DOE, while overlooking risk management during the construction of the method operable design region (MODR) and after the method has been implemented. In the later stage of implementation, establishing control strategies is crucial to ensuring that the analytical method remains in a controlled state and maintains the required analytical performance. However, in most current reports, the control strategy information provided by method developers often fails to consider abnormal signals indicated by instruments such as high-performance liquid chromatography (HPLC) or the impact of the analytical object’s characteristics on the analysis process [22,23], especially for complex TCM systems. From the perspective of the full lifecycle management of analytical methods, risk management should permeate the entire process of method development, utilization, and maintenance.
A Xiaochaihu capsule is a Chinese patent medicine and it is made from Apiaceae plant Bupleurum chinense DC., Lamiaceae plant Scutellaria baicalensis Georgi, Araceae plant Pinellia ternata (Thunb.) Makino (ginger pinellia), Campanulaceae plant Codonopsis pilosula (Franch.) Nannf., Zingiberaceae plant Zingiber officinale Roscoe (ginger), Fabaceae plant Glycyrrhiza glabra L., and Rhamnaceae plant Ziziphus jujuba Mill. Xiaochaihu capsules are used clinically to induce perspiration, disperse heat, soothe the liver, and harmonize the stomach [24].
Ginger–ginger pinellia percolate (GGPP) serves as a crucial intermediate of Xiaochaihu capsules [25]. It was prepared by soaking the ginger pinellia and ginger in a 70% ethanol solution for 24 h, followed by a slow percolation process. Subsequently, GGPP was collected. GGPP contains important active components such as uridine, adenine, guanosine, and 5-hydroxymethylfurfural [26]. Both uridine and adenine have immune-regulating functions [27,28], while guanosine can promote the proliferation of white blood cells [29]. 5-Hydroxymethylfurfural is derived from the dehydration of monosaccharides during the processing of ginger pinellia [30,31], reflecting the influence of medicinal processing on intermediates. 5-Hydroxymethylfurfural also exhibits anti-inflammatory effects [32,33]. The literature has developed analysis methods for the chemical components in Xiaochaihu capsule preparation [4], but currently, no method is available to detect the abovementioned components in the GGPP. Therefore, uridine, guanosine, 5-hydroxymethylfurfural, and adenine were selected as quantitative detection components for method development in this study.
Risk management techniques are combined with the AQbD concept to develop a simple, fast, and robust analytical method for the detection of four target compounds in the GGPP in this work. Risk analysis was performed through several steps. The factors that may affect the analysis method were found using an Ishikawa diagram. Risk assessment was conducted based on the quantitative analysis results of FMEA, identifying potential CMPs. The risk magnitude of method failures was quantitatively characterized with a probability value using an exhaustive Monte Carlo method. A risk magnitude threshold of 10% was set to establish the MODR, thereby achieving risk reduction. Within the constructed MODR, a recommended operational space was selected, and its robustness was validated. Risk acceptance was then carried out within this reliable operational space. Subsequently, the newly generated validation data were used to update the MODR. This process achieved the initial risk review. Robustness testing and methodological validation were conducted according to the ICH Q14 guidelines [34]. Finally, prior knowledge and empirical knowledge obtained during the experiments were integrated to provide control strategies for the developed method in the form of a decision tree. Building the MODR and formulating control strategies are both aspects of risk control. Using the development of the analysis method for the intermediate of Xiaochaihu capsules as an example, this study attempts to demonstrate the integrated application of risk management techniques in developing an analytical method.

2. Materials and Methods

2.1. Chemicals and Reagents

Acetonitrile and methanol (chromatography grade) were purchased from Merck (Darmstadt, Germany). Both formic acid (chromatography grade, batch number 20C8562) and acetic acid (chromatography grade, batch number 2D5042) were purchased from ROE Scientific (Newark, DE, USA). Ammonium acetate (chromatography grade, batch number D2121022) was obtained from Aladdin Biochemical Technology Co., Ltd. (Shanghai, China). Ammonium formate (chromatography grade, batch number C10371963) was purchased from Merck (Darmstadt, Germany). Anhydrous ethanol (batch number 20200710) was obtained from Yonghua Chemical Co., Ltd. (Suzhou, China). The adenine reference substance (batch number DC17812), adenine reference substance (batch number DC14933), 5-hydroxymethylfurfural reference substance (batch number DC13141), and guanosine reference substance (batch number DC17810) were purchased from Shanghai Xushuo Biotechnology Co., Ltd. (Shanghai, China). The purities of the four reference substances were greater than 98%. P. ternata (Thunb.) Makino (ginger pinellia) (batch number 210101) was purchased from Anhui Xintai Pharmaceutical Co., Ltd. (Bozhou, China). Z. officinale Roscoe (ginger) was purchased from Yonghui Supermarket (Xixi Yintai City Store, Hangzhou, China).

2.2. Preparation of Sample Solution

The ginger and ginger pinellia were ground into coarse powder using a pulverizer (DFY-200, Wenling Linda Mechanical Co., Ltd., Wenling, China). The ginger was sliced using a slicing machine (2139AL hand/electric slicing machine, Guangzhou Yecheng Food Machinery Co., Ltd., Guangzhou, China). A total of 26.6 g of coarse ginger pinellia powder and 20.0 g of ginger slices were weighed and placed in a conical flask. Then, 200 mL of a 70% ethanol solution was added as a solvent. A magnetic stir bar was also added, and the conical flask was placed on a magnetic stirrer for thorough mixing and soaking for 24 h. Afterward, the above system was packed into a percolation column and slowly percolated, and 167 mL of percolate was collected. A total of 1.5 mL of GGPP was removed and concentrated to dryness using a centrifugal concentrator (RVT4104-230, Thermo Fisher Scientific, Waltham, MA, USA). Next, 1000 μL of pure water was added for redissolution. The supernatant was collected after centrifugation at 12,000 rpm for 10 min using a centrifuge (5424, Eppendorf Ebende China Co., Ltd., Shanghai, China), yielding the sample solution.

2.3. Preparation of Standard Solution

The reference substances uridine, guanosine, adenine, and 5-hydroxymethylfurfural were accurately weighed and placed into a 5 mL volumetric flask. These substances were then dissolved in a 40% methanol solution, and the volume was adjusted to the mark, yielding a mixed reference solution containing 30.0 μg/mL uridine, 19.3 μg/mL adenine, 35.0 μg/mL 5-hydroxymethylfurfural, and 64.0 μg/mL guanosine.

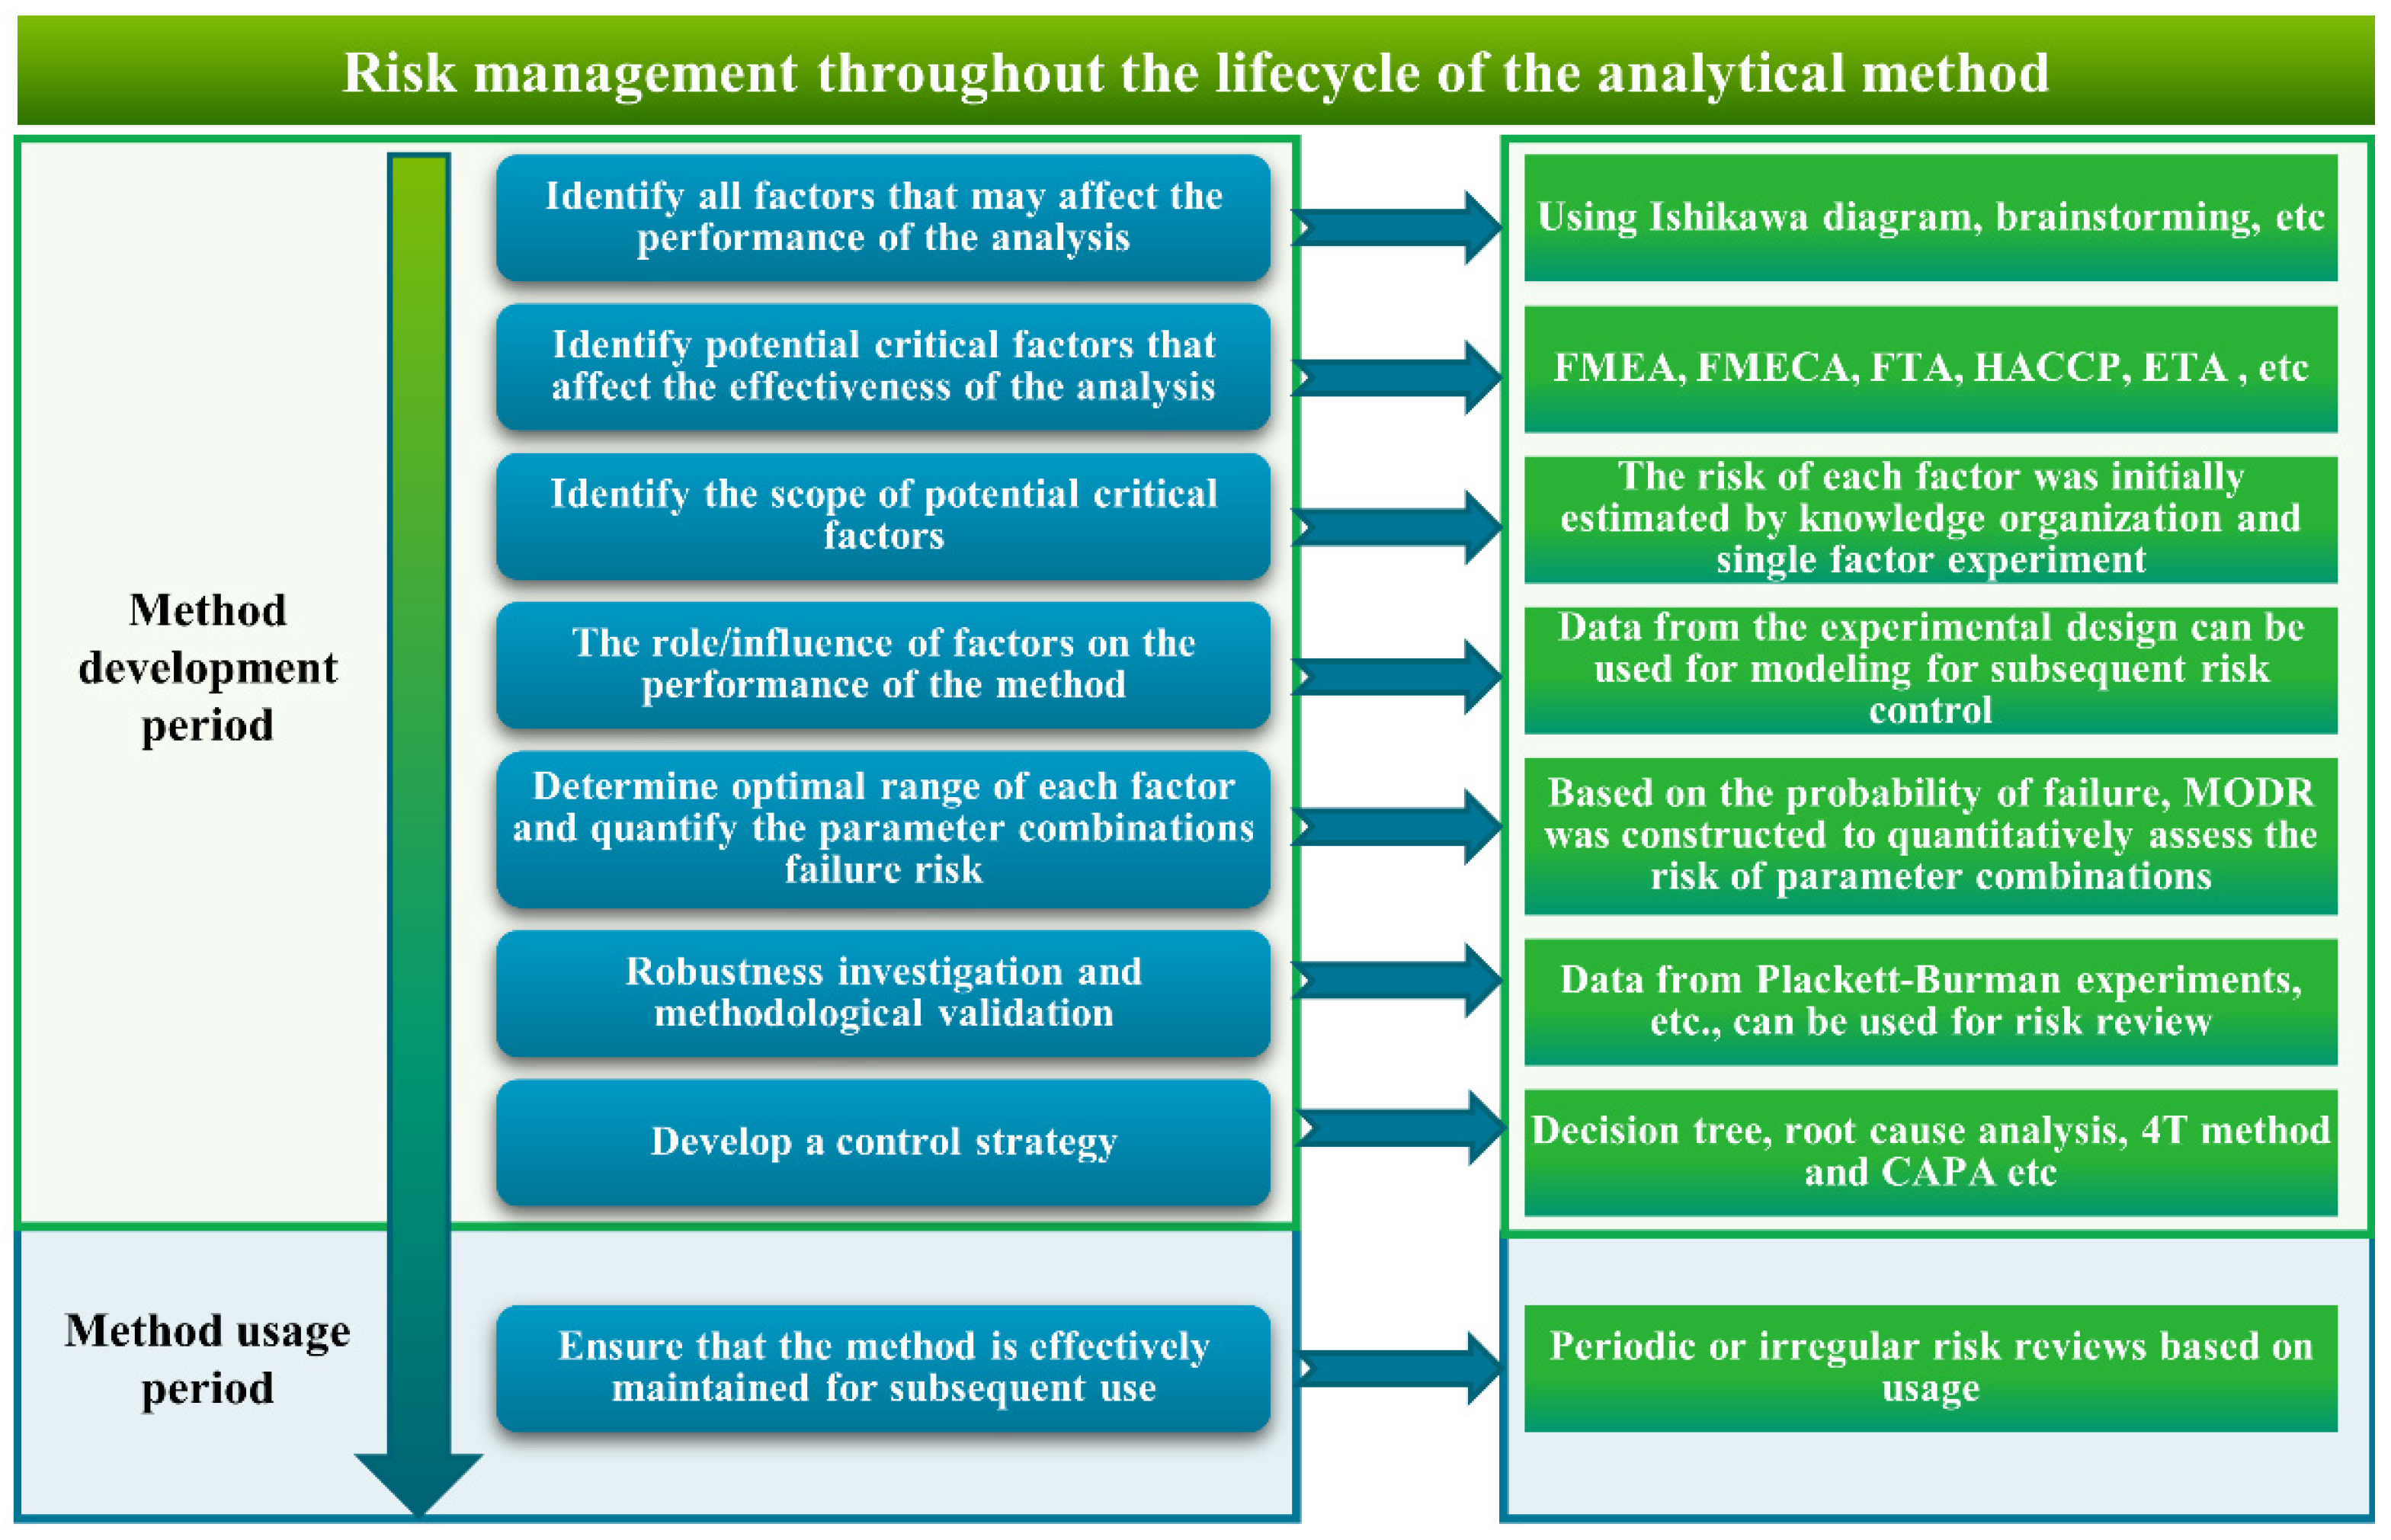
2.4. Risk Management Process throughout the Entire Lifecycle of the Analytical Method

This study focuses on the entire process of method development, utilization, and maintenance, outlining partial risk management techniques that can be employed at various stages throughout the lifecycle of the analytical method, as shown in Figure 1.

2.5. Preliminary Screening of CMPs through Single-Factor Experiments

We independently analyzed the impact of each high-risk method parameter on the development of the analytical method through single-factor experiments, including detection wavelength, selection of chromatographic column, composition of the mobile phase system, mobile phase pH, flow rate, column temperature, mobile phase volume ratio, temperature of centrifugal concentration during sample preparation, reconstitution solvent and volume. Sample analysis was performed using an HPLC system (1100, Agilent Technologies, Santa Clara, CA, USA).

2.6. Experimental Design

Response surface methodology is widely employed to assess the effects of process parameters and process optimization [35]. Due to the complexity of TCM systems and the involvement of multiple parameters in analytical methods, a central composite design (CCD) was adopted to evaluate the influence of chromatographic analysis conditions (X) on the method evaluation indicators (Y). CCD is an efficient and flexible experimental design method that allows obtaining required information with a small number of experiments. The linear effects, nonlinear effects, and interaction effects of the factors can be described with first-order terms, quadratic terms, and interaction terms based on the data obtained from CCD [36,37]. The use of CCD aims to optimize the analytical parameters. While the robustness of the selected operational space was explored using Plackett–Burman design.

2.7. Data Processing

A quantitative model was established between various evaluation indicators and method parameters [38]. Design Expert 12.0.1.0 (Stat-Ease Inc., Minneapolis, MN, USA) was utilized to simplify the model through stepwise regression, with the significance levels for adding and removing terms set to 0.10. The MODR [39] was calculated using a self-developed program of MATLAB (R2022b, MathWorks Inc., Natick, MA, USA). The method requires calculating the relative standard deviation (RSD) of each indicator firstly by using the data collected from repeated experiments. Then, random values for each indicator were generated using the RSD value many times. These random values were used to establish mathematical models. After that, the models were used to predict the results of different parameter combinations. After counting the results that meet all preset standards, the compliance probability P can be calculated. The value of 1-P is used to quantify the magnitude of risk. The maximum acceptable risk threshold was set to 0.1, and parameter combinations with risk values below this threshold were identified as the MODR. The step sizes for X1, X2, X3, and X4 were 0.050, 0.025, 0.001, and 0.040, respectively, with 1500 simulation runs.

2.8. Control Strategy Formulation

According to the ICH Q14 guidelines, determining the control strategy for an analytical method is a crucial aspect of the AQbD. The analytical method control strategy refers to ‘a series of planned control measures derived from an understanding of the current analytical method, ensuring the performance of the analytical method and the quality of the measurement results’ [34]. Therefore, considering the characteristics of the study subject and the instrument itself and combined with prior knowledge and experiential knowledge acquired during the experimental process, this study formulates the control strategy in the form of a decision tree.

3. Results and Discussion

3.1. Determination of ATP

The first step in developing an analytical method based on the AQbD concept is to define the ATP [40]. The objective of this study was to develop a simple, rapid, and robust analytical method for detecting four target compounds in GGPP. Therefore, the defined ATP is presented as follows (Table 1):

3.2. The Ishikawa Diagram Analysis

The Ishikawa diagram can be used to systematically summarize all potential method parameters involved, classify the reasons for potential risks, and analyze the relationships between analytical results and factors such as human factors, instruments, materials, sample preparation, and environmental conditions. In the Ishikawa diagram (Figure 2), 34 potential factors that may influence the analysis results are listed.

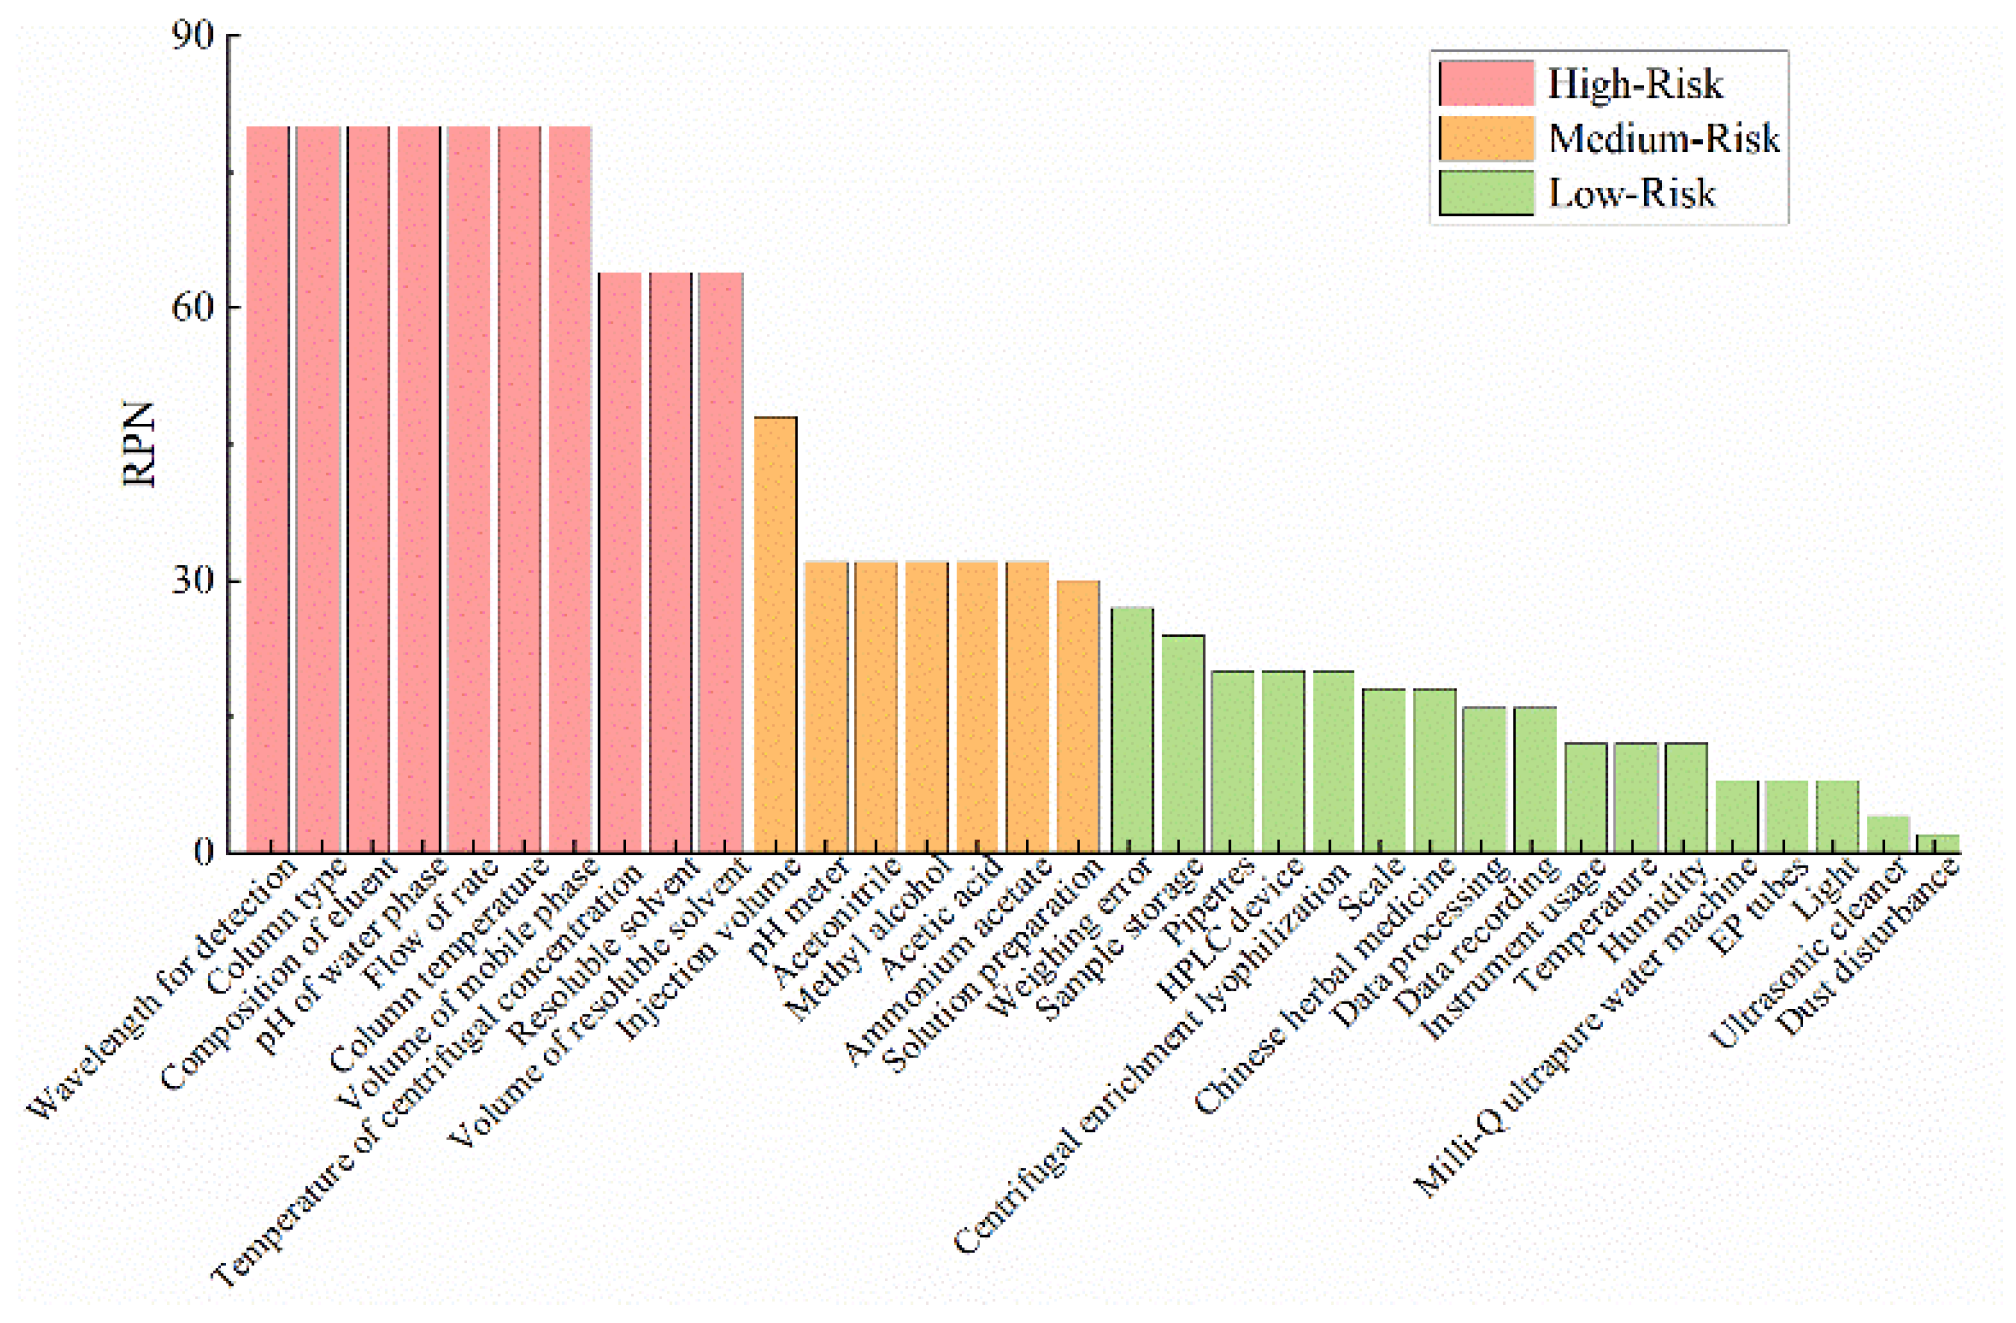
3.3. Preliminary FMEA Risk Assessment

FMEA is a risk management technique recommended in the ICH Q9 guidelines [14] that systematically analyzes systems to identify potential failure modes, causes of failure, and their impact on system performance [41]. In FMEA, the severity S, occurrence likelihood O, and detectability D of potential failure causes are assessed to calculate the risk priority number (RPN), quantifying and ranking the severity of risks. The RPN is calculated by S × O × D. A 1 ≤ RPN ≤ 29 indicates low risk, 30 ≤ RPN ≤ 59 indicates medium risk, and 60 ≤ RPN ≤ 125 indicates high risk [42]. Low- and medium-risk factors are considered acceptable, while high-risk factors are deemed unacceptable [43].
Based on the literature survey and previous method development experiences, the risk levels of each method parameter were determined, as shown in Table 2, and high-risk factors were identified using FMEA (Figure 3). The detection wavelength, chromatographic column, composition of the mobile phase system, mobile-phase pH, flow rate, column temperature, volume ratio of the mobile phase, temperature of the centrifugal concentration during sample preparation, reconstitution solvent, and volume were considered high-risk factors for developing the HPLC method. These high-risk factors will be individually examined during the preliminary experimental period.

3.4. Results of the Preliminary Experiments

3.4.1. Selection of the Detection Wavelength

After full wavelength scanning from 190 to 400 nm using a DAD detector, the results are shown in Supplementary Materials Figure S1. Uridine exhibited maximum absorption at 262 nm; adenine showed absorption peaks at 207 nm and 260 nm; 5-hydroxymethylfurfural had maximum absorption at 285 nm; and guanosine had the highest absorption peak at 255 nm. To avoid a decreased signal-to-noise ratio caused by end absorption, 260 nm was ultimately selected as the detection wavelength.

3.4.2. Selection of the Chromatographic Column

The four target compounds have high polarity. It is necessary to select a column with strong retention for highly polar components. Therefore, we explored the chromatographic separation of the target compounds using four different columns. The detailed results are shown in Figure S2 of Supplementary Materials. It was found that the Waters Atlantis T3 (250 mm × 4.6 mm, 5 μm) column was more suitable for the separation of the target compounds. To reduce the analysis time, a short column with a small particle size (Waters Atlantis T3, 100 mm × 2.1 mm, 3 μm) was used for subsequent experiments.

3.4.3. Selection of the Mobile Phase System, Flow Rate, and Initial Gradient

During the experimental process, the influence of different mobile phase pH values on chromatographic separation was explored, and the results are shown in Supplementary Materials Figure S3. An acetonitrile–water mobile phase system was used. By altering the flow rate, it was observed that a lower flow rate resulted in longer analysis times, while a flow rate that was too high led to increased column pressure (Supplementary Materials Figure S4). The flow rate had a significant impact on the total analysis time and the retention time of the last target peak. Therefore, subsequent studies will control the flow rate within the range of 0.20–0.30 mL/min. At 25 °C, using 100% water for the initial 7 min resulted in the best separation of peaks. Hence, a gradient elution method was used for subsequent experiments.

3.4.4. Selection of Column Temperature

The chromatograms obtained at temperatures ranging from 25 to 45 °C are provided in Figure S5 in the Supplementary Materials. A higher temperature resulted in shorter retention times of uridine, adenine, 5-hydroxymethylfurfural, and guanosine.

3.4.5. Selection of the Centrifugal Concentration Temperature

A total of 1.5 mL of GGPP was collected and concentrated to dryness by centrifugation using three conditions: no heating, heating at 35 °C, and heating at 40 °C. The dried samples were then reconstituted with 500 mL of pure water and centrifuged at 12,000 rpm for 10 min. The peak areas of the different heating methods were compared, and the results are provided in Table S1 of the Supplementary Materials. The relative standard deviation (RSD) of the peak areas for each target compound ranged from 1.8% to 3.4%. At different centrifugation temperatures, the four target compounds remained relatively stable. To reduce sample preparation time and component loss, 35 °C was chosen as the centrifugation temperature.

3.4.6. The Selection of Reconstitution Solvent and Volume

A total of 1.5 mL of GGPP was concentrated to dryness at 35 °C. Reconstitution was subsequently carried out by adding 1000 μL of pure water, 20% methanol aqueous solution, 40% methanol aqueous solution, and 60% methanol aqueous solution, respectively. After vortexing, the samples were centrifuged at 12,000 rpm for 10 min. The results of reconstitution using different solvents are provided in Supplementary Materials Figure S6. The results indicate that the components adequately dissolve in pure water. Therefore, 1000 μL of pure water was selected for reconstitution.
Based on the above, the preliminary chromatographic conditions are described as follows: a Waters Atlantis T3 (100 mm × 2.1 mm, 3 μm) column was used, and the injection volume was 2 μL. The mobile phase system consisted of acetonitrile (B) and water (A). The detection wavelength was fixed at 260 nm. According to the preliminary experimental results, the elution conditions are listed as follows: 0–7 min, 100% A; 7–15 min, 100%–X4% A (X4 needs to be determined in subsequent studies); 15–16 min, X4%–88% A; 16–20 min, 88–75% A; 20–21 min, 75–5% A; and 21–26 min, 5% A. After each run, the column was equilibrated with 100% water for 14 min. The optimized sample preparation method is described as follows: 1.5 mL of GGPP was concentrated to dryness by centrifugation, and 1000 μL of pure water was added for reconstitution. The supernatant was collected after centrifugation at 12,000 rpm for 10 min.

3.5. Results of the CCD
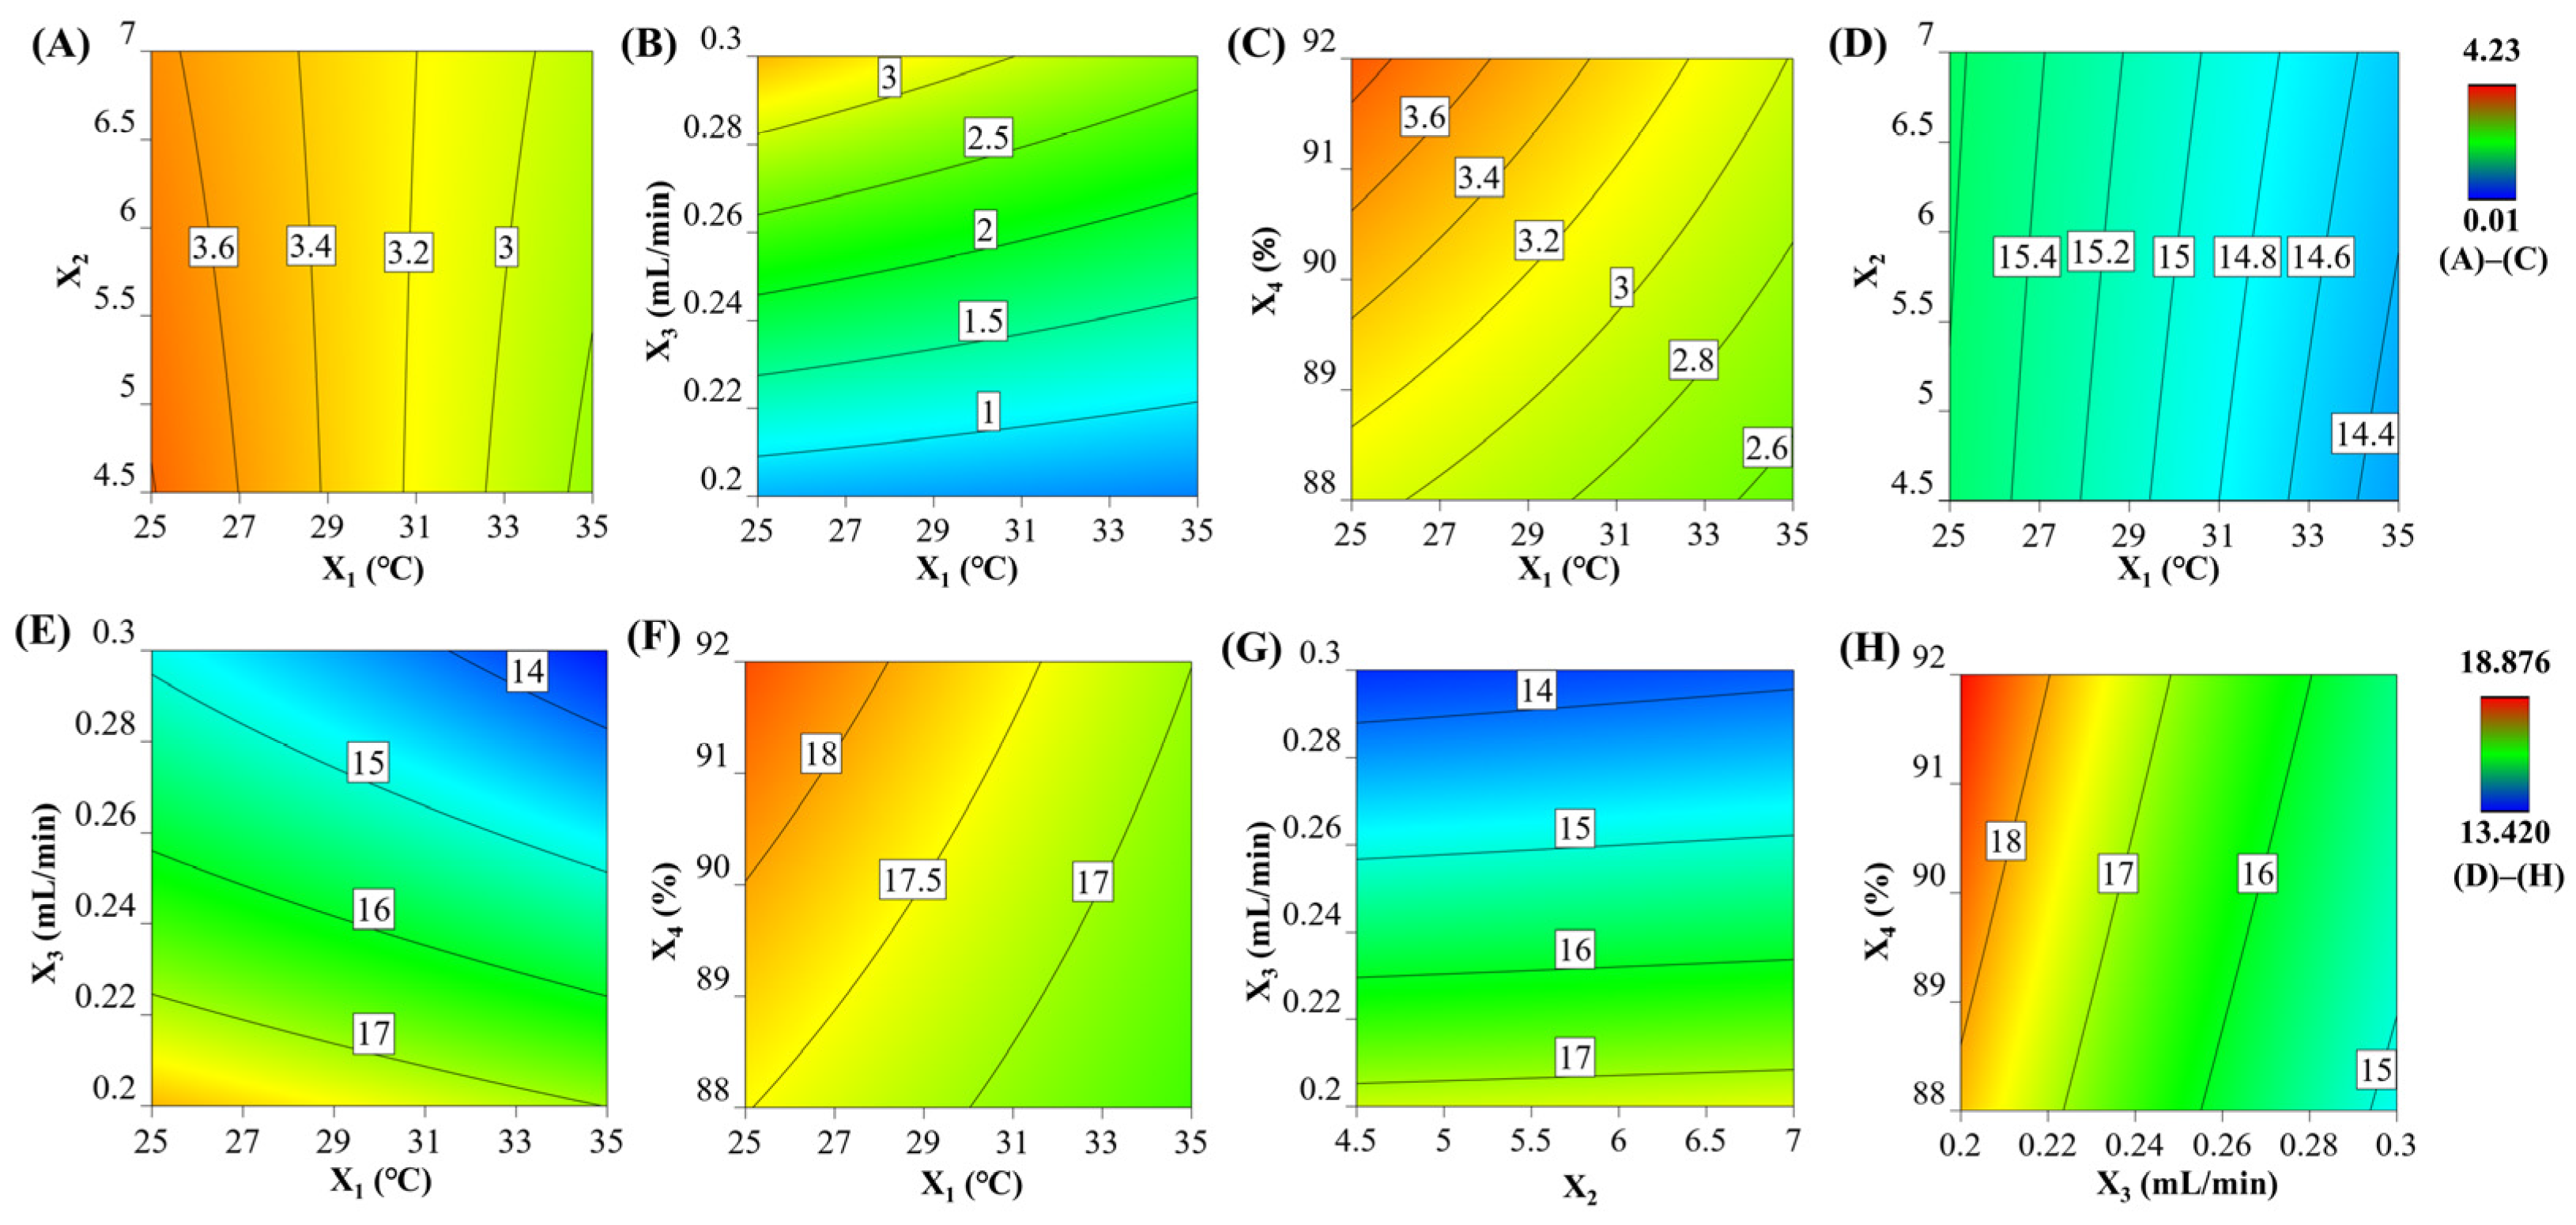
The results of preliminary experiments showed that the unknown peak is difficult to separate from uridine and that 5-hydroxymethylfurfural is difficult to separate from guanosine. Additionally, in order to reduce the analysis cost, it is necessary to minimize the analysis time. Therefore, the resolution between the unknown peak and uridine (Y1), the resolution between 5-hydroxymethylfurfural and guanosine (Y2), and the retention time of the last target peak (Y3) were defined as CMAs. The experimental design investigated the effects of column temperature (X1), pH (X2), flow rate (X3), and water composition at the end of the first gradient (X4) on the analytical results. The levels of each factor were as follows: column temperature (X1, 25.0, 30.0, or 35.0 °C), pH (X2, 4.50, 5.75, or 7.00), flow rate (X3, 0.20, 0.25, or 0.30 mL/min), and water composition at the end of the first gradient (X4, 88.0%, 90.0%, or 92.0%). The center point was repeated four times, resulting in a total of 28 experiments. Table 3 presents the method parameters and results of the CCD. As shown in Table 3, Y1 ranged from 0.53 to 3.44, Y2 ranged from 0.01 to 4.23, and Y3 ranged from 13.557 to 18.876 min.

3.6. Data Modeling

The partial regression coefficients and analysis of variance for each model equation can be found in Supplementary Materials Table S2. The R2 values for the three models are 0.8529, 0.9794, and 0.9994, respectively. The influences of factors on the analysis results are shown using response contour plots. As illustrated in Figure 4A–C, as the column temperature decreased and the pH increased, the resolution between 5-hydroxymethylfurfural and guanosine improved. A higher flow rate was advantageous for the separation of 5-hydroxymethylfurfural and guanosine. The resolution between 5-hydroxymethylfurfural and guanosine decreased with decreasing water composition at the end of the first gradient. As depicted in Figure 4D–H, a higher column temperature and flow rate facilitated the elution of the last target peak. With an increase in water composition at the end of the first gradient, the retention time of guanosine increased.

3.7. Development and Verification of the MODRs

An exhaustive Monte Carlo method was utilized to calculate the probability of non-compliance. To meet the quantitative requirements, the minimum acceptable limits of Y1 and Y2 are set to 1.5. Considering the reduction in analysis time, the upper limit of the retention time for the last target peak was set to 16 min. The MODR was determined based on the quantitative risk values. With a risk threshold set at 10%, the resulting MODR encompasses all parameter combinations where the risk of non-compliance was less than 10%. To better demonstrate the MODR, one parameter was fixed, and the calculated MODR figures are shown in Supplementary Materials Figure S7. In the constructed MODR, specific operational ranges were selected for robustness tests, which were as follows: temperature (X1): 25.0–26.0 °C; pH (X2): 6.50–7.00; flow rate (X3): 0.28–0.30 mL/min; and water composition at the end of the first gradient (X4): 89.0%–91.0%. One parameter combination inside and outside the MODR is selected for verification experiments, and the conditions and results of the verification method are shown in Supplementary Materials Table S3. The results indicate that all the indicators of the verification points within the MODR met the requirements of the MODR. The measured values were close to the predicted values, and the average relative difference (ARD) was less than 10%. The Y2 and Y3 of the verification points outside the MODR do not meet the requirements of the MODR. The above results indicated that the established MODR was relatively reliable.

3.8. Risk Review Based on the Robustness and Verification Experiment Results

This study employed a Plackett–Burman design to investigate robustness. The specific experimental conditions and results are detailed in Table S4 in the Supplementary Materials. The results indicated that the developed method can meet the analytical requirements when the parameters varied within the optimized operational range, which demonstrates robustness of the developed method. Therefore, the recommended operable space is described as follows: column temperature (X1): 25.0–26.0 °C; pH (X2): 6.50–7.00; flow rate (X3): 0.28–0.30 mL/min; and water composition at the end of the first gradient (X4): 89.0%–91.0%.
The robustness and experimental validation data were used to remodel and update the MODR, followed by a reassessment of the risks. After remodeling, the R2 values of the three models were 0.7754, 0.9856, and 0.9979, indicating that the models fit well. The significance levels (p values) of each model are less than 0.0001, which demonstrates that the models are significant. The regression coefficients and analysis of variance for each model are shown in Table 4, and the updated MODR is presented in Figure 5. Figure 5 shows the MODR reconstructed by incorporating validation experimental data and Plackett–Burman design data into the original CCD data. The renewed MODR encompassed all parameter combinations with low risk. Different color gradients represent the risk level: the redder the color, the greater the risk of non-compliance; conversely, the greener the color, the lower the risk of non-compliance. This is the initial risk review. Subsequent regular or irregular risk reviews should be conducted based on new data generated during subsequent use to enhance the robustness of the model and the adaptability of the method.

3.9. Results of Methodological Validation

From the obtained operating space, a chromatographic condition was selected. The final chromatographic conditions were determined as follows: a Waters Atlantis T3 (100 mm × 2.1 mm, 3 μm) column was used with a column temperature of 25 °C. The mobile phase consisted of acetonitrile (B) and water (A) at a pH of 7. The detection wavelength was 280 nm, and the injection volume was 2 μL. The flow rate was set to 0.30 mL/min. The following gradient elution conditions were used: 0–7.0 min, 100% A; 7.0–15 min, 90% A; 15–16 min, 90–88% A; 16–20 min, 88–75% A; 20–21 min, 75–5% A; and 21–26 min, 5% A. The chromatograms obtained under these chromatographic conditions are shown in Figure 6. Methodological validation was conducted using these chromatographic conditions. The experimental methods and results are detailed in Supplementary Materials Tables S5–S7. All the results indicate that the analytical method exhibits good precision and repeatability. Stability experiments demonstrated that the samples remained stable at 4 °C for 24 h. The average recovery rate fell between 98.8% and 105%, with relative standard deviations ranging from 2.73% to 4.48%.

3.10. Control Strategy

In the development of analytical methods, it is essential to create a decision tree based on established knowledge and experiential insights gained during the method development process. This decision tree would illustrate potential scenarios with risks—whether from instrumentation or operational factors—and strategies to mitigate these risks during the use of the analytical method. This approach aims to ensure effective monitoring and maintenance across different application conditions, maintaining consistent analytical performance. The decision tree as a means of risk management in analytical methods has not been reported previously. Based on prior knowledge and empirical insights gained during method development for this system, a control strategy was listed for the established analytical method, presented in the form of a decision tree. (Figure 7). The red text in Figure 7 represents the findings based on the current research. This structured approach can significantly enhance the robustness and reliability of analytical methods in diverse application scenarios.

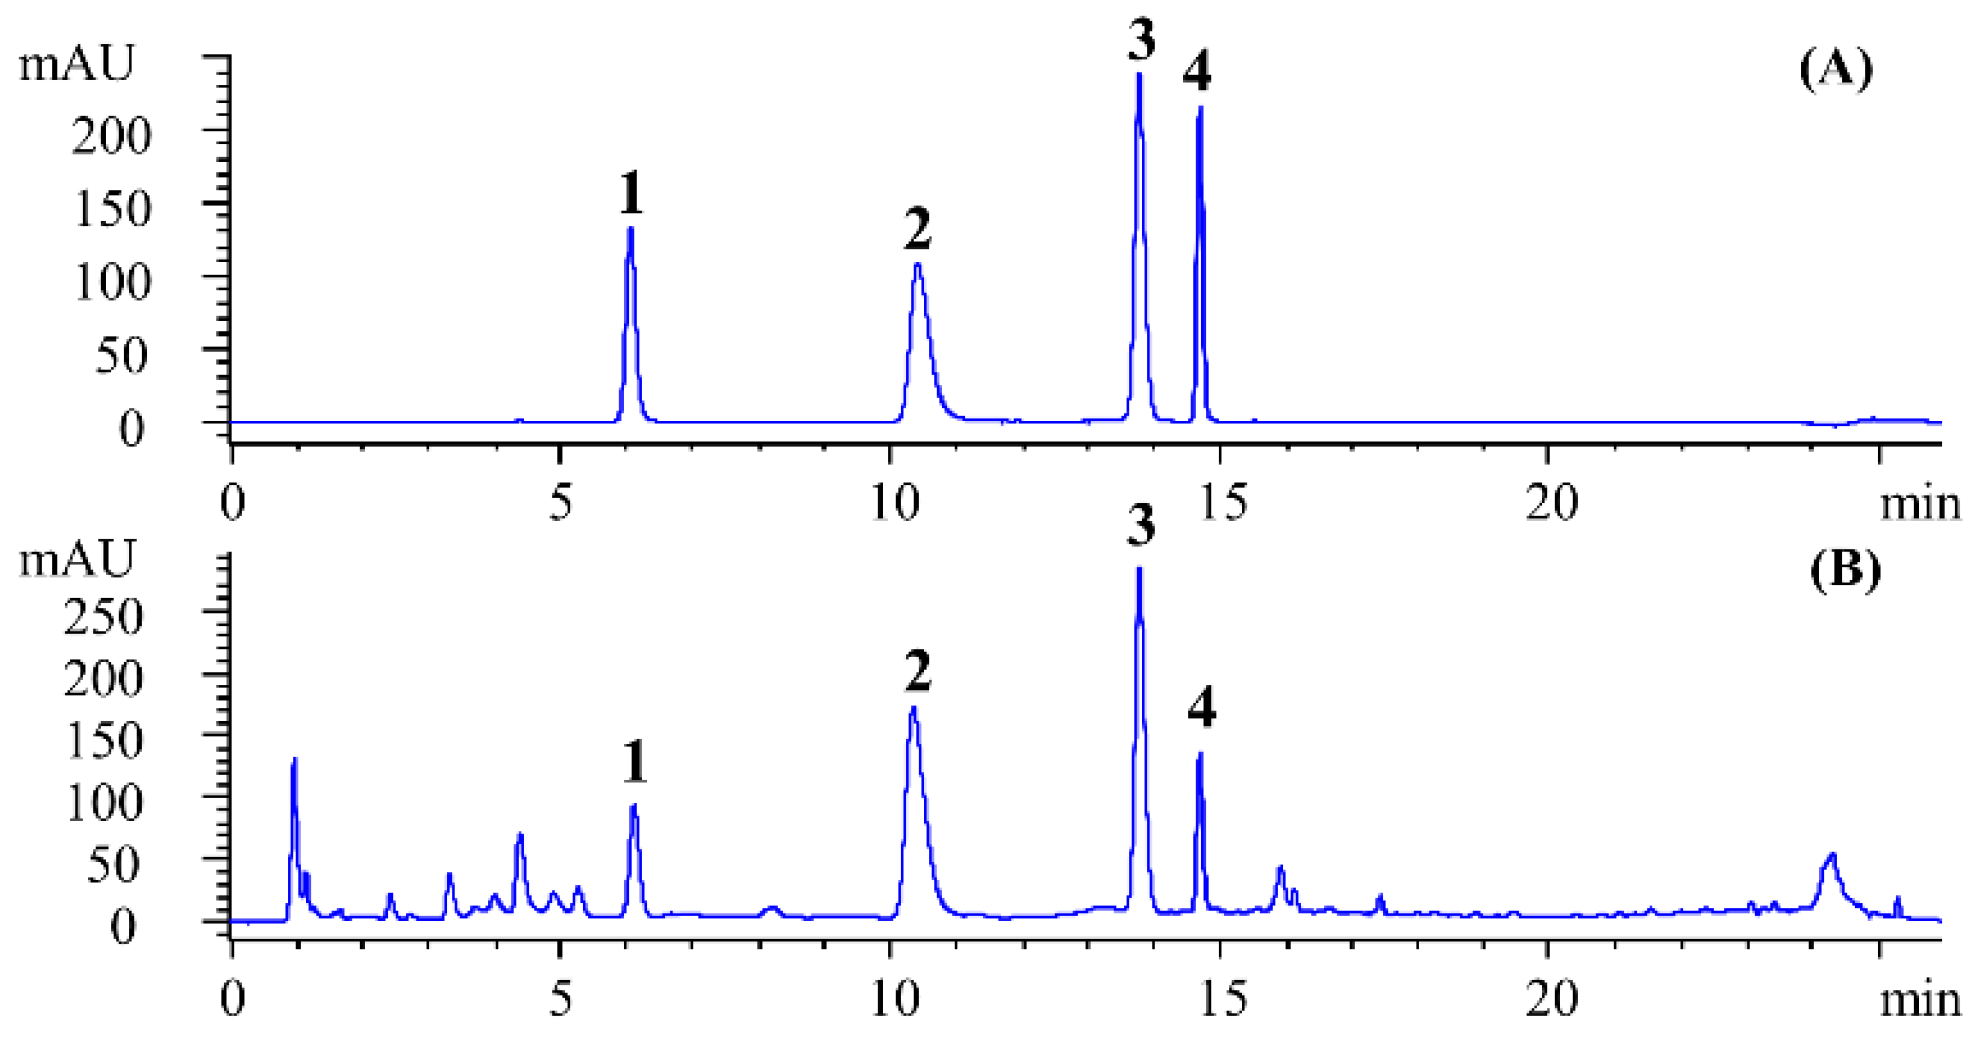
3.11. Application of the Method

The results of the content determination of the 12 samples during the percolation process are shown in Table 5. Upper and lower limits within the 95% confidence interval were calculated accordingly. As percolation progresses, the contents of the four target substances in the percolate initially slightly increased and then gradually decreased. This trend is consistent with previously reported work [44]. Compared to other HPLC methods for the Xiaochaihu system, the developed analytical method features a simpler elution solvent, requiring only 26 min to detect four components. The average analysis time per component is relatively short. Moreover, the flow rate is set at 0.30 mL/min, conserving solvent and mobile phase additives, aligning with the “Reduce” principle of the green chemistry 5R framework. The disadvantage of the developed analytical method lies in the cumbersome centrifugal concentration required for sample pretreatment.

4. Conclusions

Various risk management techniques were integrated for the development and maintenance of analytical methods in this study. An HPLC method for detecting four target compounds in Xiaochaihu capsule intermediate was developed and validated using the AQbD approach. Risk assessment was conducted in the early stages of method development using Ishikawa diagram and FMEA. The reliability of the MODR was measured using the probability of noncompliance calculated based on an exhaustive Monte Carlo method. Control strategies presented through decision trees combine prior knowledge and empirical knowledge obtained from experiments, providing reliable assurance for the subsequent use and maintenance of the analytical method. The recommended separation parameters were as follows: the separation of analytes was achieved with a Waters Atlantis T3 (250 mm × 4.6 mm, 5 μm) column at 25 °C, using acetonitrile and water as the mobile phases in gradient elution at a flow rate of 0.30 mL/min; the elution was monitored at UV detection wavelengths of 280 nm.
Xiaochaihu capsules are made from seven medicinal herbs, resulting in a complex chemical composition. Currently, the relationship between the activity of Xiaochaihu capsule chemical components remains unclear, with insufficient research on their interaction. According to the current literature, it is challenging to determine which components should serve as quality control indicators. The analytical method developed in this work can be applied to the quality control of Xiaochaihu capsule intermediates and process control during percolation. The risk management techniques employed in this study can also be used for the development of other analytical methods.

Supplementary Materials

The following supporting information can be downloaded at: https://www.mdpi.com/article/10.3390/chemosensors12080161/s1, Figure S1: The full wavelength scanning of the sample; Figure S2: The chromatograms of different chromatographic columns; Figure S3: Selection of the mobile phase system; Figure S4: The influence of flow rate on chromatographic separation; Figure S5: The influence of temperature on chromatographic separation; Figure S6: The impact of different redissolving solvents on chromatographic separation; Figure S7: The results of the MODR; Table S1: The effect of different centrifugal concentration temperatures on peak area; Table S2: The regression coefficients and analysis of variance for each model; Table S3: The conditions and results of the validation experiments; Table S4: Plackett-Burman design conditions and results; Table S5: Linearity and analytical range; Table S6: RSD results of analytical precision, stability, and repeatability experiments; Table S7: Results of accuracy experiments.

Author Contributions

M.Z.: writing—original draft, formal analysis, investigation, methodology, validation, and visualization. Y.T.: data curation, methodology, investigation, conceptualization, and software. G.W.: funding acquisition, resources, conceptualization, and review. F.D.: investigation and validation. H.Q.: writing—review and editing. X.G.: writing—review and editing, project administration, and supervision. All authors have read and agreed to the published version of the manuscript.

Funding

This work was supported by the Innovation Team and Talents Cultivation Program of the National Administration of Traditional Chinese Medicine (ZYYCXTD-D-202002) and the Fundamental Research Funds for the Central Universities (226-2022-00226).

Institutional Review Board Statement

Not applicable.

Informed Consent Statement

Not applicable.

Data Availability Statement

The data that support the findings of this study are available from the corresponding author upon reasonable request.

Acknowledgments

We thank Wanying Wang for her contribution to this work.

Conflicts of Interest

Gelin Wu was employed by the companies Zhejiang Pralife Pharmaceutical Co., Ltd. and Hangzhou Zansheng Pharmaceutical Co., Ltd. The remaining authors declare that the research was conducted in the absence of any commercial or financial relationships that could be construed as a potential conflict of interest.

References

  1. Zhang, S.; Wu, L.; Wang, X.; Gong, X.; Qu, H. Development of an HPLC-MS method for the determination of four terpene trilactones in Ginkgo biloba leaf extract via quality by design. Biomed. Chromatogr. 2021, 35, e5170. [Google Scholar] [CrossRef] [PubMed]
  2. Dispas, A.; Avohou, H.T.; Lebrun, P.; Hubert, P.; Hubert, C. ‘Quality by Design’ approach for the analysis of impurities in pharmaceutical drug products and drug substances. TRAC Trends Anal. Chem. 2018, 101, 24–33. [Google Scholar] [CrossRef]
  3. Prajapati, P.; Patel, M.; Kansara, Y.; Shah, P.; Pulusu, V.S.; Shah, S. Green LC-MS/MS method for in-vivo pharmacokinetics of mirabegron-encapsulated nanostructured lipid carriers in rat plasma: Integrating white analytical chemistry and analytical quality by design approach. Sustain. Chem. Pharm. 2024, 39, 101523. [Google Scholar] [CrossRef]
  4. Lan, J.; Wu, G.; Wu, L.; Qu, H.; Gong, P.; Xie, Y.; Zhou, P.; Gong, X. Development of a Quantitative Chromatographic Fingerprint Analysis Method for Sugar Components of Xiaochaihu Capsules Based on Quality by Design Concept. Separations 2022, 10, 13. [Google Scholar] [CrossRef]
  5. Shao, J.; Cao, W.; Qu, H.; Pan, J.; Gong, X. A novel quality by design approach for developing an HPLC method to analyze herbal extracts: A case study of sugar content analysis. PLoS ONE 2018, 13, e0198515. [Google Scholar] [CrossRef] [PubMed]
  6. Kim, M.K.; Park, S.C.; Park, G.; Choi, E.; Ji, Y.; Jang, Y.P. Analytical quality by design methodology for botanical raw material analysis: A case study of flavonoids in Genkwa Flos. Sci. Rep. 2021, 11, 11936. [Google Scholar] [CrossRef] [PubMed]
  7. Ding, F.; Liu, S.; Wu, G.; Qu, H.; Gong, P.; Xie, Y.; Zhou, P.; Gong, X. A novel process for developing a quantitative chromatographic fingerprint analysis method based on analytical quality by design: A case study of Xiaochaihu capsules. Microchem. J. 2023, 194, 109253. [Google Scholar] [CrossRef]
  8. Peraman, R.; Bhadraya, K.; Reddy, Y.P. Analytical Quality by Design: A Tool for Regulatory Flexibility and Robust Analytics. Int. J. Anal. Chem. 2015, 2015, 868727. [Google Scholar] [CrossRef]
  9. Santhanam, M.K.; Nagarajan, N.C.; Ponraj, P.B.; Hilurudeen, M.S.M. A Complete Roadmap of Analytical Quality by Design in Various Analytical Techniques. Curr. Pharm. Anal. 2023, 19, 184–215. [Google Scholar] [CrossRef]
  10. Prajapati, P.; Shahi, A.; Acharya, A.; Shah, S. Chemometry and Green Chemistry-Based Chromatographic Analysis of Azilsartan Medoxomil, Cilnidipine and Chlorthalidone in Human Plasma Using Analytical Quality by Design Approach. J. Chromatogr. Sci. 2024, 62, 201–212. [Google Scholar] [CrossRef]
  11. Deidda, R.; Orlandini, S.; Hubert, P.; Hubert, C. Risk-based approach for method development in pharmaceutical quality control context: A critical review. J. Pharm. Biomed. Anal. 2018, 161, 110–121. [Google Scholar] [CrossRef] [PubMed]
  12. Prajapati, P.B.; Patel, P.R.; Shah, S.A. Chemometric and DoE-Based Analytical Quality Risk Management to HPTLC Method for Simultaneous Estimation of Metronidazole and Norfloxacin. J. Chromatogr. Sci. 2023, 61, 428–439. [Google Scholar] [CrossRef] [PubMed]
  13. Prajapati, P.; Patel, A.; Shah, S. DoE-Based Analytical Quality Risk Management for Enhanced AQbD Approach to Economical and Eco-Friendly RP-HPLC Method for Synchronous Estimation of Multiple FDC Products of Antihypertensive Drugs. J. Chromatogr. Sci. 2022, 60, 786–799. [Google Scholar] [CrossRef] [PubMed]
  14. International Conference on Harmonization (ICH). Quality Risk Management Q9. Available online: https://www.cde.org.cn/ichWeb/guideIch/toGuideIch/1/0 (accessed on 1 May 2024).
  15. Chalikwar, S.S.; Surana, S.J.; Goyal, S.N.; Chaturvedi, K.K.; Dangre, P.V. Solid self-microemulsifying nutraceutical delivery system for hesperidin using quality by design: Assessment of biopharmaceutical attributes and shelf-life. J. Microencapsul. 2021, 38, 61–79. [Google Scholar] [CrossRef] [PubMed]
  16. Chudiwal, V.S.; Shahi, S.; Chudiwal, S. Development of sustained release gastro-retentive tablet formulation of nicardipine hydrochloride using quality by design (QbD) approach. Drug Dev. Ind. Pharm. 2018, 44, 787–799. [Google Scholar] [CrossRef] [PubMed]
  17. Chiarentin, L.; Cardoso, C.; Miranda, M.; Vitorino, C. Rheology of Complex Topical Formulations: An Analytical Quality by Design Approach to Method Optimization and Validation. Pharmaceutics 2023, 15, 1810. [Google Scholar] [CrossRef] [PubMed]
  18. Goswami, A.; Rahman, S.N.R.; Pawde, D.M.; Shunmugaperumal, T. Analytical Quality by Design-Driven RP-HPLC Method Conditions to Concomitantly Determine Cinnarizine and Morin Hydrate in Combined Drug Solution and Dual Drug-Loaded Formulations. J. AOAC Int. 2023, 106, 1154–1164. [Google Scholar] [CrossRef] [PubMed]
  19. Panda, S.S.; Bera, R.; Acharjya, A.K.; Sahoo, P.; Beg, S. Analytical lifecycle management approach: Application to development of a reliable LC method for estimation of lacidipine. Sep. Sci. Plus 2019, 2, 18–25. [Google Scholar] [CrossRef]
  20. Prajapati, P.; Salunkhe, M.; Pulusu, V.; Shah, S.L. Implementation of white analytical chemistry-driven analytical quality risk assessment and design of experiments to multipurpose chromatographic method for the synchronous estimation of multiple drugs co-formulated with paracetamol. JPC-J. Planar Chromatogr.-Mod. TLC 2023, 37, 69–86. [Google Scholar] [CrossRef]
  21. Rampini, D.; de Araújo, R.V.; Foitinho, R.E.; Lourenço, F.R.; Giarolla, J. Analytical Quality by Design as an Important Tool to Determine the Best Analytical Conditions for Isoniazid and Its Respective Succinylated Prodrug. J. AOAC Int. 2021, 104, 239–247. [Google Scholar] [CrossRef]
  22. Deidda, R.; Avohou, H.T.; Baronti, R.; Davolio, P.L.; Pasquini, B.; Del Bubba, M.; Hubert, C.; Hubert, P.; Orlandini, S.; Furlanetto, S. Analytical quality by design: Development and control strategy for a LC method to evaluate the cannabinoids content in cannabis olive oil extracts. J. Pharm. Biomed. Anal. 2019, 166, 326–335. [Google Scholar] [CrossRef]
  23. Liu, Q.; Bian, G.; Chen, X.; Han, J.; Chen, Y.; Wang, M.; Yang, F. Application of a six sigma model to evaluate the analytical performance of urinary biochemical analytes and design a risk-based statistical quality control strategy for these assays: A multicenter study. J. Clin. Lab. Anal. 2021, 35, e24059. [Google Scholar] [CrossRef] [PubMed]
  24. Chen, Y. Interpretation of Febrile Disease; Shanghai Scientific and Technical Publishers: Shanghai, China, 2010. [Google Scholar]
  25. Xu, G.; Wang, H.; Deng, Y.; Xie, K.; Zhao, W.; Gong, X. Research Progress on Quality Control Methods for Xiaochaihu Preparations. Separations 2021, 8, 199. [Google Scholar] [CrossRef]
  26. Chen, W.; Zhang, C.; Sun, L.; Xue, M. Combination of fingerprint and chemometrics for identification of four processed products of Pinelliae Rhizoma based on nucleosides and nucleobases. Chin. J. Pharm. Anal. 2021, 41, 919–928. [Google Scholar]
  27. Yu, L.; Zhao, J.; Zhu, Q.; Li, S.P. Macrophage biospecific extraction and high performance liquid chromatography for hypothesis of immunological active components in Cordyceps sinensis. J. Pharm. Biomed. Anal. 2007, 44, 439–443. [Google Scholar] [CrossRef]
  28. Evaldsson, C.; Rydén, I.; Uppugunduri, S. Anti-inflammatory effects of exogenous uridine in an animal model of lung inflammation. Int. Immunopharmacol. 2007, 7, 1025–1032. [Google Scholar] [CrossRef]
  29. Ding, X.; Xiong, L.; Zhou, Q.; Ye, Q.; Guo, L.; Liu, F. Advances in Studies on Chemical Structure and Pharmacological Activities of Natural Nucleosides. J. Chengdu Univ. Tradit. Chin. Med. 2018, 41, 102–108. [Google Scholar]
  30. Wang, M.; Wang, Y.; Wu, Y.; Li, N.; Feng, M.; Zhang, W.; Jing, R.; Hao, X.; Ni, Y. Research progress on content changes of 5-hydroxymethyl furfural during processing of Chinese medicine and it’s pharmacological effects. Drug Eval. Res. 2020, 43, 2319–2327. [Google Scholar]
  31. Li, J.; Duan, K.; Yang, J.; Li, P.; Xing, T.; Wang, W.; Li, Z.; Shao, X.; Ji, X. Synthesis of 5-hydroxymethyl furfural from dehydration of fructose catalyzed by heteropoly acid. Mod. Chem. Ind. 2021, 41, 269–273. [Google Scholar]
  32. Guan, L.; Li, X.; Li, J.; Yang, C.; Tan, X.; Cui, Y.; Gao, Y.; Huang, J. Effect of 5-HMF on hemoglobin-oxygen affinity, swimming endurance and spatial memory ability of rats in high altitude simulated environment. J. Army Med. Univ. 2015, 37, 1561–1565. [Google Scholar]
  33. Yalcin, O.; Cabrales, P. Increased hemoglobin O2 affinity protects during acute hypoxia. Am. J. Physiol. Heart Circ. Physiol. 2012, 303, H271–H281. [Google Scholar] [CrossRef] [PubMed]
  34. International Conference on Harmonization (ICH). Analytical Procedure Development Q14. Available online: https://database.ich.org/sites/default/files/ICH_Q14_Document_Step2_Guideline_2022_0324.pdf (accessed on 1 May 2024).
  35. Arebo, M.A.; Feyisa, J.D.; Tafa, K.D.; Satheesh, N. Optimization of spray-drying parameter for production of better quality orange fleshed sweet potato (Ipomoea batatas L.) powder: Selected physiochemical, morphological, and structural properties. Heliyon 2023, 9, e13078. [Google Scholar] [CrossRef] [PubMed]
  36. Liu, T.; Wang, K.K.; Jiang, M.Y.; Wan, L. Interactions between mesocellular foam silica carriers and model drugs constructed by central composite design. Colloids Surf. B-Biointerfaces 2019, 180, 221–228. [Google Scholar] [CrossRef] [PubMed]
  37. Luo, J.; Wan, L.; Zhang, Q.; Cui, B.; Li, C.; Jiang, Y.; Jiang, M.; Wang, K. Constructing a drug release model by central composite design to investigate the interaction between drugs and temperature-sensitive controlled release nanoparticles. Eur. J. Pharm. Biopharm. 2023, 183, 24–32. [Google Scholar] [CrossRef] [PubMed]
  38. Tai, Y.; Qu, H.; Gong, X. Design space calculation and continuous improvement considering a noise parameter: A case study of ethanol precipitation process optimization for the Carthami Flos extract. Separations 2021, 8, 74. [Google Scholar] [CrossRef]
  39. Shao, J.; Qu, H.; Gong, X. Comparison of two algorithms for development of design space-overlapping method and probability-based method. China J. Chin. Mater. Medica 2018, 43, 2074–2080. [Google Scholar]
  40. Jayagopal, B.; Murugesh, S. QbD-mediated RP-UPLC method development invoking an FMEA-based risk assessment to estimate nintedanib degradation products and their pathways. Arab. J. Chem. 2020, 13, 7087–7103. [Google Scholar] [CrossRef]
  41. International Electrotechnical Commission (IEC). Failure Modes and Effects Analysis (FMEA and FMECA) IEC60812 Edition 3.0; IEC: Geneva, Switzerland, 2018. [Google Scholar]
  42. Szoleczky, R.; Budai-Szűcs, M.; Csányi, E.; Berkó, S.; Tonka-Nagy, P.; Csóka, I.; Kovács, A. Analytical Quality by Design (AQbD) Approach to the Development of In Vitro Release Test for Topical Hydrogel. Pharmaceutics 2022, 14, 707. [Google Scholar] [CrossRef]
  43. Kothari, B.H.; Fahmy, R.; Claycamp, H.G.; Moore, C.M.V.; Chatterjee, S.; Hoag, S.W. A Systematic Approach of Employing Quality by Design Principles: Risk Assessment and Design of Experiments to Demonstrate Process Understanding and Identify the Critical Process Parameters for Coating of the Ethylcellulose Pseudolatex Dispersion Using Non-Conventional Fluid Bed Process. AAPS PharmSciTech 2017, 18, 1135–1157. [Google Scholar]
  44. Tai, Y.; Zhao, M.; Ding, F.; Wu, G.; Qu, H.; Gong, P.; Xie, Y.; Zhou, P.; Gong, X. Analytical Quality by Design based on knowledge organization: A case study of developing a UHPLC method for the detection of phenolic compounds. Phytochem. Anal. 2024, 35, 1088–1099. [Google Scholar] [CrossRef]
Figure 1. Risk management techniques throughout the lifecycle of the analytical methods. FMEA: failure mode effects analysis; FMECA: failure mode effect and criticality analysis; FTA: fault tree analysis; HACCP: hazard analysis and critical control points; ETA: event tree analysis; 4T: treat, transfer, terminate, and tolerate; and CAPA: corrective and preventive actions.
Chemosensors 12 00161 g001
Figure 2. The Ishikawa diagram was used to display potential CMPs.
Chemosensors 12 00161 g002
Figure 3. The score levels of each failure mode in FMEA.
Chemosensors 12 00161 g003
Figure 4. Response contour plots of the evaluation indicators and analysis conditions. X1: column temperature (°C), X2: pH, X3: flow rate (mL/min), X4: water composition at the end of the first gradient (%). (A) X3 = 0.30 mL/min, X4 = 91.0%; (B) X2 = 5.50, X4 = 89.7%; (C) X2 = 6.57, X3 = 0.30 mL/min; (D) X3 = 0.27 mL/min, X4 = 88.0%; (E) X2 = 5.75, X4 = 88.0%; (F) X2 = 4.50, X3 = 0.21 mL/min; (G) X1 = 33.8 °C, X4 = 89.3%; and (H) X1 = 25.5℃, X2 = 7.00.
Chemosensors 12 00161 g004
Figure 5. Updated MODR. The color bar represents the risk value. (A) X4 = 90.0%, (B) X2 = 7.00, (C) X3 = 0.270 mL/min, (D) X1 = 25.0 °C.
Chemosensors 12 00161 g005
Figure 6. Typical chromatograms of the standard solution (A) and sample (B). (1): uridine, (2): adenine, (3): 5-hydroxymethylfurfural, and (4): guanosine.
Chemosensors 12 00161 g006
Figure 7. Decision tree for the control strategy of the analytical method. The black font in this Figure represents analytical method control strategies derived from prior knowledge, while the red font represents analytical method control strategies obtained from empirical knowledge acquired during the experimental process.
Chemosensors 12 00161 g007
Table 1. Analytical Target Profile.
ElementTargets
Intended purposeDetermination of four target compounds in GGPP
Analysis objectGGPP
Main characteristic
of the analysis object
There are multiple types of components,
and the chemical structures of most
components are unclear.
Quantitatively detected
compounds
Uridine, adenine, guanosine, and 5-hydroxymethylfurfural
Analytical method
performance
requirements
  • The resolution value of the quantitative detection compounds needs to be no less than 1.5;
  • Analysis time is minimized;
  • Robustness, linearity, precision, stability, repeatability, and accuracy are good.
Table 2. FMEA risk assessment.
AttributeFailure ModePotential RiskOResulting InfluenceSDetection MethodDRPN
Humandata recordingmisregistration2analysis result error4manual examination216
data processingmiscalculation2analysis result error4manual examination216
instrument usingdisoperation2analysis result error3instrument history212
weighweighing error3influence in solvents, mobile phases, and percolations3visual check327
solution preparationsolution formulation error2influence in solvents, mobile phases, and percolations3visual check530
Instrumentpipetteerror of scale2solution formulation error2visual check520
HPLCinstrument failure2unable to analyze5service220
pH meterinstrument failure2influence in mobile phase pH4pH test paper432
balanceinstrument uncalibrated2weighing error3visual check318
Milli-Q ultrapure water machinefault filter1influences solution preparation2service48
ultrasonic cleaning machineinstrument failure2influences solution preparation1visual check24
centrifugal enrichment freeze-drying systeminstrument failure2influences solution preparation5visual check220
EP tubeerror of scale2influences solution preparation and sample preparation1visual check48
MaterialTCM herbal slicesquality difference in herbal slices2difference in active ingredient content3HPLC318
acetonitrilecontaminated2influences mobile phase4HPLC432
methanolcontaminated2influences mobile phase4HPLC432
acetic acidcontaminated2influences mobile phase pH4HPLC432
ammonium acetatecontaminated2influences mobile phase pH4HPLC432
Samplevolume of redissolved solventunreasonable volume of redissolved solvent4low chromatographic peak response value4HPLC464
resoluble solventeffect on sample dissolution4influences chromatographic peak response and peak shape4HPLC464
sample bombcontaminated/sample volatilization2influences chromatographic peak response3HPLC424
centrifugal concentration temperatureif the temperature is too low, the preparation time is long, and if the temperature is too high, the components are volatilized.4influences chromatographic peak response4HPLC464
HPLC mothodchromatographic columnunsuitable for target component separation4influences component separation and analysis time5HPLC480
column temperatureunsuitable for target component separation4influences component separation and analysis time5HPLC480
composition of the mobile phase systemunsuitable for target component separation4influences component separation and analysis time5HPLC480
flow rateunsuitable for target component separation4influences component separation and analysis time5HPLC480
pHunsuitable for target component separation4influences component separation and peak shape5HPLC480
injection volumeunsuitable for target component separation3low chromatographic peak response4HPLC448
detection wavelengthunsuitable for target component separation4low absorption and large interference5HPLC480
volume ratio of mobile phaseunsuitable for target component separation4influences component separation and analysis time5HPLC580
Environmenttemperatureinfluence on column gentle sample3influences component separation and analysis time2thermometer212
humidityeffect on instruments, weighing, etc.3influences component separation and analysis time2thermometer212
illuminationchanges in the chemical composition of the reagent or side reactions occur2influences component separation and analysis time1HPLC48
dust disturbanceeffect on some precision instruments1influences component separation and analysis time1HPLC22
The scoring levels for each failure mode are described as follows: For events with no impact, almost impossible occurrence, and that are extremely easy to detect, the score is set to 1. For events with minor impact, random occurrence, and that are fairly easy to detect, the score is set to 2. For events with moderate impact, a 50% probability of occurrence, and that were detectable, the score is set to 3. For events with a significant impact, a higher probability of occurrence, and that are difficult to detect, the score is set to 4. For events with severe impact, certain occurrence, and that are impossible to detect, the score is set to 5.
Table 3. Experimental conditions and results of the CCD.
RunAnalytical Method ParameterChromatographic Response
X1 (°C)X2X3 (mL/min)X4 (%)Y1Y2Y3 (min)
135.04.500.20088.01.680.010016.9
235.07.000.20092.00.8600.84017.6
330.05.750.20090.00.5301.0217.8
435.04.500.20092.01.290.91017.5
525.07.000.20088.03.000.50017.9
635.05.750.25090.01.081.5715.2
725.04.500.20092.02.791.0918.9
825.05.750.25090.03.161.9016.5
925.07.000.30088.02.832.8814.9
1035.07.000.30088.01.322.6313.7
1130.05.750.25090.01.291.8715.9
1230.05.750.25088.01.391.4315.7
1330.07.000.25090.03.442.0216.0
1435.07.000.30092.01.842.9013.8
1535.04.500.30092.02.072.7713.6
1625.07.000.30092.02.163.9615.6
1730.05.750.25090.01.331.8415.9
1830.04.500.25090.02.882.1115.8
1930.05.750.30090.01.253.0514.5
2025.07.000.20092.02.500.98018.9
2130.05.750.25090.01.301.9615.9
2235.04.500.30088.02.022.5813.4
2325.04.500.30088.03.243.1714.8
2435.07.000.20088.01.170.48017.0
2530.05.750.25092.01.372.2716.3
2625.04.500.20088.02.730.55017.9
2730.05.750.25090.01.331.8615.9
2825.04.500.30092.03.274.2315.5
Table 4. The regression coefficients and analysis of variance for each model.
Y1Y2Y3 (min)
Model TermCoefficientp ValueCoefficientp ValueCoefficientp Value
Constant1.6001.89015.90
X1−0.729<0.0001−0.264<0.0001−0.674<0.0001
X2----0.0758<0.0001
X30.2670.00431.22<0.0001−1.71<0.0001
X4--0.326<0.00010.296<0.0001
X120.4750.0264−0.1910.0064
X220.7050.00150.2210.0015--
X32−0.5620.0097--0.225<0.0001
X1X2--0.06220.0737--
X1X3--−0.170<0.0001−0.107<0.0001
X1X4--−0.09830.0079−0.108<0.0001
X2X3----0.03300.0495
X3X4----−0.0891<0.0001
R20.77540.98560.9979
Model p value<0.0001<0.0001<0.0001
Table 5. Quantitative detection results of the 12 samples.
Collection Time (min)Uridine (μg/mL)Adenine (μg/mL)5-Hydroxymethylfurfural (μg/mL)Guanosine (μg/mL)
Mean ± SDThe Lower Limit of the 95% Confidence IntervalThe Upper Limit of the 95% Confidence IntervalMean ± SDThe Lower Limit of the 95% Confidence IntervalThe Upper Limit of the 95% Confidence IntervalMean ± SDThe Lower Limit of the 95% Confidence IntervalThe Upper Limit of the 95% Confidence IntervalMean ± SDThe Lower Limit of the 95% Confidence IntervalThe Upper Limit of the 95% Confidence Interval
1026.8 ± 0.76124.9 28.6 13.8 ± 0.18513.3 14.3 21.3 ± 0.35220.4 22.2 22.6 ± 0.64221.0 24.2
2031.4 ± 0.39830.5 32.4 16.7 ± 0.17016.3 17.1 24.9 ± 0.31924.1 25.7 26.9 ± 0.96424.5 29.3
3032.1 ± 0.29831.3 32.8 17.5 ± 0.017317.5 17.6 25.4 ± 0.018525.3 25.4 28.5 ± 0.56427.1 29.9
5027.9 ± 0.23727.3 28.5 16.2 ± 0.18515.8 16.7 21.6 ± 0.055521.4 21.7 25.3 ± 0.45424.1 26.4
7025.7 ± 0.63524.1 27.3 15.1 ± 0.63513.5 16.6 19.8 ± 0.064719.6 20.0 24.0 ± 0.28523.3 24.8
10021.5 ± 0.17021.1 22.0 13.6 ± 0.092713.3 13.8 16.6 ± 0.094016.3 16.8 20.2 ± 0.37719.3 21.1
13019.5 ± 0.64517.9 21.1 12.5 ± 0.17012.0 12.9 15.7 ± 0.20415.2 16.3 18.8 ± 0.28218.1 19.5
16018.6 ± 0.58117.2 20.0 11.4 ± 0.017311.3 11.4 14.9 ± 0.13814.5 15.2 17.5 ± 0.25216.8 18.1
20017.4 ± 0.10217.1 17.6 10.1 ± 0.1339.75 10.4 13.9 ± 0.023613.8 13.9 15.9 ± 0.15215.5 16.2
25014.8 ± 0.065714.6 14.9 8.55 ± 0.03788.45 8.64 12.2 ± 0.041512.1 12.3 13.6 ± 0.10313.4 13.9
3105.62 ± 0.1805.17 6.06 4.49 ± 0.03514.41 4.58 3.80 ± 0.05583.66 3.94 6.39 ± 0.1036.13 6.64
3702.83 ± 0.03132.75 2.91 2.49 ± 0.03292.46 2.52 1.39 ± 0.02381.34 1.45 3.56 ± 0.06303.40 3.72
Disclaimer/Publisher’s Note: The statements, opinions and data contained in all publications are solely those of the individual author(s) and contributor(s) and not of MDPI and/or the editor(s). MDPI and/or the editor(s) disclaim responsibility for any injury to people or property resulting from any ideas, methods, instructions or products referred to in the content.

