Article

An Iron Oxide and Polyaniline Composite-Based Triboelectric Nanogenerator for Intrusion Detection Sensor

by
Inkyum Kim
1,
Jihyeon Park
1,
Seungwoo Chun
2,
Jonghyeon Yun
1,
Minwoo Lee
1,
Tae Sik Goh
3,
Wook Park
2,*,
Hyuk Jin Choi
4,* and
Daewon Kim
2,*
1
Department of Electronics and Information Convergence Engineering, Institute for Wearable Convergence Electronics, Kyung Hee University, 1732 Deogyeong-daero, Giheung-gu, Yongin 17104, Republic of Korea
2
Department of Electronic Engineering, Institute for Wearable Convergence Electronics, Kyung Hee University, 1732 Deogyeong-daero, Giheung-gu, Yongin 17104, Republic of Korea
3
Department of Orthopedics and Biomedical Research Institute, Pusan National University Hospital, Pusan National University School of Medicine, 179 Gudeok-ro, Seo-gu, Busan 49241, Republic of Korea
4
Department of Neurosurgery and Medical Research Institute, Pusan National University Hospital, 179 Gudeok-ro, Seo-gu, Busan 49241, Republic of Korea
*
Authors to whom correspondence should be addressed.
Chemosensors 2024, 12(8), 162; https://doi.org/10.3390/chemosensors12080162
Submission received: 7 June 2024 / Revised: 26 July 2024 / Accepted: 1 August 2024 / Published: 13 August 2024
(This article belongs to the Special Issue Nanomaterials-Based Sensors)

Abstract

:
An increase in the number of small electronics is anticipated, requiring the preparation of an adequate powering method. A triboelectric nanogenerator, capable of scavenging ambient mechanical energy, is proposed as an efficient means to reduce power consumption for self-sustainable sensors, although its electrical output needs enhancement to broaden its technological applicability. In this work, a magnetic composite comprising iron oxide and polyaniline was synthesized to augment triboelectricity through the modulation of magnetic field intensity using physical chemistry. The crystallinity of the composite, chemical bonding, and structure of the surface are analyzed. The surface potential of the composite, embedded into polydimethylsiloxane, is quantitatively evaluated by using Kelvin probe force microscopy. By amalgamating magnetic flux density and triboelectric outputs, the optimization of the triboelectric layer is achieved, yielding output values of 93.86 V, 6.9 µA, and 127.5 µW. Following a reduction in surface adhesion after the powder coating process, a wind-based triboelectric nanogenerator is fabricated. Its excellent sensitivity to wind and exceptional long-term endurance are assessed, confirming its suitability as a sensor. The practicality of employing this device in intrusion detection, leveraging a wireless door-opening sensor, is demonstrated using synthesized composite materials.

Graphical Abstract

1. Introduction

In the era dominated by the Internet of Things (IoT), an increase in the proliferation of small electronic devices has been observed [1]. These devices, dispersed widely, necessitate a significant amount of energy. Consequently, sourcing energy directly from environmental conditions becomes crucial. Energy harvesting technology, extracting energy from ambient sources, offers a viable solution to this challenge [2]. This technology utilizes various sources like light, thermal, and mechanical energy. Examples are solar cells employing the photovoltaic effect for light energy capture [3], thermoelectric generators using the Seebeck effect under temperature gradients [4], electromagnetic generators operating on Faraday’s Law with moving magnets [5], piezoelectric nanogenerators converting pressure on ferroelectric materials into energy [6,7], and triboelectric nanogenerators generating Maxwell’s displacement current from mechanical inputs [8,9].
Triboelectric nanogenerators (TENGs) have emerged as an efficient method for mechanical energy harvesting [10]. Their advantages, including simple architecture, versatility through four operation modes, and high output voltage, have been well documented [11,12,13,14,15,16]. TENGs offer a wide material choice, environmental friendliness, cost-effectiveness, biocompatibility, and are lightweight [17,18,19,20,21,22,23,24,25,26,27]. Owing to their responsiveness to input intensity and electricity generation capability, TENGs have enabled the advancement of self-sustaining or self-powered sensors [28,29,30,31].
To broaden applications of triboelectric nanogenerators (TENGs), primary focus in the field has been directed toward augmenting their electrical outputs [32,33,34,35,36]. Techniques such as the incorporation of surface structures, chemical surface treatments, the utilization of triboelectric pairs positioned at greater distances within the triboelectric series, and structural optimization have been employed to enhance the outputs of TENGs [37,38,39,40]. The exploration of novel materials or the combination of existing ones for the dielectric or electrode layers of TENGs has offered a potential avenue for achieving this enhancement.
Iron oxide, particularly magnetite, has been recognized as the most magnetic of all naturally occurring minerals on Earth and has been extensively studied as a ferrimagnetic material [41]. The facile fabrication of iron oxide nanoparticles can provide a cost-effective means for enlarging surface area without the requirement for specialized and expensive equipment. Polyaniline (PANI), renowned for its commendable electrical conductivity, stands out as a conducting polymer [42]. The integration of iron oxide into a PANI matrix is essential, as PANI not only serves as a conductive framework but also significantly enhances the overall magnetic properties and thermal stability of the nanocomposite, even with a minor mass fraction of iron oxide [43]. Lu et al. investigated the paramagnetic properties of PANI-Fe3O4 carbon nanotubes synthesized using an ultrasonic wave exposure method [44]. Long et al. studied the paramagnetic characteristics of PANI-Fe3O4 composite carbon nanotubes developed through a self-gathering technique, which facilitates the dispersion of Fe3O4 nanoparticles compared to the self-gathering process [45]. Reddy et al. examined the influence of dopants on PANI-Fe3O4 composites fabricated by self-assembly using a hydrothermal method [46]. Deng et al. produced core–shell structured PANI-Fe3O4 composites through a precipitation–oxidation method, where the Fe3O4 nanoparticles (20–30 nm) form the core and polyaniline constitutes the conductive shell [47]. In particular, the co-precipitation technique, which avoids the need for high temperatures, high pressures, or additional gases, offers simplicity in the one-pot fabrication of PANI-Fe3O4 composites [48,49]. Furthermore, the straightforward synthesis procedures and easy doping, without involving hazardous reactions, provide significant benefits for the hybridization of PANI with iron oxide [50]. A heightened magnetic field has been hypothesized to stimulate an increase in the output voltage of TENGs, given the correct directional alignment [51].
In this study, the presentation of a TENG with enhanced electrical output, employing optimally conditioned composite materials of iron oxide-PANI (IOP), was made. Utilization of a one-pot synthesis method for IOP streamlined the production process. The synthesized IOP underwent analyses encompassing crystallography, chemical bonding, and surface characterization. Kelvin probe force microscopy (KPFM) was employed to ascertain the quantitative electrostatic forces and the local contact potential difference (CPD) between the atomic force microscope (AFM) probe and the sample surface, following the incorporation of IOP into a polydimethylsiloxane (PDMS) composite layer. Performance evaluation of the devices hinged on key parameters like open-circuit voltage and short-circuit current values of the contact/separation-based TENG (CS-TENG). Leveraging the finite element method (FEM), a wind input-based TENG (wind-TENG) was constructed using a PDMS composite layer, subsequently undergoing a surface modification process tailored for an intrusion detection system. The functional utility of the TENG, integrated with the synthesized IOP, was demonstrated through tests designed to enable wireless intrusion detection in security applications.

2. Materials and Methods

2.1. Chemicals and Materials

Iron (III) chloride hexahydrate (ACS reagent, 97%), iron (II) chloride tetrahydrate (ReagentPlus®, 98%), ammonium persulfate (APS, for molecular biology, ≥98%), and aniline (ReagentPlus®, 99%) were procured from Sigma-Aldrich (St. Louis, MO, USA). Ammonium hydroxide (ammonia water, EP) and toluene (EP) were obtained from Daejung Chemicals & Metals Co., Ltd. (Siheung, Republic of Korea). A membrane filter, featuring hydrophilic PTFE with a pore size of 0.45 µm, was utilized in the filtration process.

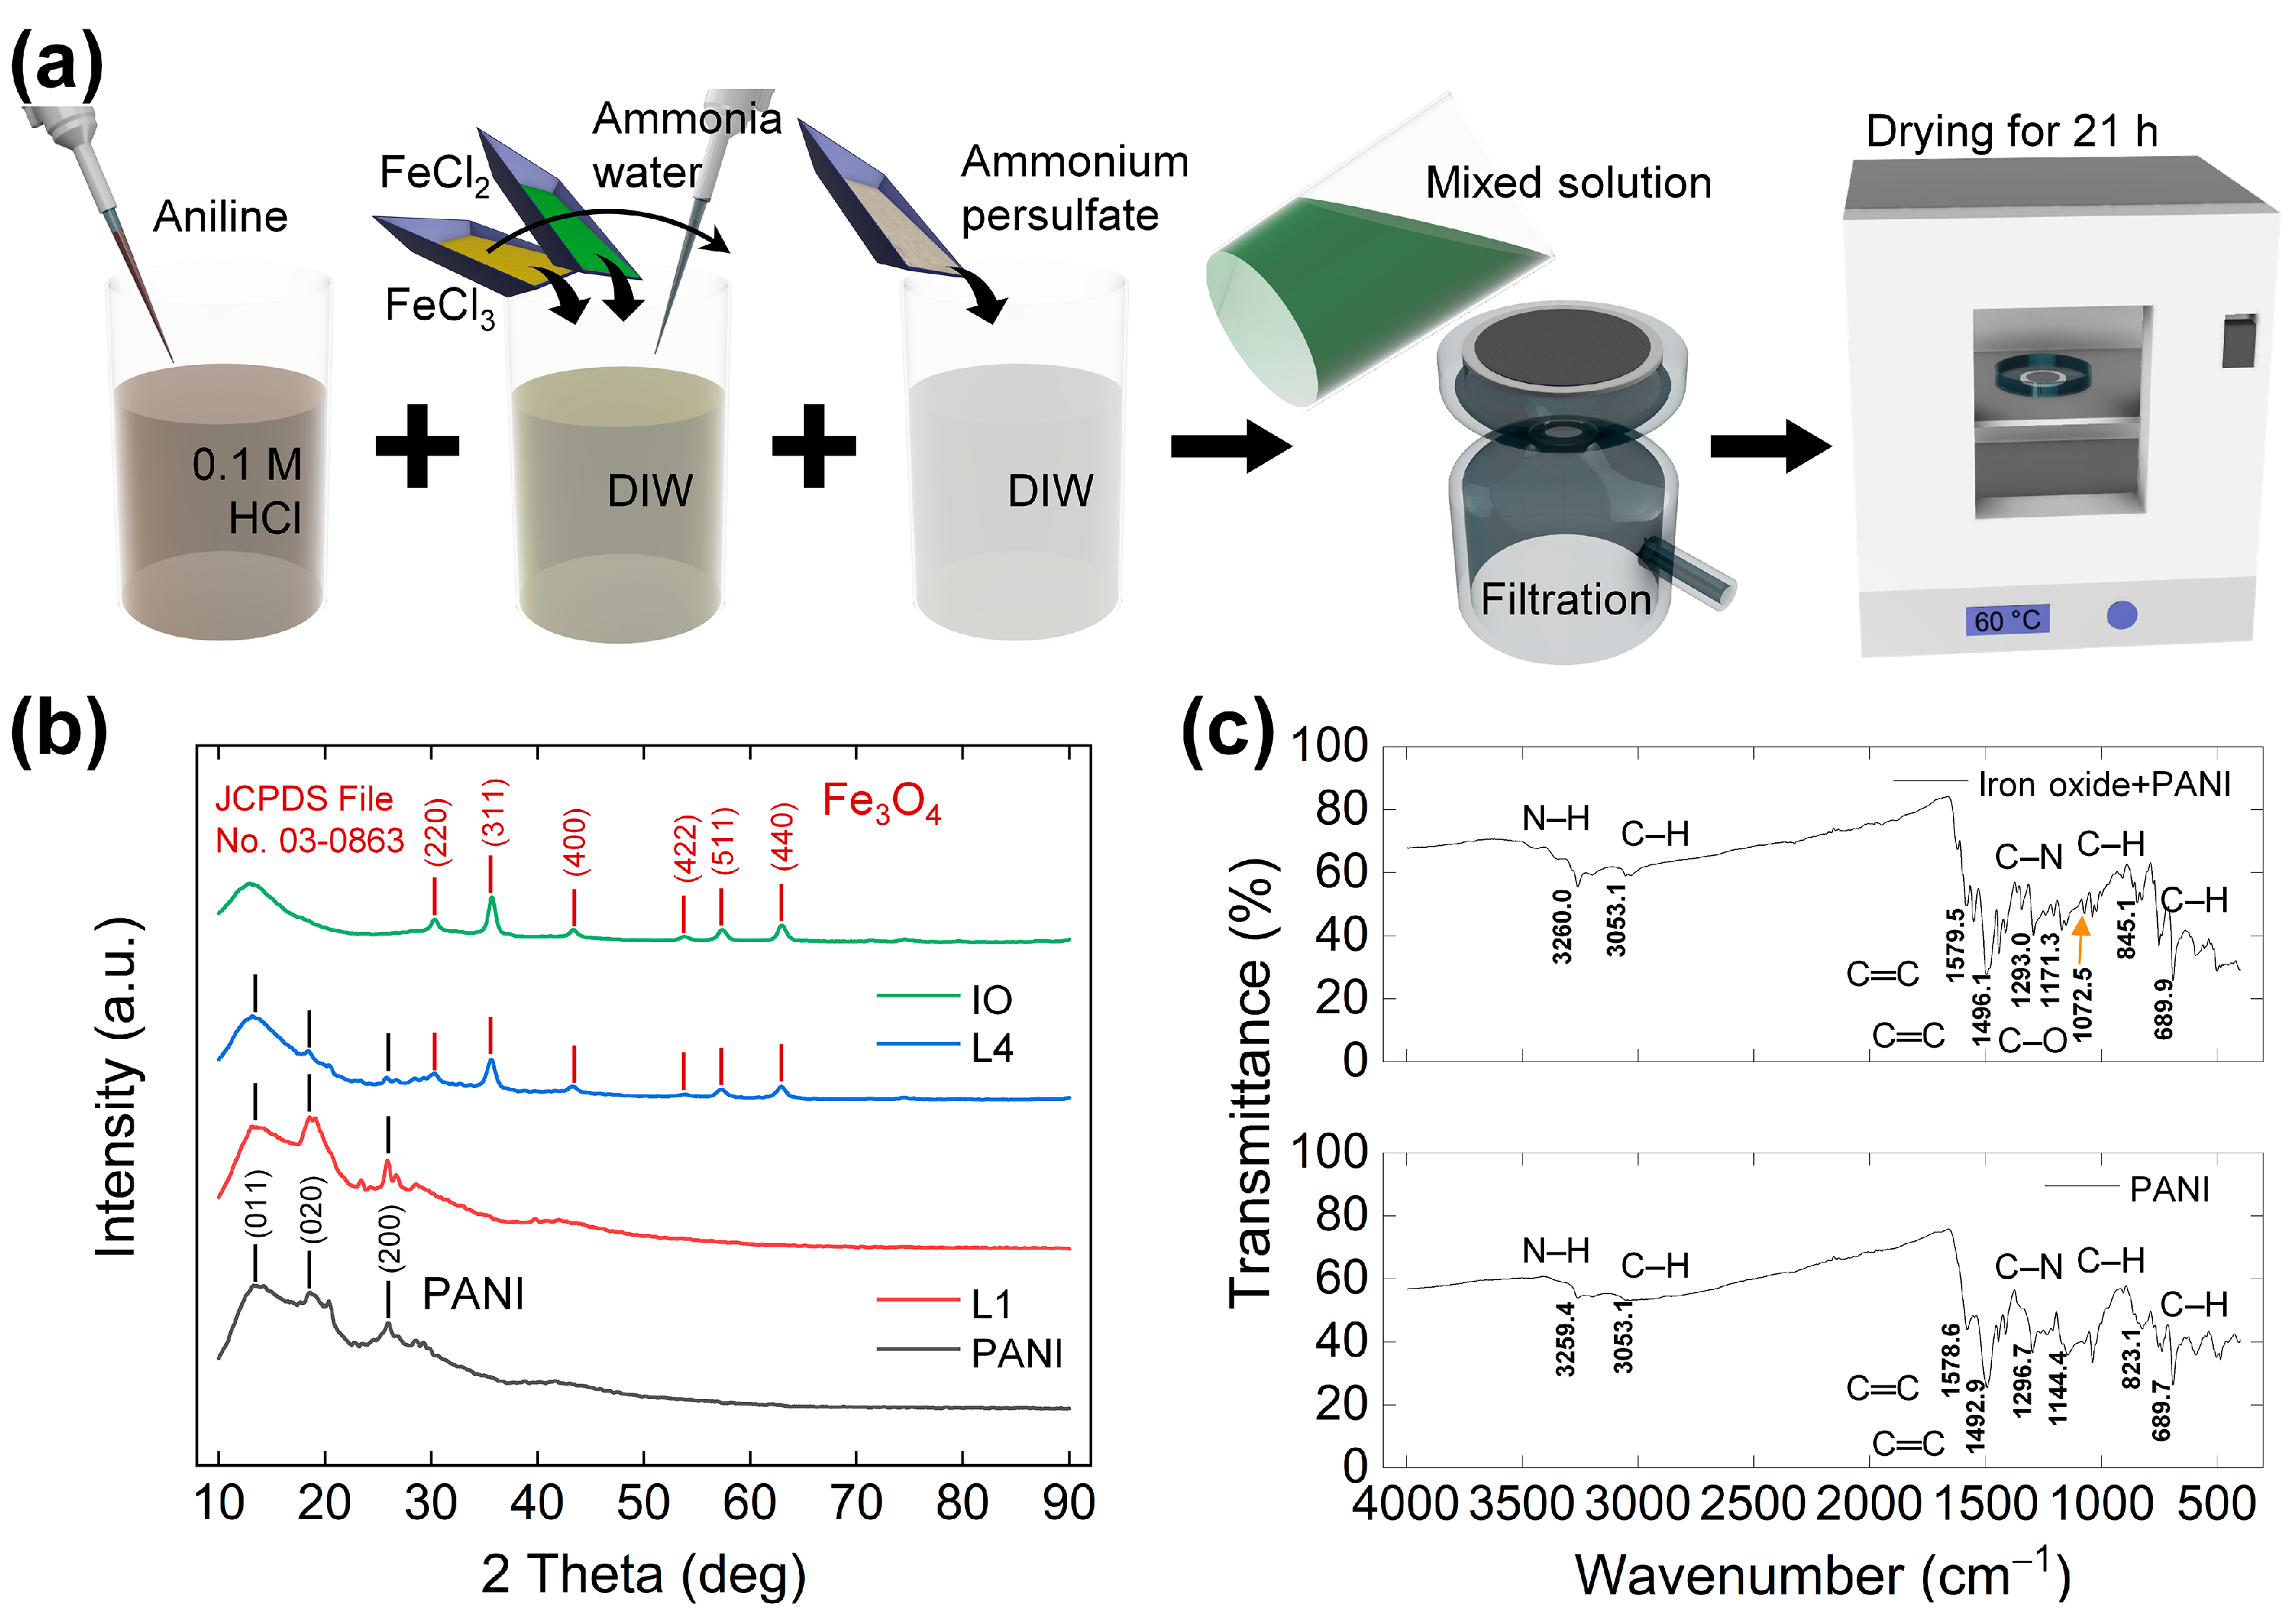
2.2. Synthesis of the IOP Composite

The procedure for synthesizing the IOP composite, as depicted in Figure 1a, commenced with the preparation of three distinct solutions: 5 mL of aniline in 50 mL of 0.1 M HCl, iron precursors in 50 mL of DIW, and 6.28 g of APS in 50 mL of DIW, achieving a concentration of 0.55 M. These solutions were sequentially mixed, commencing with the aniline-based solution, yielding a charcoal-colored mixture. Following 18 h of stirring, the precipitate was collected and washed with DIW during filtration, then dried in a convection oven from JEIO TECH (Daejeon, Republic of Korea) at 60 °C for 21 h under ambient air. The dried product underwent grinding using a mortar and pestle. This procedure was based on the method described in reference [52].

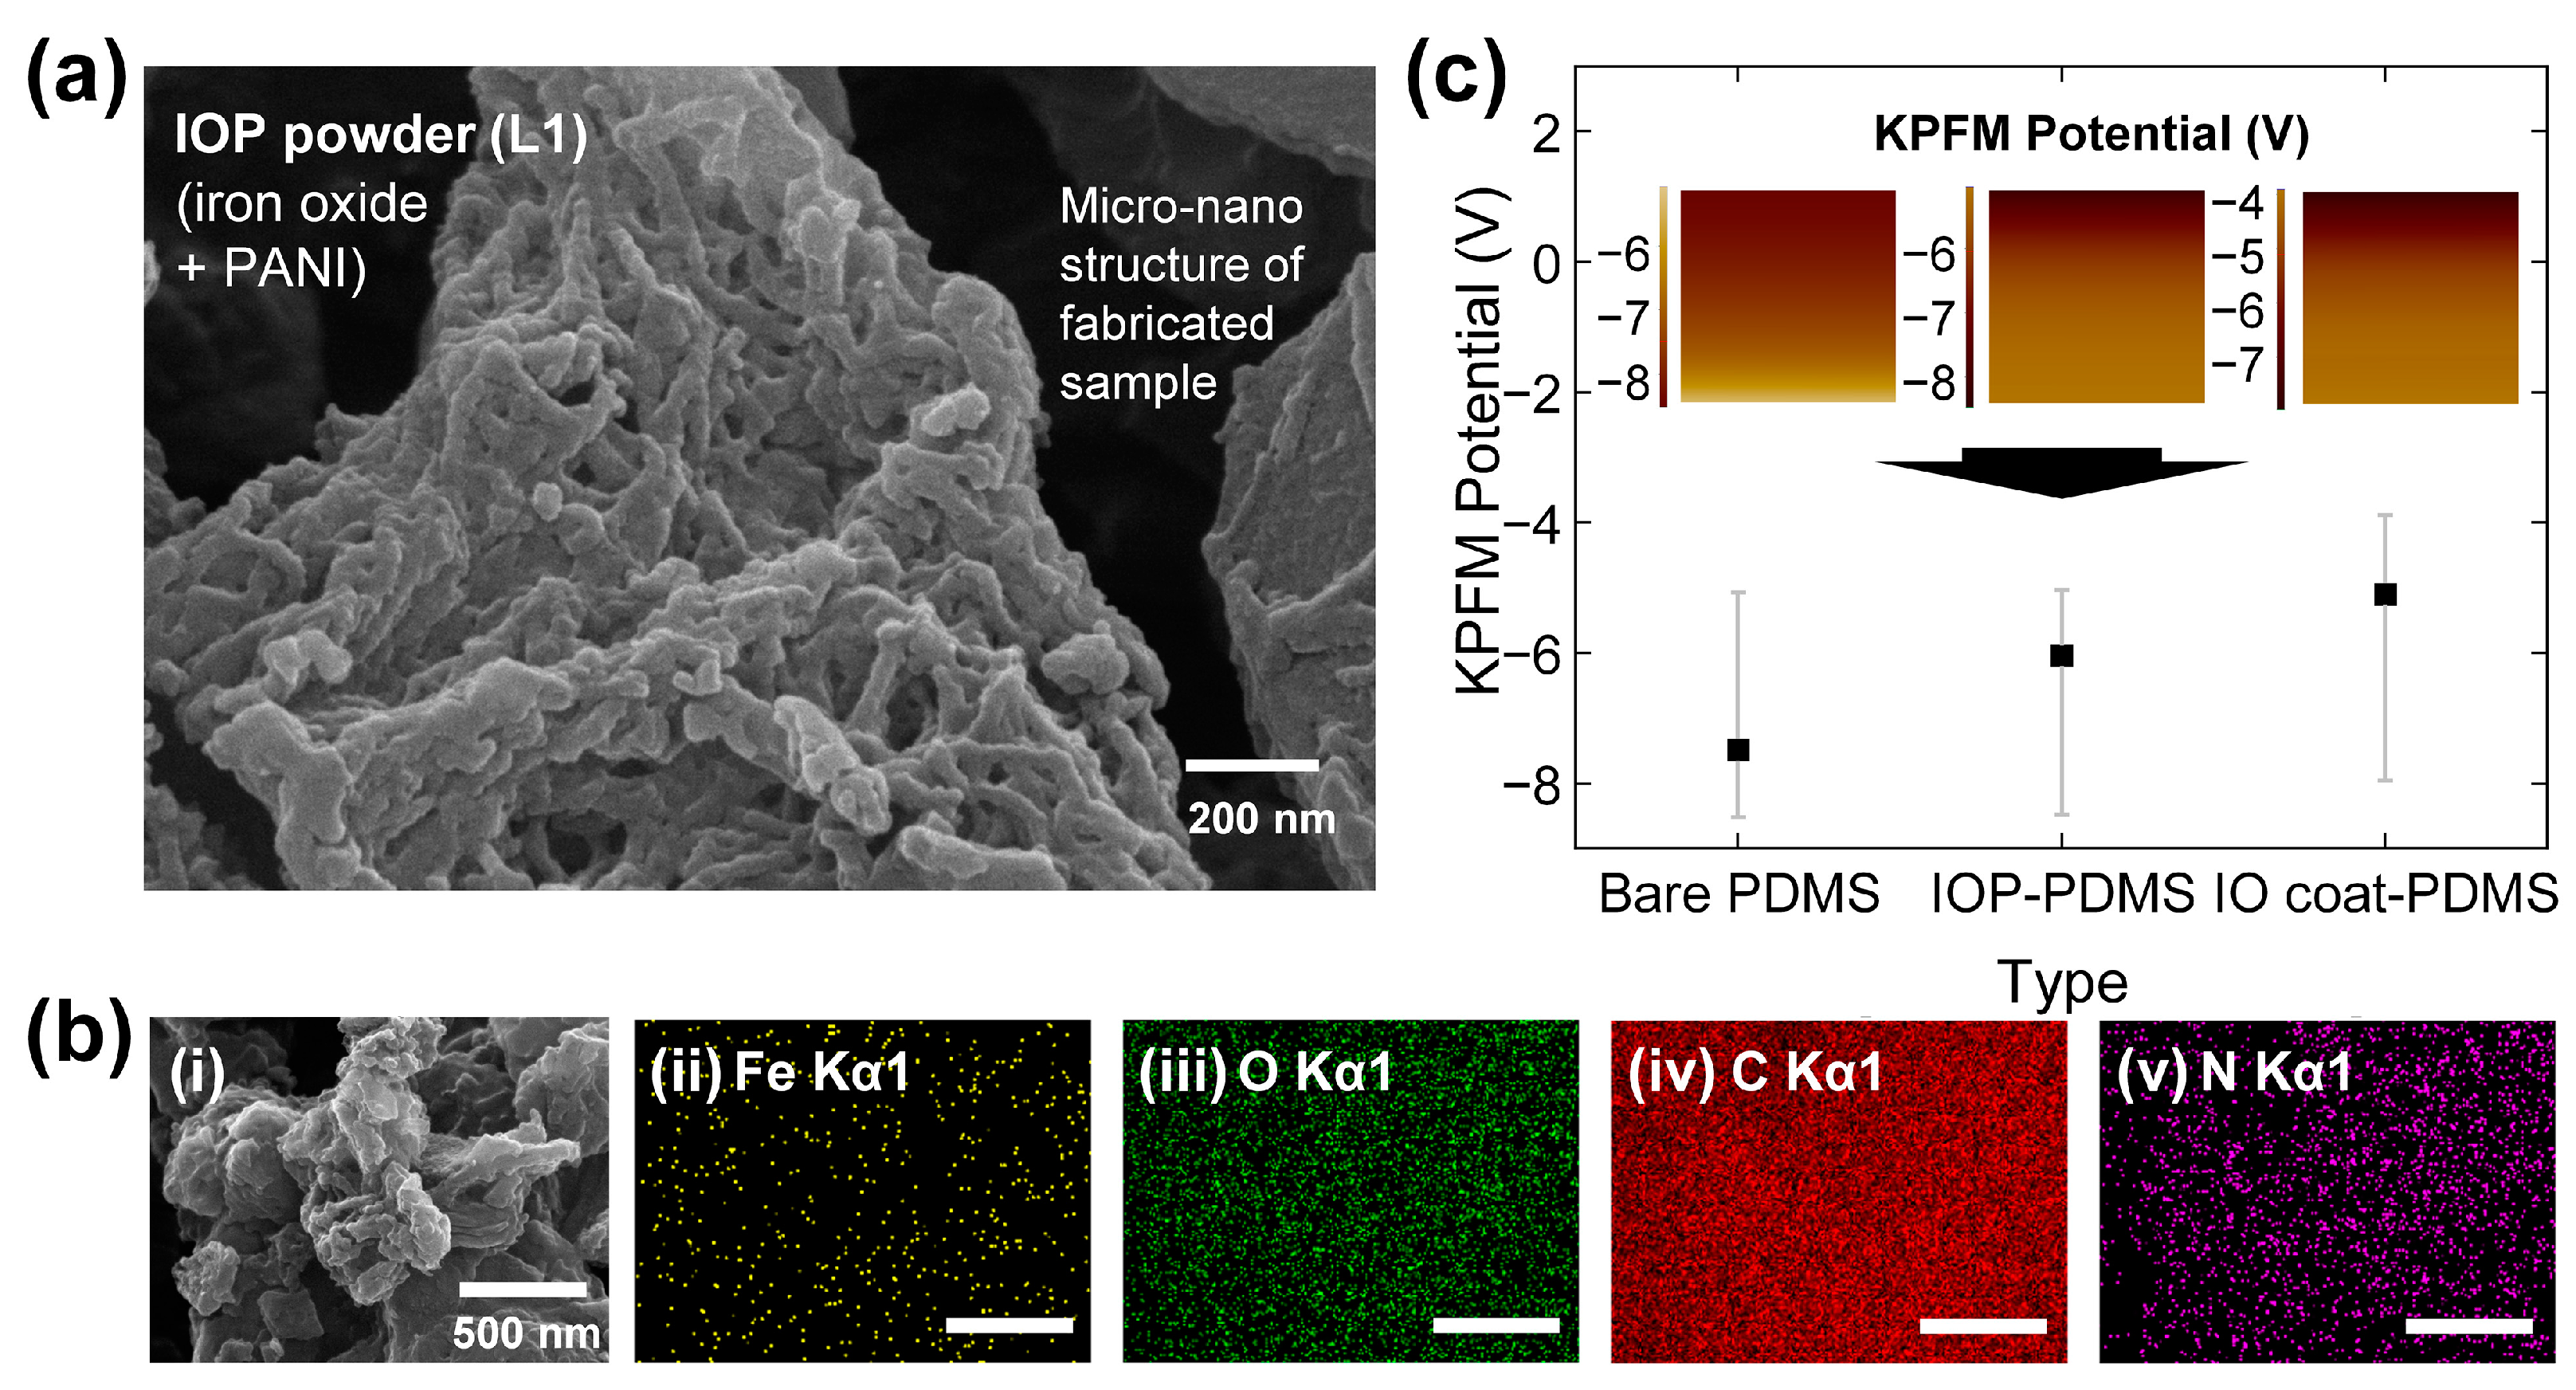
2.3. Analysis of Fabricated Powder Samples

Scanning electron microscope (SEM) images, energy-dispersive X-ray spectroscopy (EDAX) data, and elemental mapping images were acquired using a high-resolution field emission SEM (HR FE-SEM) from Carl Zeiss MERLIN (Oberkochen, Germany). The conditions were set at 10 kV and a working distance of 4.9 mm, with a magnification of 150,000×. X-ray diffraction (XRD) patterns were recorded using a Bruker D8 Advance diffractometer (Billerica, MA, USA). Furthermore, the molecular vibrations and stretching of the fabricated powders were characterized using a Fourier-transform infrared spectrometer (FT-IR) from Bruker ALPHA II (Billerica, MA, USA).

2.4. Fabrication of the PDMS Composite Layer

Polydimethylsiloxane (PDMS) from Dow Silicones Corporation Sylgard 184 (Midland, MI, USA) was applied to the Al electrode layer. The base and curing agent were mixed in a weight ratio of 10:1, and the appropriate mass of the powder was then incorporated. The mixture was degassed in a vacuum chamber to remove entrapped gases. For the toluene-incorporated variant, toluene was added in an amount equivalent to the total weight of the PDMS mixture. This PDMS blend was poured onto an Al layer affixed to a Si wafer with polyimide (PI) tape; then, it was spin-coated at 500 rpm for 5 s and cured in a convection oven at 110 °C for 12 min under ambient air.

2.5. Electrical Output Assessment of the TENG

Force was exerted using an electrodynamic shaker from Labworks Inc. LW139.138-40 (Costa Mesa, CA, USA), regulated by a signal from a function generator by Agilent Technologies, Inc. 33120A (Santa Clara, CA, USA), operating under varying input forces and frequencies. The electrical output data were captured using a Keithley Model 6514 system electrometer (Solon, OH, USA) interfaced with a multi-channel DAQ system, NI PCI-6220 (Austin, TX, USA), and a Stanford Research Systems SR570 low-noise current preamplifier (Sunnyvale, CA, USA) connected to a Tektronix MSO44 4-BW-200 oscilloscope (Beaverton, OR, USA). To construct the wind-TENG structure, two frame components were 3D printed from acrylonitrile butadiene styrene (ABS, ABS-A100) using a Cubicon 3DP-310F printer (Seongnam, Republic of Korea). The humidity response was assessed by modifying the ambient conditions with a humidifier and subsequently measuring the electrical output at an input frequency of 2 Hz.

3. Results and Discussion

3.1. Synthesis, Crystallography, Chemical Bonding, and Surface Characterization

The procedure employed for the synthesis of iron oxide-polyaniline (IOP) is depicted in Figure 1a using a one-pot co-precipitation method, followed by filtration and evaporation processes. Detailed elaboration of this procedure was provided in Section 2. The crystalline properties of the resultant IOP powder were examined using the X-ray diffraction (XRD) method, as depicted in Figure 1b.
For polyaniline (PANI), the Miller indices were identified as (011), (020), and (200), corresponding to 2θ values of 12.666, 20.524, and 25.940° with d spacings of 6.983, 4.324, and 3.432 Å, respectively [53]. The d spacing represented the distance between atomic layers in a crystal. Alongside these PANI peaks, the IO (Fe3O4) peaks were discerned at 30.323, 35.726, 43.361, 53.841, 57.359, and 62.973°, indicative of the (220), (311), (400), (422), (511), and (440) Miller indices with d spacings of 2.945, 2.511, 2.085, 1.701, 1.605, and 1.475 Å, respectively [54,55]. At a lower iron precursor concentration with the iron precursors of 1.16 mmol, labeled as L1, the XRD spectrum of IOP closely resembled that of PANI. Conversely, at a higher concentration labeled as L4 with the iron precursors of 4 mmol, the XRD spectrum showed alignment with the characteristics of IO. Iron precursors were added at concentrations of 1.78 mmol in L2 and 2.66 mmol in L3, corresponding to a 1.5-fold increase in mass with each subsequent label. These XRD results not only confirmed the crystallinity of the synthesized iron oxide but also validated the presence of PANI.
Based on the XRD peaks of iron oxide (IO) at (311), the crystallite size D was calculated using the Debye–Scherrer formula:
D = /βcos θ
where K is the shape factor (typically 0.98), λ is the X-ray wavelength, β is the full width at half maximum (FWHM) of the diffraction peak, and θ is the Bragg angle [56,57,58]. IO showed a D value of 12.03 nm. Next, the volume of the magnetic particles was calculated. Knowing the D value, the volume V of a single crystallite (assuming a spherical shape for simplicity) is as follows:
V = 4π/3·(D/2)3
IO showed a V value of 9.11 × 10⁻²⁵ m3. The magnetic moment m per particle can be related to the volume and the bulk saturation magnetization Msbulk:
m = V·Msbulk
Using this formula with the known value of Msbulk for magnetite, 480 kA m−1, the m value was calculated to be 4.37 × 10⁻¹⁹ A m2 [59,60].
Organic characteristics were reflected in the FT-IR spectra, presented in Figure 1c. PANI displayed the N–H bond featuring free stretching at 3260–3259 cm−1 [61]. The C–H bond appeared in two regions: 3054–3053 cm−1 and 1039–485 cm−1, corresponding to the asymmetric stretching and out-of-plane bending of the 1,4-disubstituted benzenoid rings, respectively. The C=C bond was discernible in the ranges of 1580–1550 cm−1 and 1497–1413 cm−1, denoting the quinoid stretching and benzenoid rings stretching, respectively. The C–N bond manifested in the 1297–1144 cm−1 range, indicative of the aromatic region’s stretching. A distinguishing feature of the IOP was the presence of the M–O–C (M = Fe) bond, observed at 1072.5 cm−1, highlighting the existence of the composite material [62].
Scanning electron microscopy (SEM) was utilized to examine the surface morphology of the synthesized powders. Sub-micro-sized particles and grain sizes in the range of hundreds of nanometers for the IOP powder with L1 were revealed, as shown in Figure 2a. In contrast, grain sizes of less than 100 nm for pure PANI were exhibited, as shown in Figure S1a (Supplementary Material). A sphere-like structure with grain sizes under 100 nm for both the L4 and IO powders is evidenced in Figure S1b,c, respectively. A predominantly visible rod-like structure on the surface, accompanied by a decrease in the presence of sphere-like structures, was observed as the PANI ratio increased, as indicated in both Figure 2a and Figure S1. To identify the atomic presence on the surface of the IOP powder with L1, energy-dispersive X-ray spectroscopy analysis (EDAX) was employed, illustrated in Figure 2b. The distributions of Fe, O, C, and N atoms within the SEM image of Figure 2b(i) were delineated in Figure 2b(ii–v), correspondingly confirming the coexistence of IO and PANI.
The surface potential of the powder embedded in PDMS was evaluated using Kelvin probe force microscopy (KPFM) to quantitatively assess the triboelectric polarity. The cantilever, coated with Au, was utilized to measure the surface potential. Three sample types were analyzed in this KPFM study, as shown in Figure 2c: bare PDMS, IOP-embedded PDMS (IOP-PDMS), and IOP-embedded PDMS with an IO coating (IO coat-PDMS). The lowest surface potential was exhibited by bare PDMS with an average value of −7.492 V, followed by IOP-PDMS at −6.045 V. The highest potential at −5.101 V was presented by IO coat-PDMS, attributed to the addition of the tribo-positive IO-based powder [63,64]. The surface potential profiles are further detailed in the inset of Figure 2c.

3.2. Magnetization Properties of IO-Based Powder and Electrical Output Characteristics with CS-TENG

The structure of the contact/separation-based TENG is depicted in Figure 3a. For the construction of the contact dielectric layer, a composite layer of PDMS was established on the bottom Al electrode. A specific weight percentage (wt%) of IOP powder was incorporated into the base of PDMS, and toluene was introduced to enhance the dispersion of IOP powder within PDMS. After thorough mixing, a curing agent was integrated into the dispersion at a weight ratio of 10:1 between the base and the curing agent, followed by additional stirring. This composite dispersion was then spin-coated onto the bottom Al electrode and cured at 110 °C for 10 min, resulting in a layer of the PDMS composite embedded with IOP powder. For further modifications, the application of IO powders atop the PDMS composite layer was performed using a simple wiping technique, which served to reduce the stickiness of the PDMS composite layer.
The operational principle of the TENG with the force or wind injection is detailed in Figure S2. Following several cycles of contact and separation, the PDMS composite layer acquired negative charges through electrification with the top Al electrode. In the distant configuration depicted in Figure S2a, positive charges accumulated on the bottom Al electrode to maintain charge neutrality. As the top electrode approached the bottom layer, positive charges began to be induced on the top layer, resulting in an upward directional current as shown in Figure S2b. At the point of complete contact, represented in Figure S2c, the flow of current ceased, and all positive charges settled on the surface of the top electrode. During the separation phase illustrated in Figure S2d, the influence of the negative surface charges diminished, causing the positive charges to migrate to the bottom electrode. Concurrently, a current flowed from the top electrode to the bottom electrode. This mechanism facilitated the generation of an alternating current through the TENG, which then flowed through the load. The electric potential difference associated with each stage, as portrayed in Figure S2a–d, was investigated using the finite element method (FEM). Results are presented in Figure S3a–d corresponding to each stage. Within this model, IOP particles were conceptualized as a distinct layer sandwiched between the two PDMS layers on the bottom Al electrode. A notable observation was that the potential difference amplified as the separation between the two components increased.
The capability for magnetization of the synthesized powder, with iron precursor concentrations varying within a 20 mL vial, was evaluated based on the setup illustrated in Figure 3b. Samples L1, L2, L3, and L4 of IOP were prepared by adjusting the molarity of iron precursors to 1.185, 1.778, 2.667, and 4 mmol, respectively, while constant amounts of aniline and ammonium persulfate (APS) were maintained. For the production of pure IO, 4 mmol of both iron precursors was utilized, without the addition of aniline and APS. Due to solubility constraints, concentrations higher than those in L4 could not be achieved within the same solution volume. The magnetic flux density of the ferrimagnetic powder samples was measured using a Gauss meter sensor, which was positioned atop a permanent magnet. As the molarity of iron precursors increased from L1 to L4, a corresponding rise in magnetic flux density was noted, ranging from 432.1 G to 492.6 G. The IO powder sample demonstrated a magnetic flux density of 866.7 G, which was superior compared to that of the IOP powder samples.
The triboelectric properties of the fabricated IO-based powder were assessed using the CS-TENG with an effective contact area of 2 × 2 cm2, employing a consistent external input from an electrodynamic shaker at 2 Hz. Among the IOP-embedded PDMS samples, L1 demonstrated the highest electrical outputs, registering 93.86 V and 6.9 µA for peak-to-peak voltage and negative peak current, as depicted in Figure 3c,d, respectively. The variation in electrical outputs from L1 to L4 might be ascribed to the agglomeration or repulsive forces among the IO particles, particularly with increasing concentrations of iron precursors. However, the outputs from L1 exceeded those of the standalone PANI-embedded PDMS samples (30.736 V and 4.854 µA) and IO-embedded PDMS samples (34.689 V and 4.592 µA). This enhancement was attributed to the synergistic effects achieved by electrically integrating the IO powders with PANI in the IOP powder, a conclusion supported by XRD and FT-IR analyses [65]. Additionally, the inherent characteristics of the PANI polymeric coating provided further evidence for these observed results [66]. The optimal ratio of IOP in the PDMS, determined through variation, aimed to yield the highest electrical outputs for the CS-TENG. At a concentration of 0.5 wt% IOP powder in PDMS, the highest electrical outputs were observed, with recordings of 93.86 V and 6.9 µA, as demonstrated in Figure 3e. An initial rise in the electrical output occurred as the concentration of IOP increased, attributed to the superior relative permittivity of magnetite (3.5) compared to that of PDMS (2.69) [67,68]. Nevertheless, electrical outputs began to decline beyond the optimal concentration of 0.5 wt%, a reduction likely caused by the enhanced stickiness of the PDMS composite layer, which obstructed the separation of the contact layers. Therefore, 0.5 wt% was established as the optimal concentration for the PDMS composite layer.
Throughout the stirring and curing stages of the PDMS composite layer, two techniques were employed to augment the dispersal of IOP powder, with outcomes illustrated in Figure S4. The first technique involved positioning a plate magnet beneath the Si wafer during the curing phase in the convection oven, denominated as “only magnet”. This method resulted in a 7.1% increment in output voltage and a 5.2% decrement in output current compared to the CS-TENG using bare L1. The magnetic field pattern emanating from the plate magnet likely diminished particle interconnectivity, consequently decreasing the output current. However, the creation of a wave-like surface structure might enhance the output voltage due to an enlarged contact area, as inferred from the results with bare L1 [69]. The introduction of toluene, termed “magnet + toluene”, seemingly accentuated the aforementioned characteristics. The dilutive effect of toluene on PDMS precipitated a substantial 90.5% increase in output voltage and a 29.2% decrease in output current [70]. Owing to its superior augmentation of output voltage compared to output current, the “magnet + toluene” approach was consistently adopted in the experiments throughout this study.
During the assessment of the force response, the CS-TENG was subjected to varying input forces ranging from 6.5 to 511.0 N, at a frequency of 2 Hz, as depicted in Figure 3f. The electrical output values were normalized at an applied force of 91.9 N, demonstrating a decreasing trend in the gradient after this point. Specifically, the gradient values for output voltage and current were observed to decrease from 0.014 and 0.017 to 0.0007 and 0.002 N−1, respectively, beyond a force of 60 N. Initially, the enhancement in output values was attributed to the encapsulation of particles within the PDMS layer, facilitated by forced contact. Subsequently, the rate of increase in outputs was mitigated, with only minor deformations observed in the PDMS layer. These findings underscore the force-responsive characteristics of the IOP-TENG in the CS mode, highlighting its sensitivity to dynamic mechanical stimuli.

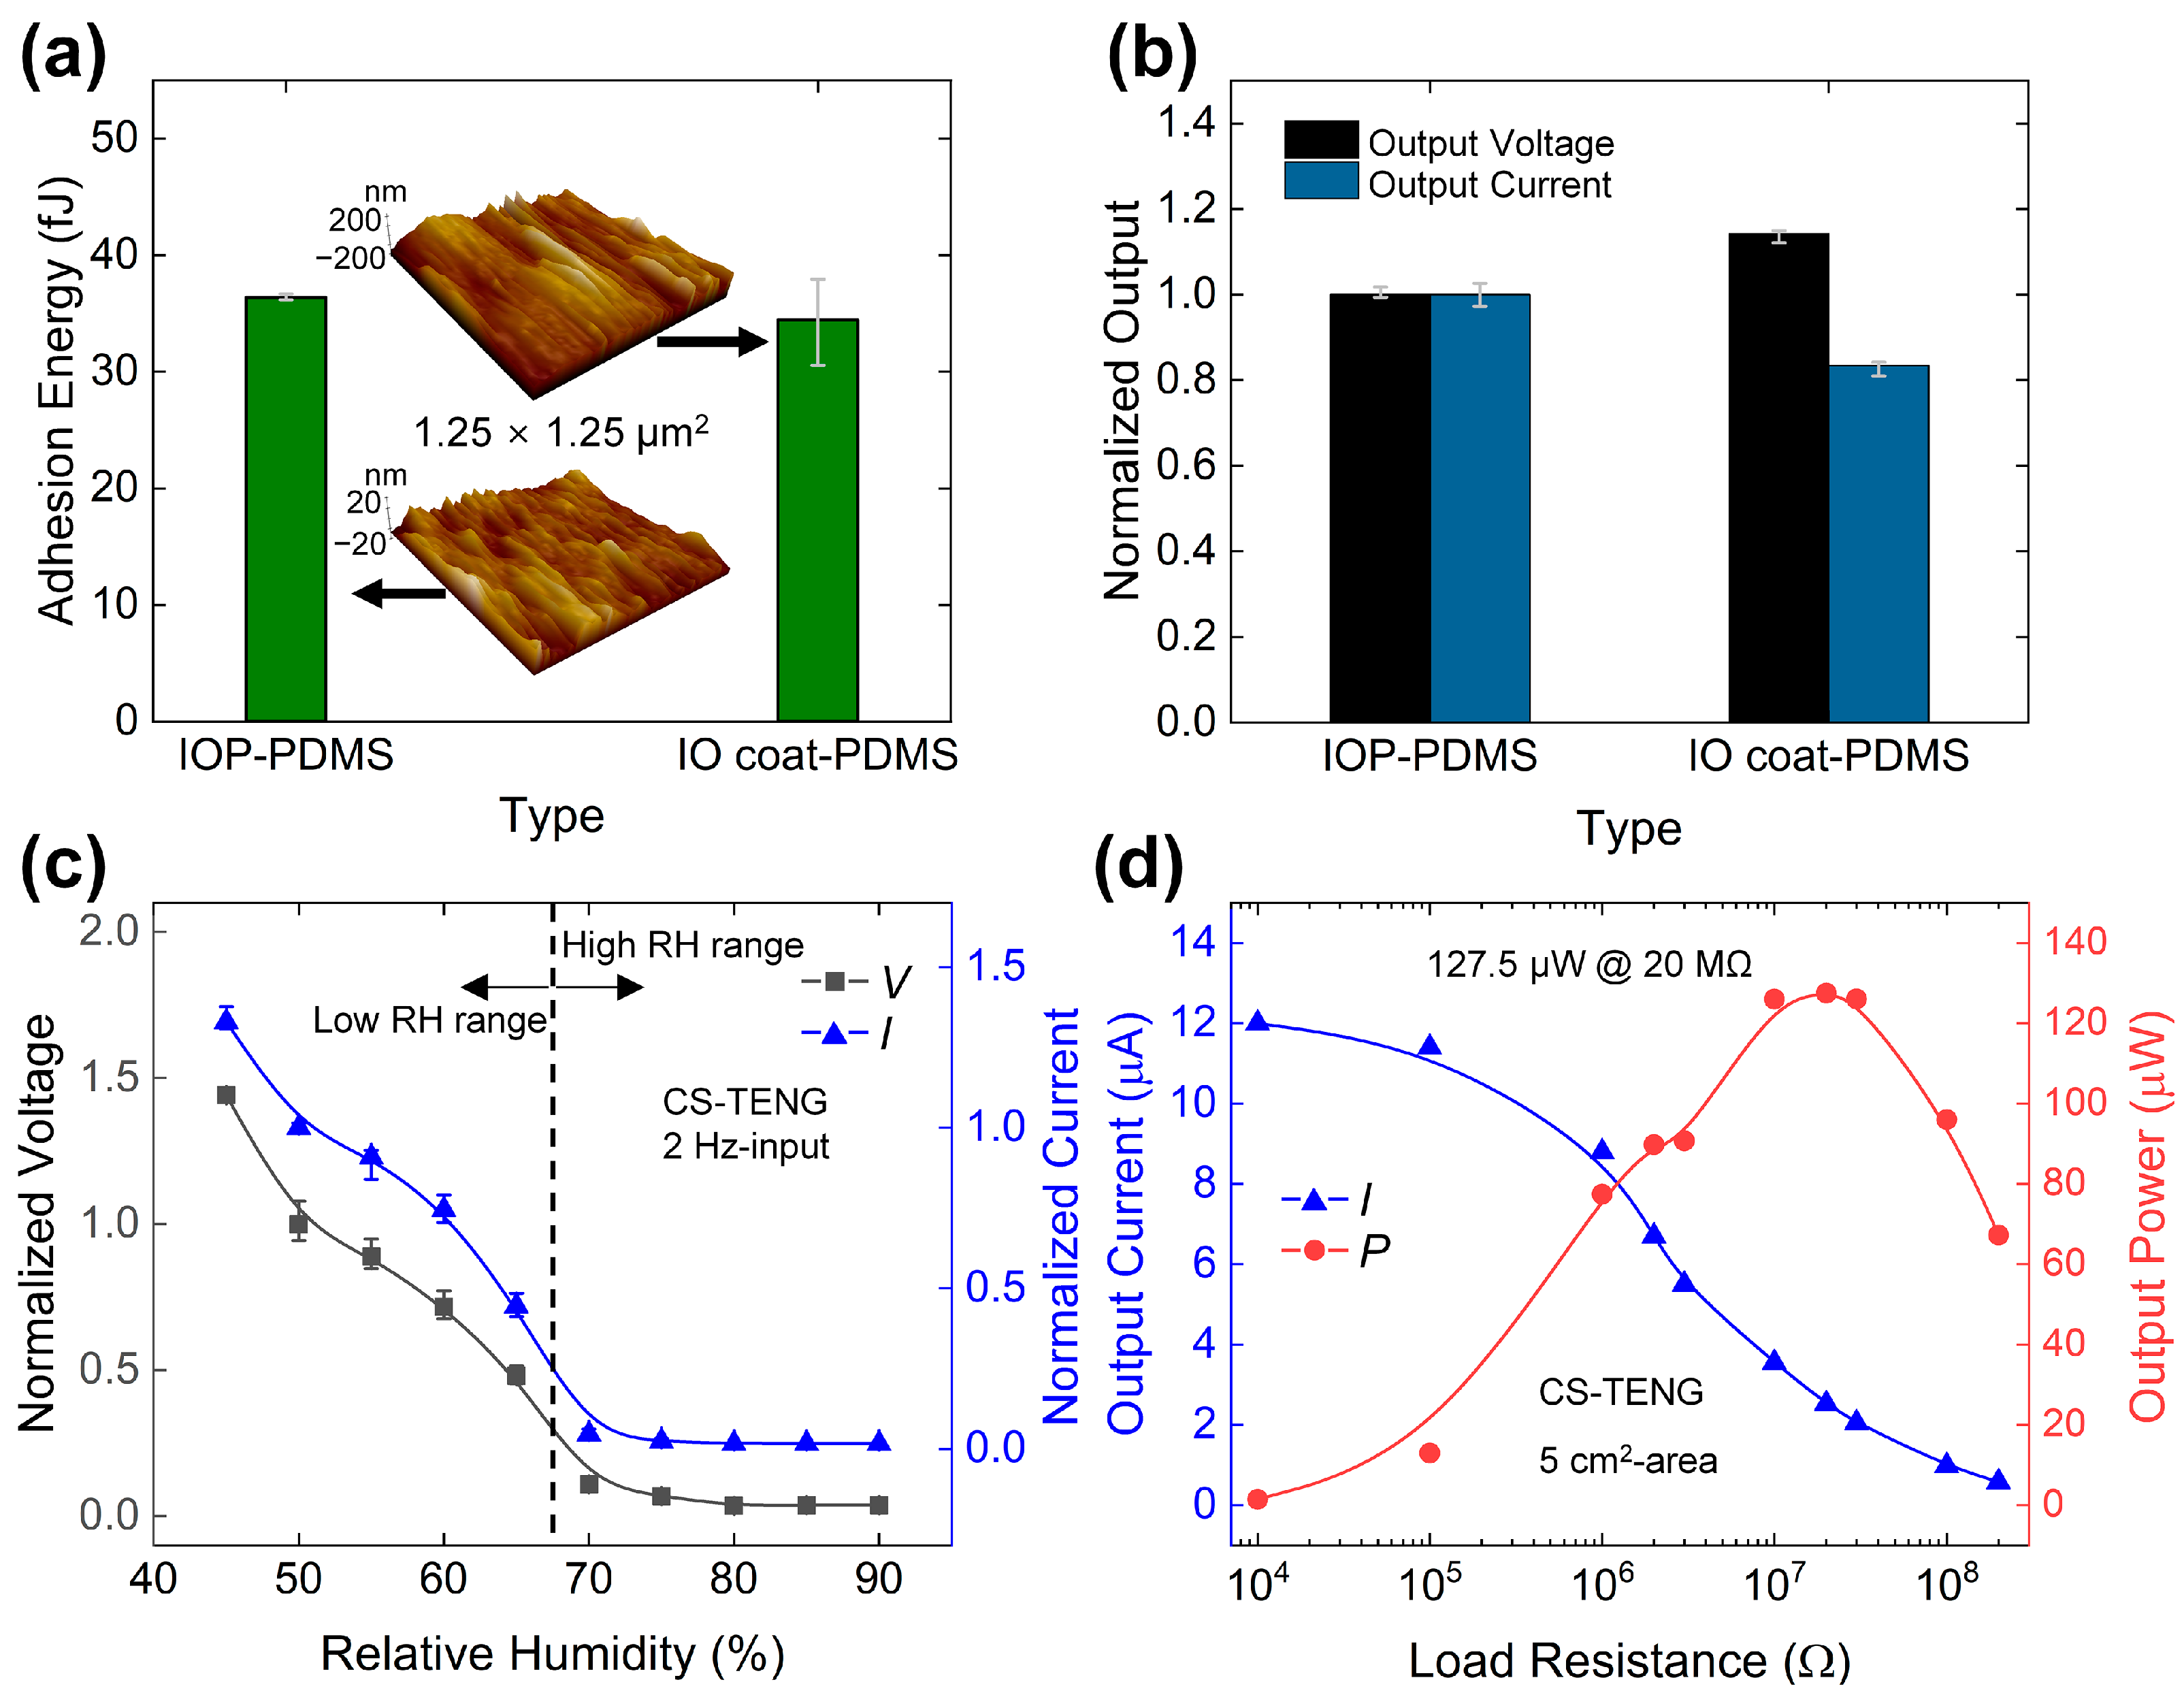
3.3. Electrical Output Responses of CS-TENG after IO Coating

For enhanced separation of the two contact layers and heightened sensitivity to minimal input, IO powder was applied to the surface of the PDMS composite, resulting in a sample denoted as “IO coat-PDMS”. The adhesion energy values for both conditions, with and without the IO coating, underwent examination using atomic force microscopy (AFM) in the PinPoint™ operation mode. As depicted in Figure 4a, a 5.2% reduction in adhesion energy, amounting to 34.5 fJ, was demonstrated by the IO coat-PDMS compared to the IOP-PDMS.
Furthermore, the electrical outputs of the CS-TENG underwent analysis for both the IOP-PDMS and IO coat-PDMS samples, as presented in Figure 4b. An augmentation of 14.2% in output voltage was observed, attributed to the expanded contact area due to the presence of micro-/nano-sized particles on the PDMS layer. The current for the IO coat-PDMS sample underwent a decrease, likely due to the reduced stickiness of the IO coating, leading to a slower separation speed compared to that of the IOP-PDMS sample. A decline of 16.6% in the output current was observed following the application of the IO coating.
For utilizing this TENG in real conditions, the humidity response was examined to attain the standard output value according to each condition with this IO-coated PDMS layer. In Figure 4c, decreasing trends were observed with both output voltage and current curves under 65% of relative humidity (RH) with the formation of water droplets on the surface. Over 70% of RH, the saturation trends were checked with normalized values under 0.1. These trends can be utilized for determining the standard output value under 70% of RH as a reliable sensor.
To quantitatively compare the output of the CS-TENG with findings from other studies, the output power of the fabricated device was assessed by measuring the output current while varying the load resistance. As depicted in Figure 4d, a peak output power of 127.5 µW was observed at a load resistance value of 20 MΩ for an effective contact area of 5.5 × 5 cm2. The output power was determined by multiplying the squared maximum output peak current with the respective load resistance value. The load resistance at which the peak output power was observed indicates the internal resistance of the CS-TENG in accordance with the maximum power transfer theorem.

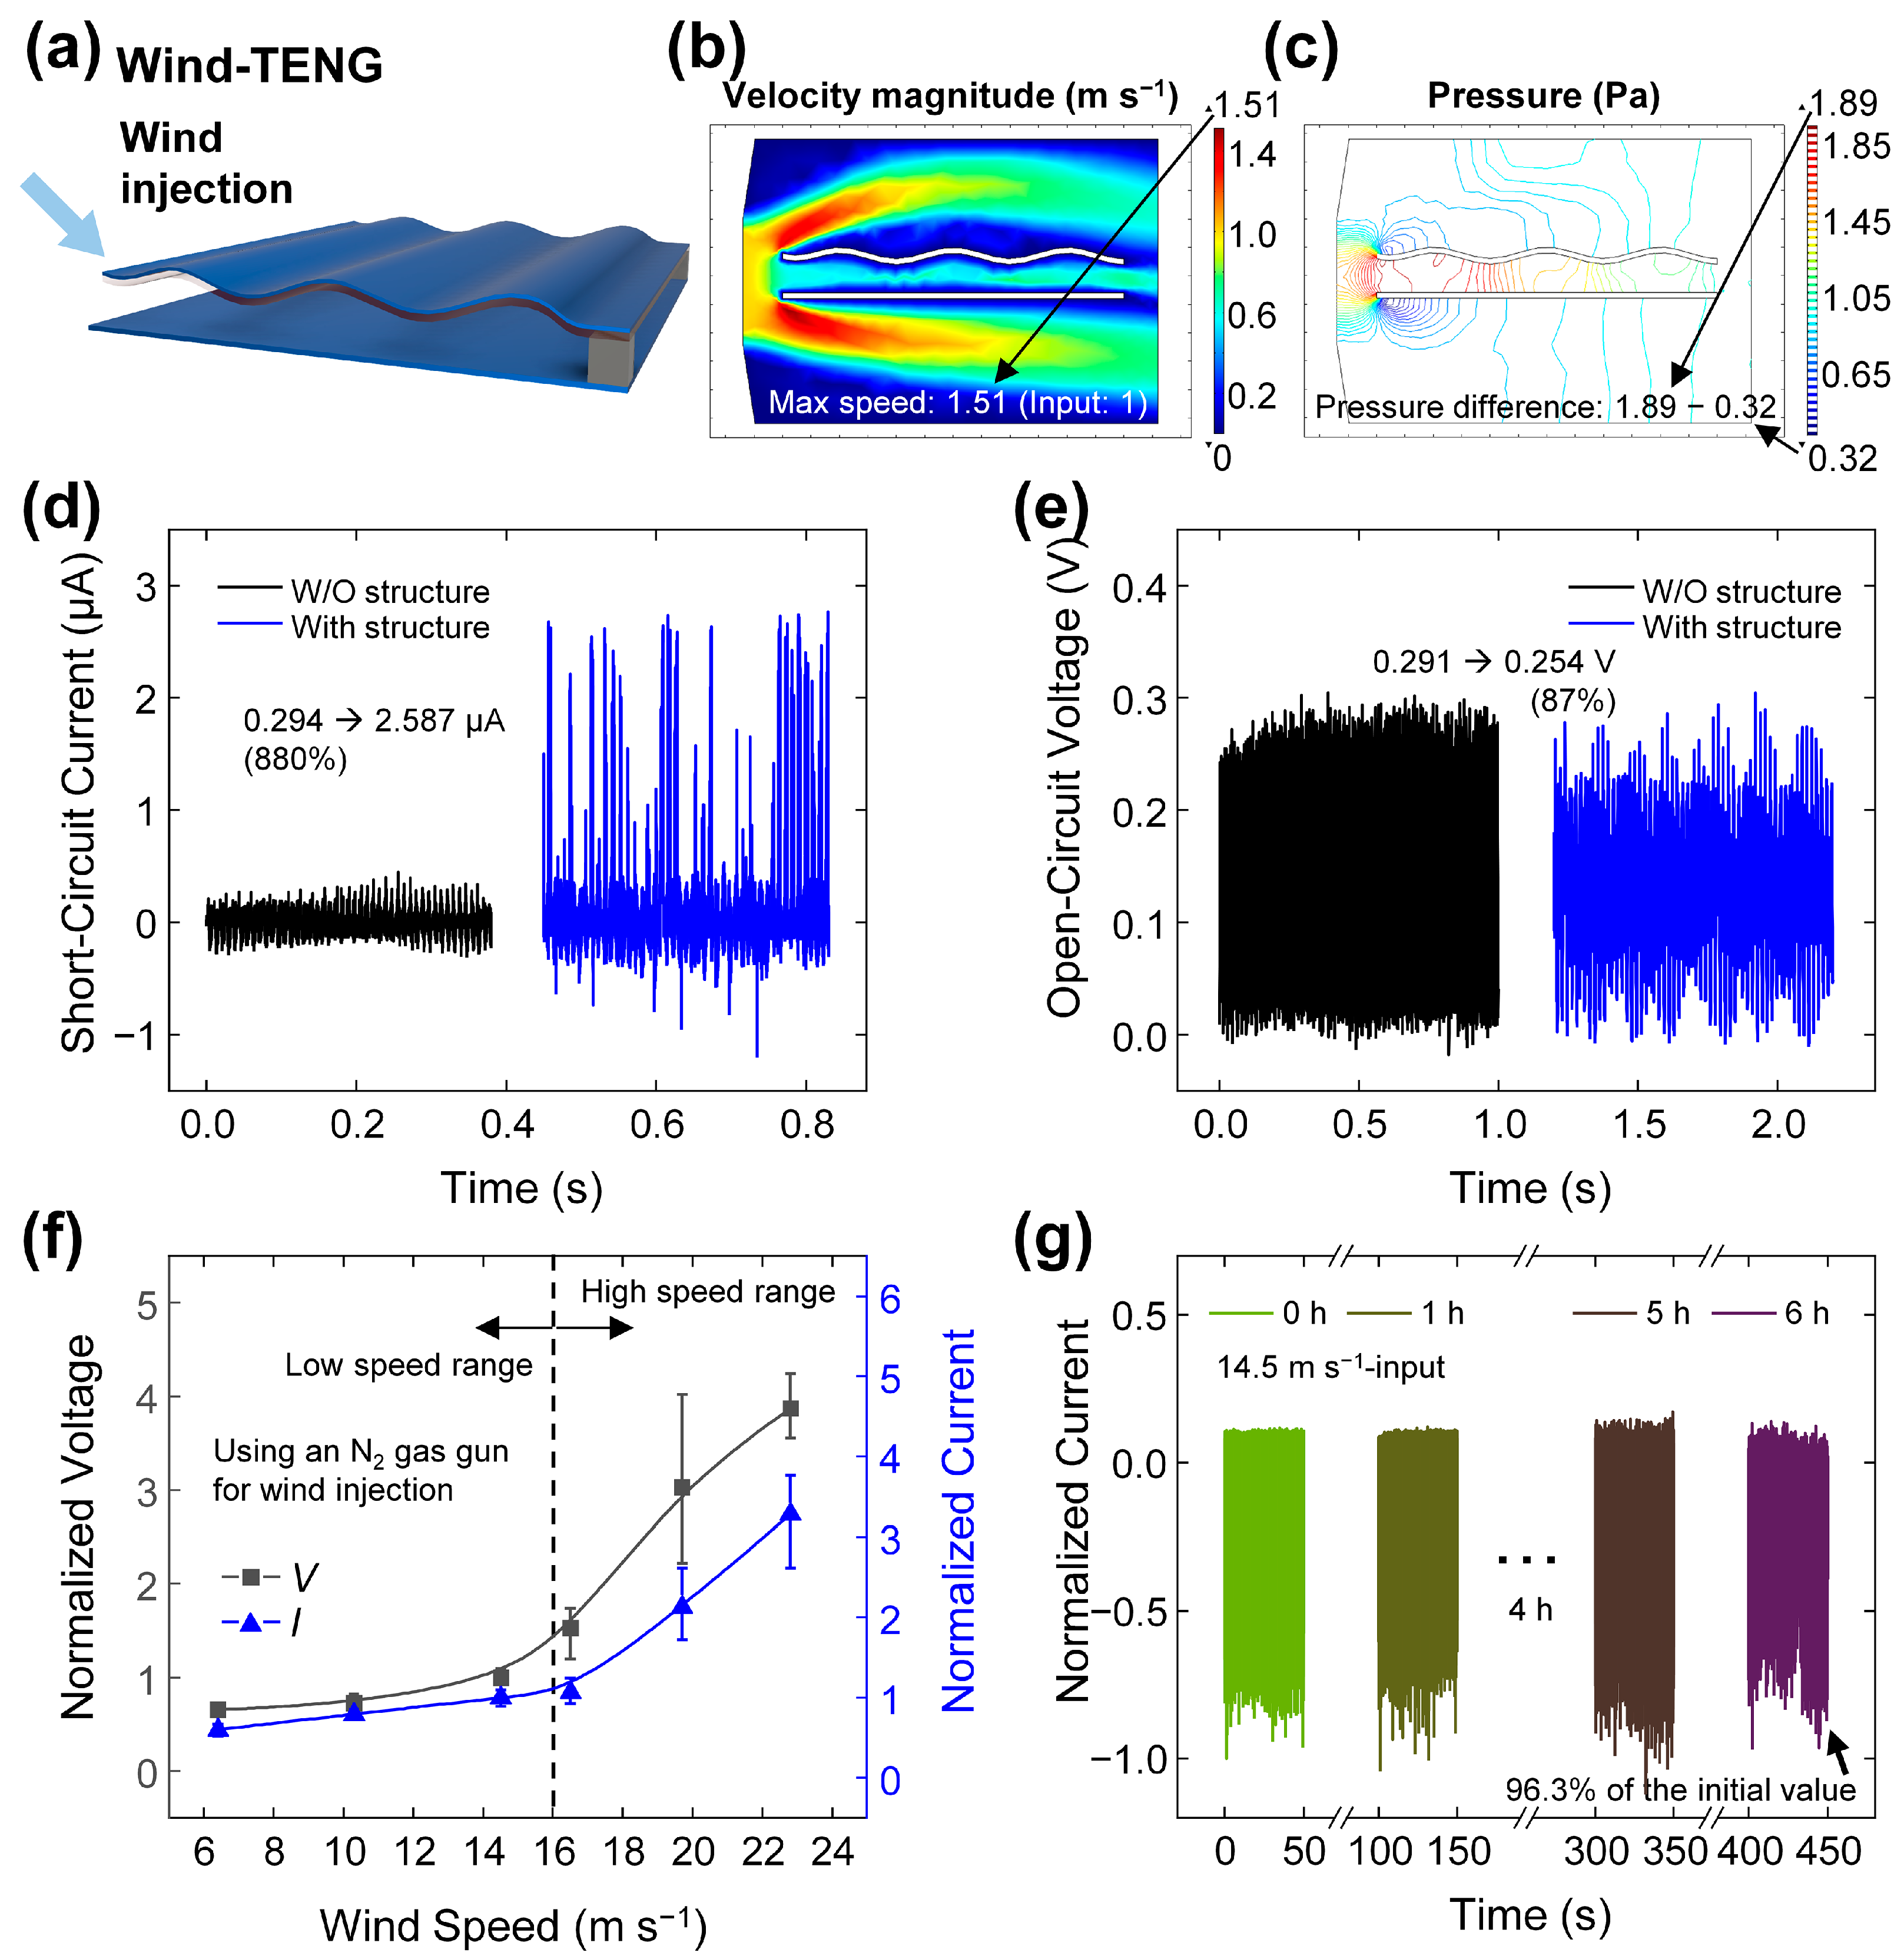
3.4. Electrical Output Analysis for Wind-TENG

Optimized samples, tested with the CS-TENG, facilitated the development of a wind-TENG as an application for the fabricated IOP. The schematic representation of the fabricated wind-TENG is illustrated in Figure 5a. Layers of electrodes, both top and bottom, were affixed to the polyimide (PI) substrates of 25 µm and 125 µm, respectively. Beneath the top Al electrode layer, the IO-coat PDMS layer was applied. For ease of separation, two spacers with magnetic plates were positioned between the contact layers. The wind input was introduced through the unfixed top left section using nitrogen gas delivered by an air gun.
For a more effective contact between the two layers, the structure of the wind-TENG underwent optimization using the finite element method (FEM) with laminar flow simulation. Illustrated in Figure S5, the comprehensive optimization process involved the adjustment of three parameters: the peak number of the top layer as observed in a side view, the gap distance between the two contact layers, and the location of the left end of the top layer, detailed in Figure S5a. The inlet and outlet of the 1 m s−1 wind are marked by the left and right blue dashed lines, respectively. For evaluation, two metrics were considered: the maximum wind speed and the maximum pressure difference within the structure. Simulation results led to the selection of a peak number of 3, a gap distance of 5 mm, and a left-end location of +1 mm, as presented in Figure S5b–d. These optimized conditions resulted in a maximum speed of 1.51 m s−1 and a pressure difference of 1.57 Pa, depicted in Figure 5b,c.
The structured wind-TENG was constructed using the optimized structure, and comparisons were drawn between its electrical outputs and those of the unstructured wind-TENG. In alignment with the results obtained from the laminar flow simulation, the structured wind-TENG demonstrated an output current value of 2.587 µA, which was 8.8 times higher than the output of the unstructured wind-TENG. This increase was attributed to the accelerated contact/separation process between the two contact layers, as depicted in Figure 5d. Nevertheless, a reduction of 13% in the output voltage value to 0.254 V was observed with the structured wind-TENG, as indicated in Figure 5e. This reduction could have resulted from the decreased effective contact area, caused by the presence of three peaks in the sideview structure, in comparison to the unstructured wind-TENG. Despite the reduction in output voltage, the substantial enhancement in output current after optimization indicated the success of the optimization process.
Analyses were conducted on the response of the structured wind-TENG to varying input wind speeds with continuous nitrogen gas injection, as illustrated in Figure 5f. The output voltage and current curves diverged at wind speeds below and above 17 m s−1. Notably, both segments of the output voltage curve exhibited an identical slope of 0.055 m−1 s. By segmenting the wind input into low- and high-speed sections and implementing a correction process, the wind speeds were detected linearly. Furthermore, a consistent output current of 96.3% was maintained during a 6 h operation under a high-speed wind condition of 14.5 m s−1, during which significant swaying of large branches was observed. This consistent performance, as demonstrated in Figure 5g, further substantiated the reliability of the electrical output.

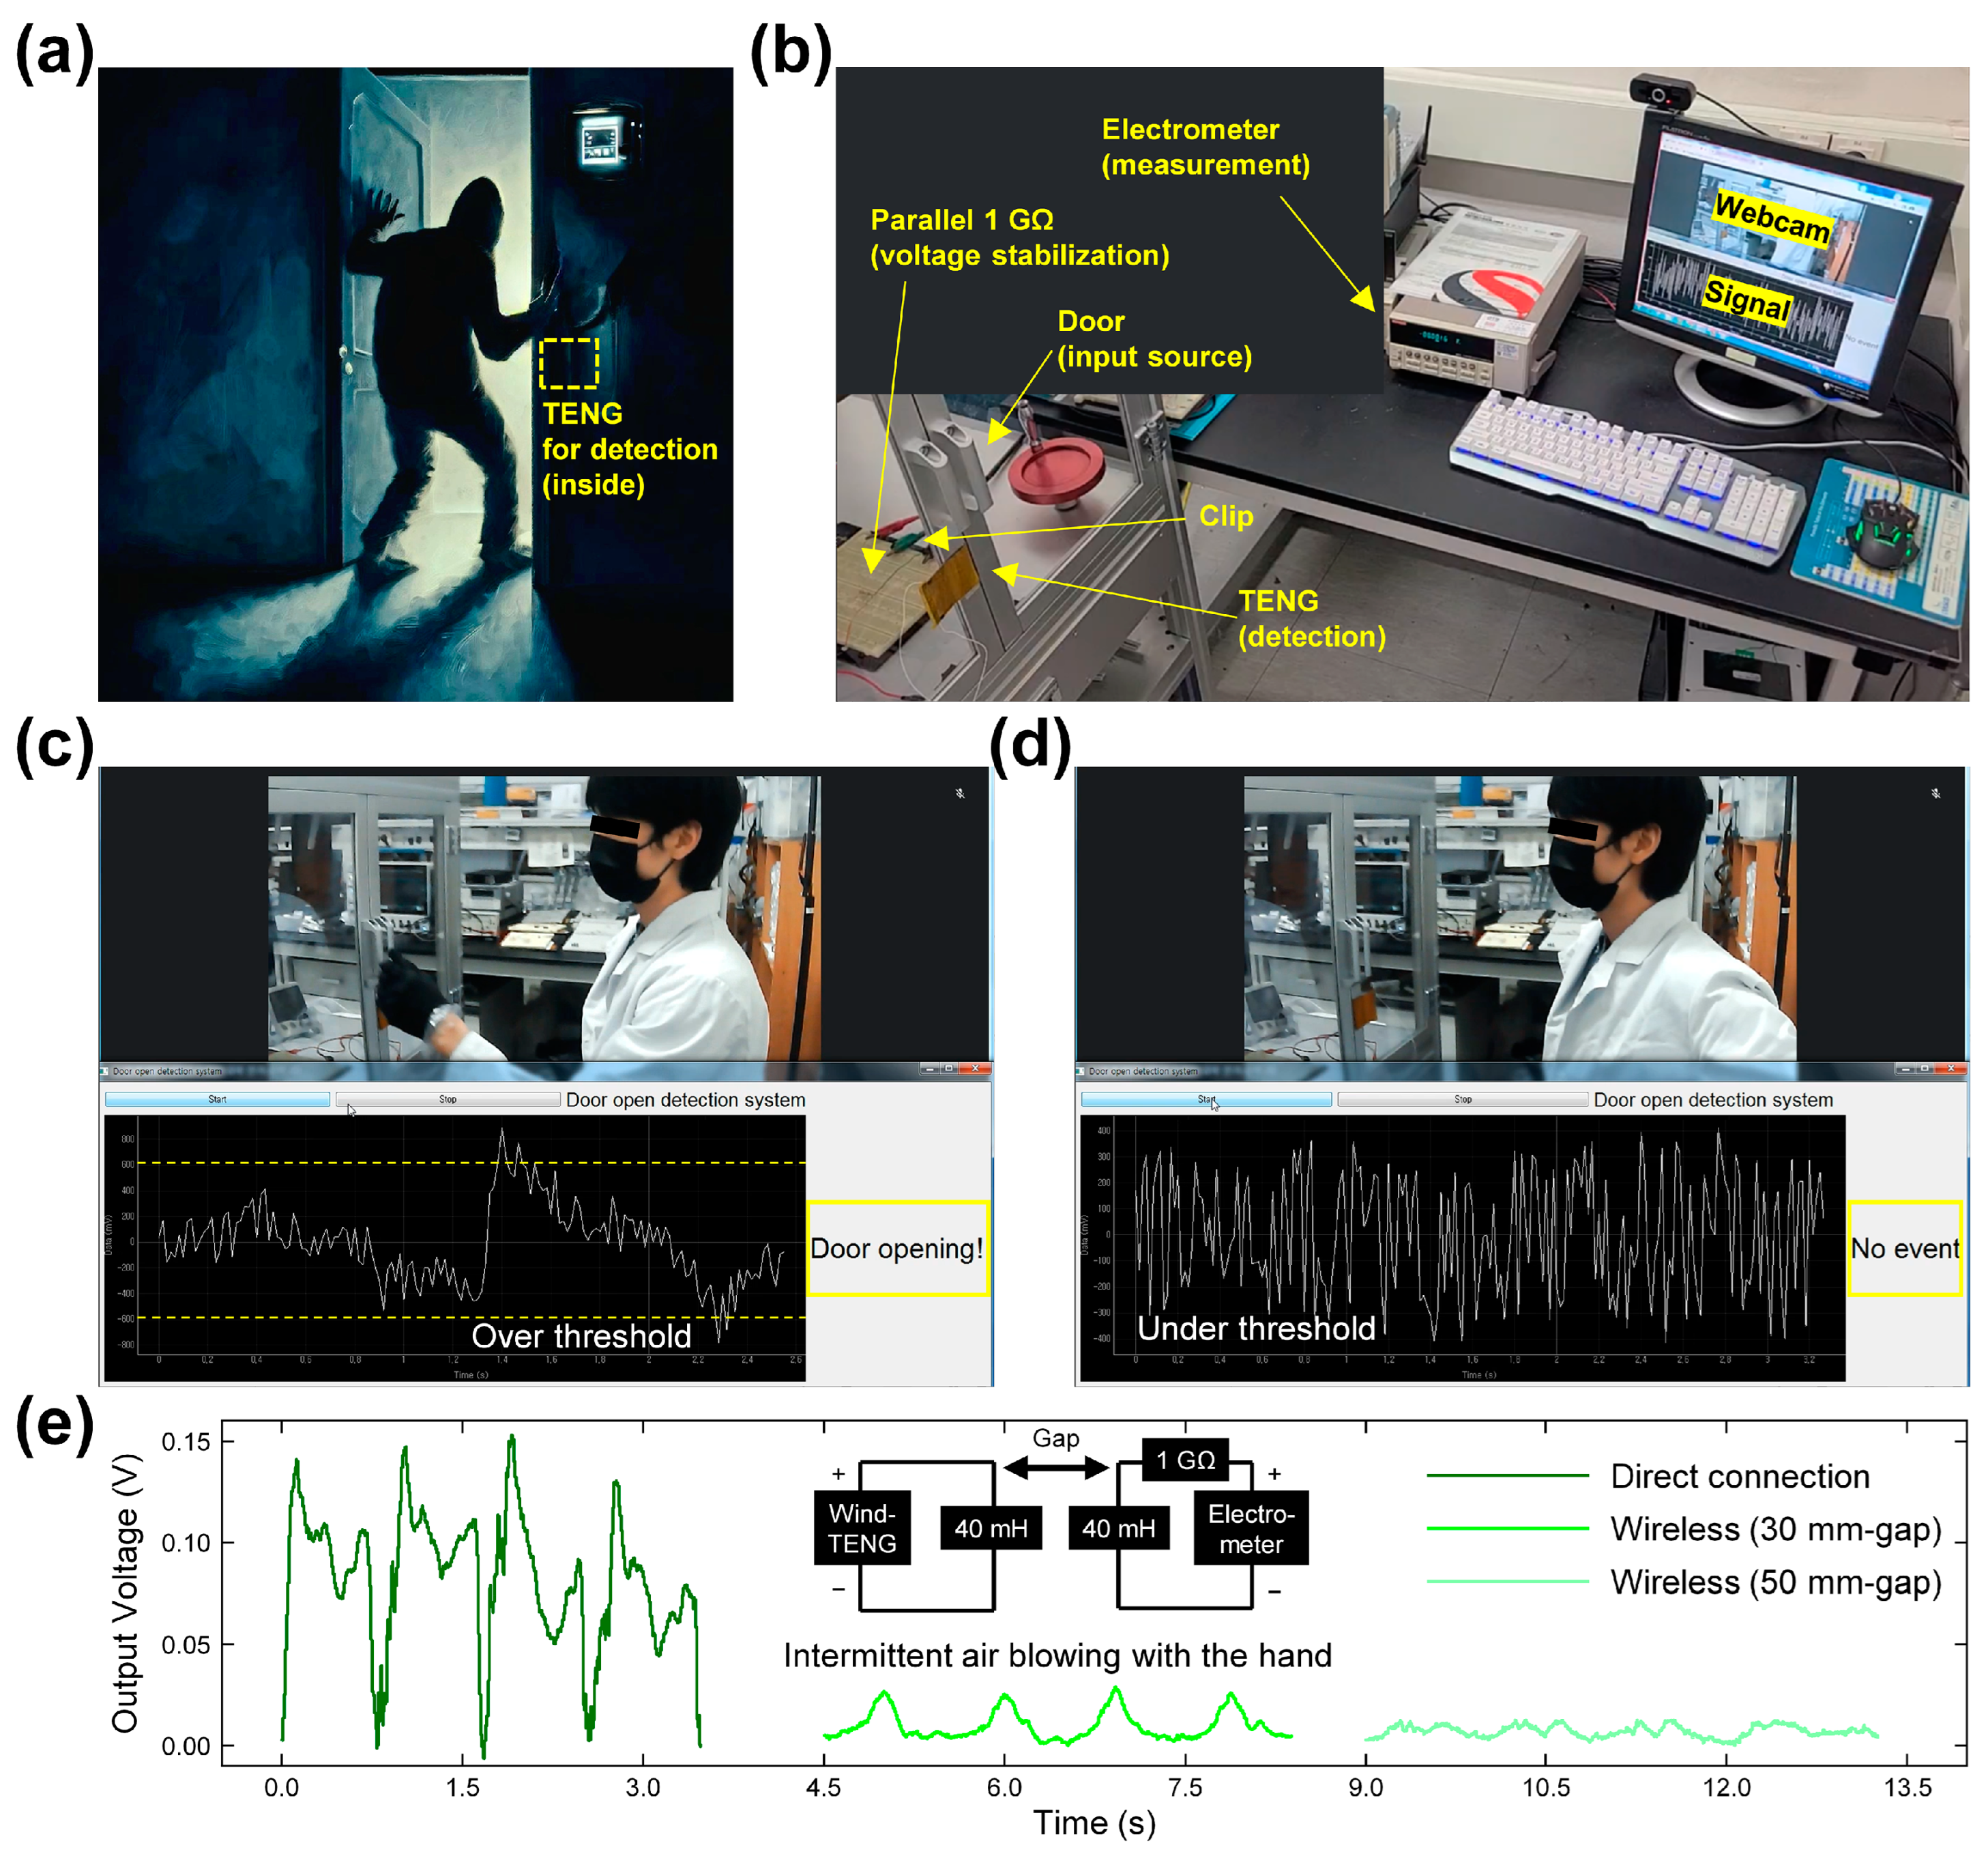
3.5. Application for Intrusion Detection System

Potential applications of the introduced wind-TENG in an intrusion detection system include sensing door openings, as illustrated in Figure 6a. For this application, an experimental setup was arranged, as shown in Figure 6b, with the structured wind-TENG affixed to a stationary door. A 1 GΩ resistor, connected in parallel, was utilized to achieve a stable output voltage, subsequently linked to an electrometer for output detection. A Python script was developed to identify signals surpassing a predetermined threshold value of 0.6 V, established through multiple measurements. Upon detection of such signals, the system captures an image of the potential intruder and dispatches an alert email to the property owner.
Despite the intermittent wind speed generated during door opening being approximately 0.1 m s−1, and the influence of the parallel resistor reducing the output level, the system demonstrated effectiveness in distinguishing an intrusion, thus facilitating the detection process. The door-opening test is viewable in Video S1, while the captured image relayed to the property owner is displayed in Figure 6c. Conversely, scenarios without intrusion were also examined, with the related procedure documented in Video S2. An image, captured after a 3 s wait and presented in Figure 6d revealed no significant event due to the output voltage level being below the designated threshold.
To enhance user convenience, the integration of the inductive coupling technique was employed to facilitate wireless communication, as demonstrated in Figure 6e. This configuration was based on methodologies previously established in the literature [71]. The system incorporated a 40 mH inductor at the transmitter and a combination of a 40 mH inductor with a 1 GΩ resistor at the receiver, enabling detection capabilities at distances of up to 50 mm between transmitter and receiver. Manual application of intermittent air towards the wind-TENG resulted in output voltage reductions to 19.1% at a 30 mm distance and 8.7% at a 50 mm distance, as detailed in a comparative analysis. This performance underscores the effectiveness of the inductive coupling technique in facilitating short-range wireless detection of intrusions, offering a viable approach for behind-the-door monitoring with the wind-TENG system.
The efficacy of the proposed wind-TENG for the intrusion detection was validated through the testing process. This approach, particularly when integrated with IoT technology in relatively stable indoor environments, holds promise for intrusion detection. As new functional nanomaterials leveraging magnetic properties are incorporated, the range of applications for TENG is expected to expand.

4. Conclusions

In this study, characteristics of a CS-TENG and a wind-TENG were evaluated using iron oxide-PANI (IOP) composite materials embedded in PDMS as a contact layer. The crystalline and molecular vibrational properties of the material underwent analysis. Moreover, experimental determination was carried out for the surface structure and atomic composition of the fabricated materials. For the CS-TENG, assessments were made on changes in the ratio of iron precursors to PANI, the weight percentage of the fabricated powder, and dispersing capability to determine the optimal conditions. The optimized state produced electrical outputs of 93.86 V, 6.9 µA, and 46.36 mW m−2, while the force response was also rigorously evaluated. Integration of IO powder into the PDMS composite layer was performed to reduce its stickiness, and assessments of its mechanical and electrical properties were conducted. Variations in electrical outputs under different humidity conditions were also examined. An intrusion detection system utilizing IOP-embedded and IO-coated PDMS was envisaged. Consequently, a wind-TENG was designed, leveraging structural optimization via the finite element method. Sensitivity and durability metrics for this system were recorded as 0.055 m−1 s and 96.3% of the initial output current following 6 h of intensive operation, respectively. In a test setup for intrusion detection, a door-opening scenario was effectively sensed using the optimized structure of the wind-TENG. Despite the minimal wind input of 0.1 m s−1 and reduced output voltage due to a 1 GΩ load resistor, the system effectively detected the intrusion and triggered an email alert to the owner, demonstrating its potential for wireless detection applications. Through the utilization of innovative IOP nanomaterial in the wind-TENG design, the potential for TENG integration into IoT-based security systems was significantly expanded, thereby enlarging the applicable area for both CS- and wind-TENG technologies.

Supplementary Materials

The following supporting information can be downloaded at https://www.mdpi.com/article/10.3390/chemosensors12080162/s1, Figure S1: Surface morphology of PANI, IOP (L4), and IO powder; Figure S2: Operational mechanism of the fabricated TENGs; Figure S3: FEM-derived surface potential profile for the fabricated TENG; Figure S4: Electrical output result with three dispersing states; Figure S5: FEM analysis of laminar flow to optimize the wind-TENG structure; Video S1: Video of open state for the intrusion detection; Video S2: Video of closed state for the intrusion detection.

Author Contributions

Conceptualization, I.K.; methodology, I.K., S.C., J.Y. and M.L.; software, I.K. and J.Y.; validation, I.K., T.S.G. and D.K.; formal analysis, I.K. and T.S.G.; investigation, I.K., S.C. and M.L.; resources, D.K.; data curation, I.K. and S.C.; writing—original draft preparation, I.K.; writing—review and editing, I.K., J.P., W.P., H.J.C. and D.K.; visualization, I.K., J.P. and M.L.; supervision, W.P., H.J.C. and D.K.; project administration, D.K.; funding acquisition, D.K. All authors have read and agreed to the published version of the manuscript.

Funding

This research was funded by Ministry of Education grant number 2018R1A6A1A03025708. This research was funded by Ministry of Trade, Industry & Energy (MI, Korea) grant number RS-2022-00154983. This research was funded by Kyung Hee University grant number KHU-20201109. This research was funded by Pusan National University Hospital grant number CMIT2023-06. This research was funded by National Research Foundation of Korea (no grant number).

Institutional Review Board Statement

Not applicable.

Informed Consent Statement

Not applicable.

Data Availability Statement

The data presented in this study are available on request from the corresponding author. The data are not publicly available due to privacy or ethical restrictions.

Acknowledgments

Inkyum Kim and Jihyeon Park equally contributed to this work. This research was supported by the Basic Science Research Program through the National Research Foundation of Korea (NRF) funded by the Ministry of Education (2018R1A6A1A03025708). This work was supported by the Technology Innovation Program (RS-2022-00154983, Development of Low-Power Sensors and Self-Charging Power Sources for Self-Sustainable Wireless Sensor Platforms) funded By the Ministry of Trade, Industry & Energy (MI, Korea). This work was supported by a grant from Kyung Hee University in 2020. (KHU-20201109) This work was supported by the Convergence Medical Institute of Technology R&D project (CMIT2023-06), Pusan National University Hospital. This research was (partially) funded by the BK21 FOUR program of the National Research Foundation of Korea.

Conflicts of Interest

The authors declare no conflicts of interest.

References

  1. Tozlu, S.; Senel, M.; Mao, W.; Keshavarzian, A. Wi-Fi Enabled Sensors for Internet of Things: A Practical Approach. IEEE Commun. Mag. 2012, 50, 134–143. [Google Scholar] [CrossRef]
  2. Beeby, S.P.; Tudor, M.J.; White, N.M. Energy Harvesting Vibration Sources for Microsystems Applications. Meas. Sci. Technol. 2006, 17, R175–R195. [Google Scholar] [CrossRef]
  3. Kojima, A.; Teshima, K.; Shirai, Y.; Miyasaka, T. Organometal Halide Perovskites as Visible-Light Sensitizers for Photovoltaic Cells. J. Am. Chem. Soc. 2009, 131, 6050–6051. [Google Scholar] [CrossRef] [PubMed]
  4. Bubnova, O.; Khan, Z.U.; Malti, A.; Braun, S.; Fahlman, M.; Berggren, M.; Crispin, X. Optimization of the Thermoelectric Figure of Merit in the Conducting Polymer Poly(3,4-Ethylenedioxythiophene). Nat. Mater. 2011, 10, 429–433. [Google Scholar] [CrossRef] [PubMed]
  5. Beeby, S.P.; Torah, R.N.; Tudor, M.J.; Glynne-Jones, P.; O’Donnell, T.; Saha, C.R.; Roy, S. A Micro Electromagnetic Generator for Vibration Energy Harvesting. J. Micromech. Microeng. 2007, 17, 1257–1265. [Google Scholar] [CrossRef]
  6. Roundy, S.; Wright, P.K. A Piezoelectric Vibration Based Generator for Wireless Electronics. Smart Mater. Struct. 2004, 13, 1131–1142. [Google Scholar] [CrossRef]
  7. Jung, J.H.; Lee, M.; Hong, J.-I.; Ding, Y.; Chen, C.-Y.; Chou, L.-J.; Wang, Z.L. Lead-Free NaNbO3 Nanowires for a High Output Piezoelectric Nanogenerator. ACS Nano 2011, 5, 10041–10046. [Google Scholar] [CrossRef] [PubMed]
  8. Fan, F.-R.; Tian, Z.-Q.; Wang, Z.L. Flexible Triboelectric Generator! Nano Energy 2012, 1, 328–334. [Google Scholar] [CrossRef]
  9. Wang, Z.L. On Maxwell’s Displacement Current for Energy and Sensors: The Origin of Nanogenerators. Mater. Today 2017, 20, 74–82. [Google Scholar] [CrossRef]
  10. Fan, F.R.; Tang, W.; Wang, Z.L. Flexible Nanogenerators for Energy Harvesting and Self-Powered Electronics. Adv. Mater. 2016, 28, 4283–4305. [Google Scholar] [CrossRef]
  11. Su, M.; Brugger, J.; Kim, B. Simply Structured Wearable Triboelectric Nanogenerator Based on a Hybrid Composition of Carbon Nanotubes and Polymer Layer. Int. J. Precis. Eng. Manuf.-Green Technol. 2020, 7, 683–698. [Google Scholar] [CrossRef]
  12. Yu, Y.; Li, H.; Zhao, D.; Gao, Q.; Li, X.; Wang, J.; Wang, Z.L.; Cheng, T. Material’s Selection Rules for High Performance Triboelectric Nanogenerators. Mater. Today 2023, 64, 61–71. [Google Scholar] [CrossRef]
  13. Seol, M.-L.; Han, J.-W.; Moon, D.-I.; Yoon, K.J.; Hwang, C.S.; Meyyappan, M. All-Printed Triboelectric Nanogenerator. Nano Energy 2018, 44, 82–88. [Google Scholar] [CrossRef]
  14. Feng, Z.; He, Q.; Wang, X.; Liu, J.; Qiu, J.; Wu, Y.; Yang, J. Multimode Human—Machine Interface Using a Single-Channel and Patterned Triboelectric Sensor. Nano Res. 2022, 15, 9352–9358. [Google Scholar] [CrossRef]
  15. Jeon, S.-B.; Nho, Y.-H.; Park, S.-J.; Kim, W.-G.; Tcho, I.-W.; Kim, D.; Kwon, D.-S.; Choi, Y.-K. Self-Powered Fall Detection System Using Pressure Sensing Triboelectric Nanogenerators. Nano Energy 2017, 41, 139–147. [Google Scholar] [CrossRef]
  16. Kim, I.; Roh, H.; Kim, D. Willow-like Portable Triboelectric Respiration Sensor Based on Polyethylenimine-Assisted CO2 Capture. Nano Energy 2019, 65, 103990. [Google Scholar] [CrossRef]
  17. Parandeh, S.; Kharaziha, M.; Karimzadeh, F. An Eco-Friendly Triboelectric Hybrid Nanogenerators Based on Graphene Oxide Incorporated Polycaprolactone Fibers and Cellulose Paper. Nano Energy 2019, 59, 412–421. [Google Scholar] [CrossRef]
  18. Tian, X.; Hua, T. Antibacterial, Scalable Manufacturing, Skin-Attachable, and Eco-Friendly Fabric Triboelectric Nanogenerators for Self-Powered Sensing. ACS Sustain. Chem. Eng. 2021, 9, 13356–13366. [Google Scholar] [CrossRef]
  19. Joo, S.; Kim, J.H.; Lee, C.-E.; Kang, J.; Seo, S.; Kim, J.-H.; Song, Y.-K. Eco-Friendly Keratin-Based Additives in the Polymer Matrix to Enhance the Output of Triboelectric Nanogenerators. ACS Appl. Bio Mater. 2022, 5, 5706–5715. [Google Scholar] [CrossRef]
  20. Chen, W.; Li, C.; Tao, Y.; Lu, J.; Du, J.; Wang, H. Modulating Spatial Charge Distribution of Lignin for Eco-Friendly and Recyclable Triboelectric Nanogenerator. Nano Energy 2023, 116, 108802. [Google Scholar] [CrossRef]
  21. Kim, W.J.; Cho, S.; Hong, J.; Hong, J.P. Geometrically Versatile Triboelectric Yarn-Based Harvesters via Carbon Nanotubes-Elastomer Composites. Compos. Sci. Technol. 2022, 219, 109247. [Google Scholar] [CrossRef]
  22. Rasel, M.S.U.; Park, J.-Y. A Sandpaper Assisted Micro-Structured Polydimethylsiloxane Fabrication for Human Skin Based Triboelectric Energy Harvesting Application. Appl. Energy 2017, 206, 150–158. [Google Scholar] [CrossRef]
  23. Zargari, S.; Koozehkanani, Z.D.; Veladi, H.; Sobhi, J.; Rezania, A. Cost-Effective Fabrication Approaches for Improving Output Performance of Triboelectric Energy Harvesters. J. Electrost. 2022, 115, 103640. [Google Scholar] [CrossRef]
  24. Wang, R.; Mu, L.; Bao, Y.; Lin, H.; Ji, T.; Shi, Y.; Zhu, J.; Wu, W. Holistically Engineered Polymer–Polymer and Polymer–Ion Interactions in Biocompatible Polyvinyl Alcohol Blends for High-Performance Triboelectric Devices in Self-Powered Wearable Cardiovascular Monitorings. Adv. Mater. 2020, 32, 2002878. [Google Scholar] [CrossRef]
  25. Graham, S.A.; Patnam, H.; Manchi, P.; Paranjape, M.V.; Kurakula, A.; Yu, J.S. Biocompatible Electrospun Fibers-Based Triboelectric Nanogenerators for Energy Harvesting and Healthcare Monitoring. Nano Energy 2022, 100, 107455. [Google Scholar] [CrossRef]
  26. Kim, M.; Park, H.; Lee, M.H.; Bae, J.W.; Lee, K.Y.; Lee, J.H.; Lee, J.-H. Stretching-Insensitive Stretchable and Biocompatible Triboelectric Nanogenerators Using Plasticized PVC Gel and Graphene Electrode for Body-Integrated Touch Sensor. Nano Energy 2023, 107, 108159. [Google Scholar] [CrossRef]
  27. Chougale, M.Y.; Saqib, Q.M.; Khan, M.U.; Shaukat, R.A.; Kim, J.; Bae, J. Novel Recycled Triboelectric Nanogenerator Based on Polymer-Coated Trash Soda Can for Clean Energy Harvesting. Adv. Sustain. Syst. 2021, 5, 2100161. [Google Scholar] [CrossRef]
  28. Dong, B.; Shi, Q.; Yang, Y.; Wen, F.; Zhang, Z.; Lee, C. Technology Evolution from Self-Powered Sensors to AIoT Enabled Smart Homes. Nano Energy 2021, 79, 105414. [Google Scholar] [CrossRef]
  29. Bhatta, T.; Pradhan, G.B.; Shrestha, K.; Lee, S.; Rana, S.S.; Sharma, S.; Song, H.; Jeong, S.; Park, J.Y. Magnets-Assisted Dual-Mode Triboelectric Sensors Integrated with an Electromagnetic Generator for Self-Sustainable Wireless Motion Monitoring Systems. Nano Energy 2022, 103, 107860. [Google Scholar] [CrossRef]
  30. Li, Y.; Tian, Z.; Gao, X.-Z.; Zhao, H.-Y.; Li, X.; Wang, Z.L.; Yu, Z.-Z.; Yang, D. All-Weather Self-Powered Intelligent Traffic Monitoring System Based on a Conjunction of Self-Healable Piezoresistive Sensors and Triboelectric Nanogenerators. Adv. Funct. Mater. 2023, 33, 2308845. [Google Scholar] [CrossRef]
  31. Shi, Y.; Li, H.; Fu, X.; Luan, R.; Wang, Y.; Wang, N.; Sun, Z.; Niu, Y.; Wang, C.; Zhang, C.; et al. Self-Powered Difunctional Sensors Based on Sliding Contact-Electrification and Tribovoltaic Effects for Pneumatic Monitoring and Controlling. Nano Energy 2023, 110, 108339. [Google Scholar] [CrossRef]
  32. Yi, Z.; Liu, D.; Zhou, L.; Li, S.; Zhao, Z.; Li, X.; Wang, Z.L.; Wang, J. Enhancing Output Performance of Direct-Current Triboelectric Nanogenerator under Controlled Atmosphere. Nano Energy 2021, 84, 105864. [Google Scholar] [CrossRef]
  33. He, W.; Shan, C.; Wu, H.; Fu, S.; Li, Q.; Li, G.; Zhang, X.; Du, Y.; Wang, J.; Wang, X.; et al. Capturing Dissipation Charge in Charge Space Accumulation Area for Enhancing Output Performance of Sliding Triboelectric Nanogenerator. Adv. Energy Mater. 2022, 12, 2201454. [Google Scholar] [CrossRef]
  34. Yang, X.; Wu, F.; Xu, C.; Yang, L.; Yin, S. A Flexible High-Output Triboelectric Nanogenerator Based on MXene/CNT/PEDOT Hybrid Film for Self-Powered Wearable Sensors. J. Alloys Compd. 2022, 928, 167137. [Google Scholar] [CrossRef]
  35. Fu, S.; Wu, H.; Shan, C.; Li, K.; He, W.; Li, Q.; Yu, X.; Du, S.; Li, G.; Hu, C. Ultra-Durable and High-Output Triboelectric Nanogenerator Based on Coupling of Soft-Soft Contact and Volume Effect. Nano Energy 2023, 116, 108850. [Google Scholar] [CrossRef]
  36. Hyun, B.G.; Jun, Y.-S.; Lee, J.-H.; Hamidinejad, M.; Saadatnia, Z.; Naguib, H.E.; Park, C.B. Fabrication of Microcellular TPU/BN-CNT Nanocomposite Foams for High-Performance All-in-One Structure Triboelectric Nanogenerators. Compos. Part B-Eng. 2023, 262, 110813. [Google Scholar] [CrossRef]
  37. Li, J.-Y.; Li, C.-H.; Huang, Z.; Wang, F. Enhancing Performance of Triboelectric Nanogenerator via Surface Structure Coupling by Light-Cured 3-D Printing. IEEE Trans. Electron Devices 2023, 70, 1231–1235. [Google Scholar] [CrossRef]
  38. Feng, P.-Y.; Xia, Z.; Sun, B.; Jing, X.; Li, H.; Tao, X.; Mi, H.-Y.; Liu, Y. Enhancing the Performance of Fabric-Based Triboelectric Nanogenerators by Structural and Chemical Modification. ACS Appl. Mater. Interfaces 2021, 13, 16916–16927. [Google Scholar] [CrossRef]
  39. Candido, I.C.M.; Oliveira, G.d.S.; Viana, G.G.; G. da Silva, F.A., Jr.; da Costa, M.M.; de Oliveira, H.P. Wearable Triboelectric Nanogenerators Based on Chemical Modification of Conventional Textiles for Application in Electrically Driven Antibacterial Devices. ACS Appl. Electron. Mater. 2022, 4, 334–344. [Google Scholar] [CrossRef]
  40. Zhang, Z.; Xu, Y.; Wang, D.; Yang, H.; Guo, J.; Turng, L.-S. Enhanced Performance of an Expanded Polytetrafluoroethylene-Based Triboelectric Nanogenerator for Energy Harvesting. Nano Energy 2019, 60, 903–911. [Google Scholar] [CrossRef]
  41. Harrison, R.J.; Dunin-Borkowski, R.E.; Putnis, A. Direct Imaging of Nanoscale Magnetic Interactions in Minerals. Proc. Natl. Acad. Sci. USA 2002, 99, 16556–16561. [Google Scholar] [CrossRef]
  42. Heeger, A.J. Nobel Lecture: Semiconducting and Metallic Polymers: The Fourth Generation of Polymeric Materials. Rev. Mod. Phys. 2001, 73, 681–700. [Google Scholar] [CrossRef]
  43. Basavaiah, K.; Pavan Kumar, Y.; Prasada Rao, A.V. A Facile One-Pot Synthesis of Polyaniline/Magnetite Nanocomposites by Micelles-Assisted Method. Appl. Nanosci. 2013, 3, 409–415. [Google Scholar] [CrossRef]
  44. Lu, X.; Mao, H.; Chao, D.; Zhang, W.; Wei, Y. Ultrasonic Synthesis of Polyaniline Nanotubes Containing Fe3O4 Nanoparticles. J. Solid State Chem. 2006, 179, 2609–2615. [Google Scholar] [CrossRef]
  45. Long, Y.; Chen, Z.; Duvail, J.L.; Zhang, Z.; Wan, M. Electrical and Magnetic Properties of Polyaniline/Fe3O4 Nanostructures. Phys. B Condens. Matter 2005, 370, 121–130. [Google Scholar] [CrossRef]
  46. Reddy, K.R.; Lee, K.P.; Gopalan, A.I. Self-Assembly Approach for the Synthesis of Electro-Magnetic Functionalized Fe3O4/Polyaniline Nanocomposites: Effect of Dopant on the Properties. Colloids Surf. A Physicochem. Eng. Asp. 2008, 320, 49–56. [Google Scholar] [CrossRef]
  47. Deng, J.; He, C.; Peng, Y.; Wang, J.; Long, X.; Li, P.; Chan, A.S.C. Magnetic and Conductive Fe3O4–Polyaniline Nanoparticles with Core–Shell Structure. Synth. Met. 2003, 139, 295–301. [Google Scholar] [CrossRef]
  48. Jacobo, S.E.; Aphesteguy, J.C.; Lopez Anton, R.; Schegoleva, N.N.; Kurlyandskaya, G.V. Influence of the Preparation Procedure on the Properties of Polyaniline Based Magnetic Composites. Eur. Polym. J. 2007, 43, 1333–1346. [Google Scholar] [CrossRef]
  49. Yadav, A.; Kumar, H.; Sharma, R.; Kumari, R. Influence of Polyaniline on the Photocatalytic Properties of Metal Nanocomposites: A Review. Colloid Interface Sci. Commun. 2021, 40, 100339. [Google Scholar] [CrossRef]
  50. Saravanan, S.; Joseph Mathai, C.; Anantharaman, M.R.; Venkatachalam, S.; Prabhakaran, P.V. Investigations on the Electrical and Structural Properties of Polyaniline Doped with Camphor Sulphonic Acid. J. Phys. Chem. Solids 2006, 67, 1496–1501. [Google Scholar] [CrossRef]
  51. El-Shazly, M.H.; Al-Kabbany, A.M.; Ali, W.Y.; Ali, A.S.; Massoud, M.A. Effect of Magnetic Field on the Voltage Output of Triboelectric Nanogenerator. EGTRIB J. 2023, 20, 85–94. [Google Scholar] [CrossRef]
  52. Du, B.; Shi, Y.; Liu, Q. Fabrication of Fe3O4@SiO2 Nanofluids with High Breakdown Voltage and Low Dielectric Loss. Coatings 2019, 9, 716. [Google Scholar] [CrossRef]
  53. Mostafaei, A.; Zolriasatein, A. Synthesis and Characterization of Conducting Polyaniline Nanocomposites Containing ZnO Nanorods. Prog. Nat. Sci. 2012, 22, 273–280. [Google Scholar] [CrossRef]
  54. Yang, Y.; Qi, S.; Wang, J. Characterization of a Microwave Absorbent Prepared by Coprecipitation Reaction of Iron Oxide on the Surface of Graphite Nanosheet. Mater. Sci. Eng. B 2012, 177, 1734–1740. [Google Scholar] [CrossRef]
  55. Xu, J.; Sun, Y.; Zhang, J. Solvothermal Synthesis of Fe3O4 Nanospheres for High-Performance Electrochemical Non-Enzymatic Glucose Sensor. Sci. Rep. 2020, 10, 16026. [Google Scholar] [CrossRef] [PubMed]
  56. Sivagami, M.; Asharani, I.V. Phyto-Mediated Ni/NiO NPs and Their Catalytic Applications-a Short Review. Inorg. Chem. Commun. 2022, 145, 110054. [Google Scholar] [CrossRef]
  57. Jun, Y.; Seo, J.; Cheon, J. Nanoscaling Laws of Magnetic Nanoparticles and Their Applicabilities in Biomedical Sciences. Acc. Chem. Res. 2008, 41, 179–189. [Google Scholar] [CrossRef] [PubMed]
  58. Novoselova, J.P.; Safronov, A.P.; Samatov, O.M.; Beketov, I.V.; Khurshid, H.; Nemati, Z.; Srikanth, H.; Denisova, T.P.; Andrade, R.; Kurlyandskaya, G.V. Laser Target Evaporation Fe2O3 Nanoparticles for Water-Based Ferrofluids for Biomedical Applications. IEEE Trans. Magn. 2014, 50, 1–4. [Google Scholar] [CrossRef]
  59. Tian, Y.; Song, S.; Xu, X.; Wei, X.; Yan, S.; Zhan, M. Study on Fluidization Characteristics of Magnetically Fluidized Beds for Microfine Particles. Minerals 2022, 12, 61. [Google Scholar] [CrossRef]
  60. Bianchetti, E.; Di Valentin, C. Effect of Surface Functionalization on the Magnetization of Fe3O4 Nanoparticles by Hybrid Density Functional Theory Calculations. J. Phys. Chem. Lett. 2022, 13, 9348–9354. [Google Scholar] [CrossRef]
  61. Khan, M.; Anwer, T.; Mohammad, F. Sulphonated Polyaniline/MWCNTs Nanocomposite: Preparation and Promising Thermoelectric Performance. Int. Nano Lett. 2018, 8, 213–220. [Google Scholar] [CrossRef]
  62. Kayal, S.; Ramanujan, R.V. Doxorubicin Loaded PVA Coated Iron Oxide Nanoparticles for Targeted Drug Delivery. Mater. Sci. Eng. C-Mater. Biol. Appl. 2010, 30, 484–490. [Google Scholar] [CrossRef]
  63. Esteves, D.S.; Pereira, M.F.C.; Ribeiro, A.; Durães, N.; Paiva, M.C.; Sequeiros, E.W. Development of MWCNT/Magnetite Flexible Triboelectric Sensors by Magnetic Patterning. Polymers 2023, 15, 2870. [Google Scholar] [CrossRef] [PubMed]
  64. Zou, H.; Zhang, Y.; Guo, L.; Wang, P.; He, X.; Dai, G.; Zheng, H.; Chen, C.; Wang, A.C.; Xu, C.; et al. Quantifying the Triboelectric Series. Nat. Commun. 2019, 10, 1427. [Google Scholar] [CrossRef] [PubMed]
  65. Umare, S.S.; Shambharkar, B.H.; Ningthoujam, R.S. Synthesis and Characterization of Polyaniline–Fe3O4 Nanocomposite: Electrical Conductivity, Magnetic, Electrochemical Studies. Synth. Met. 2010, 160, 1815–1821. [Google Scholar] [CrossRef]
  66. Dutta, K.; De, S.K. Optical and Nonlinear Electrical Properties of SnO2–Polyaniline Nanocomposites. Mater. Lett. 2007, 61, 4967–4971. [Google Scholar] [CrossRef]
  67. Du, B.; Liu, Q.; Shi, Y.; Zhao, Y. The Effect of Fe3O4 Nanoparticle Size on Electrical Properties of Nanofluid Impregnated Paper and Trapping Analysis. Molecules 2020, 25, 3566. [Google Scholar] [CrossRef] [PubMed]
  68. Tsai, P.J.; Nayak, S.; Ghosh, S.; Puri, I.K. Influence of Particle Arrangement on the Permittivity of an Elastomeric Composite. AIP Adv. 2017, 7, 015003. [Google Scholar] [CrossRef]
  69. Li, Y.; Chen, Z.; Zheng, G.; Zhong, W.; Jiang, L.; Yang, Y.; Jiang, L.; Chen, Y.; Wong, C.-P. A Magnetized Microneedle-Array Based Flexible Triboelectric-Electromagnetic Hybrid Generator for Human Motion Monitoring. Nano Energy 2020, 69, 104415. [Google Scholar] [CrossRef]
  70. Con, C.; Cui, B. Effect of Mold Treatment by Solvent on PDMS Molding into Nanoholes. Nanoscale Res. Lett. 2013, 8, 394. [Google Scholar] [CrossRef]
  71. Yun, J.; Kim, I.; Kim, D. Triboelectric Energy Harvesting Using Inductor towards Self-Powered Real-Time Wireless Communication System. Nano Energy 2023, 115, 108760. [Google Scholar] [CrossRef]
Figure 1. Synthesis and characterization of the iron oxide-PANI (IOP) composite. (a) Fabrication process of the IOP composite material. (b) XRD spectra comparing PANI and IOP composites. (c) FT-IR spectra comparing PANI and IOP composites.
Chemosensors 12 00162 g001
Figure 2. Characterization of the IOP composite. (a) SEM image of the IOP composite powder. (b) EDAX images detailing elemental mapping: (i) surface overview of IOP powder with L1, (ii) iron distribution, (iii) oxygen distribution, (iv) carbon distribution, and (v) nitrogen distribution. (c) Surface potential profiles comparing bare PDMS, IOP-embedded PDMS, and IOP-embedded and IO-coated PDMS using KPFM.
Chemosensors 12 00162 g002
Figure 3. Characterization and performance evaluation of the CS-TENG. (a) Schematic representation of the CS-TENG. (b) Magnetic flux density for the four samples with varying iron precursor ratios. (c) Open-circuit voltage and (d) short-circuit current as a function of IOP composite composition in the CS-TENG. (e) Electrical outputs from the CS-TENG with varying weight percentages of the IOP composite in PDMS. (f) Force response of the CS-TENG.
Chemosensors 12 00162 g003
Figure 4. Assessment of the adhesion profile and electrical output profiles of CS-TENG. (a) Adhesion energy profile with and without IO coating as determined by AFM. (b) Electrical outputs with and without IO coating. (c) Electrical outputs of the CS-TENG in response to humidity. (d) Output power from the optimized CS-TENG.
Chemosensors 12 00162 g004
Figure 5. Evaluation and characterization of the wind-TENG. (a) Schematic representation of the wind-TENG. FEM results showcasing structural optimization through (b) velocity magnitude and (c) pressure profiles. Electrical signals from the wind-TENG, including (d) short-circuit current and (e) open-circuit voltage, both with and without specific structures. (f) Electrical outputs from the wind-TENG as a function of wind intensity. (g) Results from an output stability test during intermittent 6 h operation.
Chemosensors 12 00162 g005
Figure 6. Application of the wind-TENG in an intrusion detection system. (a) Schematic illustration indicating the sensor’s location. (b) Experimental setup designed for the intrusion detection. Representation of the door (c) in an open state and (d) in a state with no events. (e) Wireless transfer characteristics of wind signal using inductive coupling.
Chemosensors 12 00162 g006
Disclaimer/Publisher’s Note: The statements, opinions and data contained in all publications are solely those of the individual author(s) and contributor(s) and not of MDPI and/or the editor(s). MDPI and/or the editor(s) disclaim responsibility for any injury to people or property resulting from any ideas, methods, instructions or products referred to in the content.

