Article

Chiral Trapped-Headspace GC-QMS-IMS: Boosting Untargeted Benchtop Volatilomics to the Next Level

1
Institute for Instrumental Analytics and Bioanalytics, Mannheim University of Applied Sciences, Paul-Wittsack-Str. 10, 68163 Mannheim, Germany
2
Department of Food Chemistry and Analysis, Institute of Food Technology and Food Chemistry, Technische Universität Berlin, Gustav-Meyer-Allee 25, 13355 Berlin, Germany
3
Faculty of Biotechnology, Mannheim University of Applied Sciences, Paul-Wittsack-Str. 10, 68163 Mannheim, Germany
4
SGF International e.V., Marie-Curie-Ring 10a, 55291 Saulheim, Germany
*
Author to whom correspondence should be addressed.
Chemosensors 2024, 12(8), 165; https://doi.org/10.3390/chemosensors12080165
Submission received: 15 July 2024 / Revised: 10 August 2024 / Accepted: 13 August 2024 / Published: 17 August 2024

Abstract

:
In the field of quality analysis of food and flavoring products, gas chromatography–quadrupole mass spectrometry–ion mobility spectrometry (GC-QMS-IMS) is a powerful technique for the simultaneous detection of volatile organic compounds (VOCs) by both QMS and IMS. GC is an established technique for the separation of complex VOC-rich food products. While subsequent detection by IMS features soft ionization of fragile compounds (e.g., terpenes) with characteristic drift times, MS provides analytes’ m/z values for database substance identification. A limitation of the prominently used static-headspace-based GC-QMS-IMS systems is the substantially higher sensitivity of IMS in comparison to full-scan QMS. The present study describes a new prototypic trapped-headspace (THS)-GC-QMS-IMS setup using mango purees. This approach ultimately allows the combination of soft ionization with m/z values obtained from database-searchable electron ionization (EI) spectra. The new setup features aligned retention times for IMS and MS and sufficient signal intensities for QMS and IMS. The results demonstrate that THS-GC-QMS-IMS allows for the classification of mango purees from different cultivars and that it could be a promising alternative method for authenticity control of food, flavors, and beverages.

Graphical Abstract

1. Introduction

In the analysis of flavorings and volatile organic compounds (VOCs) in general, gas chromatography (GC) is the method of choice for the separation of a broad spectrum of VOCs. There are numerous GC-based applications for the analysis of complex matrices, such as essential oils, flavors, and fragrances, particularly in combination with mass spectrometry (MS). However, in the last decade, ion mobility spectrometry (IMS) has gained increasing attention for the analysis of food, beverages, and flavorings [1,2]. IMS systems in hyphenation with GC are mostly realized in the form of drift-tube IMS systems (DTIMS), while only a few systems in use are based on differential ion mobility (DMS or DIMS), aspiration ion mobility (AIMS), or field asymmetric waveform ion mobility (FAIMS) [3,4]. For the sake of simplicity, IMS is considered in the context of DTIMS in the following. GC-IMS systems are based on 3H, 63Ni, corona discharge (CD), or ultraviolet light (UV) ionization, ionization by 3H being among the most common due to the low safety restrictions and the broad applicability [3,5,6]. Such systems offer a remarkably high sensitivity for polar and medium-polar compounds, due to the soft ionization, and operate at ambient pressure. This simplifies their use substantially in contrast to vacuum-based MS detectors with regard to robustness, ease of use, and the cost of systems. While IMS detectors commonly outperform standard quadrupole MS detectors in terms of sensitivity, one major drawback is the lack of comprehensive and commonly accepted databases. While such libraries are widely used for substance identification in MS, this is not the case for IMS, where substances are typically identified relative to reference substances by comparing retention and drift times. For complex matrices, this is time-consuming, tedious, and limited by the need for the availability of reference substances. In a previously published study, hyphenation of IMS and QMS showed a beneficial effect for substance identification in combination with the soft ionization of IMS, providing valuable data for chemometric evaluation. Brendel et al. were able to show that the classification of selected citrus fruit juices is possible using both QMS and IMS data based on enrichment-free, static-headspace GC-QMS-IMS, but the match quality in MS databases was limited due to low QMS S/N ratios and intense fragmentation in EI [2]. Additionally, Schanzmann et al. described the combination of thermal desorption with GC-MS-IMS for breath analysis. They were able to show a good accordance of MS and IMS retention times for a homologous series of ketones up to 2-decanone. Within the study, they were also able to identify five VOCs, including ethanol, isoprene, acetone, 2-propanol, and 1-propanol, in breath samples with the NIST database [7]. This approach is typically not applicable for complex flavorings and food samples, as these show a broad range of VOCs, ranging from ketones and esters to terpenes and sesquiterpenes, with boiling points of up to 260 °C. In nearly all cases, QMS sensitivity was the limiting factor. To overcome this limitation and to obtain m/z data for complex matrices, a new trapped-headspace (THS)-GC-MS-IMS setup was designed.
The main challenge here was to achieve a balance between sufficient S/N ratios in QMS without overloading the IMS detector. In Figure 1, the THS-GC-MS-IMS setup and the flow directions are visualized. The hyphenation with the described trapped-headspace sampler is beneficial for sampling in static as well as dynamic headspaces, due in particular to the constant control of the vial pressure and the possibility of using concentration steps.

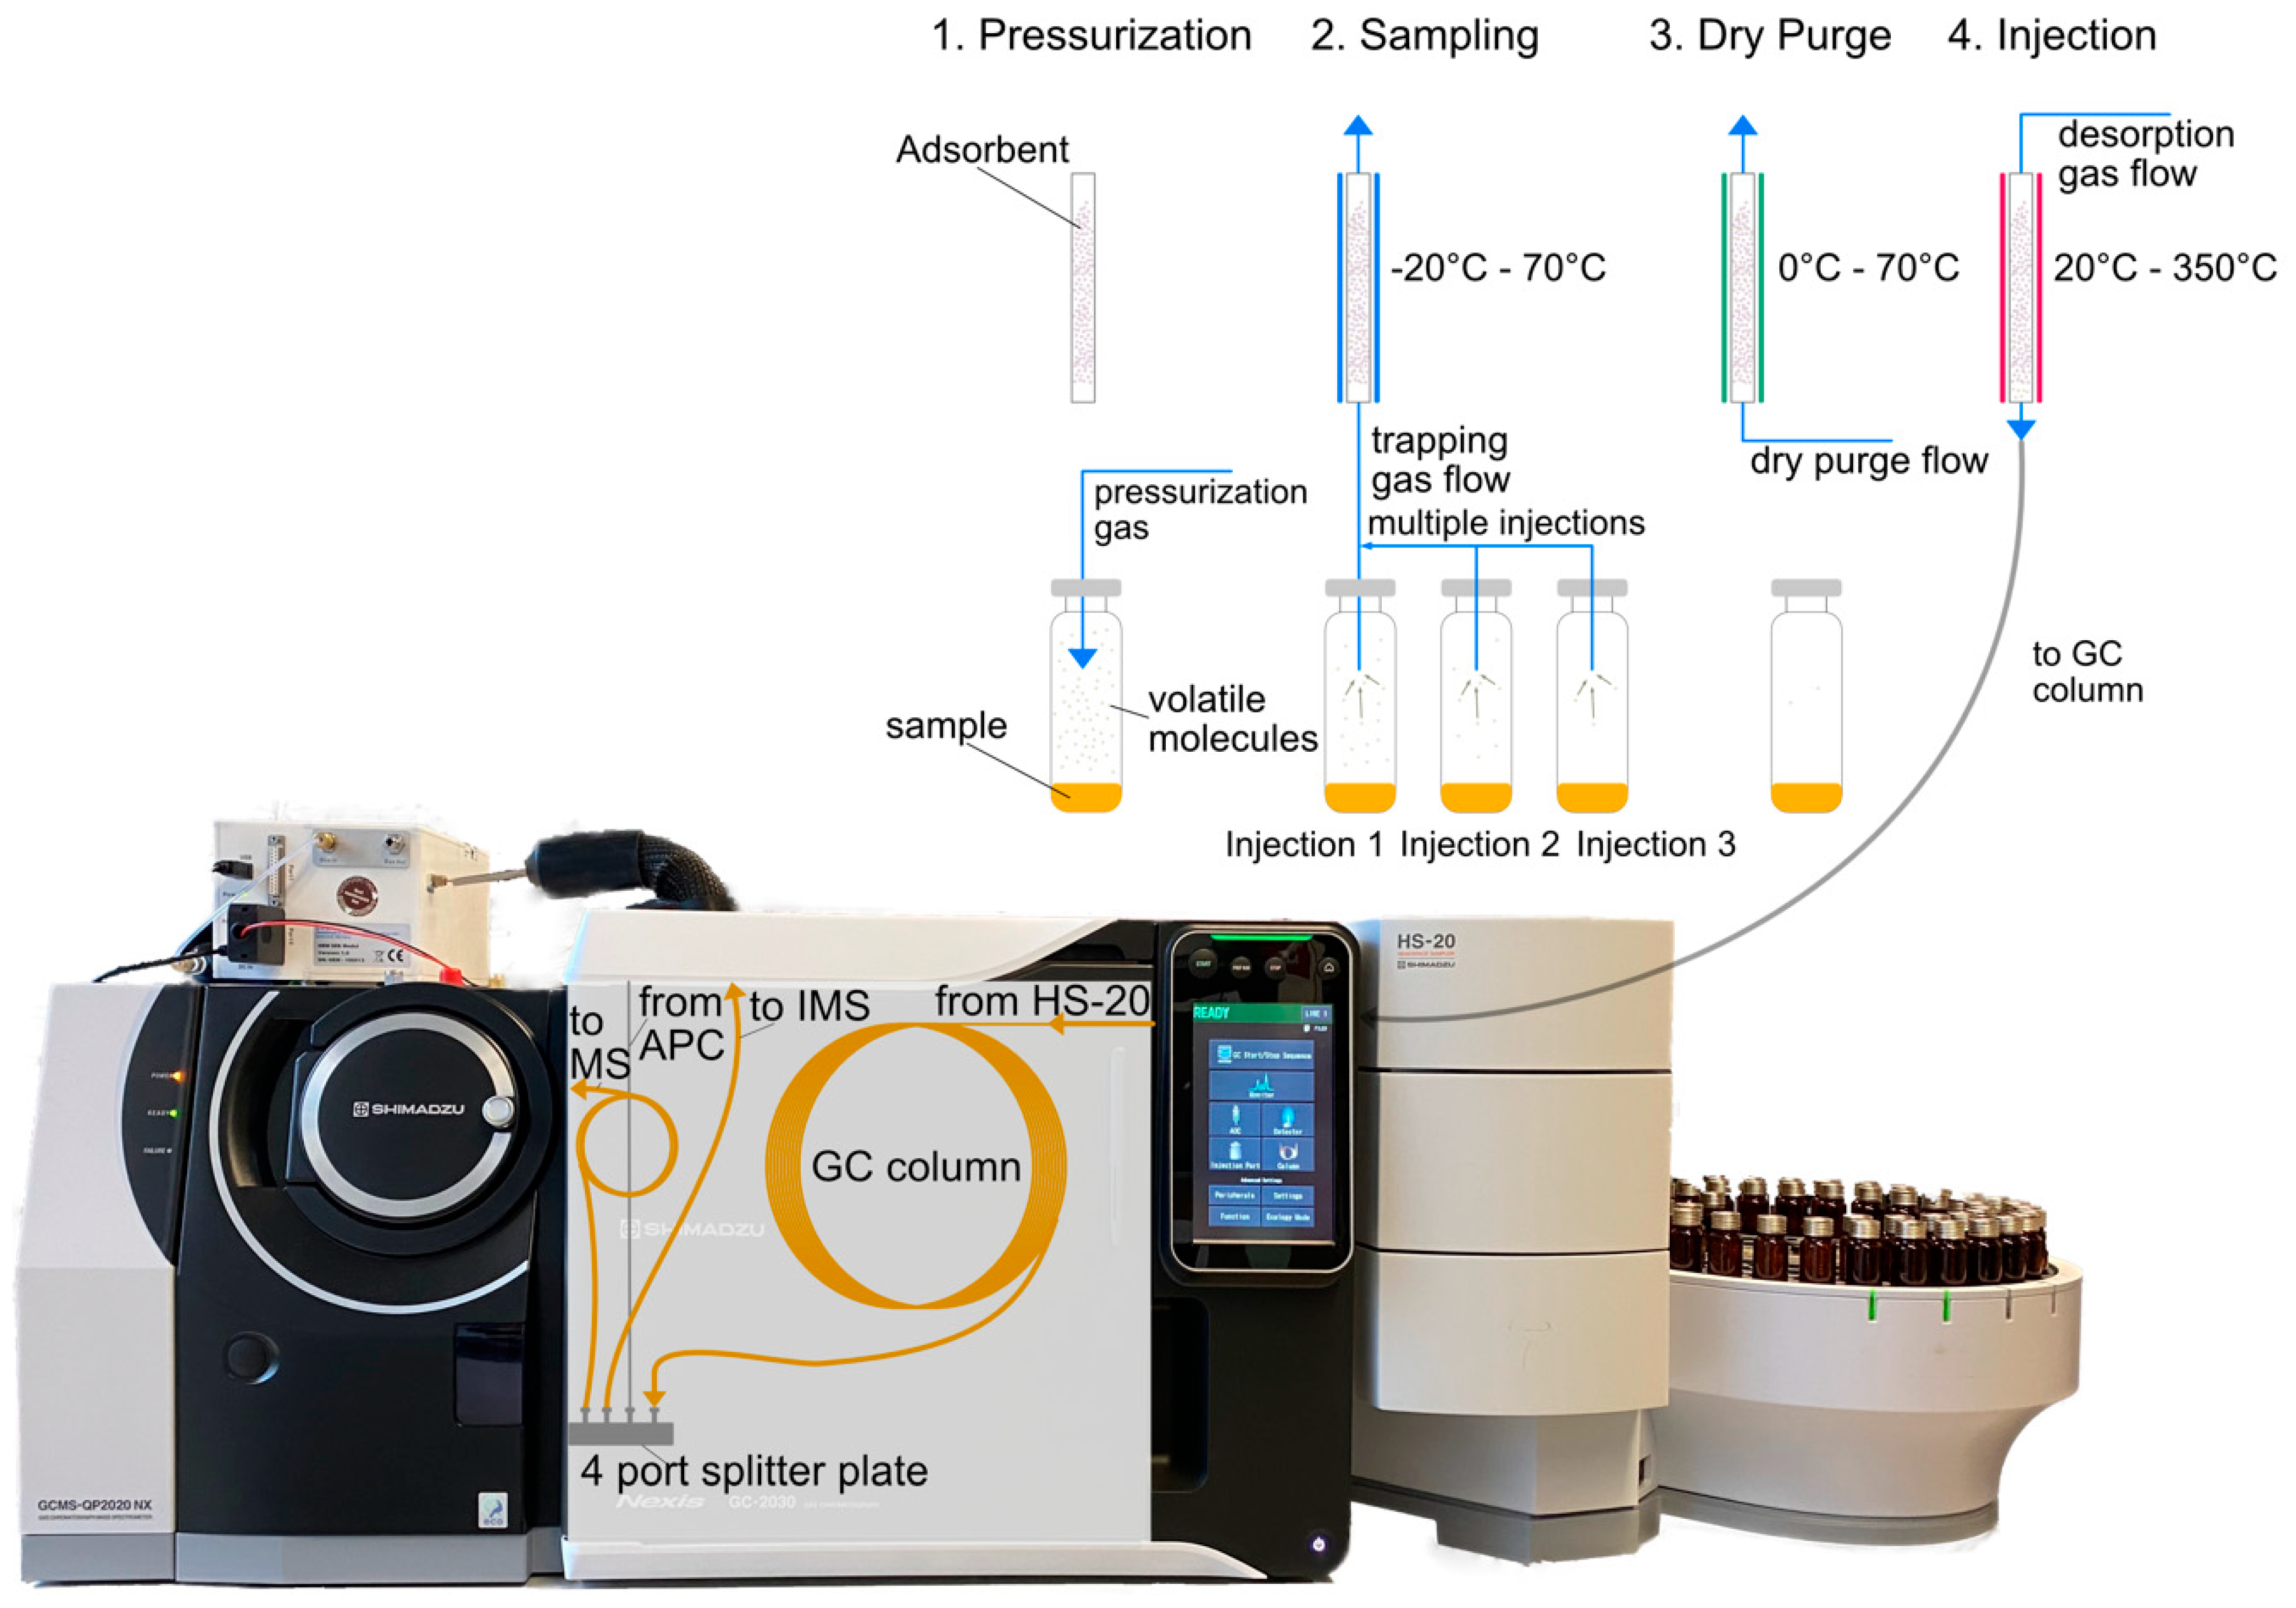
1.1. Trapped-Headspace Sampling

The basic principle for headspace sampling is the equilibration of analytes in the sample solution and the vapor phase above, defined by the partition coefficient (see Equation (1)) [8,9]. Besides the analytes’ vaporization enthalpy and vapor pressure, the solubility in the sample phase is particularly important for the partition coefficient. Thus, in method development, vial temperature, adjustment of the pH value, and the addition of salt are effective and important parameters [9].
K = C S C G
where
K = the partition coefficient of a defined compound;
CS = the concentration of the compound in the sample phase;
CG = the concentration of the compound in the vapor phase.
For headspace sampling, the vapor phase of a substance is sampled and analyzed. The sealed sample vial is heated and equilibrated [8]. In static-headspace sampling (SHS), a defined volume of the vapor phase is extracted using a syringe, resulting in analyte fractions in ppmv levels. This results in absolute amounts in the lower pg range in the column. Paired with the system-immanent issue of the high fragmentation behavior of sensitive compounds in EI mode and the limited sensitivity of QMS detectors in full-scan mode, this poses a challenge for QMS-based systems. Consequently, the majority of polar and medium-polar analytes are detected mainly via IMS, and only a limited number of these are detectable in QMS detectors. One elegant way around this limitation is trapped- or dynamic-headspace sampling (THS). It allows for the pre-concentration of analytes up to sub-ppbv levels [9]. While for matrices with higher analyte concentrations, classical SHS is an effective, feasible option, THS excels in the analysis of samples with low-abundant analytes in complex matrices [8].
In Figure 1, the principles of THS sampling are visualized. In the first step, the sample is pressurized and the volatiles are continuously evaporated to a vapor phase [10]. Subsequently, the vapor phase is trapped with a sorbent, extracting VOCs from the gas phase [8,9]. In multiple-headspace-extraction (MHE) mode, these steps are repeated several times to optimize VOC extraction [9,10]. The last step is the desorption of the trapped analytes and the transfer into the GC column [10]. For trapping, there are different approaches, such as cryogenic, Peltier-cooled, or solid-sorbent-based methods, as well as liquid films in solid support [9,11]. Applications for THS sampling are found in a broad spectrum of analytical tasks involving foods, feeds, pharmaceuticals, and environmental samples [12,13,14,15,16].

1.2. Ion Mobility Spectrometry in VOC Analysis

In the last several decades, GC-hyphenated IMS has gained increasing popularity for the analysis of VOCs in all types of fields due to its high sensitivity in combination with a robust design. The applications range from process and quality control to analysis of explosives, drugs, foods, beverages, and flavor products [2,17,18,19]. The IMS cells operate at ambient pressure, and 3H-based ionization of analytes is a reaction of proton water clusters H+[H2O]x with the analytes, forming protonated monomers MH+[H2O]n−x, as shown in Equation (2), and at higher analyte concentrations, dimers M2H+[H2O]n−x are formed, as shown in Equation (3) [6]. The proton water clusters are formed within a reaction cascade, initiated by the tritium source (<100 MBq).
M + H + H 2 O n M H + ( H 2 O ) n x + x H 2 O
M + H + H 2 O n ( M ) ( M ) 2 H + ( H 2 O ) n x + x H 2 O
The formation of proton water clusters, also called reactant ions, depends on the moisture content of the gas atmosphere [6,20,21]. After ionization, monomers and dimers are accelerated into the drift tube by a weak electrical field against a defined flow of a drift or buffer gas, typically nitrogen. Due to collisions with drift gas molecules, ions are decelerated according to their collision cross sections (CCSs). Thus, drift time is dependent on mass, charge, and structure, resulting in a characteristic drift time for each analyte. This soft ionization leads to the excellent sensitivity ranges of DTIMS instruments, which make them optimal tools for non-targeted strategies (NTSs) [3,22]. These approaches are based on the complete (amenable) spectral fingerprint instead of using defined marker compounds [3].
In VOC profiling of foods and flavors, IMS is already used in a multitude of applications, ranging from quality analysis of olive oils, authentication of honey, quality control of brewing hops, profiling of dairy products such as kefir, and the discrimination of different citrus juices [1,2,23,24,25,26].

1.3. VOC Analysis of Mangos

Mango (Mangifera Indica L.) is considered the “King of Fruits”, and mango purees are of substantial value in the food and beverage industries [27]. There are more than 100 cultivars available, which differ in taste and flavor. In general, the flavor is described as fruity, sweet, and floral, but some cultivars display different, citrus and terpene notes. Due to this flavor profile, the Indian cultivar ‘Alphonso’ is one of the most popular, and there is an increasing demand for it on the world market [28]. Although there are numerous studies on mangos and their volatiles, most of these focus on regional cultivars or on farm-grown fruits and not on partially processed commercial products, such as purees or pulps [29,30,31]. Mango fruits display a complex volatile profile with more than 50 compounds, including alcohols, ketones, aldehydes, esters, monoterpenes, and sesquiterpenes [30,32,33,34]. With regard to VOC composition, the cultivars can be distinguished into three groups. The first group features green, herbal flavors and 3-carene as the most abundant monoterpene; the second are characterized by rosin flavors and α-terpinolene as the major monoterpene compound; and those in the last group have (Z)-β-ocimene as the predominant monoterpene, with sweet, terpene, and citrus notes, such as the cultivar ‘Alphonso’ [35].
The majority of published studies on the VOC profiles of mango fruits and products present target-based approaches and are dominated by SHS-GC-MS applications, mostly with solid-phase microextraction (SPME) enrichment, Arrow, or other enrichment steps [30,36,37,38].
In previously published non-targeted studies, Tandel et al. applied PCA and HCA to HS-SPME-GC-MS data and different extraction methods for Indian mango cultivars, while Farag et al. employed PCA to analyze HS-SPME-GC-MS data on Egyptian mango cultivars [30,36]. Further, Shimizu et al. reported on a volatile profiling of 17 different mango cultivars using HS-SPME-GC-MS in combination with PCA [29].
The literature on the use of GC-IMS in the context of mango fruits, purees, and other low-processed mango products published to date is scarce. A number of authors reported on GC-IMS applications for post-harvest effects and focused on terpene profiles in relation to fruit quality [39,40]. However, these studies focused specifically on Chinese cultivars and on the ripening process from green fruits to ripe fruits and used separate instruments for IMS and MS.
Consequently, the aim of the present study was to demonstrate the potential of THS sampling in combination with simultaneous GC-MS-IMS detection. While the study focused on a non-targeted approach to differentiate Mangifera indica L. cultivars, relevant metabolites were confirmed via MS in parallel to generate more detailed insights. The prototypic system described here allows both approaches from one single injection. An additional source of information for the non-targeted approach results from the use of a chiral GC column, which generates substantially more characteristic signals.

2. Materials and Methods

2.1. Reagents and Mango Samples

In total, 30 different commercial mango pulp and concentrate samples were measured for this study. The samples were taken by independent auditors as part of routine audits of SGF International’s Voluntary Control System in the years 2019 to 2023 and were kindly provided by SGF International e.V. (Saulheim, Germany). The sample set included 10 samples of the cultivar ‘Alphonso’ (from India); one sample of the cultivar ‘Kent’ (from Peru); two samples of the cultivar ‘Criollo’ (from Peru); seven samples of the cultivar ‘Tommy’ (from Mexico), including six concentrates; and ten samples of the cultivar ‘Totapuri’ (from India), with three concentrates. The samples were shipped and stored at −18 °C and defrosted slowly at room temperature. Subsequently, 2 g of each sample was placed in a 20 mL headspace vial and closed tightly with a screw-cap with butyl/PTFE septa. All samples were prepared and measured in duplicate. The reference substances were ethyl butyrate, α-pinene, D-limonene, α-terpineol (Sigma-Aldrich Chemie GmbH, Taufkirchen, Germany), and β-caryophyllene (Carl Roth GmbH + Co. KG, Karlsruhe, Germany). Reference chemicals were dissolved in fresh canola oil as a neutral matrix.

2.2. Instrumentation (HS-GC-MS-IMS)

The oven temperature of the HS 20 headspace sampler (Shimadzu Corporation, Kyoto, Japan) was set to 50 °C, and the transfer and sample lines were operated at 150 °C. The trap cooling temperature was −10 °C, and the desorption temperature was set to 250 °C; the trap material was Tenax TA (Shimadzu Corporation, Kyoto, Japan). The equilibrium temperature was set to 25 °C. Multi-injection was set to 5. Chromatographic separation was performed with a Nexis™ GC-2030 (Shimadzu Corporation, Kyoto, Japan) and a chiral BGB 174 capillary column (30 m × 0.25 mm × 0.25 μm; BGB Analytik Vertrieb GmbH, Rheinfelden, Germany), using helium as the carrier gas in constant-pressure mode with 180 kPa and a splitter advanced pressure controller (APC) pressure of 38 kPa. The oven program started at 40 °C initial temperature, followed by a temperature ramp of 1 °C/min to 80 °C, 4 °C/min to 120 °C, and 6 °C/min to 160 °C, then holding for 5 min, resulting in 45 min per run. At the end of the analytical column, the column gas flow was split by a SilFlow GC 4 port splitter plate (Trajan Scientific and Medical, Ringwood, Australia) into two retention gaps (0.7 m length and 0.15 mm inner diameter for IMS and 1.6 m length and 0.15 mm inner diameter for MS). Transfer lines were operated at 220 °C for both MS and to IMS (Hillesheim GmbH, Waghäusel, Germany). The ion source temperature of the QP2020 NX MSD (Shimadzu Corporation, Kyoto, Japan) was set to 200 °C, the electron ionization energy was 70 eV, the emission current was 150 µA, and the scan range was m/z 35 to m/z 400, with a duty cycle of 300 ms.
The OEM-Focus-IMS cell with a 3H ionization source (100 MBq ß-emission) was operated at 100 °C. The drift tube had a diameter of 15.2 mm and a length of 98 mm and consisted of stainless steel and PEEK. IMS was operated in positive-ion mode at a constant voltage of 2.5 kV. The injection voltage was set to 2500 V, and the blocking voltage was set to 70 V. The drift gas was nitrogen, with a purity of 99.9999%, and the flow was controlled using a mass flow controller at 150 mL/min (Voegtlin Instruments AG, Aesch, Switzerland). Each spectrum was averaged over six scans, using a repetition rate of 21 ms. The injection pulse was set to a width of 100 μs, and the sampling frequency was 228 kHz.

2.3. Data Processing and Evaluation

MS data were analyzed using GCMSsolutions 4.53 (Shimadzu Corporation, Kyoto, Japan), and for substance identification, NIST/EPA/NIH Mass Spectral Library 23 from the NIST (Gaithersburg, MD, USA) of the U.S. Department of Commerce was used. For retention time comparison, the TIC chromatograms were integrated and the retention times at peak maximum were evaluated. In IMS, the spectra were processed as described in the following paragraph.
Python version 3.8.8 and the package gc-ims-tools version 0.1.7 were used for data preprocessing, multivariate analysis, and visualization of the IMS spectra [41]. Preprocessing is a crucial step in multivariate data analysis and important to obtain most of the biological information of a sample. To reduce the data size, each spectrum was treated by a “db3” wavelet compression with a level of 3. All spectra were aligned in drift time dimensions and normalized to the reactant ion peak (RIP). The alignment is particularly important, as the drift time is dependent on the pressure in the IMS cell. Consequently, variations in the atmospheric pressure may lead to shifts in the drift time of spectra over different days. Further, spectra were cropped to the areas with sample information, in regions of 100 s to 2700 s in the retention time axis and between 1.03 and 2.5 (ca. 6.5–16.25 ms) in the RIP-relative drift time axis. Afterwards, a baseline correction was applied to the dataset, using asymmetric least squares, with a weighting of 0.001 and smoothing set at 107. Subsequently, automated 2D peak detection by persistent homology (PH) was used for an objective and reproducible determination of the retention times [42]. The last preprocessing steps were Pareto scaling to reduce the influence of large peaks in comparison to smaller peaks and, finally, mean centering.

3. Results and Discussion

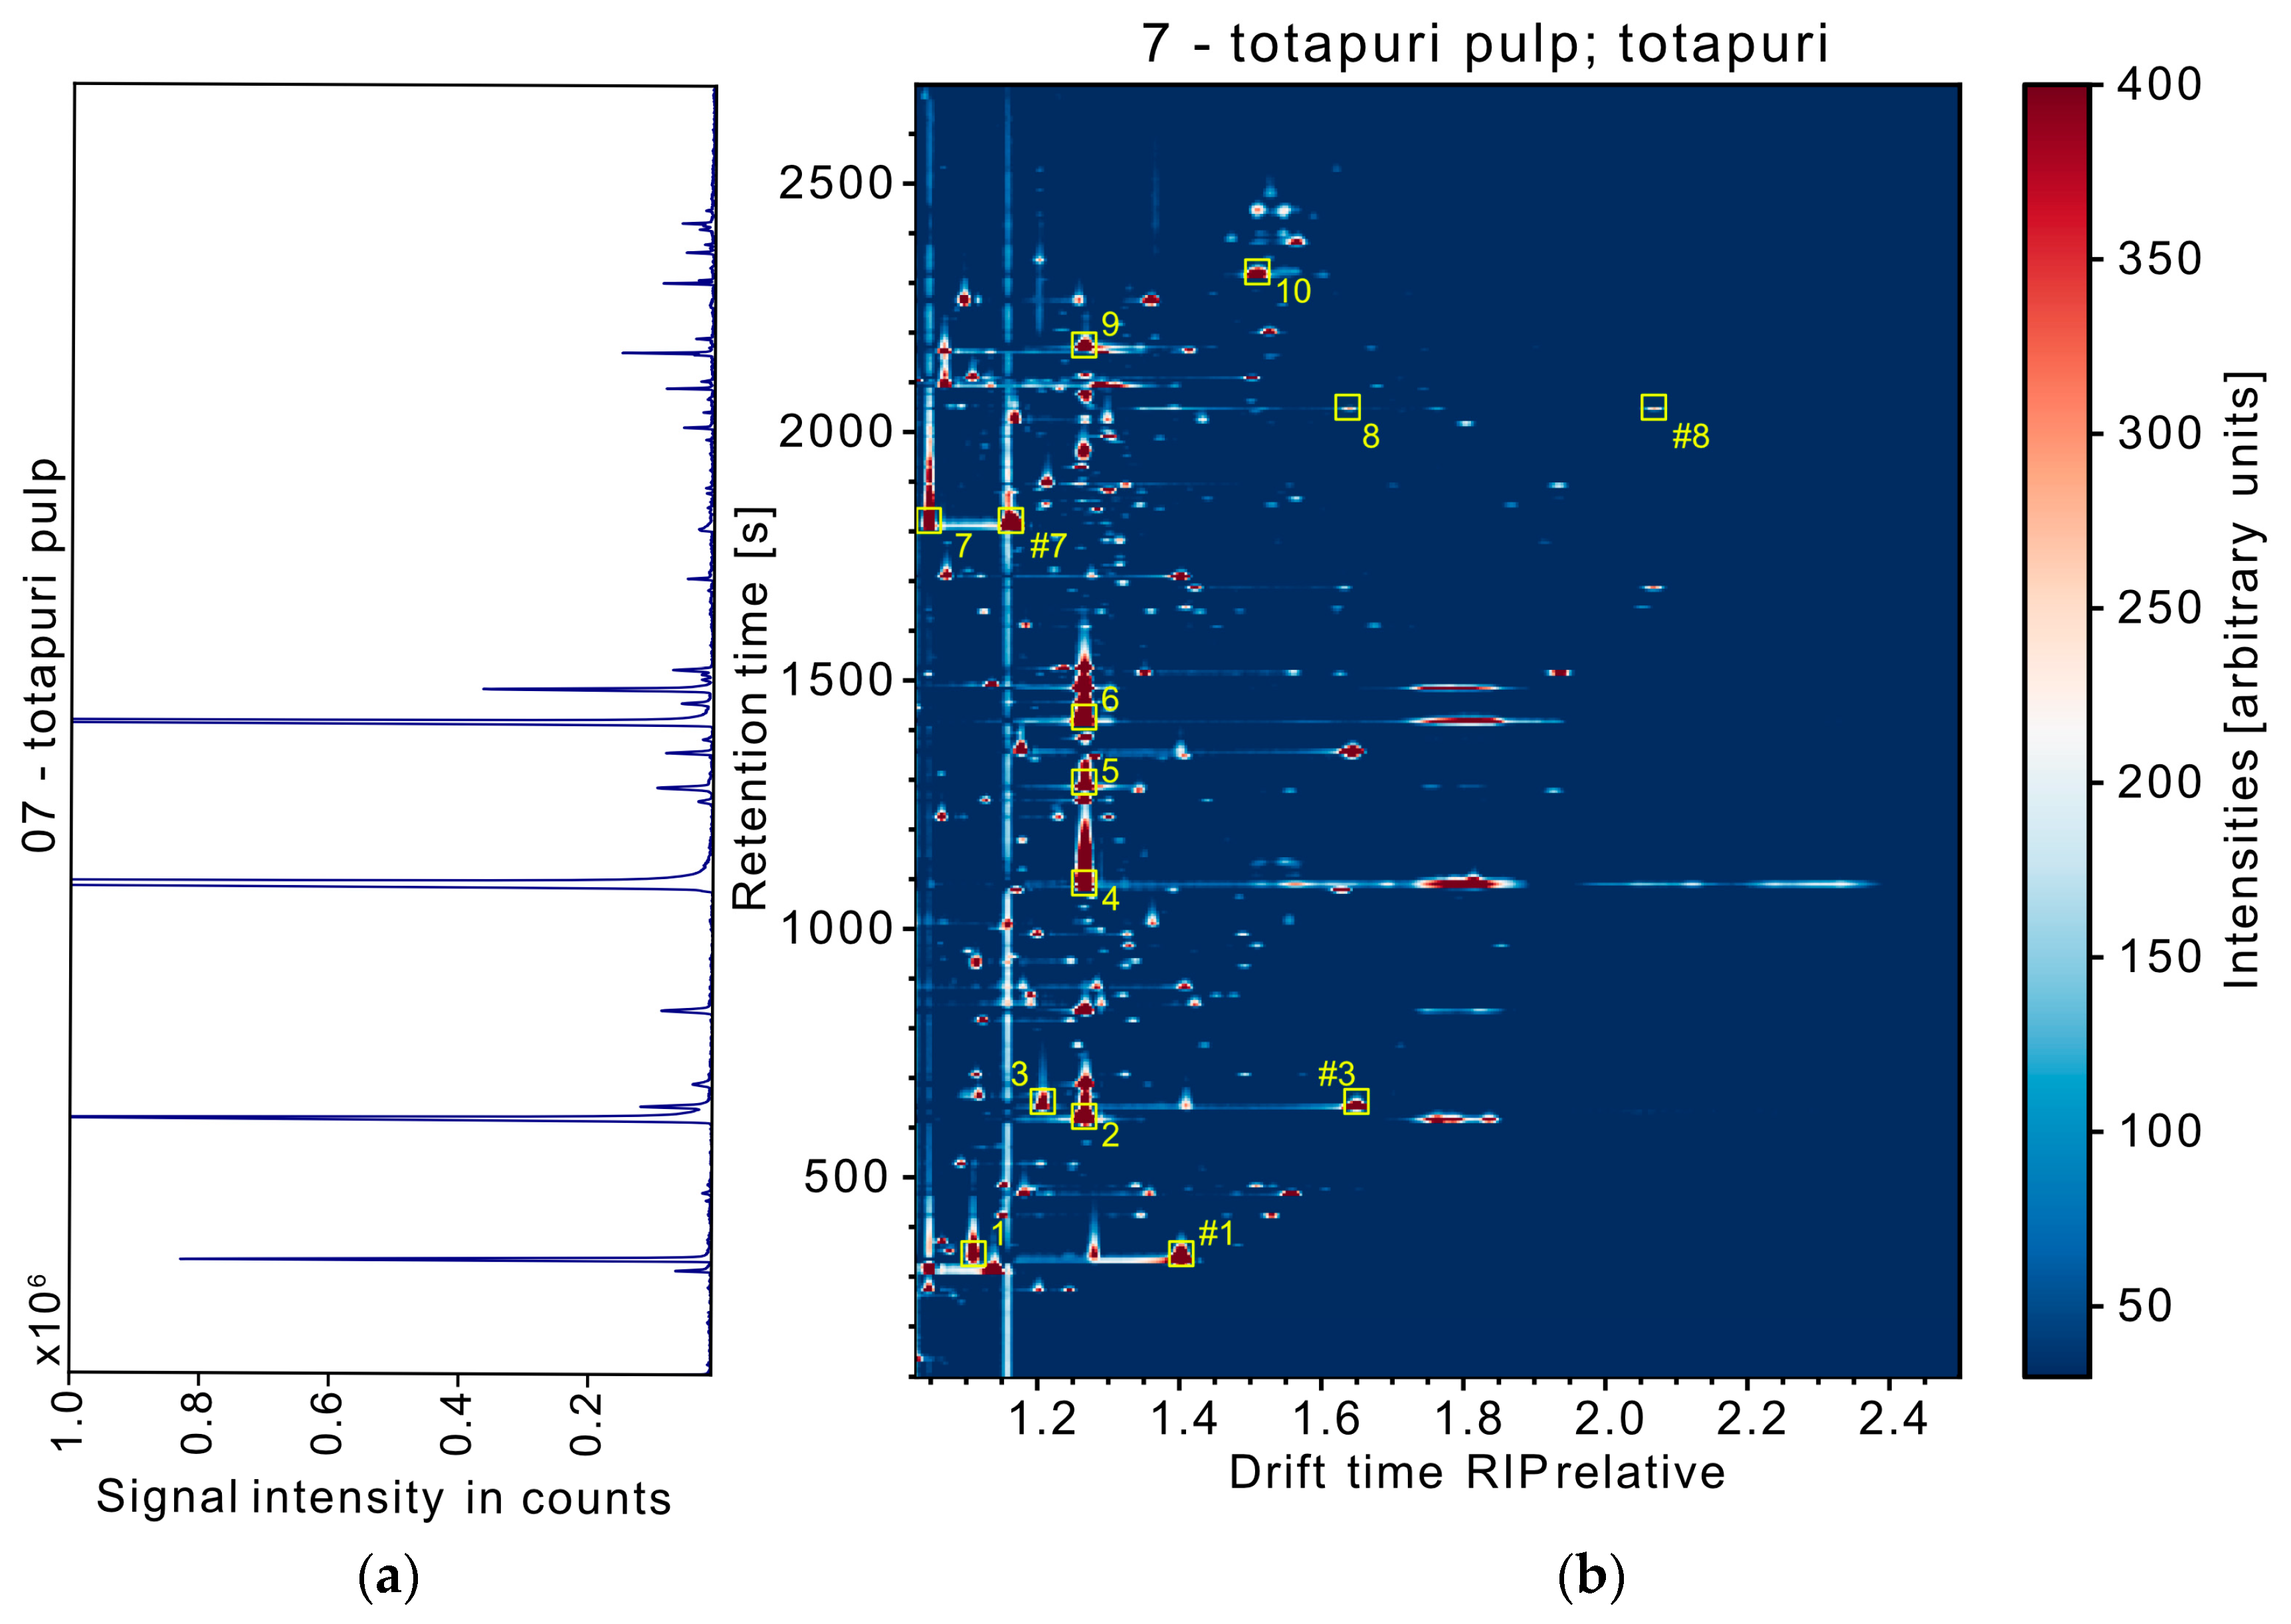
3.1. Performance of the THS-GC-MS-IMS System

Our group recently reported on the application of simultaneous SHS-GC-QMS-IMS in an analysis of brewing hops and Citrus juices, with limitations from the inferior signal intensities of the QMS data in comparison to the IMS data [2,25]. To overcome these limitations, THS sampling was applied to the mango samples, and the simultaneous GC-QMS (Figure 2a) and GC-IMS (Figure 2b) spectra of a cv. ‘Totapuri’ mango sample are visualized in Figure 2. GC-QMS and GC-IMS spectra of the cvs. ‘Alphonso’, ‘Kent’, ‘Criollo’ and ‘Tommy’ are shown in Supplementary Materials: Figures S1 – S4.For the majority of substances detected by IMS, signals in the QMS detector were sufficiently abundant. More than 80 compounds were detected in the samples and showed sufficient S/N ratios, both in MS and IMS spectra, and the information from both detectors was complementary to a certain extent. The latter number is in line with previously published profiling studies of mango fruits that used static HS-SPME-GC-MS [29,38]. While the IMS system is able to detect intact ion species at low trace levels, EI-QMS features high-fragmenting m/z information, optimally suited for database referral. To date, no substance databases for GC-IMS systems are commercially available, so only simultaneously generated full-scan MS data were used for substance confirmation. To evaluate the synchronicity of both IMS and MS retention times, a number of relevant substances were selected. Figure 2b shows the exemplary compounds: ethyl acetate (1), α-pinene (2), ethyl butyrate (3), β-myrcene (4), D-limonene (5), trans-β-ocimene (6), acetic acid (7), nonanal (8), α-terpineol (9), and β-caryophyllene (10).
In Table 1, a comparison of the retention times for both IMS and QMS and the MS match quality of the identified VOCs is displayed. When comparing the QMS and IMS retention times of the selected compounds, the majority can be seen to match with only slight deviations. As observed in previous studies, analytes with a lower boiling point showed slightly better correspondences in their retention times compared to those with higher boiling points [2,7]. By optimized retention gaps, the retention time difference was improved substantially. Schanzmann et al. describe a hyphenation of thermal desorption with GC-MS-IMS for breath analysis. There, a homologous series of ketones was evaluated with regard to retention times in MS and IMS. The retention times up to 2-octanone were in reasonable accordance, but the difference between MS and IMS was reported to increase with growing chain lengths up to 0.24 min for 2-decanone [7].
Brendel et al. reported a comparable observation for terpenes and terpenoids. In that study, IMS retention values for α-pinene and β-myrcene matched with the QMS signals. However, the higher-boiling β-caryophyllene and α-terpineol showed substantial differences of 0.18 min and 0.19 min, respectively [2]. In the present study, we were able to optimize this particular pair of substances to obtain retention time differences of 0.05 min and 0.15 min, respectively. One crucial factor in this context is the IMS cell temperature, particularly for higher-boiling volatile compounds. Commercially available IMS instruments are limited to cell temperatures below 100 °C, which may facilitate condensation effects of high-boiling compounds in the cell. This adversely affects the peak shapes of high-boiling volatile compounds, such as sesquiterpenes, significantly.
In Table 2, the detected VOCs are listed. A broad profile of compounds was detected, including esters, aldehydes, terpenes, and sesquiterpenes. While IMS has its strengths for polar and medium-polar compounds, such as aldehydes and esters, the MS detection was advantageous in the detection of substances of lower polarity and with higher boiling points above 250 °C, such as sesquiterpenes. The lower IMS cell temperatures in relation to the higher EI source temperature are presumably important drivers here. For IMS, these substances feature limited separation due to strong tailing effects. One general option to overcome this limitation is to increase IMS cell temperatures, but such IMS systems are not yet commercially available. Studies on a prototypic high-temperature IMS (HT-IMS) demonstrated significant improvements in peak shape for high-boiling VOCs [43].
Previously published SHS-SPME-GC-MS studies reported similar VOCs in mango fruits; however, they were limited to achiral gas chromatography [29,30,32,33]. Chiral GC separation features excellent performance for enantiomers, particularly those of sesquiterpenes. Chiral GC applications have a high potential and are considered an emerging topic in the field of “greener” quality analytics for food and flavorings, even though the approaches currently have limited applicability [44]. In the present study, we employed a ß-cyclodextrin-based BGB-174 chiral GC column in the generation of an enantiomeric fingerprint for the non-targeted data analysis. The underlying hypothesis was that an increase in relevant features based on the chiral information of the respective samples should increase the differentiation power of exploratory data analysis approaches or machine learning models, as described in the following section.

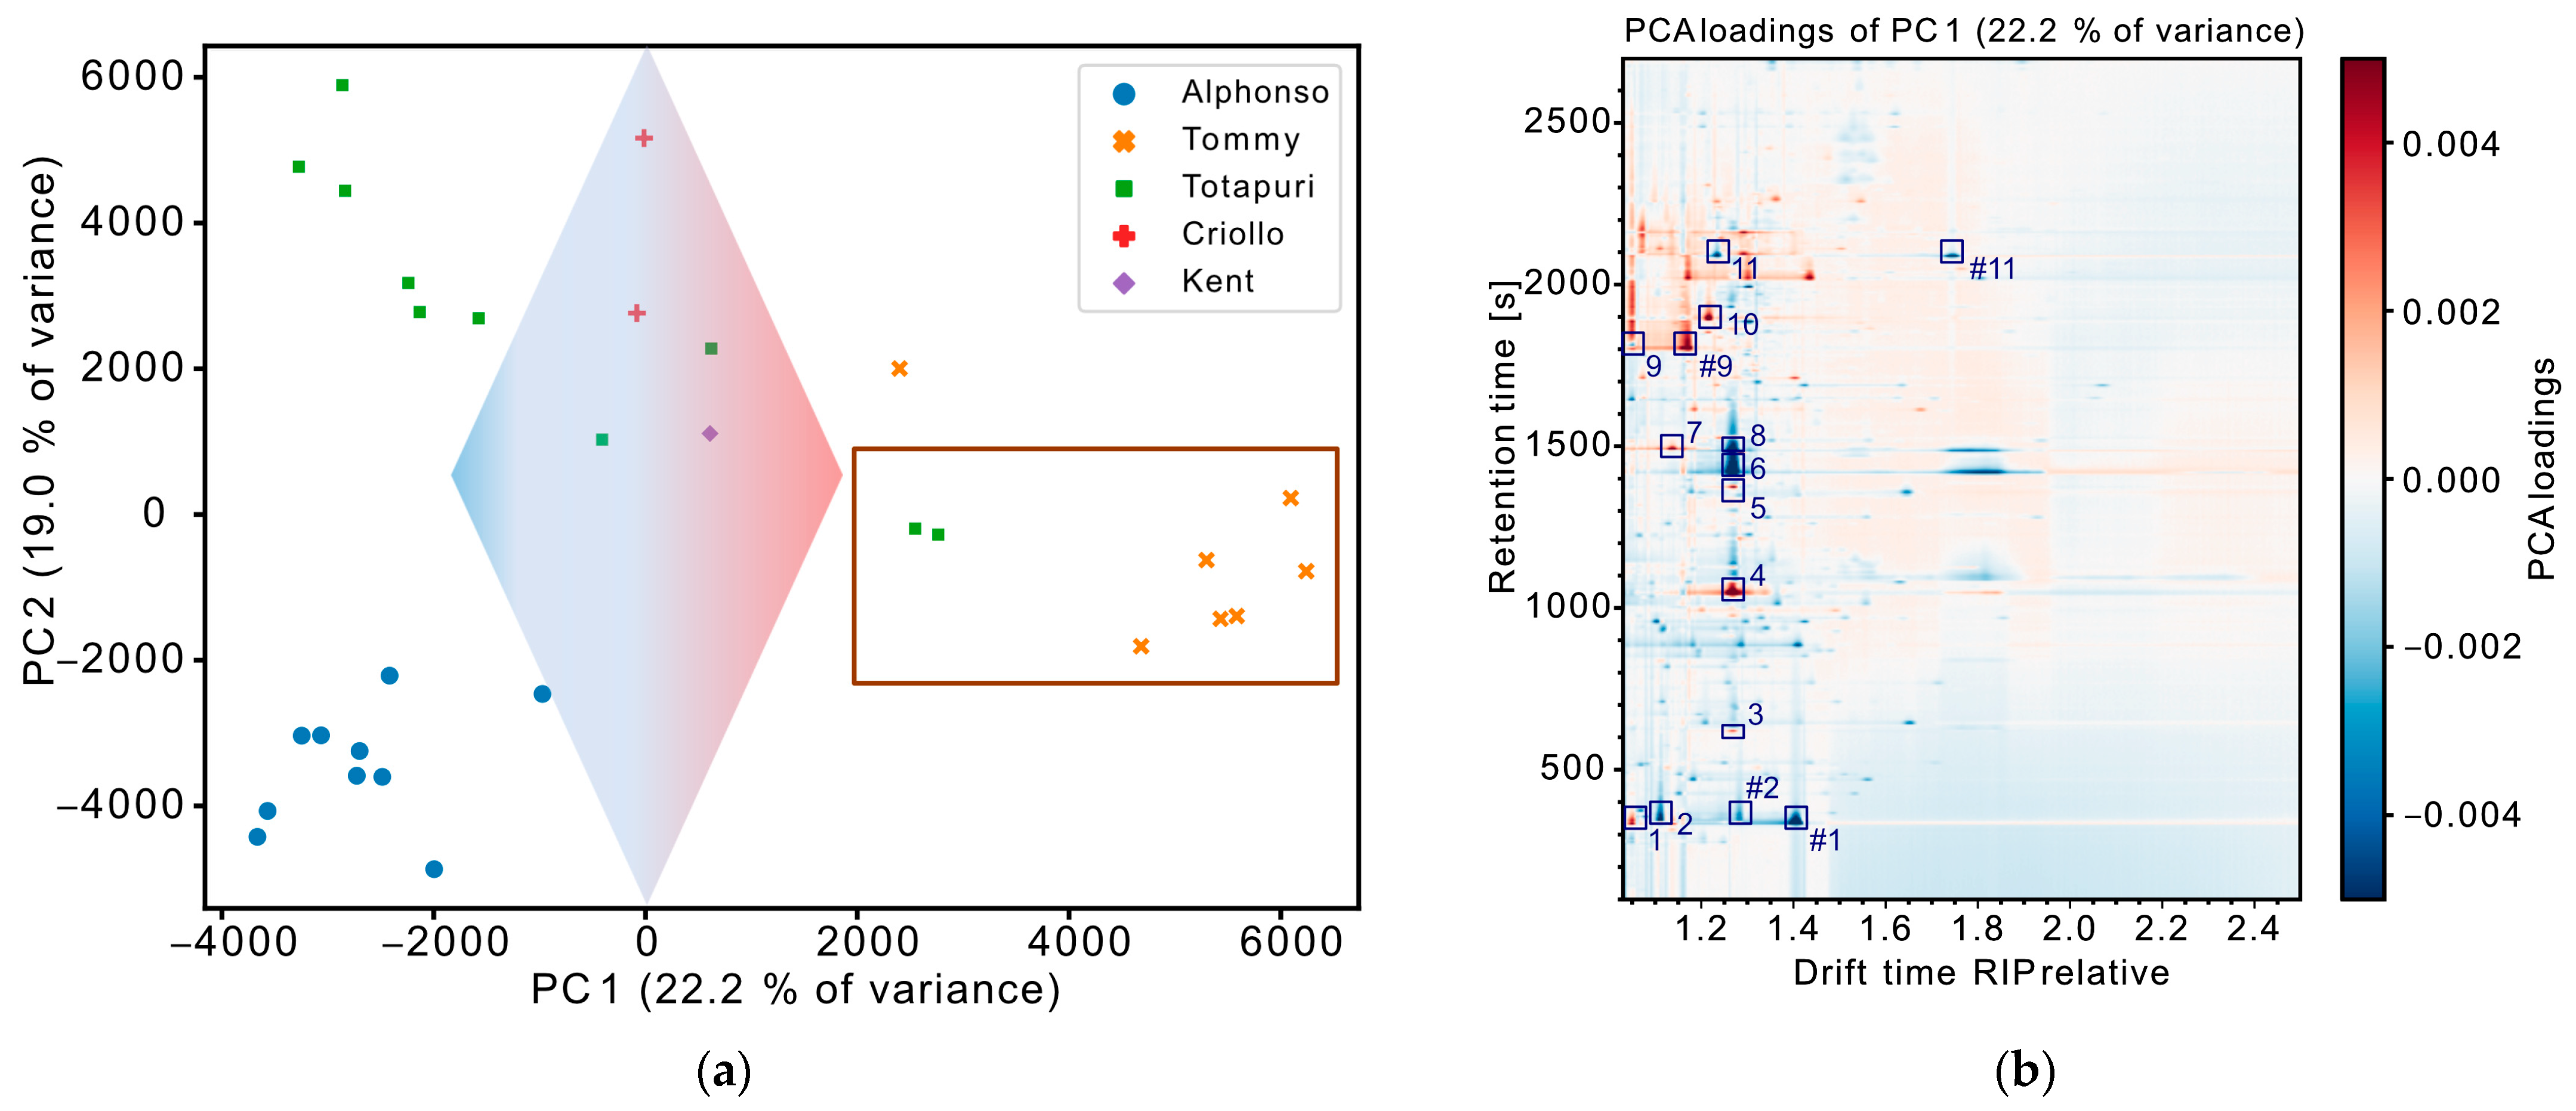
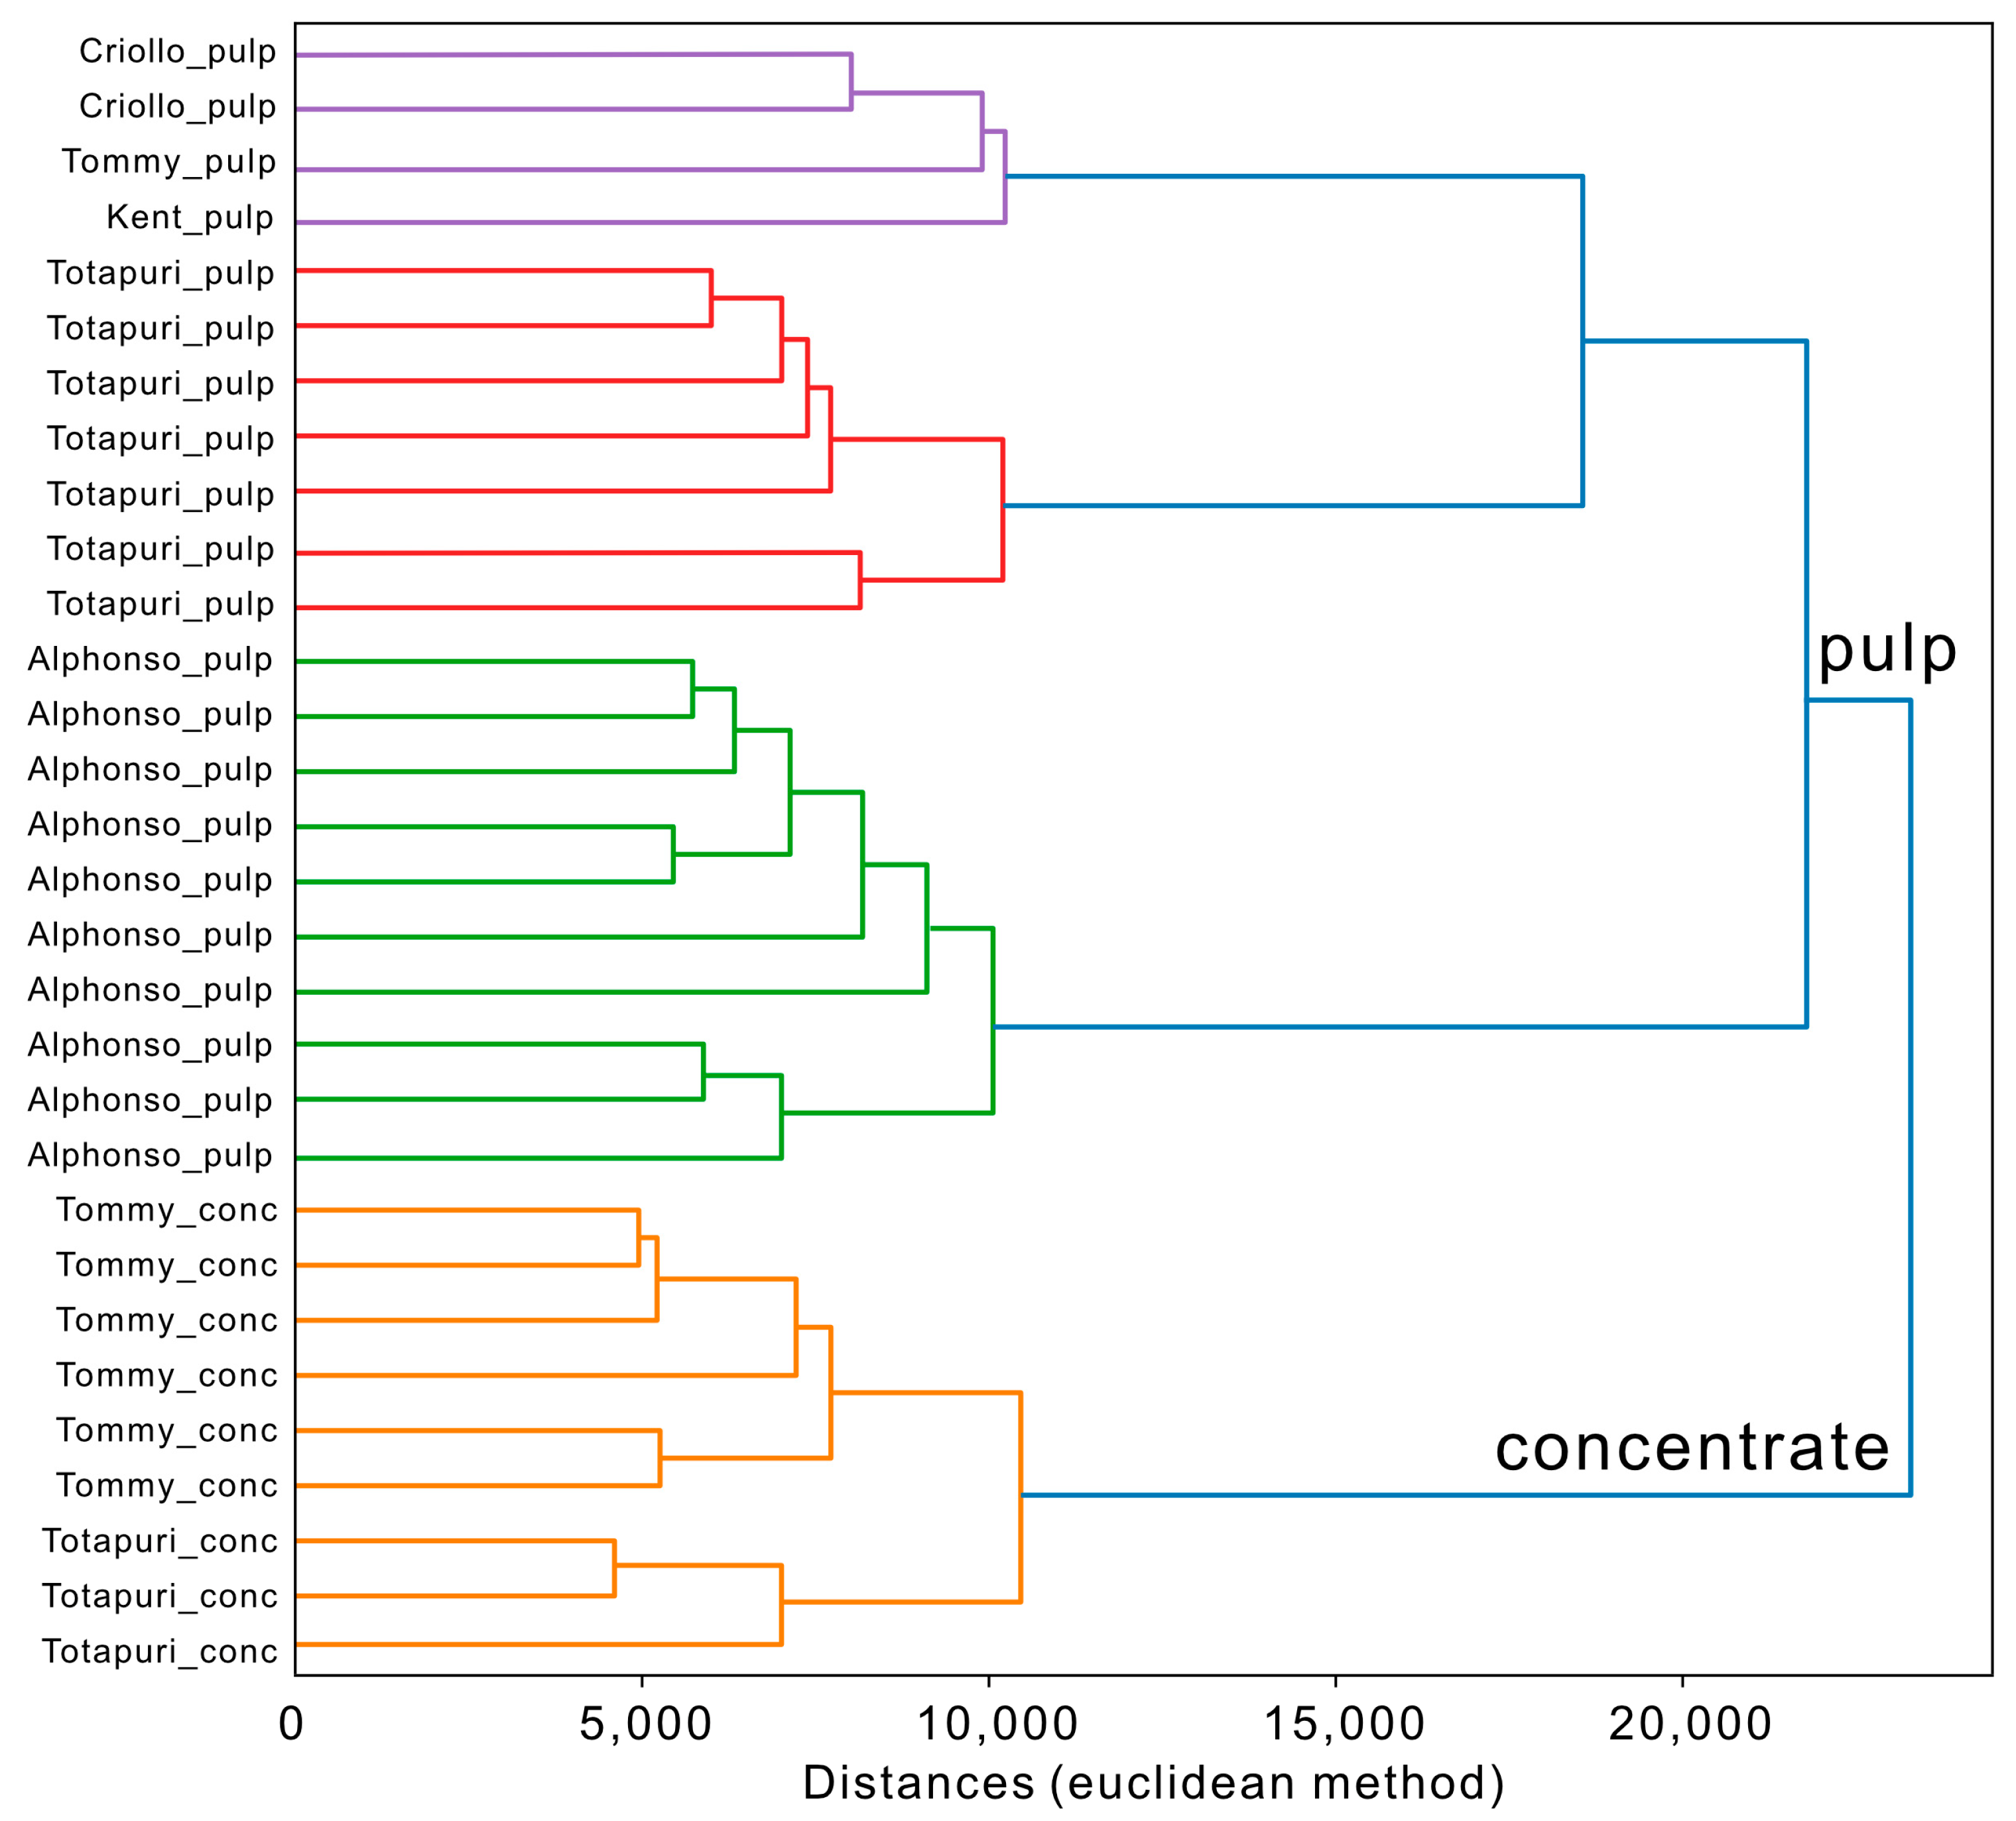
3.2. Exploratory Data Evaluation of Non-Targeted IMS Data

The principal rationale for using IMS data for the exploratory data analysis was the significantly higher overall sensitivity of the IMS over the QMS detector, resulting in a higher number of signals detected, particularly for the polar and medium-polar species. This was due in part to the softer ionization process in the IMS vs. the hard EI ionization in the QMS. EI spectra are dominated by high numbers of often similar fragment ions for different molecular species and thus add variance to the data that are not associated with discriminative information, increasing inter-class variance. IMS generates nearly no fragment ions, and the second-order data from the drift time domain increase the number of “useful” signals. These additional signals are important features for subsequent data analysis, typically leading to more meaningful and more robust principal component analysis (PCA) models. This was already demonstrated by Brendel et al., in whose study, typically, IMS data generated more robust models [2,25].
For the subsequent evaluation of the non-targeted data resulting from the GC-IMS domain, PCA was employed as a first step. Our toolbox gc-ims-tools allows not only PCA to be performed on preprocessed data, but furthermore adds a substantial step in understanding the character of the underlying data by backwards projection of the respective loadings to the original data space [41,45].
Figure 3a shows a score plot of the second and third principal components. The visualization reveals the positions of samples in the variable space.
PC2, covering 19.0% of the variance, and PC3, covering 14.1% of the variance, were selected due to their having the highest explained variance for the different mango cultivars. While PC2 shows a separation of cv. ‘Alphonso’ and the other classes, PC3 separates cvs. ‘Totapuri’, ‘Tommy’, and ‘Criollo’. The backwards-projected PCA loadings of PC2 for the original data space with the dimensions of retention time × normalized drift time are visualized in Figure 3b and the PCA loadings of PC3 in Figure S5. This allows for a direct connection between the original data and the PCA score plot and shows in a figurative way the contribution or relevance of individual substance signals for the separation. High positive (red) or negative values (blue) indicate a significant correlation, while values around zero are less relevant. For PC2, this is visualized with the arrow in Figure 3a, with red for high positive loadings and blue for high negative loadings. For the separation of cv. ‘Alphonso’ mango vs. other cultivars, several compounds display a substantial impact. Based on the QMS spectra of the dataset, 17 relevant components with a high influence on PC2 were confirmed via the NIST database. These are visualized in Figure 3b. The loading plot shows the importance of PC2 for the separation of the cultivars. Cv. ‘Totapuri’ and cv. ‘Criollo’ feature higher amounts and numbers of sesquiterpenes, including α-gurjunene, β-caryophyllene, and δ-cadinene. Further, the two cultivars show a higher abundance of α-pinene, β-pinene, and β-myrcene, as well as α-phellandrene and β-phellandrene. With a high negative correlation in the PCA loadings, 2,5-dimethyl-4-methoxy-3(2H)-furanone was important for the separation of the cv. ‘Alphonso’. This compound has already been described as a particularly important flavor constituent for this cultivar in previous studies [46,47].
Another observation was the differentiability of minimally processed pulps and concentrated pulps via the VOC profiles: the score plot for PC1 and PC2 is shown in Figure 4a, and it shows a separation between the samples of cv. ‘Tommy’ and two samples of cv. ‘Totapuri’ relative to all of the other mango samples. These particular samples were concentrated pulps, while the remaining samples were minimally processed pulps. To identify the compounds responsible for the observed separation on PC1, the loading plot was again backwards-projected onto the original data space (Figure 4b). Acetic acid, ethanol, and 3-carene displayed a significant positive correlation, while ethyl acetate, 2,5-dimethyl-4-methoxy-3(2H)-furanone, and trans-β-ocimene showed low abundances. These VOCs were identified for all analyzed samples of the cv. ‘Tommy’, but also for two samples of the cv. ‘Totapuri’, which also featured high positive scores on PC1. In comparison to the other minimally processed cv. ‘Totapuri’ samples, both concentrate samples featured lower abundances of a number of esters (e.g., ethyl propanoate, propyl acetate, and methyl butyrate) and alcohols (e.g., isobutanol and isopentyl alcohol). However, these compounds did not show significant impacts on PC1, which indicates a lower variance for these compounds relative to the substances with higher abundances. This underlines that the relevant information for the separation described by the respective PCs is not the mere presence of the signals but rather the ratios of the peaks. For instance, acetic acid indicated a higher abundance in the concentrates relative to the minimally processed samples. This underlines the importance of good feature selection for potentially following supervised methods and is in line with a recently published study by our group on the selection of relevant features [45]. For illustrative purposes, Figure S6 shows a 3D PCA scores plot of PC1, PC2 and PC3.
To explain the observation of the two clusters for the cv. ‘Totapuri’, hierarchical cluster analysis (HCA) based on Euclidean distances was applied to the dataset. This approach evaluates the distances between individual samples. The higher the distance, the greater the sample difference, and vice versa. A corresponding dendrogram is visualized in Figure 5 and shows two main clusters. The first contains all minimally processed pulp samples, and the second one includes all concentrated pulp samples.
The separation can be explained by the processing employed in the concentration step and the utilization of flavorings for concentrated products. The concentrated samples displayed higher amounts of acetic acid, which, in small doses, is reported to be a useful product for fruit flavoring, and, on the other hand, contained less fruity esters, such as propyl acetate and methyl butyrate [35,48,49,50].
Additionally, HCA separated the cluster of the minimally processed pulp samples into two subgroups. The first subgroup included the samples of the cv. ‘Alphonso’, and the second subgroup contained the other cultivars. As already mentioned, the cv. ‘Alphonso’ showed a quite characteristic profile with a number of lactones (e.g., γ-butyrolactone, γ-hexalactone, and 2,5-dimethyl-4-methoxy-3(2H)-furanone). The subgroup of the other cultivars displayed a further clustering of the cv. ‘Totapuri’ and the other cultivars. Cvs. ‘Kent’, ‘Tommy’, and ‘Criollo’ featured the monoterpene 3-carene, which was not detected in the Totapuri cultivar, where trans-β-ocimene was the predominant terpene.

4. Conclusions

This study evaluated the potential of chiral THS-GC-QMS-IMS for non-targeted analysis of complex food and beverage samples in combination with chemometric data evaluation. The instrumentation offers the combination of soft ionization in IMS and valuable m/z value information from the QMS detector. Simultaneous data acquisition showed highly comparable retention times, and more than 80 compounds were identified within the study. One of the particular advantages of the setup in quality analytics for (sensitive) foods and beverages is the relatively low incubation temperature needed, which reduces the risk of formation of artifacts. A chiral column was used, with a view to the generation of additional features for non-targeted screening rather than the differentiation of individual compounds. The spectra generated by both detectors are more comparable due to pressure-regulated sampling, and chiral information is applicable to the differentiation of cultivars and the determination of provenance and provides useful information on authenticity and quality. The combination of PCA score plots and backwards-projected loading plots revealed characteristic VOCs for the different mango cultivars and allowed for the differentiation of minimally processed and concentrated samples. HCA offered initial indications of similarities in the VOC profiles of the mango samples and allowed a clear separation of concentrated vs. minimally processed samples and, furthermore, differentiation between the different cultivars. The dual detection in combination with trapped-headspace sampling generates a complex fingerprint for a sample, reducing the need for two separate systems, but at the same time generates complementary information from one single injection. While these preliminary results are promising, a larger set of (authentic) samples is required with regard to cultivars, provenance, and processing methods.
In a generalized view, this approach may be of substantial importance for a plethora of other applications in quality control of foods, beverages, and flavorings, where characteristic VOC profiles are found. Furthermore, we anticipate that the strategy of using non-targeted chiral GC-IMS and -MS data from one single injection could also be of substantial interest in the field of authenticity analysis, as, so far, only a small number of studies have taken this valuable information into account.
While there are an increasing number of GG-IMS systems found in (food) analytical labs, these are typically still used as “extras” alongside GC-IMS rather than as a routine step. The combination of both strategies in one single system allows analysts to stick to established and validated pathways, yet it could deliver valuable additional information. This could also simplify the generation of verified spectral databases for IMS data, which is still one of the weakest aspects of the platform, as, to date, there are no databases in the public domain.

Supplementary Materials

The following supporting information can be downloaded at: https://www.mdpi.com/article/10.3390/chemosensors12080165/s1, Figure S1: Exemplary visualization of an ‘Alphonso´ mango sample and the simultaneous sample data of QMS (a) and IMS (b); Figure S2: Exemplary visualization of a ‘Kent’ mango sample and the simultaneous sample data of QMS (a) and IMS (b); Figure S3: Exemplary visualization of a ‘Criollo’ mango sample and the simultaneous sample data of QMS (a) and IMS (b); Figure S4: Exemplary visualization of a ‘Tommy’ mango sample and the simultaneous sample data of QMS (a) and IMS (b); Figure S5: PCA loadings of PC3; Figure S6: 3D PCA scores plot of PC1, PC2 and PC3.

Author Contributions

Conceptualization, P.W. and L.B.; sample provision, M.J.; methodology, L.B., M.J.; software, L.B. and P.W.; data curation, L.B.; study design of chemometric approaches, L.B., S.S. and P.W.; writing—original draft preparation, L.B. and P.W.; writing—review and editing, P.W., S.S., M.J. and S.R.; supervision, P.W., S.R. and S.S.; funding acquisition, P.W. and S.S.; final approval, L.B., S.R., S.S., M.J. and P.W. All authors have read and agreed to the published version of the manuscript and further agree to be accountable for the manuscript contents.

Funding

This research was funded by the Federal Ministry of Education and Research (BMBF), Berlin, Germany, grant number 13FH138KX0 (FH Kooperativ “Deep Authent”).

Institutional Review Board Statement

Not applicable.

Informed Consent Statement

Not applicable.

Data Availability Statement

The data presented in this study are available on request from the corresponding author.

Conflicts of Interest

The authors declare no conflicts of interest. The funders had no role in the design of the study; in the collection, analyses, or interpretation of data; in the writing of the manuscript; or in the decision to publish the results. Author Markus Jungen was employed by the non-profit organization SGF International e.V. The remaining authors declare that the research was conducted in the absence of any financial or non-financial relationships that could be construed as potential conflicts of interest.

References

  1. Hernández-Mesa, M.; Ropartz, D.; García-Campaña, A.M.; Rogniaux, H.; Dervilly-Pinel, G.; Le Bizec, B. Ion Mobility Spectrometry in Food Analysis: Principles, Current Applications and Future Trends. Molecules 2019, 24, 2706. [Google Scholar] [CrossRef]
  2. Brendel, R.; Schwolow, S.; Rohn, S.; Weller, P. Volatilomic Profiling of Citrus Juices by Dual-Detection HS-GC-MS-IMS and Machine Learning-An Alternative Authentication Approach. J. Agric. Food Chem. 2021, 69, 1727–1738. [Google Scholar] [CrossRef]
  3. Capitain, C.; Weller, P. Non-Targeted Screening Approaches for Profiling of Volatile Organic Compounds Based on Gas Chromatography-Ion Mobility Spectroscopy (GC-IMS) and Machine Learning. Molecules 2021, 26, 5457. [Google Scholar] [CrossRef]
  4. Karpas, Z. Applications of ion mobility spectrometry (IMS) in the field of foodomics. Food Res. Int. 2013, 54, 1146–1151. [Google Scholar] [CrossRef]
  5. Parastar, H.; Weller, P. Towards greener volatilomics: Is GC-IMS the new Swiss army knife of gas phase analysis? TrAC Trends Anal. Chem. 2024, 170, 117438. [Google Scholar] [CrossRef]
  6. Borsdorf, H.; Eiceman, G.A. Ion Mobility Spectrometry: Principles and Applications. Appl. Spectrosc. Rev. 2006, 41, 323–375. [Google Scholar] [CrossRef]
  7. Schanzmann, H.; Ruzsanyi, V.; Ahmad-Nejad, P.; Telgheder, U.; Sielemann, S. A novel coupling technique based on thermal desorption gas chromatography with mass spectrometry and ion mobility spectrometry for breath analysis. J. Breath Res. 2023, 18, 016009. [Google Scholar] [CrossRef] [PubMed]
  8. Kremser, A.; Jochmann, M.A.; Schmidt, T.C. Systematic comparison of static and dynamic headspace sampling techniques for gas chromatography. Anal. Bioanal. Chem. 2016, 408, 6567–6579. [Google Scholar] [CrossRef]
  9. Poole, C.F. (Ed.) Gas Chromatography, 2nd ed.; Elsevier: Amsterdam, The Netherlands, 2021; ISBN 9780128206751. [Google Scholar]
  10. Soria, A.C.; García-Sarrió, M.J.; Sanz, M.L. Volatile sampling by headspace techniques. TrAC Trends Anal. Chem. 2015, 71, 85–99. [Google Scholar] [CrossRef]
  11. Costa Freitas, A.M.; Gomes da Silva, M.D.R.; Cabrita, M.J. Sampling Techniques for the Determination of Volatile Components in Grape Juice, Wine and Alcoholic Beverages. In Comprehensive Sampling and Sample Preparation: Analytical Techniques for Scientists; Academic Press: Amsterdam, The Netherlands, 2012; pp. 27–41. ISBN 9780123813749. [Google Scholar]
  12. Ikem, A. Measurement of volatile organic compounds in bottled and tap waters by purge and trap GC–MS: Are drinking water types different? J. Food Compos. Anal. 2010, 23, 70–77. [Google Scholar] [CrossRef]
  13. Schulz, K.; Dressler, J.; Sohnius, E.-M.; Lachenmeier, D.W. Determination of volatile constituents in spirits using headspace trap technology. J. Chromatogr. A 2007, 1145, 204–209. [Google Scholar] [CrossRef] [PubMed]
  14. Manzini, S.; Durante, C.; Baschieri, C.; Cocchi, M.; Sighinolfi, S.; Totaro, S.; Marchetti, A. Optimization of a Dynamic Headspace-Thermal Desorption-Gas Chromatography/Mass Spectrometry procedure for the determination of furfurals in vinegars. Talanta 2011, 85, 863–869. [Google Scholar] [CrossRef] [PubMed]
  15. Jeleń, H.; Gracka, A.; Myśków, B. Static Headspace Extraction with Compounds Trapping for the Analysis of Volatile Lipid Oxidation Products. Food Anal. Methods 2017, 10, 2729–2734. [Google Scholar] [CrossRef]
  16. Soria, A.C.; García-Sarrió, M.J.; Ruiz-Matute, A.I.; Sanz, M.L. Headspace Techniques for Volatile Sampling. In Green Extraction Techniques—Principles, Advances and Applications; Elsevier: Amsterdam, The Netherlands, 2017; pp. 255–278. ISBN 9780128110829. [Google Scholar]
  17. Christmann, J.; Weber, M.; Rohn, S.; Weller, P. Nontargeted Volatile Metabolite Screening and Microbial Contamination Detection in Fermentation Processes by Headspace GC-IMS. Anal. Chem. 2024, 96, 3794–3801. [Google Scholar] [CrossRef]
  18. Zacometti, C.; Sammarco, G.; Massaro, A.; Lefevre, S.; Frégière-Salomon, A.; Lafeuille, J.-L.; Candalino, I.F.; Piro, R.; Tata, A.; Suman, M. Authenticity assessment of ground black pepper by combining headspace gas-chromatography ion mobility spectrometry and machine learning. Food Res. Int. 2024, 179, 114023. [Google Scholar] [CrossRef] [PubMed]
  19. Babis, J.S.; Sperline, R.P.; Knight, A.K.; Jones, D.A.; Gresham, C.A.; Denton, M.B. Performance evaluation of a miniature ion mobility spectrometer drift cell for application in hand-held explosives detection ion mobility spectrometers. Anal. Bioanal. Chem. 2009, 395, 411–419. [Google Scholar] [CrossRef]
  20. Zhang, X.; Ren, X.; Zhong, Y.; Chingin, K.; Chen, H. Rapid and sensitive detection of acetone in exhaled breath through the ambient reaction with water radical cations. Analyst 2021, 146, 5037–5044. [Google Scholar] [CrossRef]
  21. Zhang, X.; Ren, X.; Chingin, K.; Xu, J.; Yan, X.; Chen, H. Mass spectrometry distinguishing C=C location and cis/trans isomers: A strategy initiated by water radical cations. Anal. Chim. Acta 2020, 1139, 146–154. [Google Scholar] [CrossRef]
  22. Wang, S.; Chen, H.; Sun, B. Recent progress in food flavor analysis using gas chromatography-ion mobility spectrometry (GC-IMS). Food Chem. 2020, 315, 126158. [Google Scholar] [CrossRef]
  23. Tan, C.; Tian, Y.; Tao, L.; Xie, J.; Wang, M.; Zhang, F.; Yu, Z.; Sheng, J.; Zhao, C. Exploring the Effect of Milk Fat on Fermented Milk Flavor Based on Gas Chromatography–Ion Mobility Spectrometry (GC-IMS) and Multivariate Statistical Analysis. Molecules 2024, 29, 1099. [Google Scholar] [CrossRef]
  24. Valli, E.; Panni, F.; Casadei, E.; Barbieri, S.; Cevoli, C.; Bendini, A.; García-González, D.L.; Gallina Toschi, T. An HS-GC-IMS Method for the Quality Classification of Virgin Olive Oils as Screening Support for the Panel Test. Foods 2020, 9, 657. [Google Scholar] [CrossRef] [PubMed]
  25. Brendel, R.; Schwolow, S.; Rohn, S.; Weller, P. Gas-phase volatilomic approaches for quality control of brewing hops based on simultaneous GC-MS-IMS and machine learning. Anal. Bioanal. Chem. 2020, 412, 7085–7097. [Google Scholar] [CrossRef]
  26. Schanzmann, H.; Augustini, A.L.R.M.; Sanders, D.; Dahlheimer, M.; Wigger, M.; Zech, P.-M.; Sielemann, S. Differentiation of Monofloral Honey Using Volatile Organic Compounds by HS-GCxIMS. Molecules 2022, 27, 7554. [Google Scholar] [CrossRef]
  27. Lauricella, M.; Emanuele, S.; Calvaruso, G.; Giuliano, M.; D’Anneo, A. Multifaceted Health Benefits of Mangifera indica L. (Mango): The Inestimable Value of Orchards Recently Planted in Sicilian Rural Areas. Nutrients 2017, 9, 525. [Google Scholar] [CrossRef] [PubMed]
  28. Tharanathan, R.N.; Yashoda, H.M.; Prabha, T.N. Mango (Mangifera indica L.), “The King of Fruits”—An Overview. Food Rev. Int. 2006, 22, 95–123. [Google Scholar] [CrossRef]
  29. Shimizu, K.; Matsukawa, T.; Kanematsu, R.; Itoh, K.; Kanzaki, S.; Shigeoka, S.; Kajiyama, S.I. Volatile profiling of fruits of 17 mango cultivars by HS-SPME-GC/MS combined with principal component analysis. Biosci. Biotechnol. Biochem. 2021, 85, 1789–1797. [Google Scholar] [CrossRef]
  30. Tandel, J.; Tandel, Y.; Kapadia, C.; Singh, S.; Gandhi, K.; Datta, R.; Singh, S.; Yirgu, A. Nontargeted Metabolite Profiling of the Most Prominent Indian Mango (Mangifera indica L.) Cultivars Using Different Extraction Methods. ACS Omega 2023, 8, 40184–40205. [Google Scholar] [CrossRef]
  31. Musharraf, S.G.; Uddin, J.; Siddiqui, A.J.; Akram, M.I. Quantification of aroma constituents of mango sap from different Pakistan mango cultivars using gas chromatography triple quadrupole mass spectrometry. Food Chem. 2016, 196, 1355–1360. [Google Scholar] [CrossRef] [PubMed]
  32. Pino, J.A.; Mesa, J.; Muñoz, Y.; Martí, M.P.; Marbot, R. Volatile components from mango (Mangifera indica L.) cultivars. J. Agric. Food Chem. 2005, 53, 2213–2223. [Google Scholar] [CrossRef]
  33. Mahattanatawee, K.; Goodner, K.; Baldwin, E.A. Volatile constituents and character impact compounds of selected Florida’s tropical fruit. Proc. Fla. State Hort. Soc. 2005, 118, 414–418. [Google Scholar]
  34. Pandit, S.S.; Chidley, H.G.; Kulkarni, R.S.; Pujari, K.H.; Giri, A.P.; Gupta, V.S. Cultivar relationships in mango based on fruit volatile profiles. Food Chem. 2009, 114, 363–372. [Google Scholar] [CrossRef]
  35. Ziegler, H. Flavourings: Production, Composition, Applications, Regulations, 2nd ed.; Wiley: Chichester, UK; Weinheim, Germany, 2007; ISBN 3527611452. [Google Scholar]
  36. Farag, M.A.; Dokalahy, E.U.; Eissa, T.F.; Kamal, I.M.; Zayed, A. Chemometrics-Based Aroma Discrimination of 14 Egyptian Mango Fruits of Different Cultivars and Origins, and Their Response to Probiotics Analyzed via SPME Coupled to GC-MS. ACS Omega 2022, 7, 2377–2390. [Google Scholar] [CrossRef]
  37. Indrati, N.; Sumpavapol, P.; Samakradhamrongthai, R.S.; Phonsatta, N.; Poungsombat, P.; Khoomrung, S.; Panya, A. Volatile and non-volatile compound profiles of commercial sweet pickled mango and its correlation with consumer preference. Int. J. Food Sci. Technol. 2022, 57, 3760–3770. [Google Scholar] [CrossRef]
  38. Bonneau, A.; Boulanger, R.; Lebrun, M.; Maraval, I.; Gunata, Z. Aroma compounds in fresh and dried mango fruit (Mangifera indica L. cv. K ent): Impact of drying on volatile composition. Int. J. Food Sci. Technol. 2016, 51, 789–800. [Google Scholar] [CrossRef]
  39. Li, L.; Yi, P.; Sun, J.; Tang, J.; Liu, G.; Bi, J.; Teng, J.; Hu, M.; Yuan, F.; He, X.; et al. Genome-wide transcriptome analysis uncovers gene networks regulating fruit quality and volatile compounds in mango cultivar ‘Tainong’ during postharvest. Food Res. Int. 2023, 165, 112531. [Google Scholar] [CrossRef]
  40. Xie, H.; Meng, L.; Guo, Y.; Xiao, H.; Jiang, L.; Zhang, Z.; Song, H.; Shi, X. Effects of Volatile Flavour Compound Variations on the Varying Aroma of Mangoes ‘Tainong’ and ‘Hongyu’ during Storage. Molecules 2023, 28, 3693. [Google Scholar] [CrossRef] [PubMed]
  41. Christmann, J.; Rohn, S.; Weller, P. gc-ims-tools—A new Python package for chemometric analysis of GC–IMS data. Food Chem. 2022, 224, 133476. [Google Scholar] [CrossRef]
  42. Parastar, H.; Christmann, J.; Weller, P. Automated 2D peak detection in gas chromatography-ion mobility spectrometry through persistent homology. Anal. Chim. Acta 2024, 1289, 342204. [Google Scholar] [CrossRef]
  43. Capitain, C.C.; Zischka, M.; Sirkeci, C.; Weller, P. Evaluation of IMS drift tube temperature on the peak shape of high boiling fragrance compounds towards allergen detection in complex cosmetic products and essential oils. Talanta 2023, 257, 124397. [Google Scholar] [CrossRef]
  44. D’Orazio, G.; Fanali, C.; Asensio-Ramos, M.; Fanali, S. Chiral separations in food analysis. TrAC Trends Anal. Chem. 2017, 96, 151–171. [Google Scholar] [CrossRef]
  45. Christmann, J.; Rohn, S.; Weller, P. Finding features—Variable extraction strategies for dimensionality reduction and marker compounds identification in GC-IMS data. Food Res. Int. 2022, 161, 111779. [Google Scholar] [CrossRef] [PubMed]
  46. Kulkarni, R.; Chidley, H.; Deshpande, A.; Schmidt, A.; Pujari, K.; Giri, A.; Gershenzon, J.; Gupta, V. An oxidoreductase from ‘Alphonso’ mango catalyzing biosynthesis of furaneol and reduction of reactive carbonyls. Springerplus 2013, 2, 494. [Google Scholar] [CrossRef] [PubMed]
  47. Kallio, H.P. Historical Review on the Identification of Mesifurane, 2,5-Dimethyl-4-methoxy-3(2 H)-furanone, and Its Occurrence in Berries and Fruits. J. Agric. Food Chem. 2018, 66, 2553–2560. [Google Scholar] [CrossRef] [PubMed]
  48. Zhang, W.; Zhu, G.; Zhu, G. The imitation and creation of a mango flavor. Food Sci. Technol. 2022, 42, e34622. [Google Scholar] [CrossRef]
  49. Surburg, H.; Panten, J. Common Fragrance and Flavor Materials: Preparation, Properties and Uses, 6th ed.; Wiley-VCH: Weinheim, Germany, 2016; ISBN 978-3-527-69317-7. [Google Scholar]
  50. Burdock, G.A.; Fenaroli, G. Fenaroli’s Handbook of Flavor Ingredients, 6th ed.; CRC Press/Taylor & Francis Group: Boca Raton, FL, USA, 2010; ISBN 9780429150838. [Google Scholar]
Figure 1. THS−GC−MS−IMS setup and flow directions with schematic visualization of multiple-injection trapped-headspace sampling.
Chemosensors 12 00165 g001
Figure 2. Exemplary visualization of a ‘Totapuri’ mango sample and the simultaneous sample data of MS (a) and IMS (b) with selected peaks. The peaks are ethyl acetate (1), α-pinene (2), ethyl butyrate (3), β-myrcene (4), D-limonene (5), trans-β-ocimene (6), acetic acid (7), nonanal (8), α-terpineol (9), and β-caryophyllene (10). Dimers are marked with a “#”.
Chemosensors 12 00165 g002
Figure 3. (a) PCA score plot of PC2 and PC3. The arrow indicates the direction of the loading influence of PC2. (b) PCA loadings of PC2 with selected (MS-) confirmed compounds. The compounds are α-pinene (1), camphene (2), β-pinene (3), β-myrcene (4), α-phellandrene (5), trans-β-ocimene (6), 2-butenoic acid, ethyl ester, (E) (7), β-phellandrene (8), 2-pronanone,1-methoxy (9), 3-penten-2-one (10), 2,5-dimethyl-4-methoxy-3(2H)-furanone (11), α-terpineol (12), α-copaene (13), α-gurjunene (14), β-caryophyllene (15), 1,4,7,-cycloundecatriene, 1,5,9,9-tetramethyl-, Z,Z,Z- (16), and β-selinene (17). Dimers are marked with a “#”.
Chemosensors 12 00165 g003
Figure 4. (a) PCA scatter plot of PC1 and PC2. The arrow indicates the direction of the loading influence of PC1. Concentrates are marked with the rectangle. (b) PCA loadings of PC1 with selected (MS-) confirmed compounds. The compounds are ethanol (1), ethyl acetate (2), α-pinene (3), 3-carene (4), β-phellandrene (5), trans-β-ocimene (6), 2,3-butanedion (7), α-terpinolene (8), acetic acid (9), ethyl-3-hydroxbutyrate (10), and 2,5-dimethyl-4-methoxy-3(2H)-furanone (11). Dimers are marked with a “#”.
Chemosensors 12 00165 g004
Figure 5. HCA dendrogram displaying the distances between the different mango samples.
Chemosensors 12 00165 g005
Table 1. Retention times for IMS and MS, their retention time differences, and the MS match quality of the compounds.
Volatile CompoundRetention Time
IMS [min]
Retention Time MS [min]RT Difference
MS-IMS [min]
MS Match
Quality [%]
Ethyl acetate5.53 ± 0.025.50 ± 0.040.0397
α-pinene10.28 ± 0.0110.23 ± 0.010.0596
Ethyl butyrate10.70 ± 0.0210.66 ± 0.020.0495
β-myrcene18.15 ± 0.0218.12 ± 0.030.0395
D-limonene21.42 ± 0.0121.38 ± 0.010.0495
Trans-β-ocimene23.60 ± 0.0323.56 ± 0.010.0495
Acetic acid30.10 ± 0.0430.05 ± 0.050.0595
Nonanal34.11 ± 0.0234.02 ± 0.010.0795
α-terpineol36.06 ± 0.0336.01 ± 0.010.0595
β-caryophyllene38.51 ± 0.0138.36 ± 0.010.1596
Table 2. Compounds detected in the different cultivars; x: detected both in IMS and QMS; IMS: detected in IMS only; QMS: detected in MS only; n.d.: not detected.
Mango Cultivar
No.Volatile CompoundAlphonsoTotapuriCriolloTommyKent
1Ethanolxxxxx
2Ethyl acetatexxxxx
3UnidentifiedIMS onlyIMS onlyIMS onlyIMS onlyIMS only
4Ethylcyclohexanexxxx.x
5Ethyl propanoatexx
(Pulp only)
xx
(Pulp only)
x
6Propyl acetatexx
(Pulp only)
IMS onlyn.d.IMS only
7Methyl butyrateIMS onlyx
(Pulp only)
xx
(Pulp only)
x
8UnidentifiedIMS onlyIMS onlyIMS onlyIMS onlyIMS only
9UnidentifiedIMS onlyIMS onlyIMS onlyIMS onlyIMS only
10α-pinenexxxxx
11Ethyl butyratexx
(Pulp only)
xxx
12UnidentifiedIMS onlyIMS onlyIMS onlyIMS onlyIMS only
13Camphenexxxxx
142-butenoic acid, methyl ester, (z)-IMS onlyx
(Pulp only)
xx
(Pulp only)
x
15Butyl acetateIMS onlyxxxx
16UnidentifiedIMS onlyIMS onlyIMS onlyIMS onlyIMS only
17β-pinenexxxxn.d.
181-butanolxx
(Pulp only)
xxx
19Isovaleraldehydxxxxx
20Isobutanolxx
(Pulp only)
xxIMS only
21Isobutyraldehydexxxxx
UnidentifiedIMS onlyn.d.n.d.n.d.IMS only
22Pentanal xxxxx
23Isopentyl alcoholxx
(Pulp only)
xxx
243-carenen.d.n.d.xxx
25Ethyl cyclopropancarboxylaten.d.x
(Pulp only)
xxx
26β-myrcenexxxxx
27α-phellandreneIMS onlyxxxx
282-butanonexxxxx
29α-terpineneIMS onlyxxxx
30Isobutyl butyrateIMS onlyx
(Pulp only)
n.d.n.d.n.d.
31D-limonenexxxxx
32UnidentifiedIMS onlyIMS onlyIMS onlyIMS onlyIMS only
332-butenoic acid, ethyl ester, (e)n.d.x
(Pulp only)
xxx
34β-phellandrenen.d.xxxx
35Trans-β-ocimenexxxn.d.n.d.
364-carenen.d.n.d.xxx
372,3-butanedionxx
(Conc. only)
xxx
38Cis-β-ocimenexxxn.d.n.d.
39Butyl butyrateIMS onlyx
(Pulp only)
xxx
40α-terpinolenen.d.xxxx
41Ethyl hexanoaten.d.n.d.xxn.d.
422-pronanone,1-methoxyxn.d.xn.d.IMS only.
432-methylbutyl butyraten.d.xxn.d.n.d.
44Isoamyl butyratexx
(Pulp only)
xxx
453-penten-2-onexxxxx
46UnidentifiedIMS onlyIMS only IMS onlyIMS onlyIMS only
47UnidentifiedIMS onlyIMS onlyIMS onlyIMS onlyIMS only
48Acetic acidxx xn.d.x
49Alloocimenexxxn.d.n.d.
50Ethyl-3-hydroxbutyratexxxxx
51p-1,3,8-menthatrienexxn.d.n.d.n.d.
52Neo-alloocimenexxxn.d.n.d.
53Nonanalxxxxx
54Furfuralxxxxx
55Ethyl octanoaten.d.x
(Pulp only)
xxx
56Trans-sabinene hydraten.d.xn.d.n.d.n.d.
572,5-dimethyl-4-methoxy-3(2h)-furanonexn.d.n.d.n.d.n.d.
58Acetoinn.d.xxxx
59β-terpineoln.d.xn.dxn.d.
60UnidentifiedIMS onlyIMS onlyIMS onlyIMS onlyIMS only
61α-terpineoln.d.xn.d.xn.d.
62α-copaenen.d.xn.d.xn.d.
63α-gurjujenen.d.xxxx
64UnidentifiedIMS onlyIMS onlyIMS onlyIMS onlyIMS only
65β-caryophyllenexxxxx
66α-guaienen.d.xn.d.n.d.n.d.
67Unidentifiedn.d.IMS onlyIMS onlyIMS onlyIMS only
68Ethyl decanoaten.d.n.d.xn.d.n.d.
691,4,7,-cycloundecatriene, 1,5,9,9-
Tetramethyl-, z,z,z
xxxxx
704,5-di-epi-aristolochenen.d.xxxn.d
71γ-gurjujenen.d.xxn.d.n.d
Eremophilenen.d.n.d.QMS onlyn.d.n.d
72β-selinenen.d.xxx
(Pulp only)
n.d.
73α-selinenen.d.xxx
(Pulp only)
n.d.
74α-bulnesenen.d.xxn.d.n.d.
75δ-cadinenen.d.xxn.d.n.d.
76β-cadinenen.d.QMS onlyn.d.n.d.n.d.
77γ-butyrolactonexn.d.xn.d.n.d.
78γ-hexalactonexn.d.xn.d.IMS only
79Cis-calamenenen.d.n.d.QMS onlyn.d.n.d.
80γ-octalactonexn.d.xn.d.n.d.
81Ethyl dodecanoatexn.d.xn.d.n.d.
Disclaimer/Publisher’s Note: The statements, opinions and data contained in all publications are solely those of the individual author(s) and contributor(s) and not of MDPI and/or the editor(s). MDPI and/or the editor(s) disclaim responsibility for any injury to people or property resulting from any ideas, methods, instructions or products referred to in the content.

