Article

Precise Optical Fiber-Based Ammonia Sensor Using CdS Quantum Dots Decorated with ZnO at Heterointerface

College of Information Science and Engineering, Northeastern University, Shenyang 110819, China
*
Author to whom correspondence should be addressed.
Chemosensors 2024, 12(8), 169; https://doi.org/10.3390/chemosensors12080169
Submission received: 26 July 2024 / Revised: 17 August 2024 / Accepted: 21 August 2024 / Published: 22 August 2024
(This article belongs to the Special Issue Chemical Sensors for Volatile Organic Compound Detection, 2nd Edition)

Abstract

:
Ammonia (NH3) sensing is crucial for environmental safety, necessitating the development of efficient NH3 sensors. In this study, an efficient NH3 sensor based on CdS quantum dots (QDs) decorated with ZnO (CdS/ZnO) covering optical fiber was successfully fabricated. The CdS/ZnO was first synthesized by a hydrothermal method, featuring an n-n heterojunction in the composite material. The optimal sensor with 10 wt% CdS QDs exhibits efficient performance, with a response sensitivity of 0.9 × 10⁻³ dB/ppm and R2 = 0.9858. Additionally, it demonstrates excellent selectivity and repeatability. Mechanistic insights for the NH3 sensor were elucidated through X-ray photoelectron spectroscopy, energy-dispersive X-ray spectroscopy, scanning electron microscopy, and transmission electron microscopy. These results confirm that the enhancement in NH3 sensing performance is attributed to the formation of well-defined n-n heterojunctions. This study contributes to the advancement of gas-sensing technology, particularly in the detection of harmful gases, such as NH3.

1. Introduction

Ammonia (NH3), as a common organic gas, is widely present in agriculture, industry, and daily life [1]. Typically, NH3 is present in the air at 5 ppb [2] and, if exceeding the threshold of 25~35 ppm, may pose a serious threat to human health [3]. Therefore, rapid and accurate monitoring of NH3 concentrations is essential. Traditional NH3 monitoring methods mainly include chemical analysis [4] and chromatography [5], etc. In recent years, driven by advancements in optical fiber sensing technology, optical fiber-based gas sensors have attracted much attention as a new type of gas detection technology [6]. Optical fiber sensors utilize optical fibers as sensing elements to achieve rapid and precise monitoring of gas concentrations by detecting changes in light signals [7]. Compared with traditional gas sensors, optical fiber-based sensors have the advantages of simple structure, strong anti-interference ability, fast response speed, etc., which are suitable for gas detection in complex environments. Optical fiber-based sensors also show great potential for NH3 detection [8,9]. Gas-sensitive materials significantly influence the gas-sensing properties of optical fiber sensors, among which ZnO exhibits excellent performance. As an important semiconductor material, ZnO is widely utilized in optoelectronic and gas-sensitive devices due to its chemical reactivity and thermal stability. Its large exciton binding energy (60 meV) and wide bandgap energy (3.37 eV) make it highly responsive to toxic and combustible gases [10]. Therefore, ZnO-based gas sensors have become a hot topic in research and applications due to their high sensitivity, excellent selectivity, and stability [11].
Researchers have made numerous attempts to further improve the gas-sensing properties of ZnO. The results show that the gas-sensitive properties of ZnO can be effectively improved by doping [12], heterostructure [1], surface functionalization [10], alloying [13], and quantum dot modification [14]. Among them, quantum dots are significant fluorescent dyes characterized by high quantum yield, broad absorption wavelength range, and narrow emission spectrum. Their large surface area notably enhances the sensitivity of optical fiber sensors [15]. For example, an innovative approach was introduced for NO2 measurement, involving the deposition of CdTe quantum dots on a hollow core anti-resonant fiber (HC-ARF), significantly enhancing the sensitivity of NO2 detection [16]. Another advancement showcased an optical fiber sensor for NO, utilizing bare core fiber and CdTe/CdS quantum dots [17]. This sensor, coated with CdTe/CdS core/shell quantum dots on the exposed core fiber, demonstrated rapid response to NO in physiological environments, achieving sensitivity levels down to picomolar concentrations. Moreover, a high-performance optical fiber NH3 sensor was developed based on CdSe quantum dots/SiO2 [18]. This sensor exhibited a linear response range to ammonia vapor concentrations of 0–400 ppm, boasting superior responsiveness, enhanced chemical stability, and complete reversibility.
Therefore, selecting suitable quantum dots can improve sensor performance. Previous studies have found that doping cadmium (Cd) into ZnO can reduce the band gap and enhance the sensitivity of the gas-sensitive material to NH3 [19]. The reduction in bandgap can be ascribed to the incorporation of Cd impurities within the ZnO structure, which leads to the creation of new recombination centers with lower emission energies [20]. When Cd atoms substitute Zn atoms in the ZnO lattice, the low electron affinity of ZnO results in a decrease in free electrons at the conduction band’s bottom and an increase in vacancies, causing the Fermi level to shift to a lower position within the conduction band [21]. Electrons can more easily move from the valence band to the conduction band, increasing the carrier transfer rate and affecting the conductivity, which, in turn, alters the refractive index. CdS, an n-type semiconductor with a narrow band gap, serves as an effective sensitizer, enhancing ZnO’s gas sensitivity [22]. This study achieved the successful synthesis of ZnO nanomaterials and CdS QDs through a cost-effective hydrothermal method. The gas-sensing properties of composite materials with varying CdS quantum dot doping levels were systematically investigated. Notably, the composite material, with ZnO as the substrate, demonstrated exceptional sensing performance for NH3 at a 10 wt% CdS quantum dot doping level. Furthermore, an in-depth exploration into the underlying mechanism of this phenomenon was conducted. The results indicate that the superior sensing performance is attributable to the favorable n-n heterojunction structure of CdS/ZnO. The high doping level of CdS QDs, combined with ZnO, formed a more complex electron transfer pathway, promoting interaction between NH3 molecules and surface electrons, thereby improving the sensor’s responsiveness. Through a detailed investigation of the interaction between CdS QDs and the ZnO substrate, a clearer understanding of the mechanism underlying the enhancement of sensor performance has been attained. This study offers crucial theoretical and experimental foundations for developing novel high-performance gas sensors using ZnO and CdS QDs composites.

2. Materials and Methods

2.1. Materials

Zinc acetate dihydrate (Zn(CH3COO)2·2H2O), citric acid monohydrate (C6H8O7·H2O), NaOH, cadmium nitrate tetrahydrate (Cd(NO3)2·4H2O), sodium sulfide hydrate (Na2S·9H2O), poly vinyl alcohol (PVA), and chitosan. All the received chemicals were used as received without any further purification.

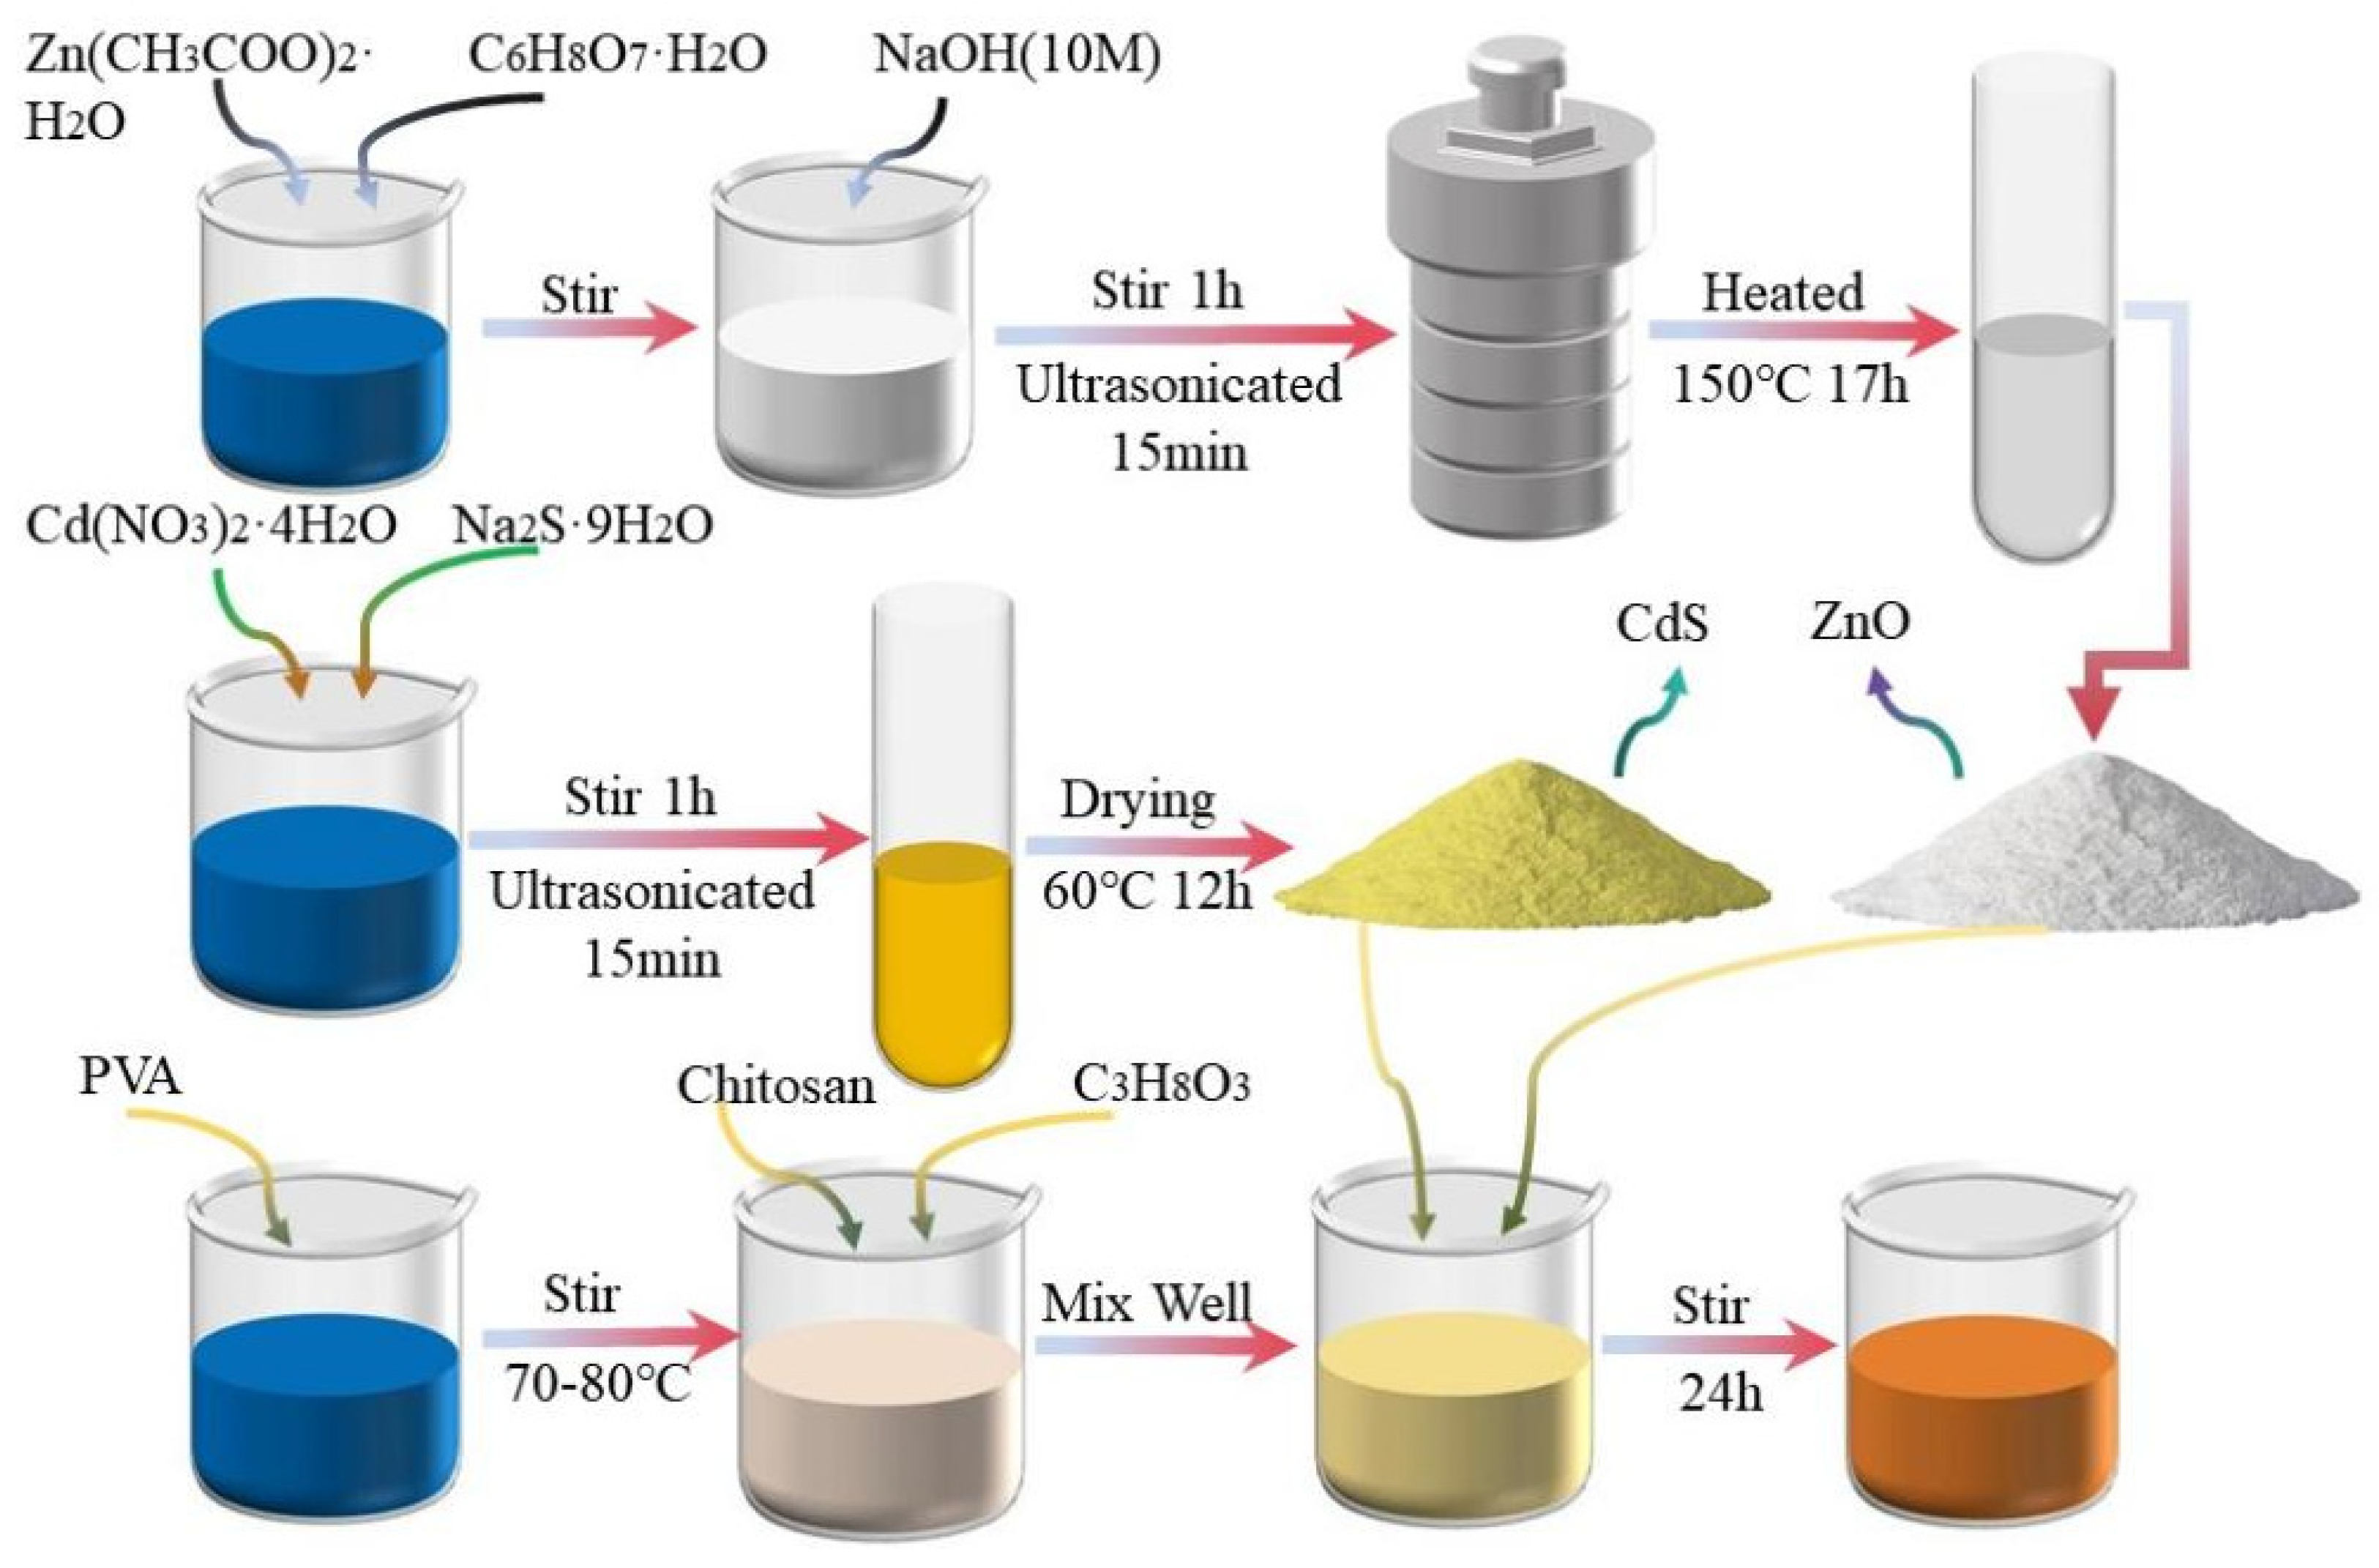
2.2. Preparation of Gas-Sensitive Materials

Figure 1 illustrates the synthesis process of CdS/ZnO-based sensors. ZnO nanostructures were synthesized via hydrothermal methods for cost-effectiveness. Specifically, 0.06 mol of citric acid monohydrate (C6H8O7·H2O) and 0.09 mol of zinc acetate dihydrate (Zn(CH3COO)2·2H2O) were dissolved in deionized water and ethanol, followed by the addition of a 10 M concentration of NaOH solution to adjust the pH to 13. The resulting homogeneous solution was transferred to a high-pressure autoclave equipped with a PTFE liner and heated at a constant temperature of 150 °C for 17 h. Subsequently, the autoclave was allowed to cool naturally to room temperature, yielding a pure ZnO sample (labeled as ZC-0) after washing and drying. CdS QDs were prepared by dissolving 8.3 mmol of cadmium nitrate tetrahydrate (Cd(NO3)2·4H2O) and 2.7 mmol of sodium sulfide hydrate (Na2S·9H2O) in deionized water, followed by centrifugation and drying. Additionally, PVA and chitosan were dissolved in water and an acetic acid solution, respectively, and combined with glycerol to enhance membrane pliability. Ultimately, three sets of sensors were created by adding varying amounts of CdS/ZnO nanoparticles. When the atomic ratio of Zn to Cd was controlled at 100:5 and 100:10, the resulting samples were labeled as ZC-5 and ZC-10, respectively.

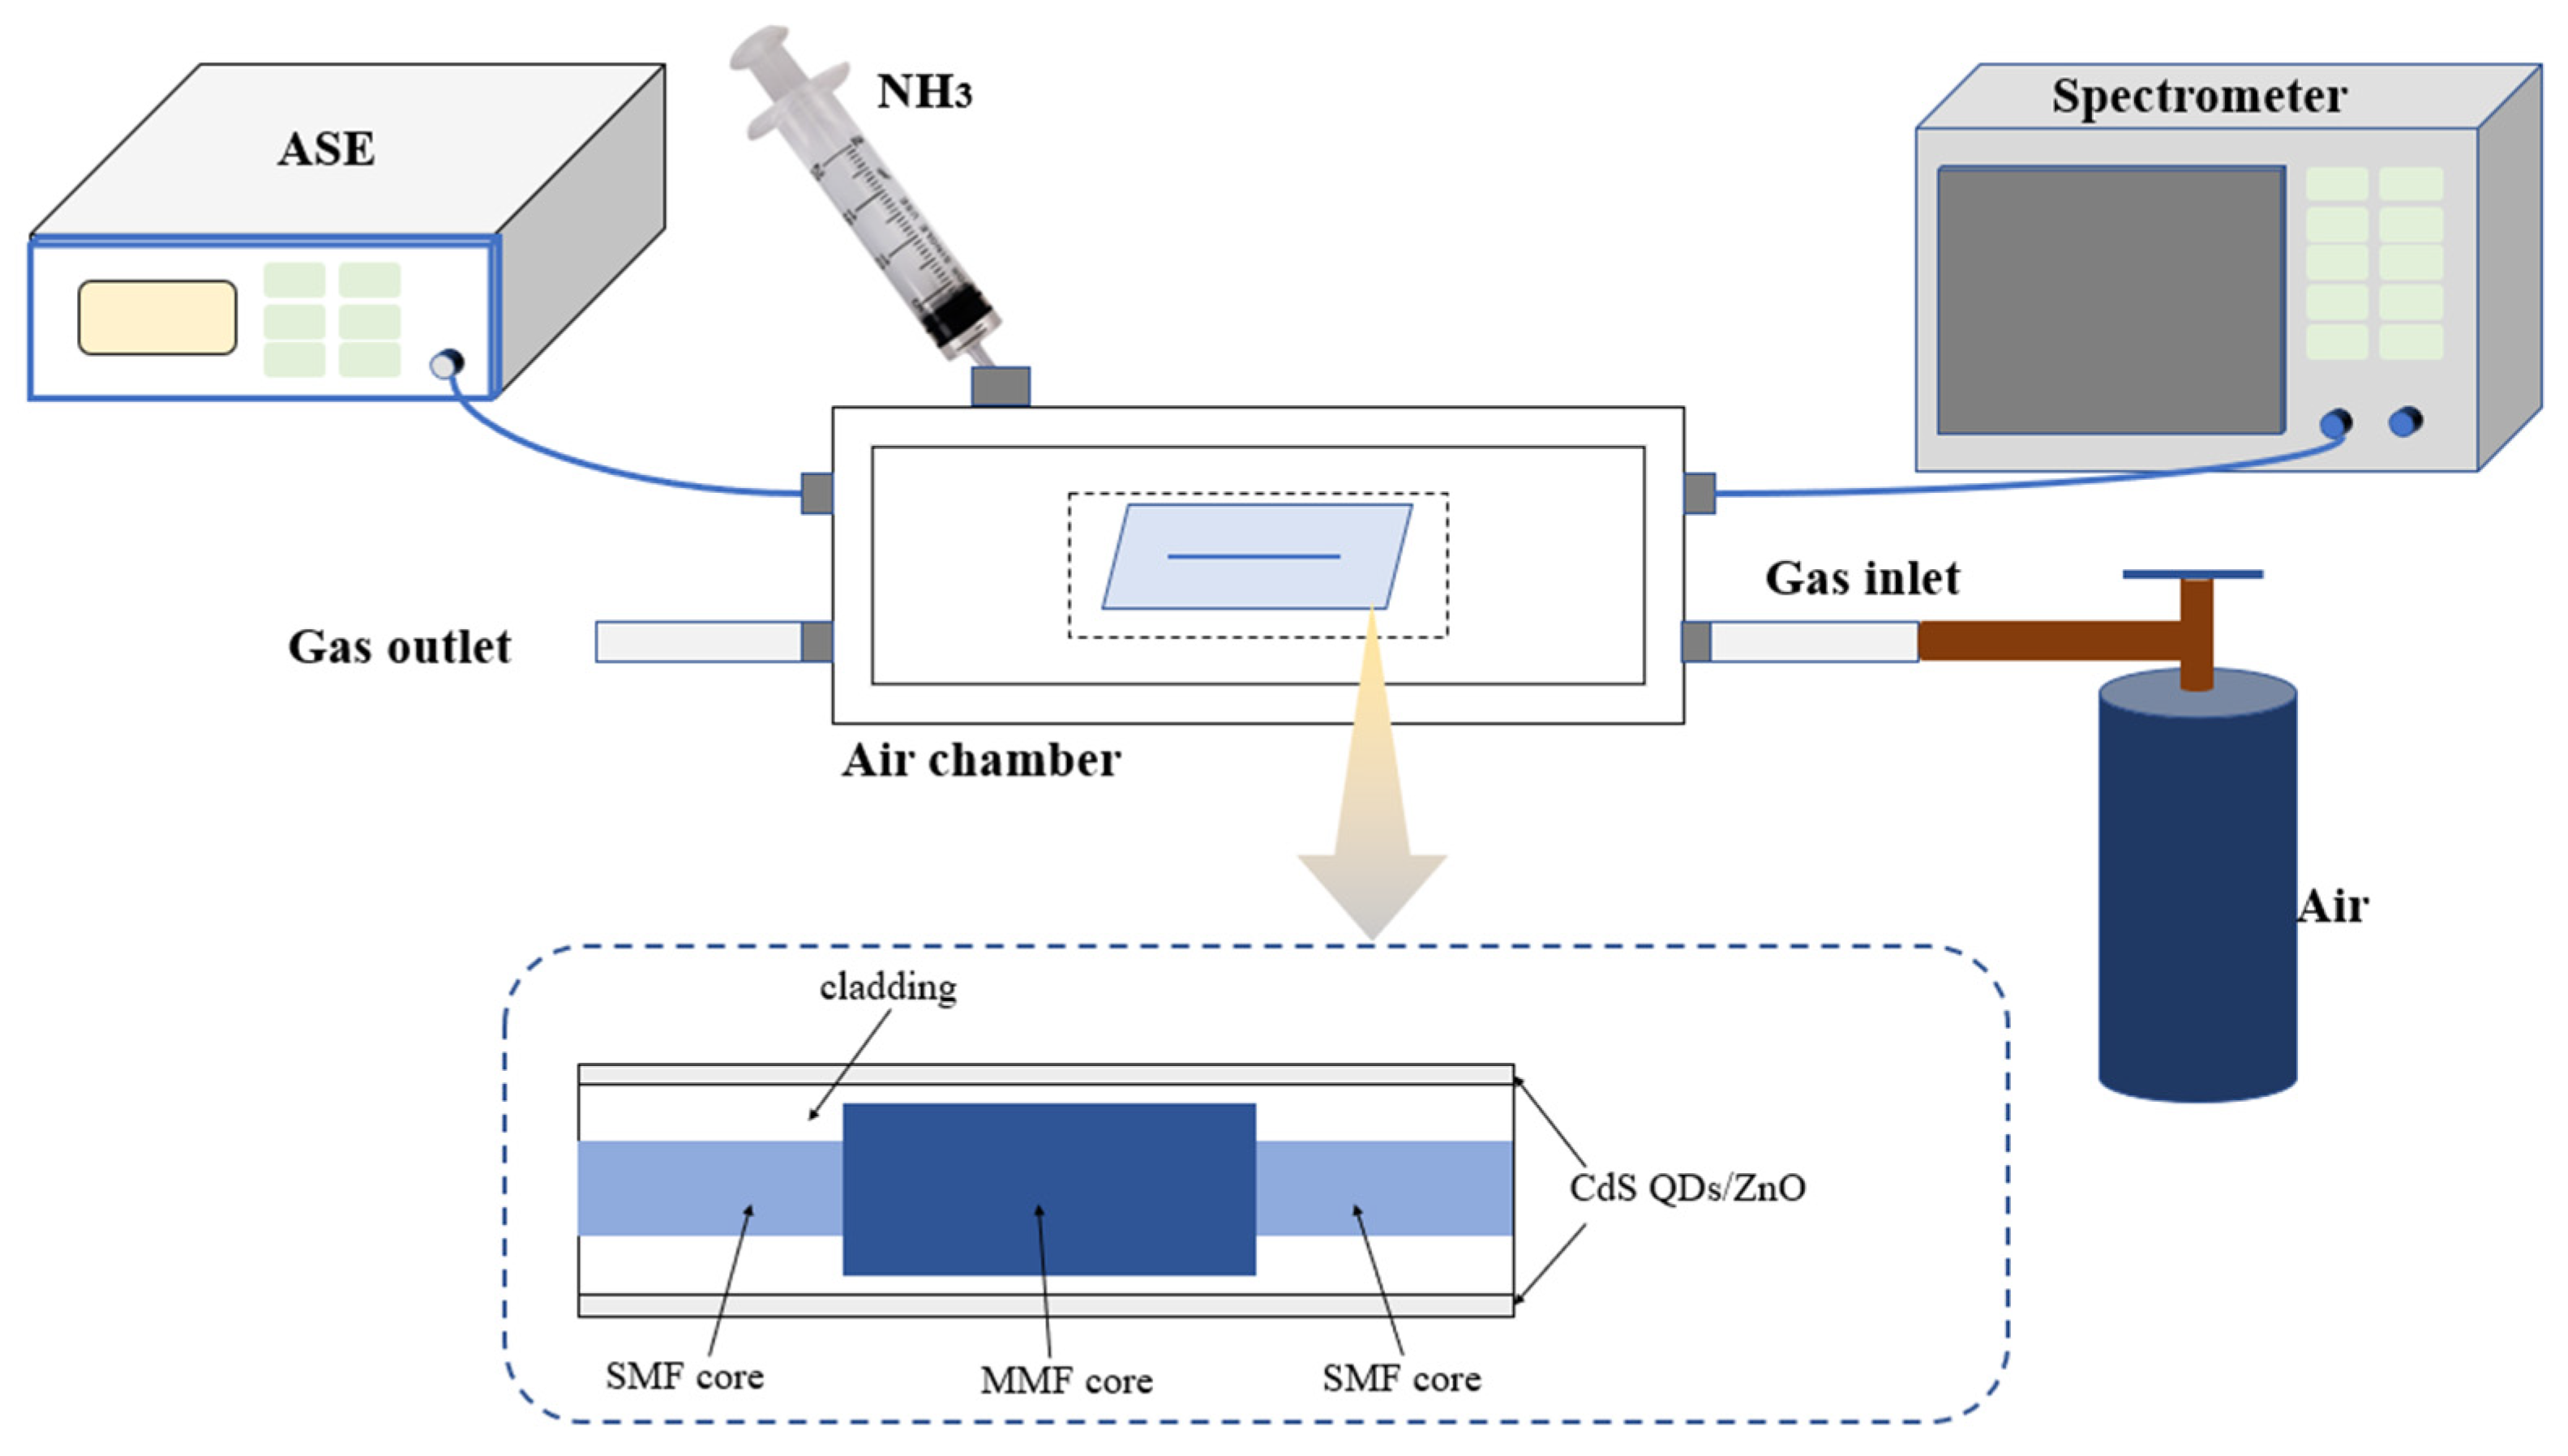
2.3. Construction of Experimental Equipment

Figure 2 demonstrates the construction of the gas test system. The spectrograms were obtained using an Amplified Spontaneous Emission (ASE) broadband light source (model KG-ASE-CL-D-13-FC/APC) with a working wavelength range of 1528–1603 nm and a Yokogawa optical spectrum analyzer (model AQ6370D). The method for determining the concentration is based on the Antoine Equation, an empirical formula used to describe the relationship between the vapor pressure of a pure substance and temperature. For the vapor pressure calculation of ammonia, the Antoine Equation is typically expressed as Equation (1) [23].
l g P = A B C + T
P represents the vapor pressure (usually in mmHg or bar); T represents the temperature (in degrees Celsius); and A, B, and C are the constants of the Antoine Equation, which vary depending on the substance. Using this equation, the vapor pressure of ammonia at a specific temperature can be calculated. Then, based on the volume of the gas chamber, the concentration of ammonia in the chamber can be determined after injecting a certain volume of saturated ammonia vapor. Table 1 shows the Antoine constants for the different volatile gases tested in the experiment.
In this study, single-mode fiber–multimode fiber–single-mode fiber (SMF-MMF-SMF) was used as the sensing structure, and the prepared gas-sensitive material was coated on the sensing area by the drop-coating method. First, the fiber-end face was sheared flat using a fiber optic cutter to prepare for subsequent fusion splicing. After that, a fiber optic fusion splicer was used to fuse the two ends of the MMF to the SMF, and the prepared gas-sensitive materials doped with different nanomaterials were coated to the sensing structures using the drop-coating method, and the prepared optical fiber sensors were placed in a ventilated place to be aged for 24 h in order to reduce the effect of environmental factors during the measurement of the gases.

3. Results and Discussion

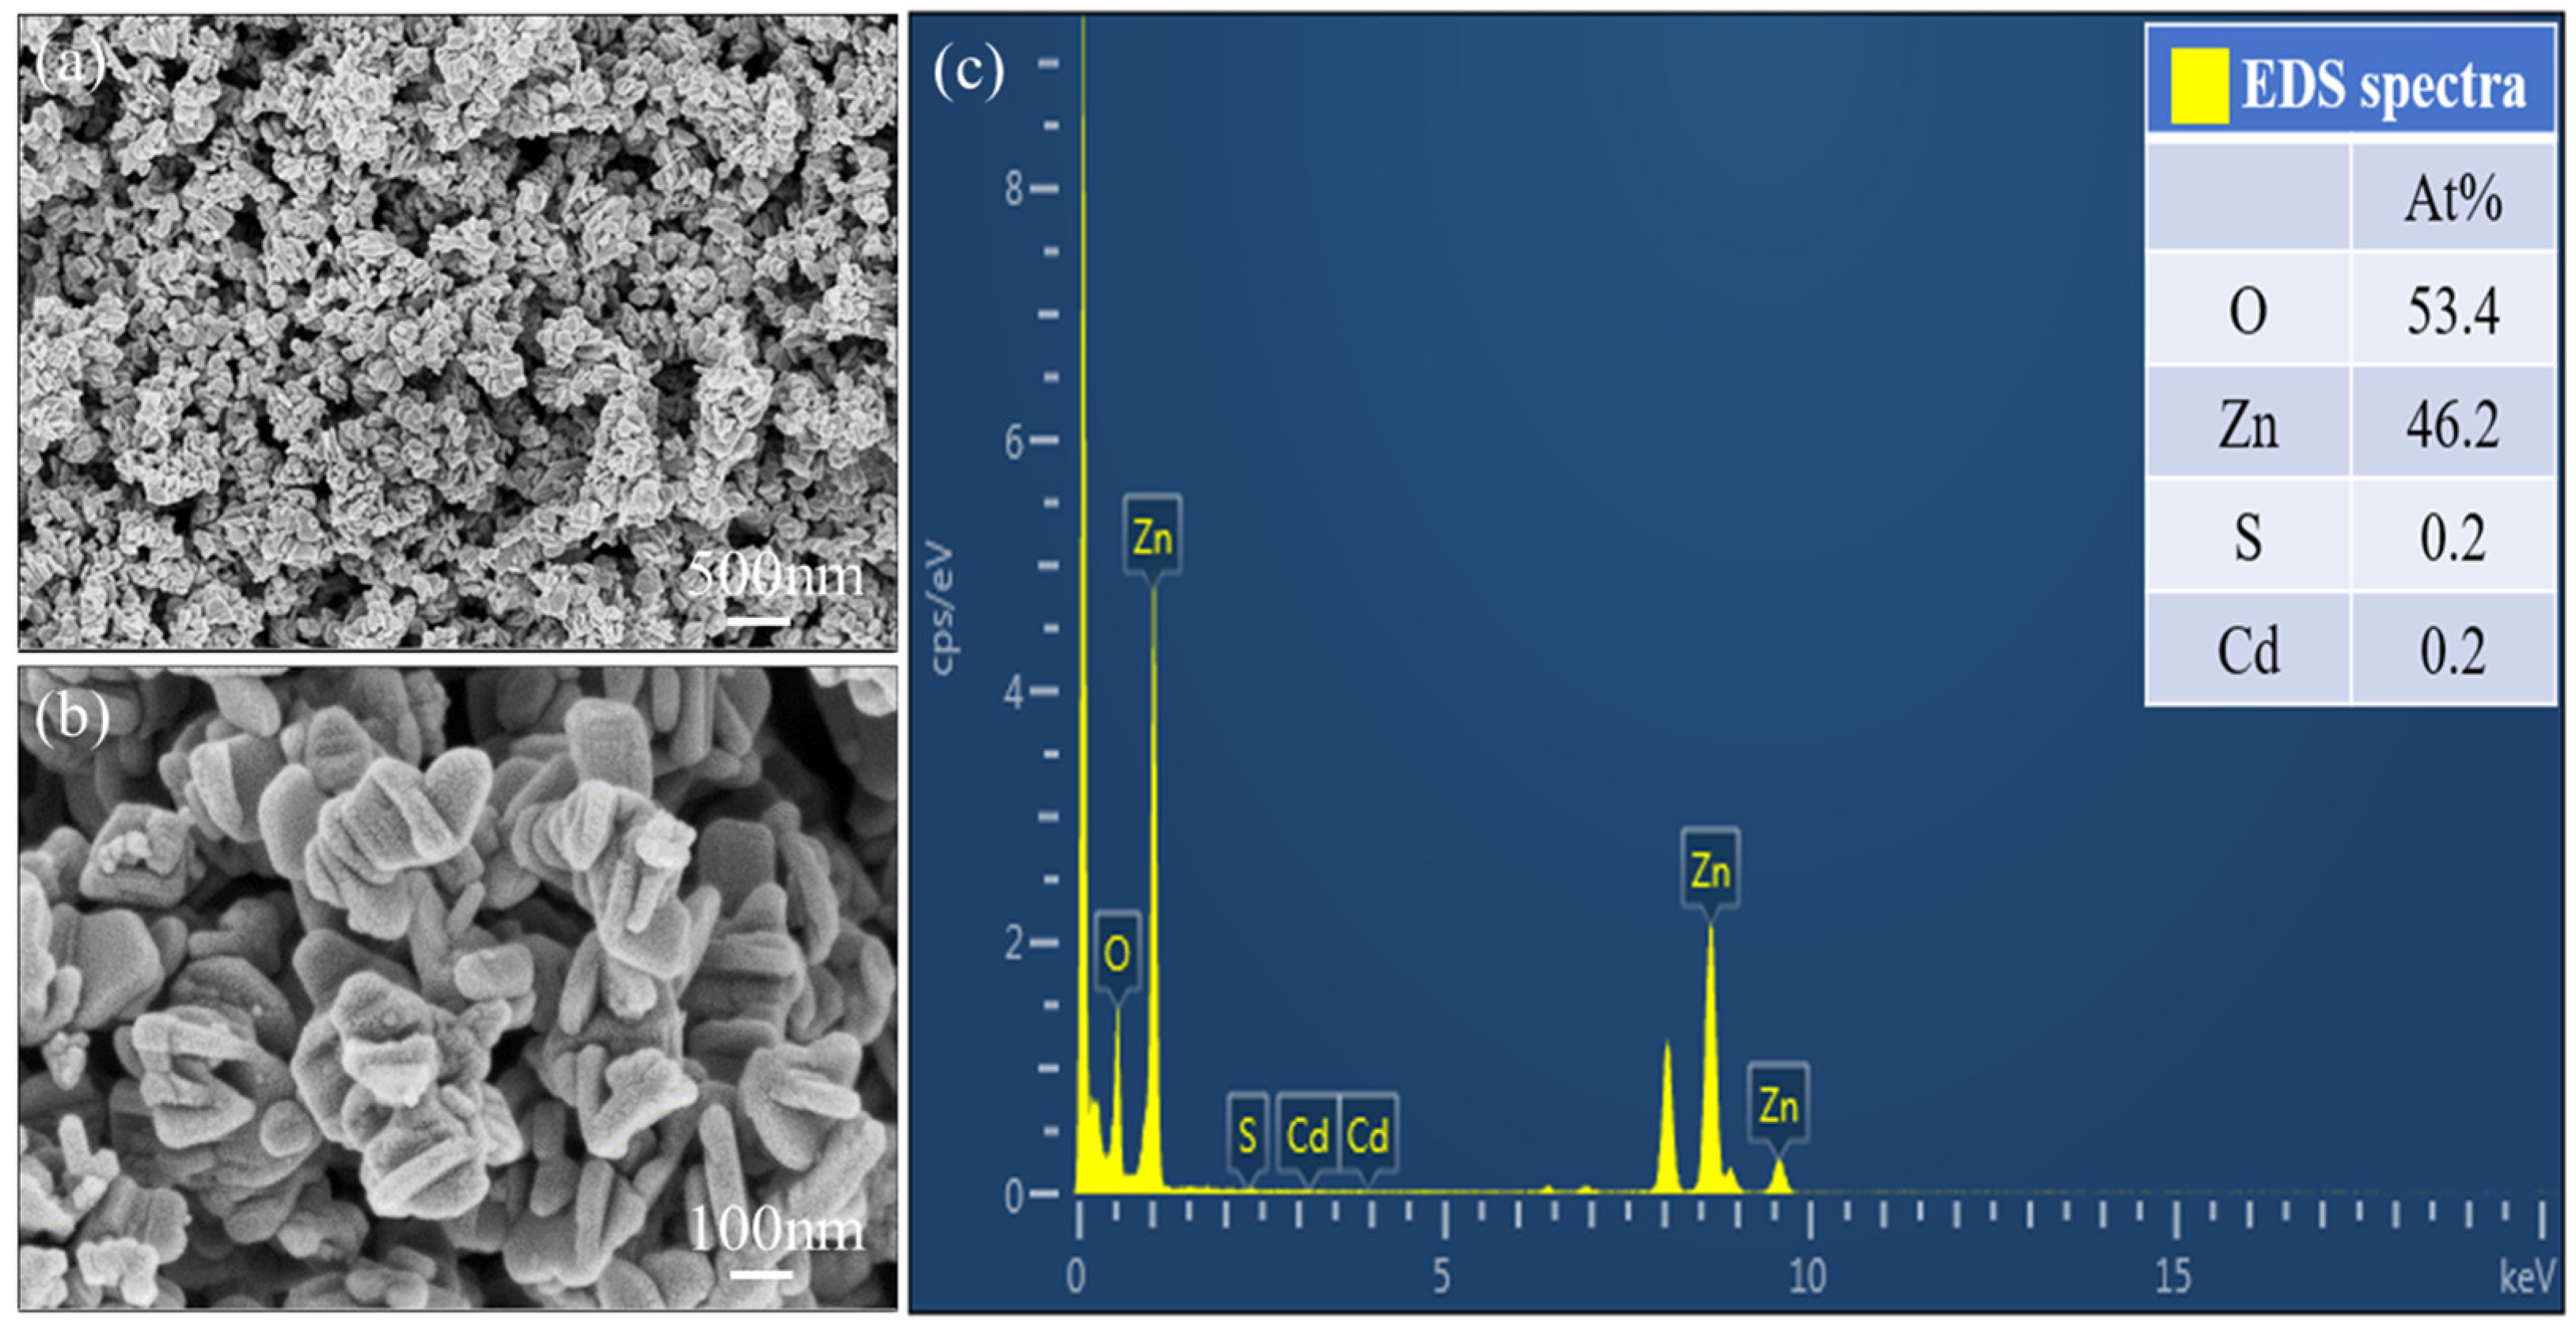
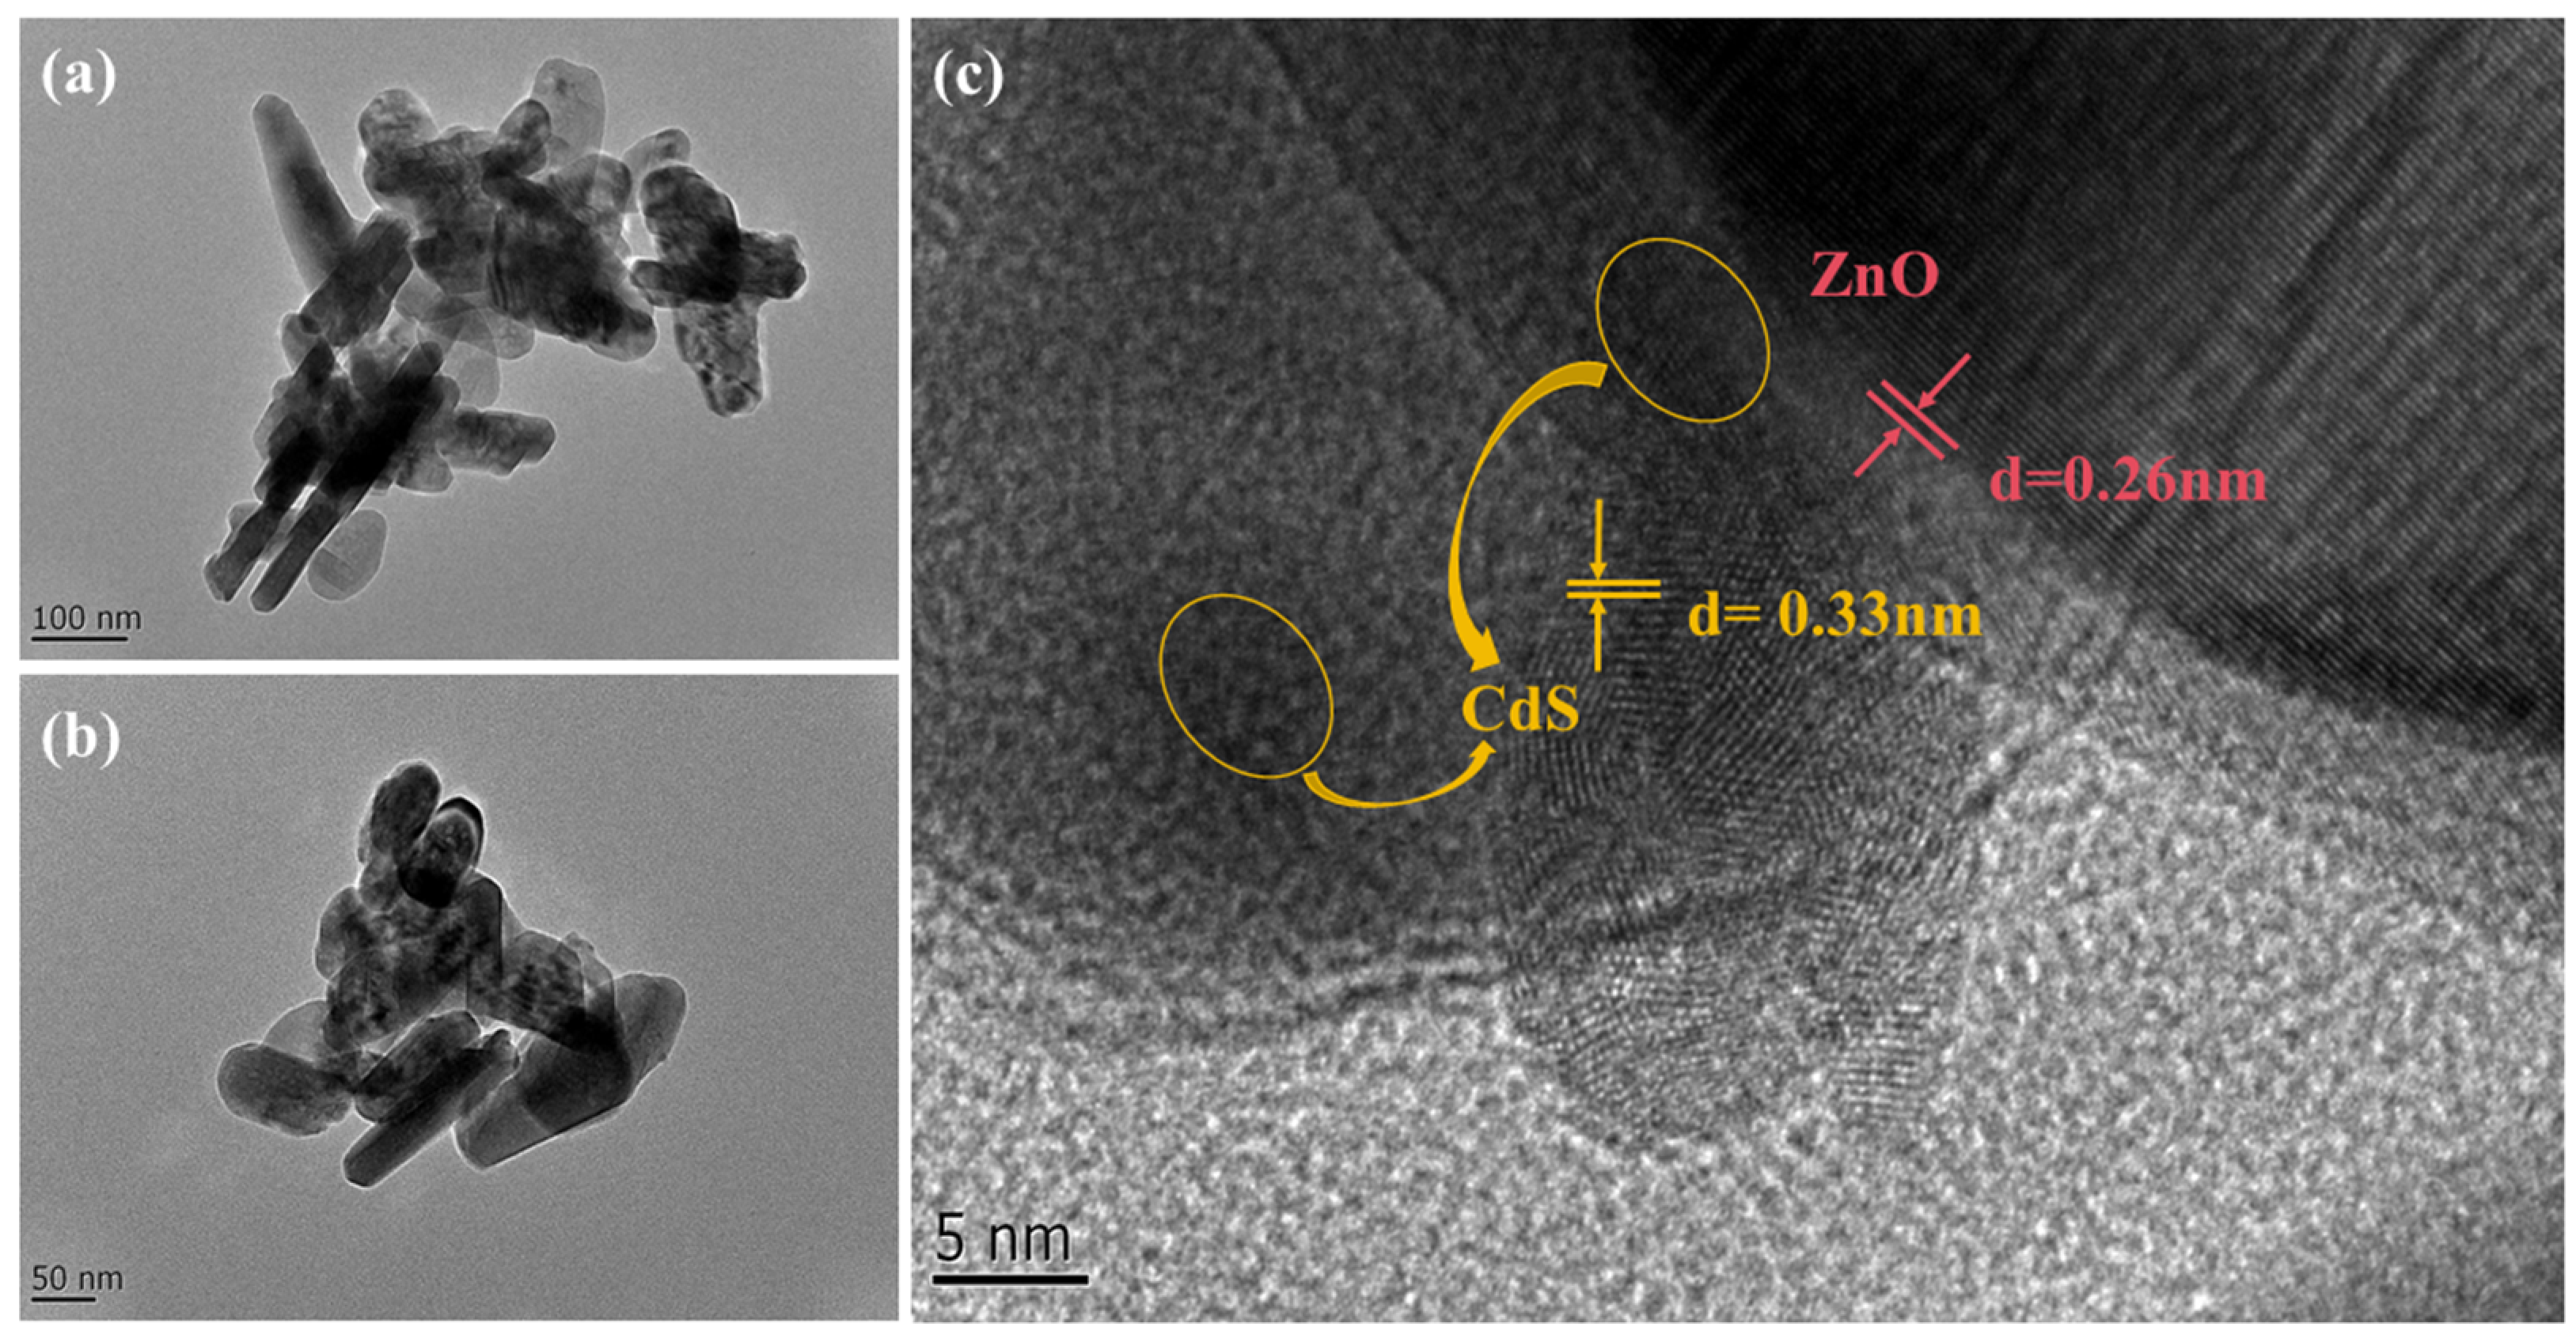
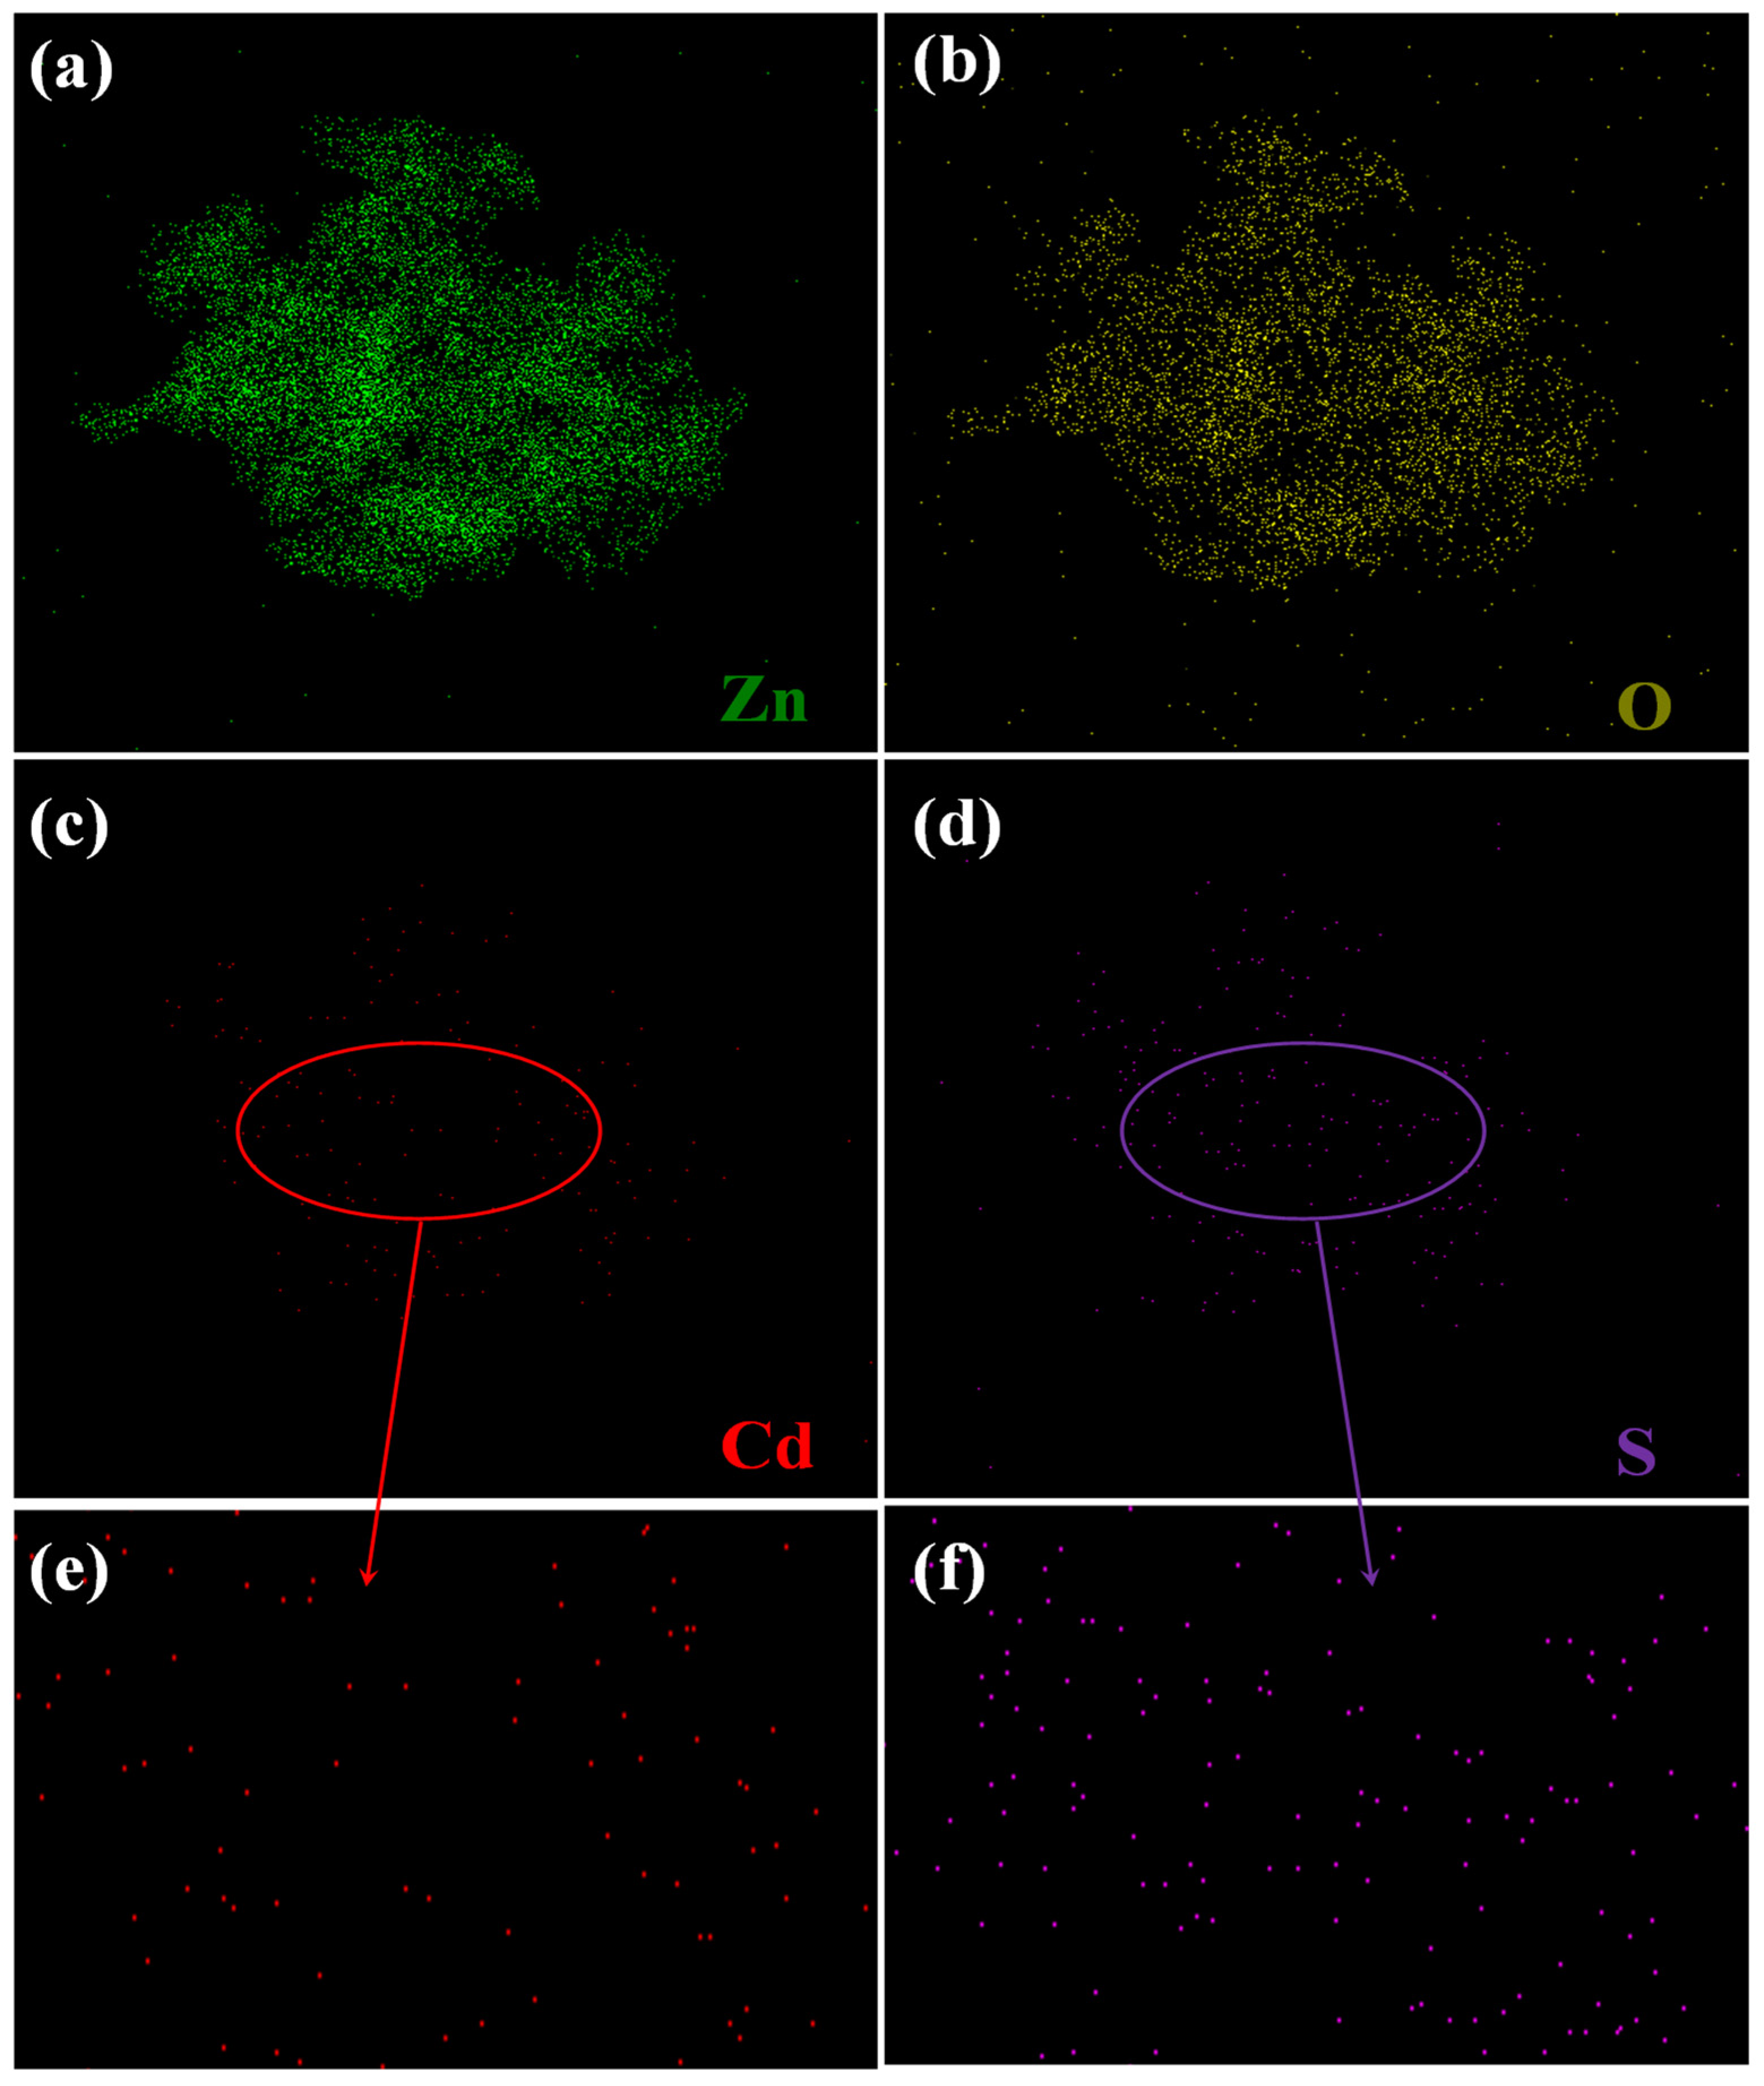
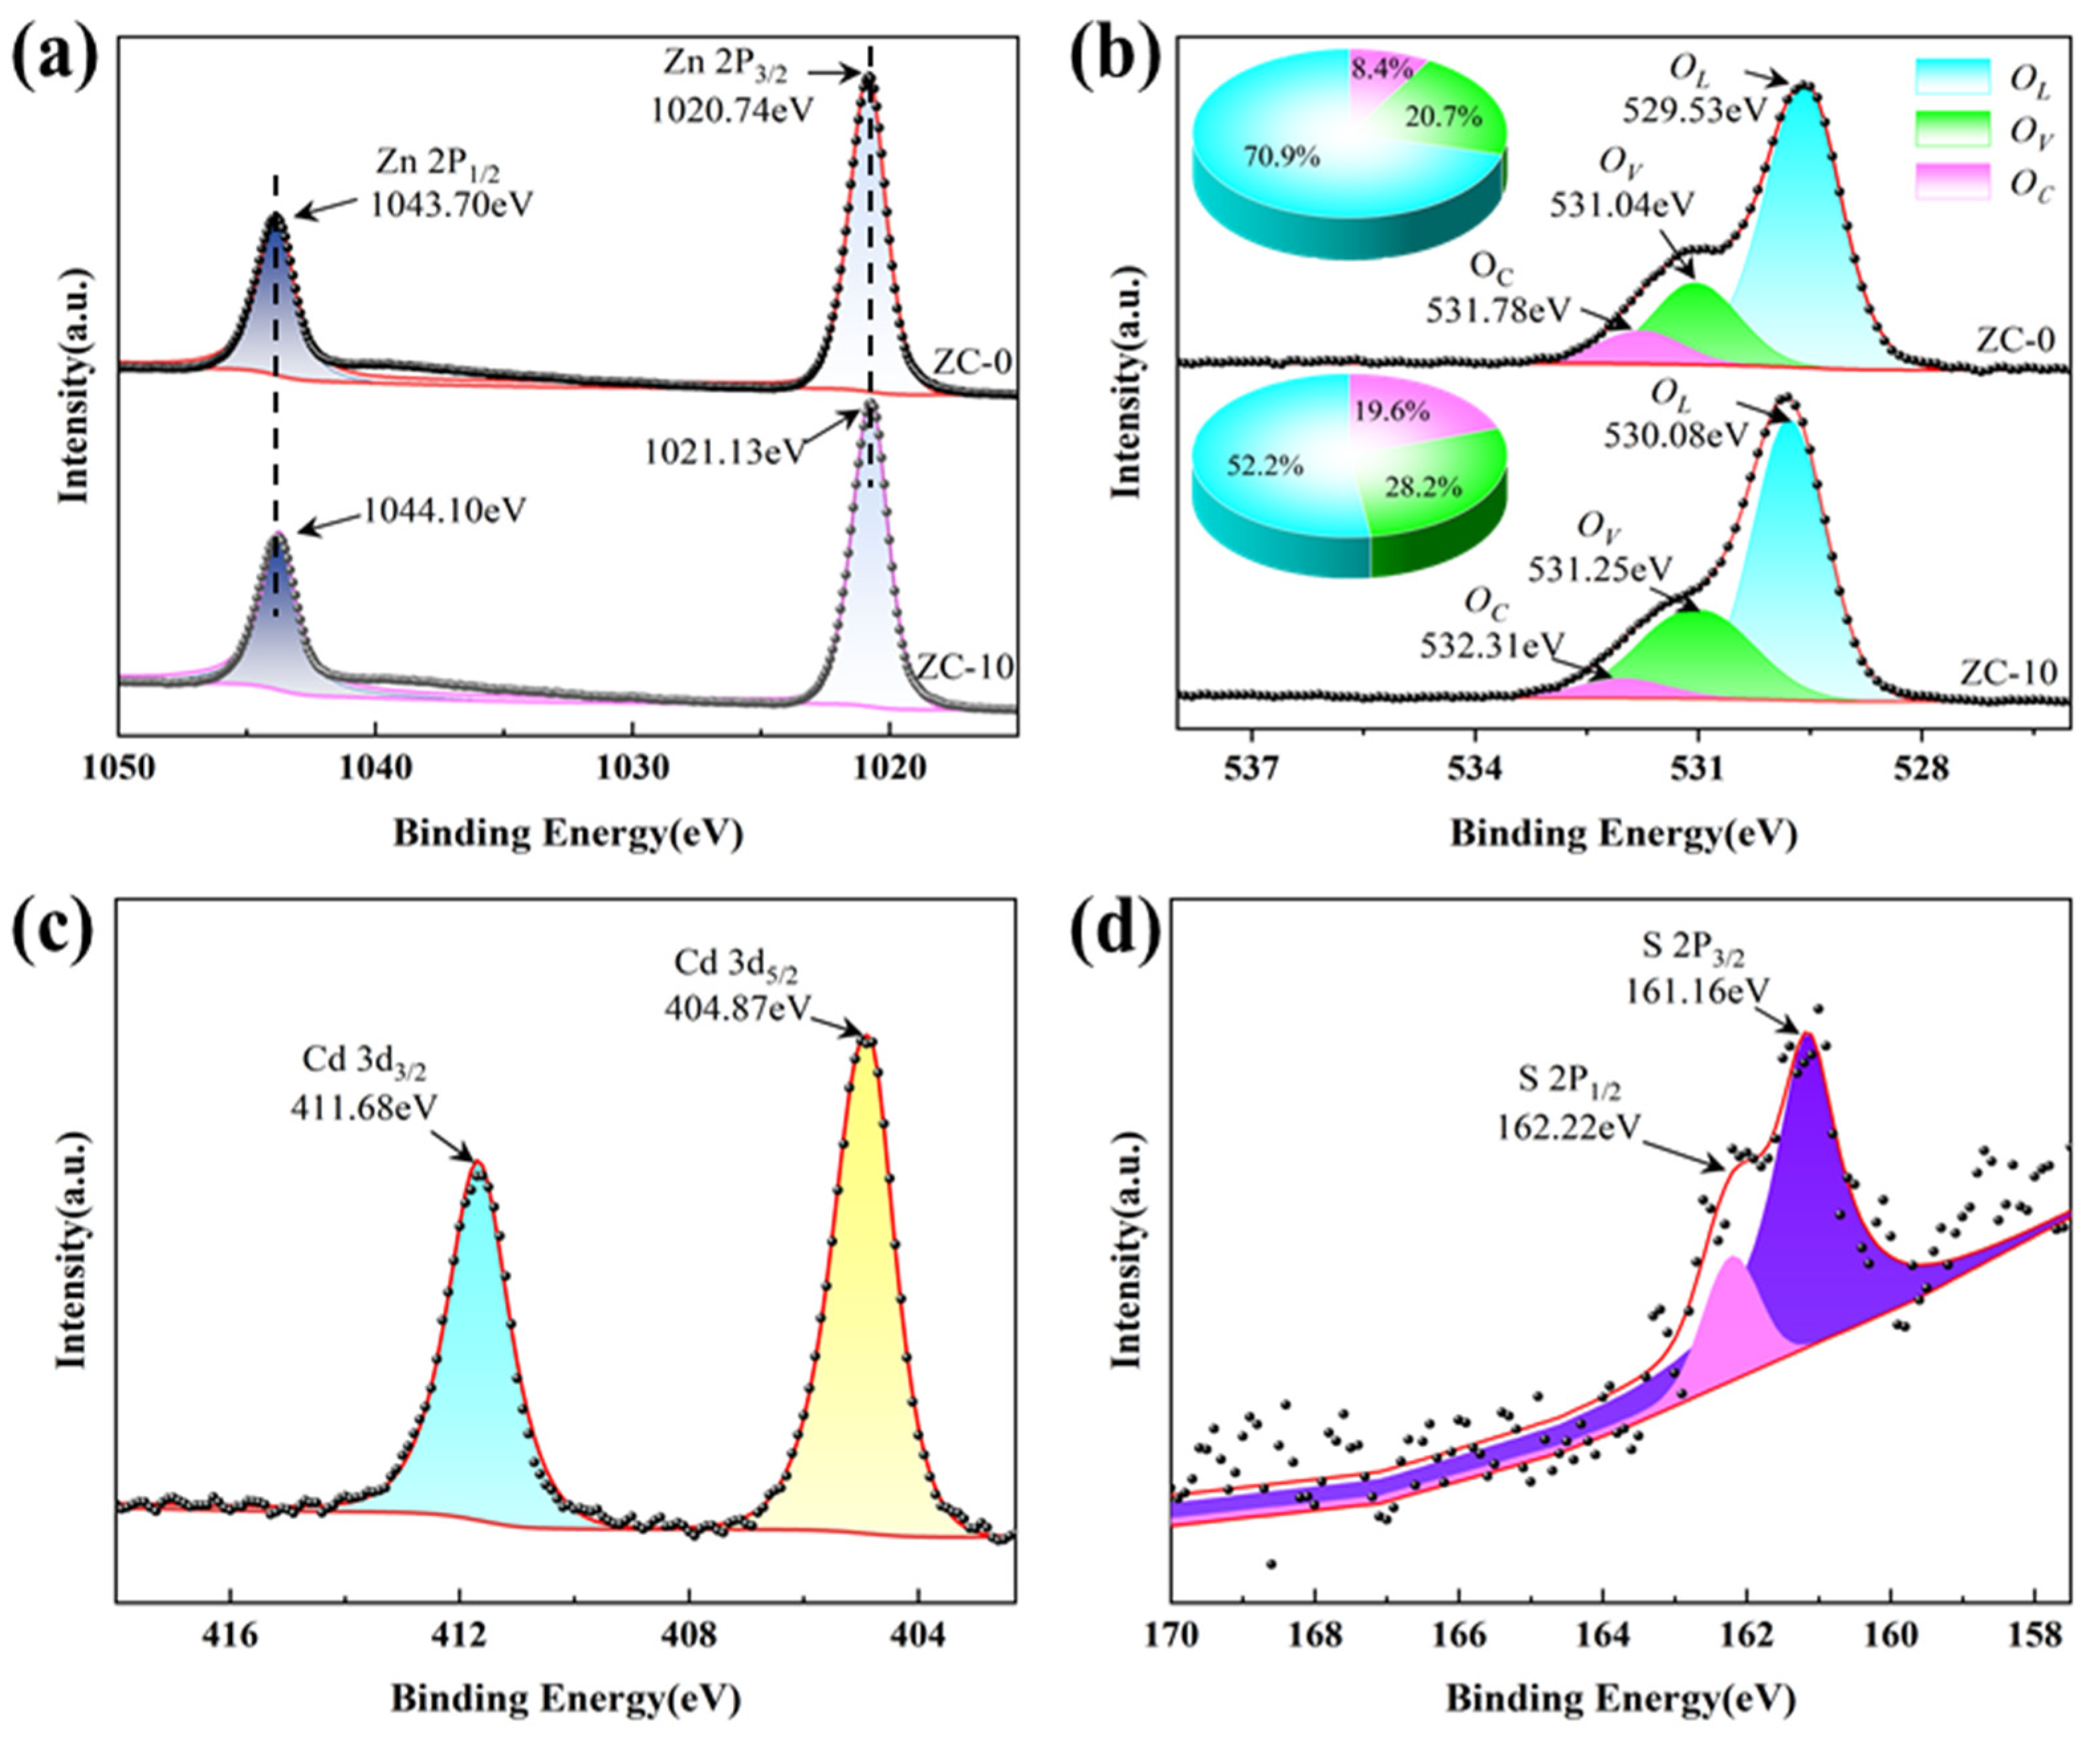
3.1. Materials Characterization

The characterization equipment employed includes scanning electron microscopy (SEM) for morphological analysis, energy-dispersive X-ray spectroscopy (EDS) for elemental mapping, transmission electron microscopy (TEM) and high-resolution transmission electron microscopy (HRTEM) for detailed structural analysis, and X-ray photoelectron spectroscopy (XPS) for surface chemical composition analysis. Scanning electron microscopy (SEM) was utilized to examine the morphology of the prepared materials. The SEM images are shown in Figure 3a,b. The results reveal the overall morphology of the materials at higher magnification. All microcrystals exhibit a unique and regular morphology, with the CdS/ZnO presenting a multi-ridge structure resembling “mountain ridges” that protrude outward, with a total length of approximately 120–200 nanometers. This morphology provides additional chemical reaction sites on both sides, aiding in increasing the specific surface area. Further magnification of the SEM images reveals that these multi-ridge materials are essentially assembled from numerous small secondary nanoscale particles. Energy-dispersive X-ray spectroscopy (EDS) analysis (Figure 3c) confirms the presence of Zn, O, Cd, and S elements in the obtained material, indicating their coexistence. Moreover, transmission electron microscopy (TEM) was utilized to conduct a detailed investigation of the monomer images of the prepared materials, as illustrated in Figure 4a,b. High-resolution transmission electron microscopy (HRTEM) images (Figure 4c) reveal distinct lattice fringes within ZnO, displaying a d-spacing of 0.26 nm. Conversely, the lattice fringes of CdS exhibit a d-spacing of 0.33 nm, suggesting the effective modification of CdS QDs on the multi-ridge ZnO. At the interface, the lattice fringes overlap and deform, corroborating the formation of n-n heterojunctions. The obtained EDS elemental maps (Figure 5a–f) reveal that the CdS QDs are uniformly distributed on ZnO. Due to the relatively low content of Cd and S elements, specific regions in Figure 5c,d were magnified, resulting in Figure 5e,f, respectively, to ensure that the mappings are more visible. The diameter of CdS quantum dots in the figure is all less than 10 nm, meeting the size requirements of quantum dots [24]. The appearance of larger CdS nanoparticles is due to the aggregation of quantum dots, which can be observed from the inconsistent lattice stripe directions.
Additionally, X-ray photoelectron spectroscopy (XPS) analysis was performed on the products. As shown in Figure 6a, the Zn 2P3/2 and Zn 2P1/2 peaks of ZC-0 were detected at 1020.74 eV and 1043.70 eV, respectively. Upon comparison, the corresponding peaks of ZC-10 shifted toward higher binding energies, indicating electron transfer on their surfaces. In the Cd 3d spectrum of CdS/ZnO (Figure 6c), the Cd 3d5/2 peak and Cd 3d3/2 peak were located at 404.87 eV and 411.68 eV, respectively. Additionally, in Figure 6d, peaks corresponding to S 2P3/2 and S 2P1/2 were observed at 161.16 eV and 162.22 eV, respectively. Deconvolution of the O 1s signal in ZC-10 revealed three distinct peaks at 530.08 eV, 531.25 eV, and 532.31 eV, representing surface adsorbed oxygen (OC), surface vacancy oxygen (OV), and lattice oxygen (OL), respectively, as shown in Figure 6b. Similarly, the O 1s signal of ZC-0 was analyzed in the same manner. Notably, the percentage of OV in ZC-10 was 28.19%, higher than the OV content in ZC-0, which was 20.7%. In general, an increased number of OV creates more active sites for gas adsorption and reaction, thereby enhancing the material’s gas-sensing performance.

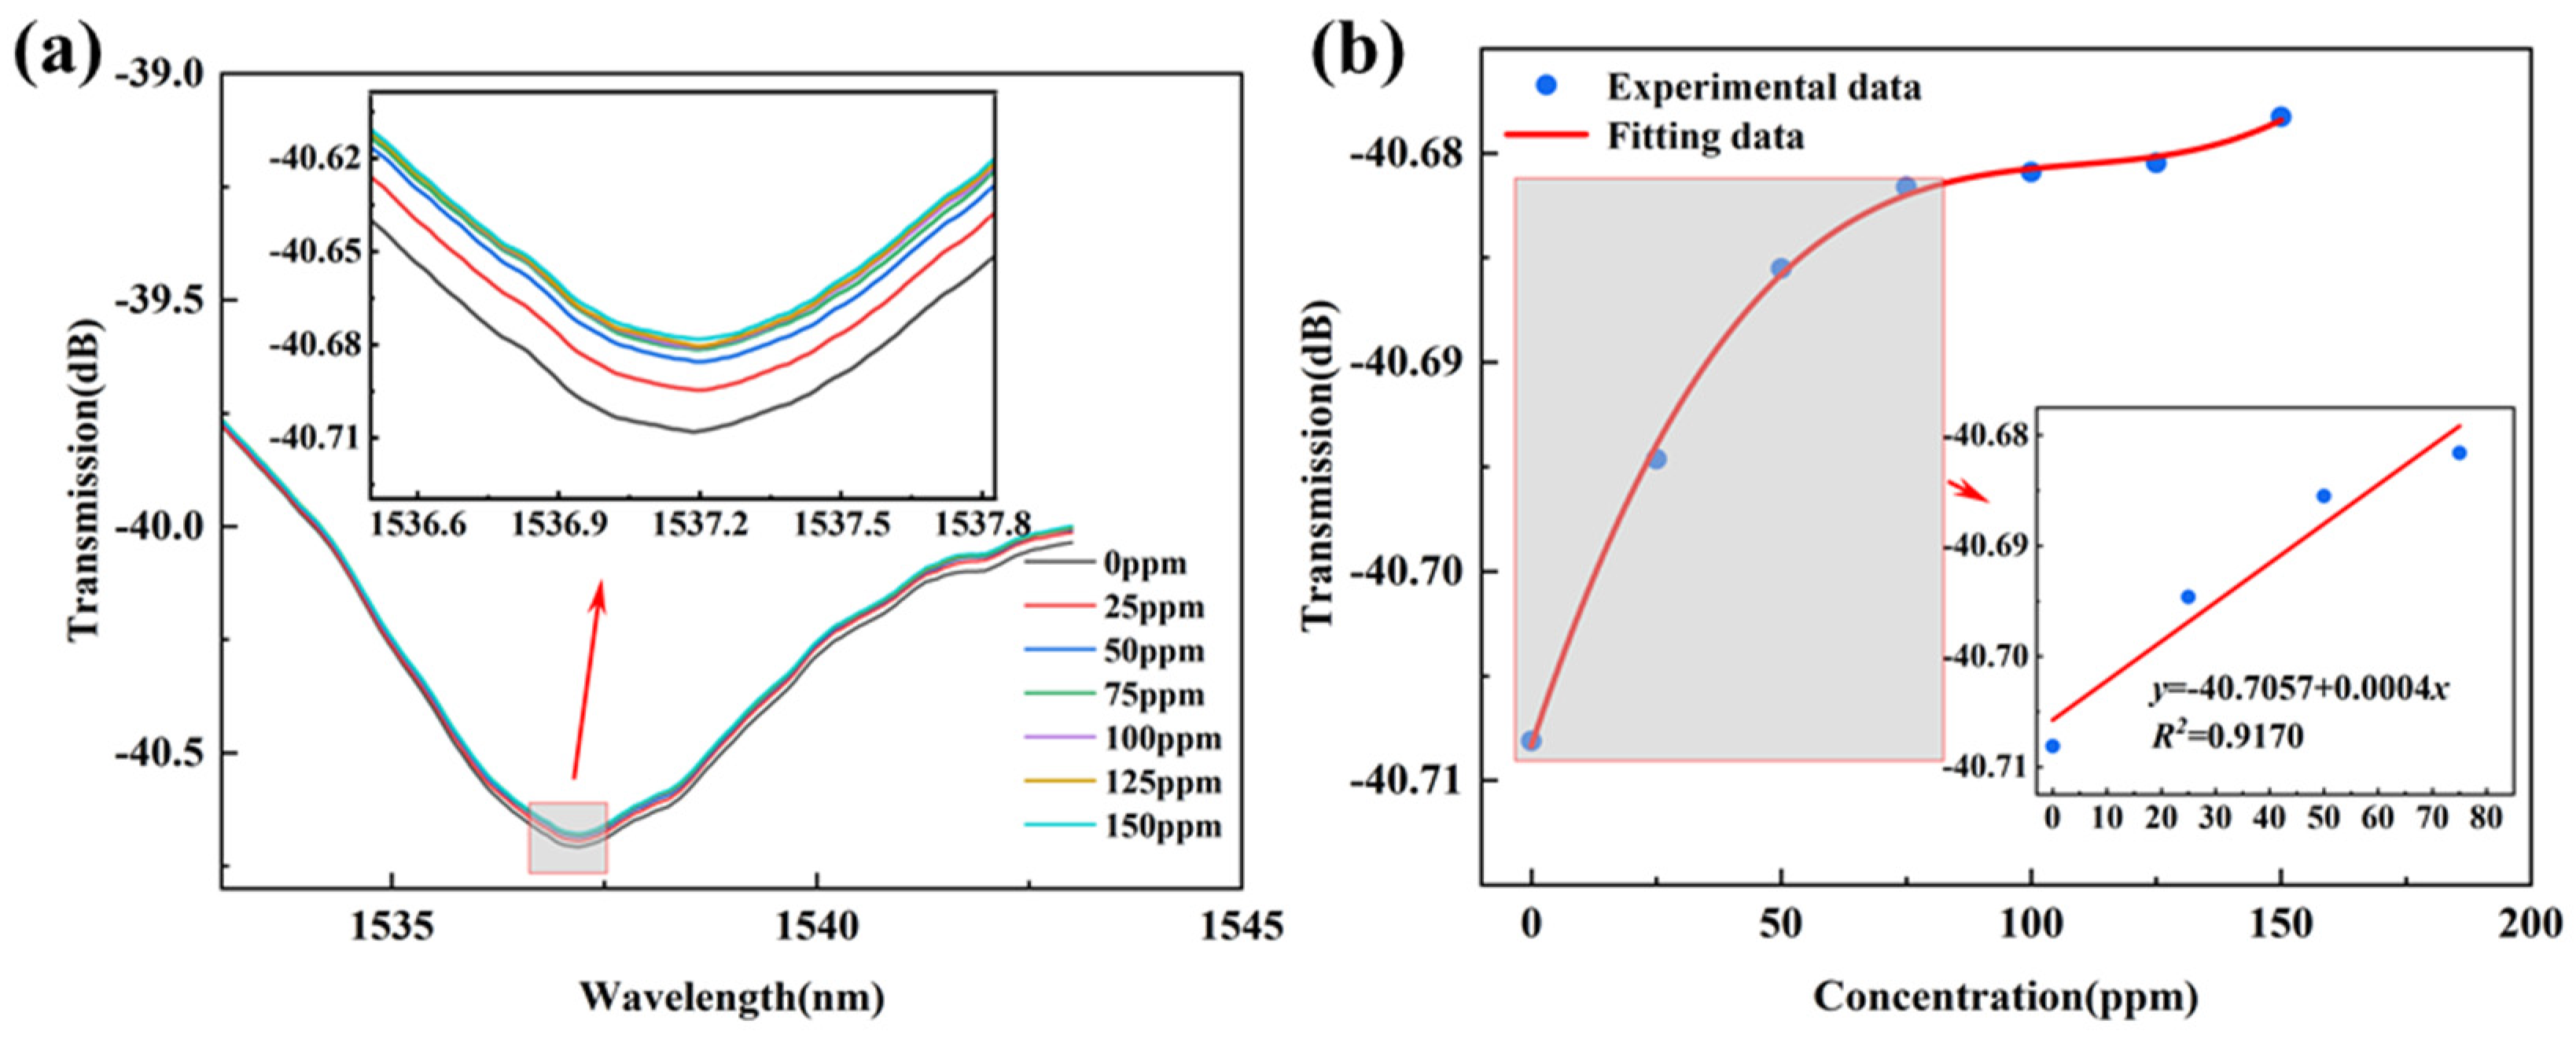
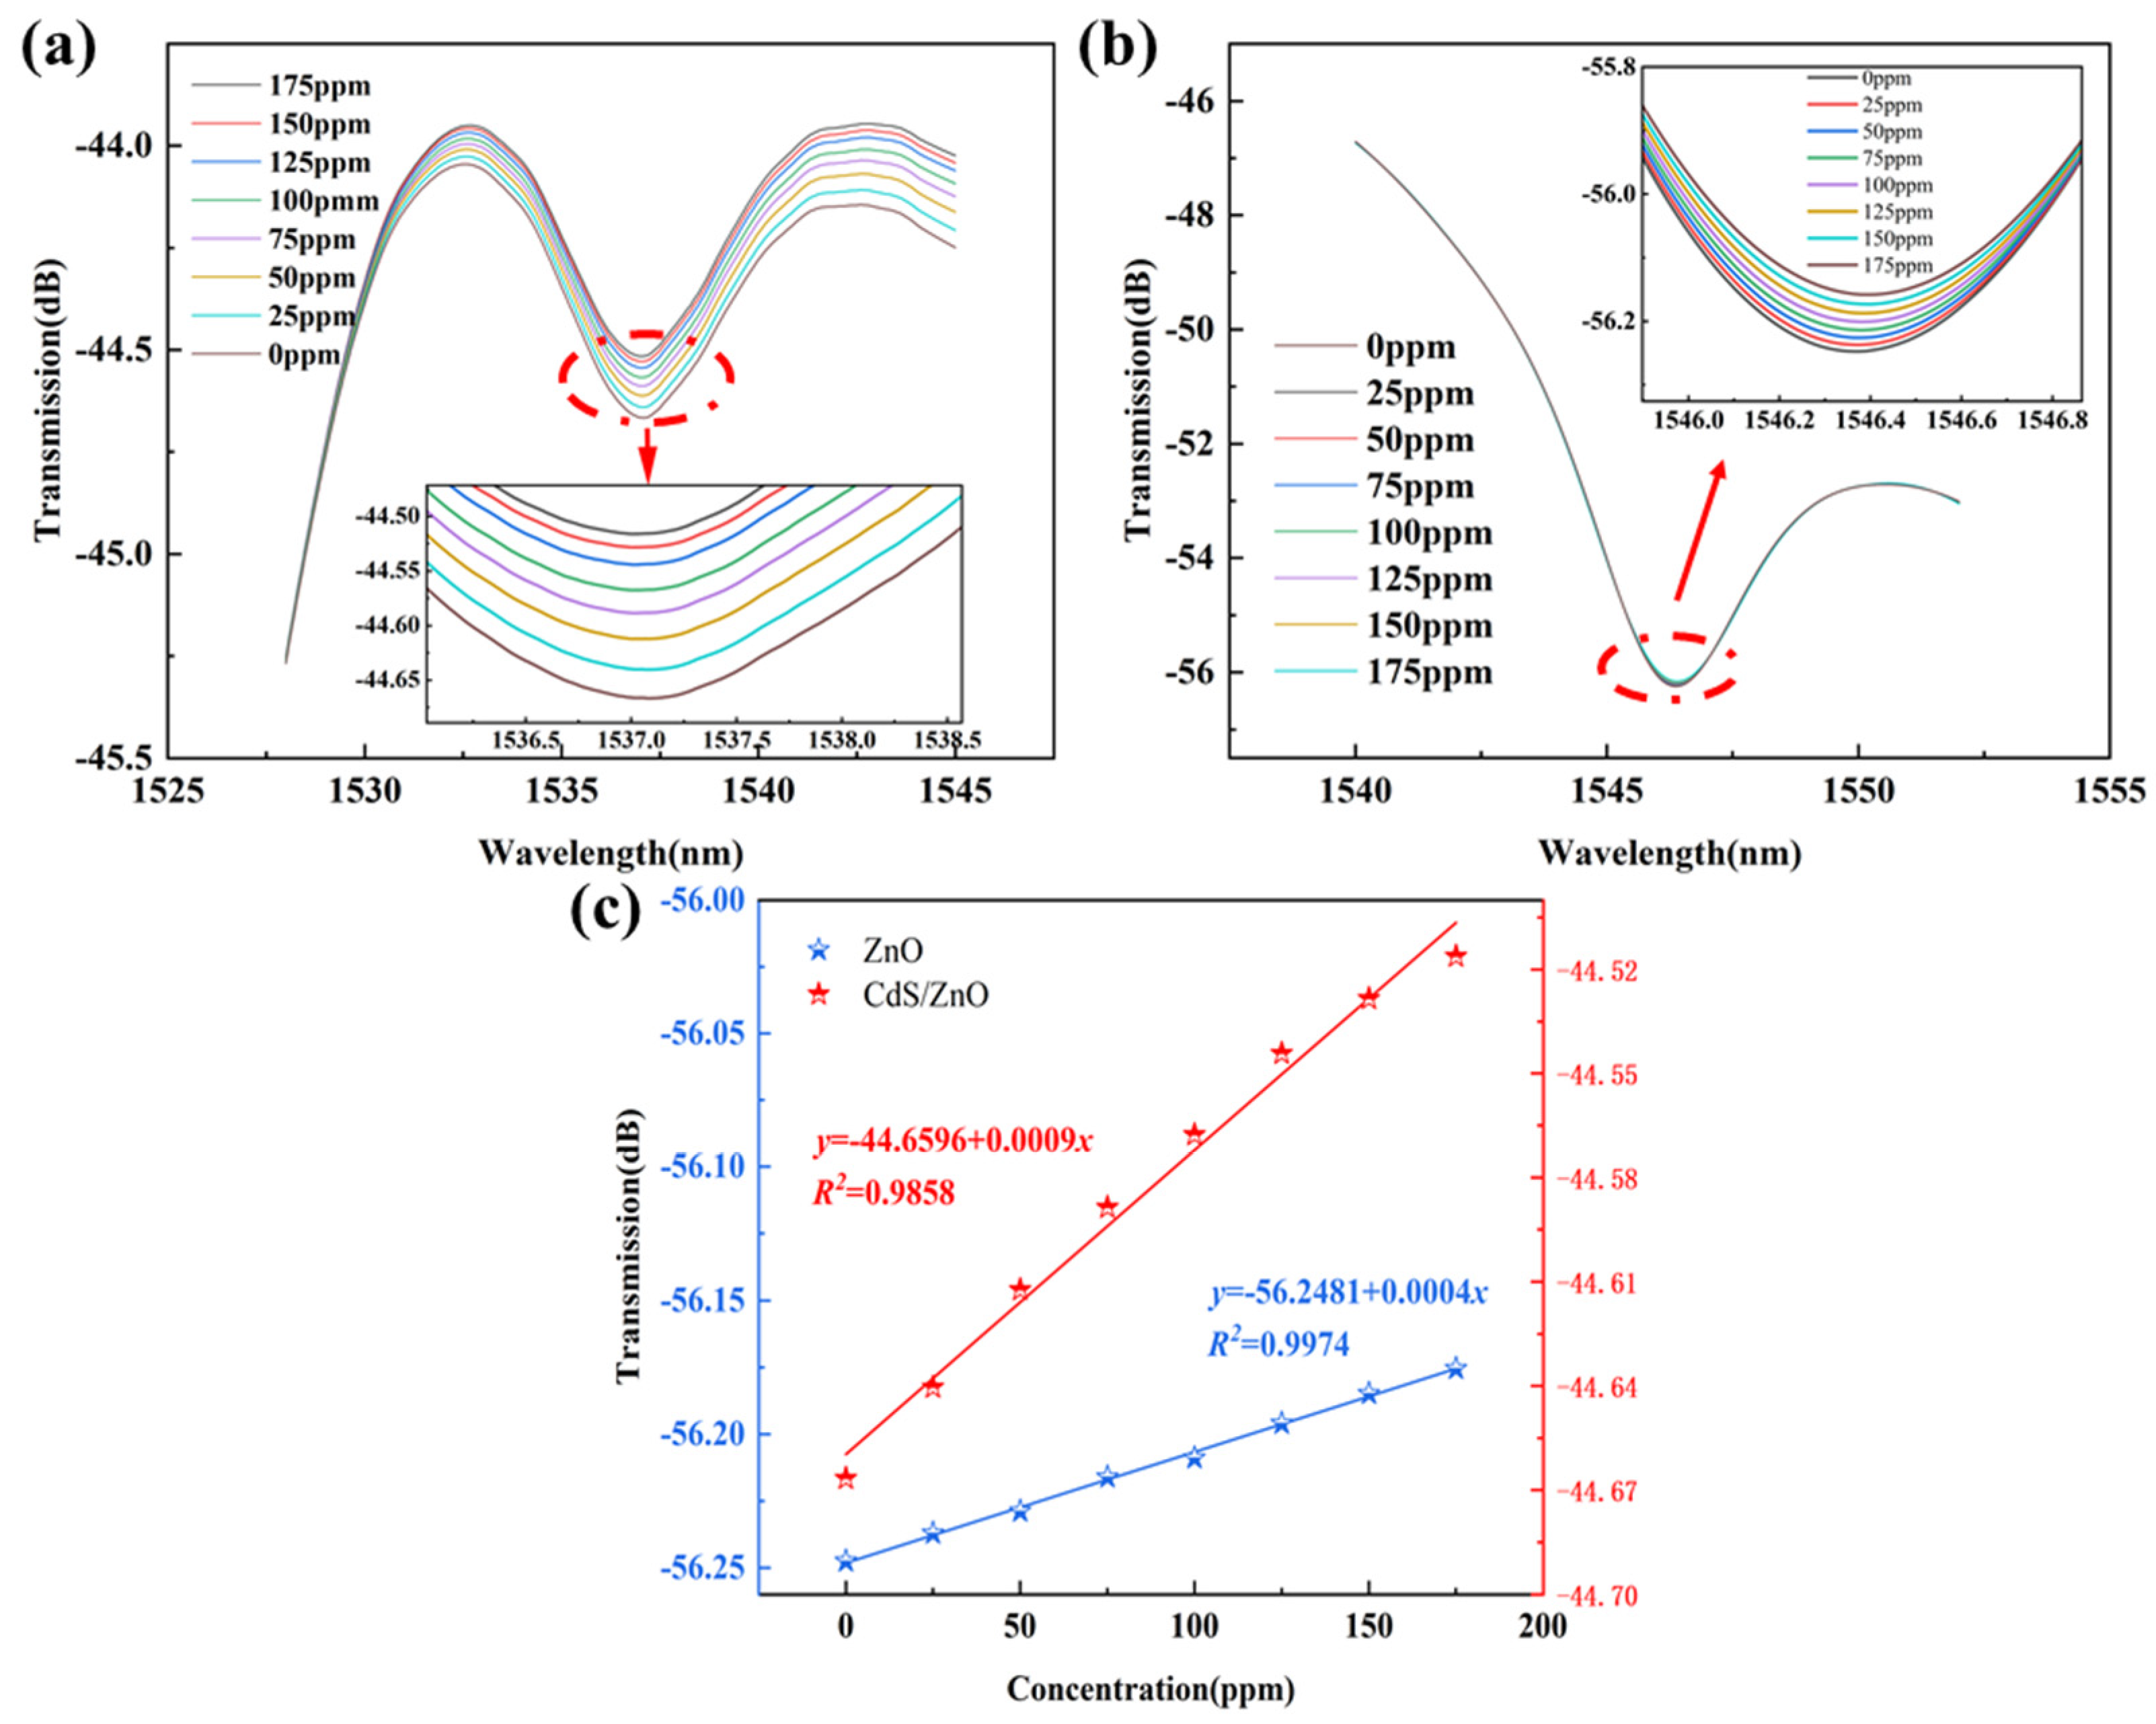
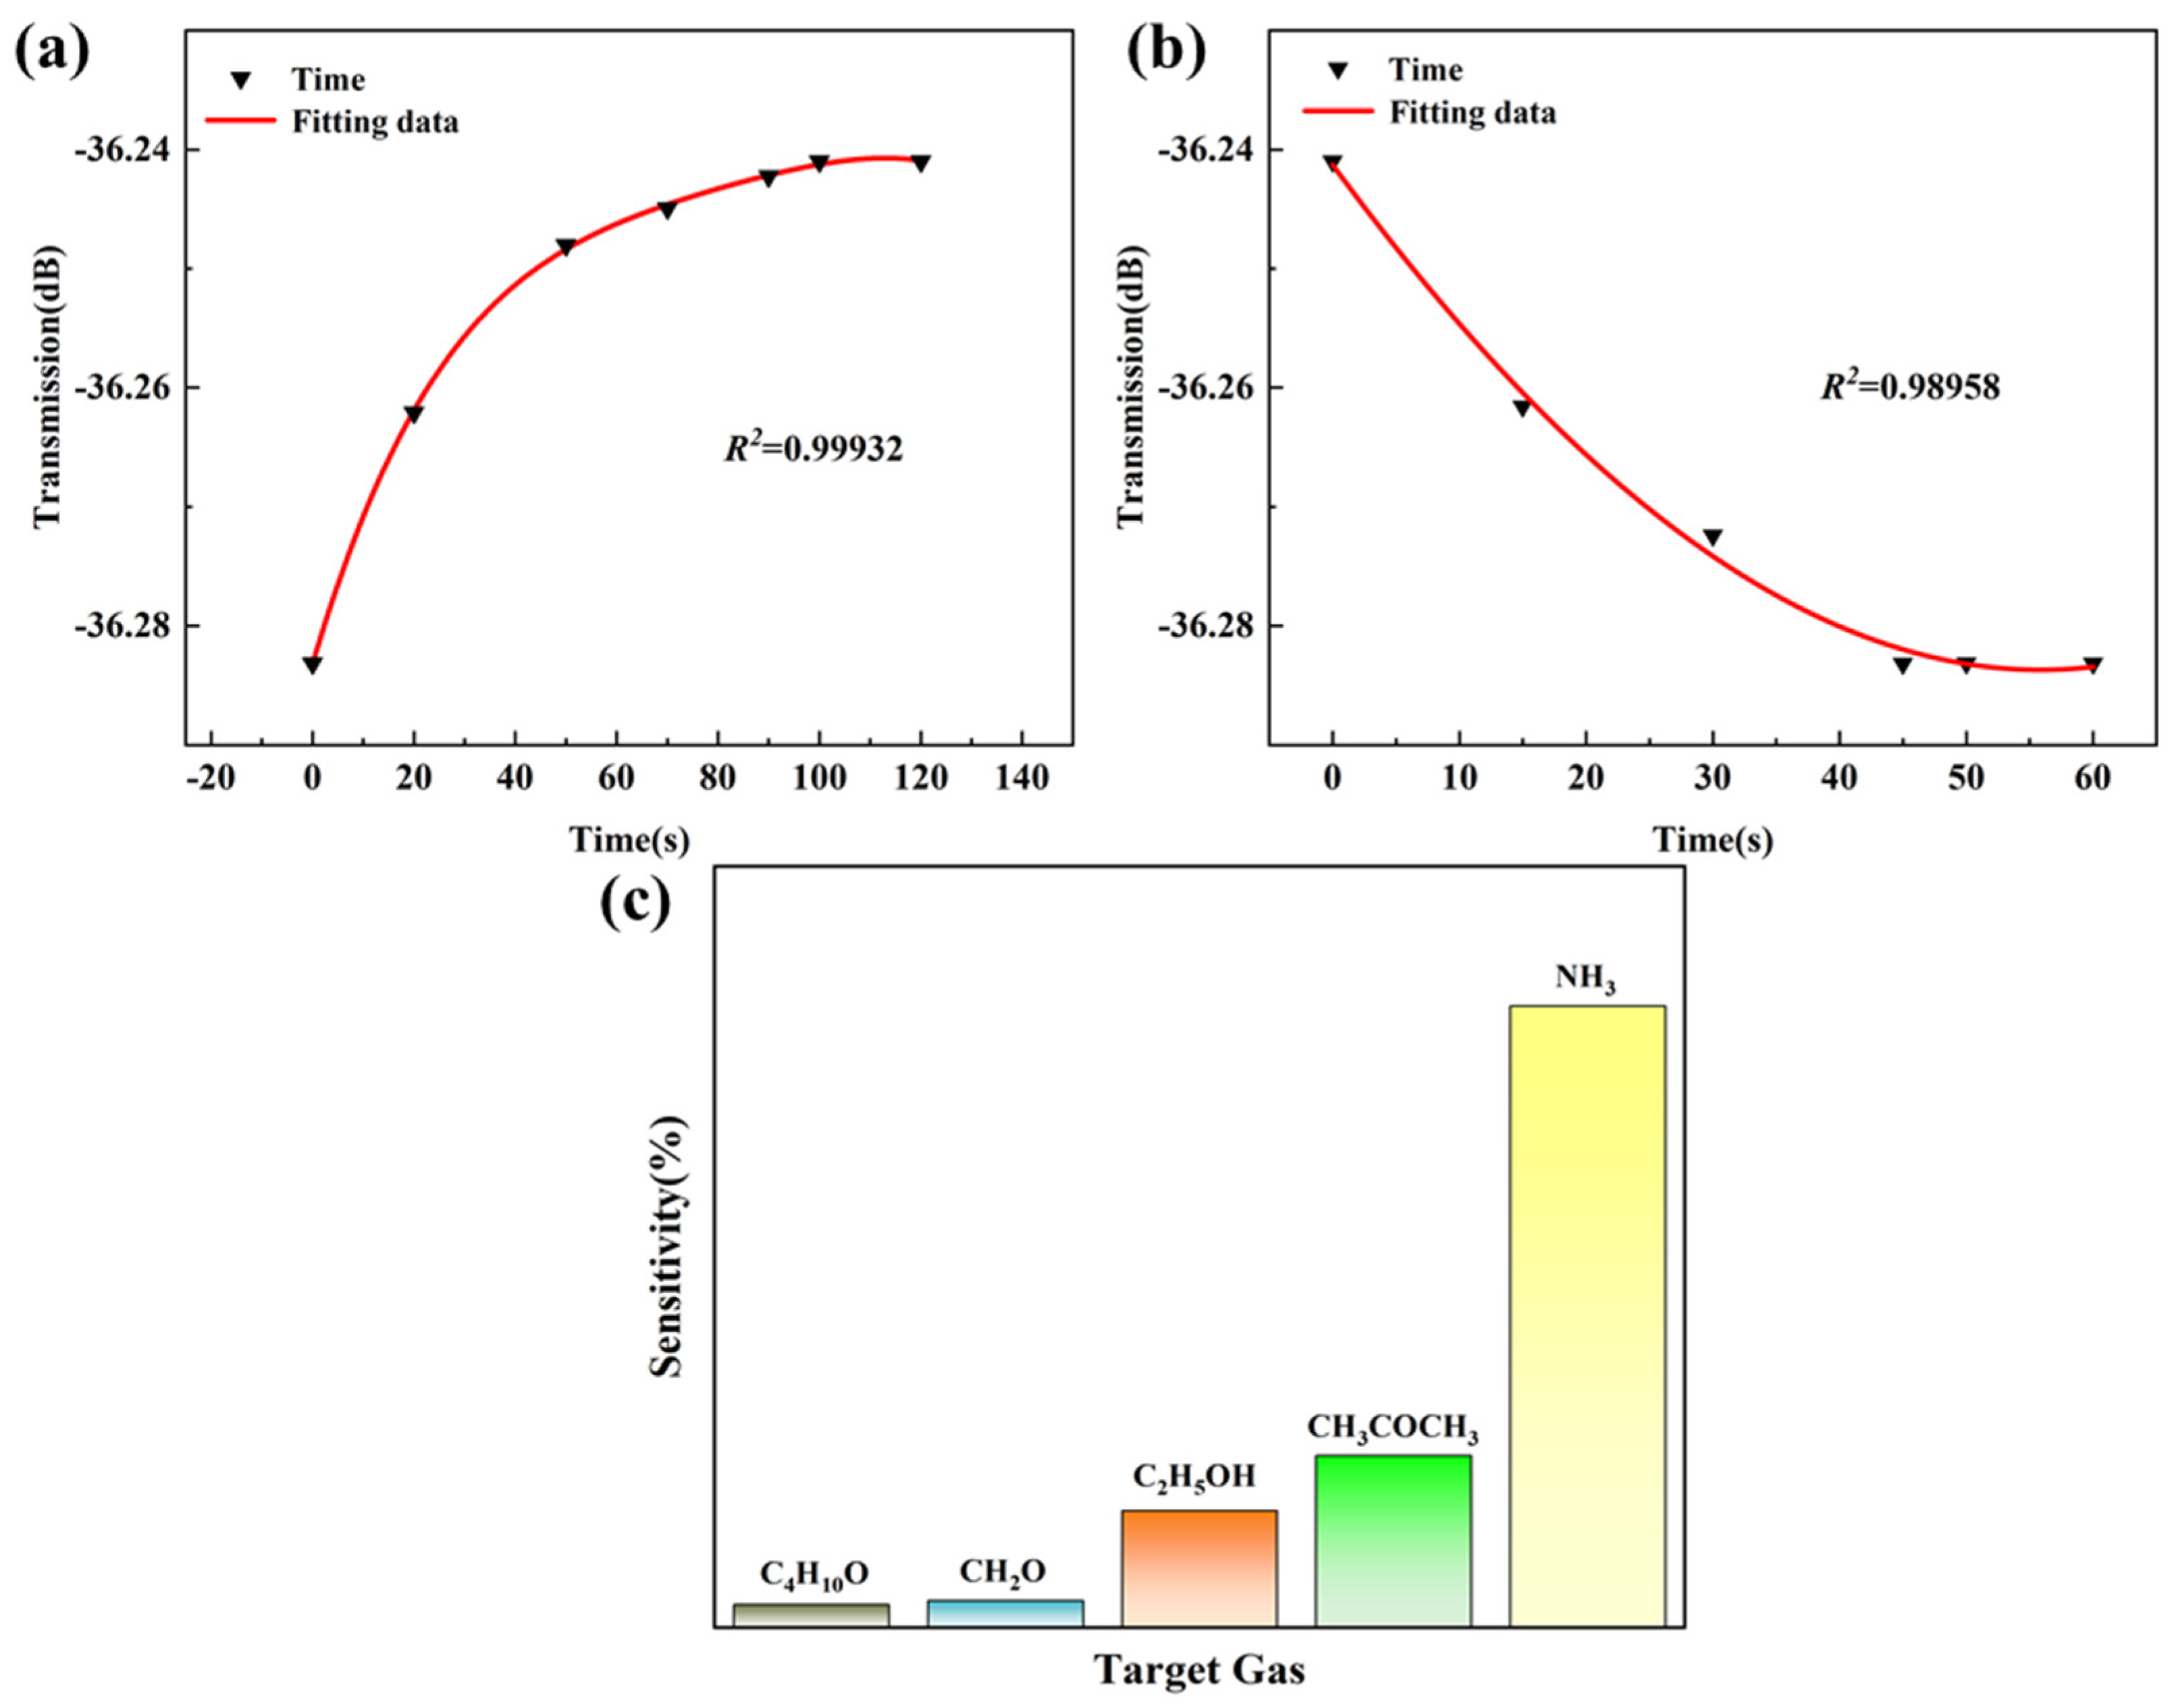
3.2. Gas-Sensing Properties

The gas-sensing mechanism of metal oxide-based gas sensors hinges on the interaction between the surface and atmospheric oxygen, involving processes of adsorption and desorption [25,26]. CdS/ZnO first adsorbs oxygen molecules from the atmosphere. When NH3 interacts with O2, oxygen desorption occurs [19]. During this process, the refractive index changes, which alters the penetration depth of the evanescent wave at the interface. This, in turn, affects the variations in light output in both transmission and reflection modes [27]. The penetration depth of the evanescent wave decreases with increasing NH3 concentration, indicating a decrease in the percentage of light reflection at the interface with increasing NH3 concentration, i.e., a decrease in the energy of reflected light, resulting in an overall upward shift in the spectrum with increasing NH3 concentration. The sensor’s response is governed by the interaction between the gas-sensitive material and the target gas molecules. This interaction is influenced by the quantity of target gas molecules and the strength of attraction between the gas molecules and the gas-sensitive material.
Sensors doped with different concentrations of CdS QDs exhibit varying gas sensitivity characteristics. At room temperature, concentration gradient tests were conducted on the three fabricated sensors, with NH3 gas introduced into the chamber at intervals of 25 ppm. Figure 7 displays the gas sensitivity characteristics of ZC-5 to NH3, where at 75 ppm, the spectrum changes were no longer apparent, indicating saturation. Within the concentration range of 0~75 ppm, the sensitivity to NH3 was 0.4 × 10⁻³ dB/ppm.
For ZC-10 and ZC-0, as the gas concentration increased, the interference spectrum’s trough gradually shifted upward, as shown in Figure 8a,b. The concentration of NH3 is linearly related to the displacement of the trough, as illustrated in Figure 8c. The sensitivity of the ZC-0-based sensor is 0.4 × 10⁻³ dB/ppm, while the sensitivity of ZC-10 is 0.9 × 10⁻³ dB/ppm, which is more than two times higher. The sensor exhibits higher sensitivity because the ZC-10 material forms an n-n heterojunction, and the carrier concentration on the surface of the material changes more rapidly. Furthermore, CdS QDs have a small particle size and high dispersity, corresponding to a larger specific surface area. Hence, ZC-10 has a higher specific surface area compared to ZC-0. The large specific surface area can promote rapid adsorption and desorption of molecules, thus improving the gas-sensitive performance [28]. With an increasing amount of CdS QDs, more CdS-ZnO heterojunctions are formed, leading to stronger interactions between CdS and ZnO. This promotes the diffusion and adsorption of reactant molecules, thereby enhancing the gas-sensing performance of the sensor [29]. Moreover, owing to the variance in work function, the ZnO sensor, when modified with a high concentration of CdS quantum dots (QDs), exhibits a substantial influx of electrons toward the surface of ZnO [30], thus providing more possibilities for the chemical adsorption of oxygen molecules. Finally, at the interface of CdS/ZnO, lattice mismatch leads to an increase in defects in the gas-sensitive material [31], thereby generating more oxygen vacancies. These vacancies provide conditions for the adsorption of oxygen molecules and gas-sensitive reactions, thereby facilitating the improvement in sensor sensitivity [32].
Next, we mainly tested other properties of the ZC-10-based sensor with the highest sensitivity. Under identical conditions, 25 ppm of NH3 gas was injected and purged into the chamber repeatedly, and the consecutive spectra were recorded for three cycles, as depicted in Figure 9. It can be observed that the recovery spectra almost completely overlapped each time, demonstrating the excellent repeatability of the sensor. Figure 10a,b further illustrate the response and recovery time of the sensor. The response time of the sensor is determined by monitoring the transmission spectrum’s interference valley and observing when it ceases to shift, indicating that the sensor has reached saturation when detecting a fixed concentration of ammonia gas. The time taken to reach this initial saturation point is recorded as the response time. Similarly, the recovery time is measured by expelling the gas from the chamber and observing the interference valley’s wavelength in the transmission spectrum. The recovery time is defined as the time it takes for the interference valley to return to its original position before the gas is introduced and then stabilized. With the introduction of 25 ppm of NH3 into the chamber, the sensor exhibited a rapid response, stabilizing by around 100 s, with no further movement of the trough. Subsequently, the chamber was opened to purge the NH3, and after 48 s, the spectrum stabilized, indicating the sensor’s good response and recovery characteristics. Compared to conventional fiber optic gas sensors with response and recovery times of several tens of minutes [6,33], the response and recovery times of this sensor are significantly shortened.
Various gases were introduced into the gas chamber to assess the selectivity of the sensor, as depicted in Figure 10c. The sensor based on ZC-10 demonstrated a notable response to NH3 and comparatively lower responses to other gases.

3.3. Gas-Sensing Mechanism

The gas-sensing mechanism in the proposed optical fiber sensor is illustrated in Figure 11. Typically, light undergoes internal reflection within the fiber based on the refractive indices of its core and cladding. However, not all incident light is reflected; a portion refracts into the cladding material. As light traverses through the sensing region within the fiber, some of it continues to transmit through the optically sparse medium, forming an evanescent wave whose intensity rapidly decays exponentially. Generally, the penetration depth of this evanescent wave is in the order of a few wavelengths. By applying Fresnel’s law and considering total internal reflection conditions, the penetration depth (d) can be calculated using Equation (2) [34].
d = λ 2 π sin θ 2 n 1 2 n 2 2 2
where λ is the wavelength of the light wave in the fiber core; θ is the angle of incidence; and n1 and n2 are the refractive indices of the fiber core and the sensitive film cladding, respectively. The refractive index (RI) of the sensitive film cladding, denoted as n2, is related to the type and concentration of the analyzed gas. A modification in the refractive index of the interface will alter the evanescent field’s intensity, which subsequently affects the signal intensity of light undergoing total internal reflection in the sensing region. The change in refractive index is attributed to the interaction between target gas and sensitive material. Metal oxides primarily react with oxygen molecules present in the air, leading to modified properties. The processes of electron transfer, adsorption, and desorption reactions of gas molecules are illustrated in Figure 11b. When ZnO/CdS QDs are exposed to air, a large number of oxygen molecules are adsorbed and subsequently converted into O2, and electrons are obtained from the gas-sensitive material. At this juncture, as electrons flow toward oxygen molecules, a thick depletion layer emerges on the sensitive material’s surface, leading to elevated resistance, thereby influencing the refractive index. As NH3 enters the chamber, NH3 molecules adsorb onto the surface of the sensitive material, initiating redox reactions with the adsorbed oxygen species. This process releases electrons, thereby narrowing the depletion layer and reducing resistance, which affects the refractive index. Notably, both ZnO and CdS exhibit characteristics of n-type semiconductors, with electrons as charge carriers. The gas sensitivity of the CdS/ZnO sensor is closely related to the formation of heterojunctions. The work function of CdS (Ws = 4.5 eV) is lower than that of ZnO (Ws = 5.3 eV) [35]. Hence, upon contact between CdS and ZnO, rapid electron transfer occurs from CdS to ZnO, establishing a space charge region, until their Fermi levels attain equilibrium, thus resulting in the formation of an n-n heterojunction. The migrated electrons can promote the generation of chemisorbed oxygen, resulting in more NH3 reacting with the adsorbed oxygen substances in redox reactions. The significant change in electron concentration will lead to a significant change in resistance, thus significantly affecting the refractive index of the CdS/ZnO coating, effectively improving gas sensitivity. On the other hand, at the interface of CdS/ZnO, lattice mismatch occurs [36], resulting in more defects in the gas-sensitive material. Therefore, numerous oxygen vacancies are generated, which provide conditions for the adsorption of oxygen molecules and gas-sensitive reactions, thereby promoting the performance improvement of the gas-sensitive material. The specific reactions of the above processes are as follows [19]:
O 2 g a s O 2 a d s o r b
O 2 a d s o r b + e O 2
4 N H 3 + 2 O 2 3 N 2 + 6 H 2 O + 3 e
or
4 N H 3 + 5 O 2 6 H 2 O + 4 N O + 5 e
Additionally, due to the different affinities of Zn and Cd, both exhibit sensing capabilities for NH3, which play a significant role in the formation of chemical bonds. Essentially, the gas-sensing mechanism is an electron transfer process. NH3 molecules have lone pairs of electrons, and CdS is an n-type semiconductor. When the sensor is exposed to NH3 gas, the charge carrier density increases [37], and weak coordination bonds are formed between the gas molecules and cadmium atoms, as shown in Equation (7) [38].
Cd 2 + + : NH 3 Cd NH 3 2 +
This interaction enhances the sensor’s response to ammonia, further explaining why materials doped with CdS quantum dots exhibit superior gas-sensing performance.
The aforementioned process will result in modifications to the sensitive material’s physical characteristics, which will alter the interface’s refractive index and modify the energy of light reflection as well as the evanescent wave’s penetration depth. Therefore, by measuring the change in evanescent wave energy caused by variations in gas concentration, fiber optic gas sensors utilizing the evanescent field can precisely determine the gas concentration.

4. Conclusions

In summary, an NH3 sensing material was successfully synthesized via the hydrothermal method, namely, ZnO nanomaterial modified with CdS QDs. The gas-sensing properties of three different compositions of CdS/ZnO sensors were systematically investigated. Among all sensors, the ZC-10-based sensor exhibited the best performance, with a sensitivity to NH3 reaching 0.9 × 10⁻³ dB/ppm, more than twice that of the ZC-0. Additionally, this sensor demonstrated good selectivity and repeatability. The high sensitivity of this material is mainly attributed to the formation of n-n heterojunctions and the relatively large specific surface area. Current research suggests that utilizing quantum dot-modified metal materials to form n-n heterojunctions is a feasible approach to enhance the gas-sensing properties of sensors.

Author Contributions

Conceptualization, X.L. and C.Z.; methodology, Y.W.; software, X.L. and C.Z.; validation, Y.W., C.Z. and Z.Y.; formal analysis, C.Z. and Y.W.; investigation, X.L.; resources, Z.Y.; data curation, X.L.; writing—original draft preparation, X.L.; writing—review and editing, C.Z., Y.W. and Z.Y.; visualization, X.L.; supervision, Z.Y. and Y.W.; project administration, Z.Y.; funding acquisition, Z.Y. All authors have read and agreed to the published version of the manuscript.

Funding

This work was supported by the National Training Program of Innovation and Entrepreneurship for Undergraduates (S202410145188), the National Natural Science Foundation of China (62071112, 62033002, 61833006, and 61973058), the Fundamental Research Funds for the Central Universities in China (N2201008 and N2304024), the 111 Project (B16009), the Hebei Natural Science Foundation (F2020501040), and the Liaoning Province Natural Science Foundation (2020-KF-11-04).

Institutional Review Board Statement

Not applicable.

Informed Consent Statement

Not applicable.

Data Availability Statement

Data are contained within the article.

Conflicts of Interest

The authors declare no conflicts of interest.

References

  1. Zhang, H.; Li, Y.; Yuan, Z.; Lei, Y.; Li, X.; Meng, F. Enhanced Ammonia Sensing Performance Based on FeCo2O4/WO3/rGO Ternary Nanocomposites. IEEE Sens. J. 2023, 23, 25698–25707. [Google Scholar] [CrossRef]
  2. Kumar, N.; Srivastava, A.K.; Nath, R.; Gupta, B.K.; Varma, G.D. Probing the highly efficient room temperature ammonia gas sensing properties of a luminescent ZnO nanowire array prepared via an AAO-assisted template route. Dalton Trans. 2014, 43, 5713–5720. [Google Scholar] [CrossRef] [PubMed]
  3. Shen, B.; Li, F.; Xie, Y.; Luo, J.; Fan, P.; Zhong, A. High performance ammonia gas sensor based on GaN honeycomb nanonetwork. Sens. Actuators A Phys. 2020, 312, 112172. [Google Scholar] [CrossRef]
  4. Hibbard, T.; Killard, A.J. Breath Ammonia Analysis: Clinical Application and Measurement. Crit. Rev. Anal. Chem. 2011, 41, 21–35. [Google Scholar] [CrossRef]
  5. Reston, R.R.; Kolesar, E.S. Silicon-micromachined gas chromatography system used to separate and detect ammonia and nitrogen dioxide. I. Design, fabrication, and integration of the gas chromatography system. J. Microelectromechanical Syst. 1994, 3, 134–146. [Google Scholar] [CrossRef]
  6. Renganathan, B.; Sastikumar, D.; Gobi, G.; Rajeswari Yogamalar, N.; Chandra Bose, A. Nanocrystalline ZnO coated fiber optic sensor for ammonia gas detection. Opt. Laser Technol. 2011, 43, 1398–1404. [Google Scholar] [CrossRef]
  7. Cao, W.; Duan, Y. Optical fiber-based evanescent ammonia sensor. Sens. Actuators B Chem. 2005, 110, 252–259. [Google Scholar] [CrossRef]
  8. Devendiran, S.; Sastikumar, D. Gas sensing based on detection of light radiation from a region of modified cladding (nanocrystalline ZnO) of an optical fiber. Opt. Laser Technol. 2017, 89, 186–191. [Google Scholar] [CrossRef]
  9. Narasimman, S.; Balakrishnan, L.; Alex, Z.C. Fiber-Optic Ammonia Sensor Based on Amine Functionalized ZnO Nanoflakes. IEEE Sens. J. 2017, 18, 201–208. [Google Scholar] [CrossRef]
  10. Renganathan, B.; Ganesan, A.R. Fiber optic gas sensor with nanocrystalline ZnO. Opt. Fiber Technol. 2014, 20, 48–52. [Google Scholar] [CrossRef]
  11. Zeng, Y.; Lou, Z.; Wang, L.; Zou, B.; Zhang, T.; Zheng, W.; Zou, G. Enhanced ammonia sensing performances of Pd-sensitized flowerlike ZnO nanostructure. Sens. Actuators B Chem. 2011, 156, 395–400. [Google Scholar] [CrossRef]
  12. Renganathan, B.; Sastikumar, D.; Gobi, G.; Yogamalar, N.R.; Bose, A.C. Gas sensing properties of a clad modified fiber optic sensor with Ce, Li and Al doped nanocrystalline zinc oxides. Sens. Actuators B Chem. 2011, 156, 263–270. [Google Scholar] [CrossRef]
  13. Lupan, O.; Postica, V.; Gröttrup, J.; Mishra, A.K.; de Leeuw, N.H.; Adelung, R. Enhanced UV and ethanol vapour sensing of a single 3-D ZnO tetrapod alloyed with Fe2O3 nanoparticles. Sens. Actuators B Chem. 2017, 245, 448–461. [Google Scholar] [CrossRef]
  14. Gavgani, J.N.; Hasani, A.; Nouri, M.; Mahyari, M.; Salehi, A. Highly sensitive and flexible ammonia sensor based on S and N co-doped graphene quantum dots/polyaniline hybrid at room temperature. Sens. Actuators B Chem. 2016, 229, 239–248. [Google Scholar] [CrossRef]
  15. Hu, S.; Yan, G.; Wu, C.; He, S. An Ethanol Vapor Sensor Based on a Microfiber with a Quantum-Dot Gel Coating. Sensors 2019, 19, 300. [Google Scholar] [CrossRef]
  16. Gao, W.; Wang, X.; He, Y.; Yu, H.; Zheng, Y.; Yin, R.; Jiang, X. Sub-ppm NO2 gas sensing in CdTe quantum dots functionalized hollow-core anti-resonant fiber. Sens. Actuators B Chem. 2024, 405, 135350. [Google Scholar] [CrossRef]
  17. Ding, L.; Ruan, Y.; Li, T.; Huang, J.; Warren-Smith, S.C.; Ebendorff-Heidepriem, H.; Monro, T.M. Nitric oxide optical fiber sensor based on exposed core fibers and CdTe/CdS quantum dots. Sens. Actuators B Chem. 2018, 273, 9–17. [Google Scholar] [CrossRef]
  18. Sung, T.-W.; Lo, Y.-L. Ammonia vapor sensor based on CdSe/SiO2 core–shell nanoparticles embedded in sol–gel matrix. Sens. Actuators B Chem. 2013, 188, 702–708. [Google Scholar] [CrossRef]
  19. Brahma, S.; Huang, P.C.; Mwakikunga, B.W.; Saasa, V.; Akande, A.A.; Huang, J.-L.; Liu, C.-P. Cd doped ZnO nanorods for efficient room temperature NH3 sensing. Mater. Chem. Phys. 2023, 294, 127053. [Google Scholar] [CrossRef]
  20. Li, G.; Zhu, X.; Tang, X.; Song, W.; Yang, Z.; Dai, J.; Sun, Y.; Pan, X.; Dai, S. Doping and annealing effects on ZnO:Cd thin films by sol–gel method. J. Alloys Compd. 2011, 509, 4816–4823. [Google Scholar] [CrossRef]
  21. Jule, L.T.; Dejene, F.B.; Ali, A.G.; Roro, K.T.; Hegazy, A.; Allam, N.K.; El Shenawy, E. Wide visible emission and narrowing band gap in Cd-doped ZnO nanopowders synthesized via sol-gel route. J. Alloys Compd. 2016, 687, 920–926. [Google Scholar] [CrossRef]
  22. Zhang, H.; Jin, Z.; Xu, M.-D.; Zhang, Y.; Huang, J.; Cheng, H.; Wang, X.-F.; Zheng, Z.-L.; Ding, Y. Enhanced Isopropanol Sensing Performance of the CdS Nanoparticle Decorated ZnO Porous Nanosheets-Based Gas Sensors. IEEE Sens. J. 2021, 21, 13041–13047. [Google Scholar] [CrossRef]
  23. Wang, Y.-n.; Qin, L.; Yuan, Z.; Li, J.; Meng, F. UV photosensitized N-CQDs@In2O3 ordered porous film elaborated optical fiber acetone gas sensor with ppb-level at room temperature. Sens. Actuators B Chem. 2024, 418, 136283. [Google Scholar] [CrossRef]
  24. Li, H.; Shih, W.Y.; Shih, W.-H. Synthesis and Characterization of Aqueous Carboxyl-Capped CdS Quantum Dots for Bioapplications. Ind. Eng. Chem. Res. 2007, 46, 2013–2019. [Google Scholar] [CrossRef]
  25. Li, Z.; Li, H.; Wu, Z.; Wang, M.; Luo, J.; Torun, H.; Hu, P.; Yang, C.; Grundmann, M.; Liu, X.; et al. Advances in designs and mechanisms of semiconducting metal oxide nanostructures for high-precision gas sensors operated at room temperature. Mater. Horiz. 2019, 6, 470–506. [Google Scholar] [CrossRef]
  26. Marikutsa, A.; Rumyantseva, M.; Konstantinova, E.A.; Gaskov, A. The Key Role of Active Sites in the Development of Selective Metal Oxide Sensor Materials. Sensors 2021, 21, 2554. [Google Scholar] [CrossRef] [PubMed]
  27. Samavati, Z.; Samavati, A.; Ismail, A.F.; Othman, M.H.D.; Rahman, M.A. Comprehensive investigation of evanescent wave optical fiber refractive index sensor coated with ZnO nanoparticles. Opt. Fiber Technol. 2019, 52, 101976. [Google Scholar] [CrossRef]
  28. Meng, D.; Liu, D.; Wang, G.; Shen, Y.; San, X.; Li, M.; Meng, F. Low-temperature formaldehyde gas sensors based on NiO-SnO2 heterojunction microflowers assembled by thin porous nanosheets. Sens. Actuators B Chem. 2018, 273, 418–428. [Google Scholar] [CrossRef]
  29. Li, X.; Wang, J.; Men, Y.; Bian, Z. TiO2 mesocrystal with exposed (001) facets and CdS quantum dots as an active visible photocatalyst for selective oxidation reactions. Appl. Catal. B Environ. 2016, 187, 115–121. [Google Scholar] [CrossRef]
  30. Wu, H.; Li, Y.; Feng, W.; Zhong, X.; Li, J.; Liu, S.; Liu, H.; Ma, G.; Xie, R. Three-dimensional zinc oxide decorated with cadmium sulfide nanoparticles heterogenous nanoarchitectures with expedited charge separation toward efficient photocatalytic degradation of organic pollutants. Mater. Sci. Eng. B 2023, 292, 116459. [Google Scholar] [CrossRef]
  31. Rajeswari Yogamalar, N.; Sadhanandham, K.; Chandra Bose, A.; Jayavel, R. Band alignment and depletion zone at ZnO/CdS and ZnO/CdSe hetero-structures for temperature independent ammonia vapor sensing. Phys. Chem. Chem. Phys. 2016, 18, 32057–32071. [Google Scholar] [CrossRef] [PubMed]
  32. Zhang, C.; Liu, G.; Geng, X.; Wu, K.; Debliquy, M. Metal oxide semiconductors with highly concentrated oxygen vacancies for gas sensing materials: A review. Sens. Actuators A Phys. 2020, 309, 112026. [Google Scholar] [CrossRef]
  33. Subramanian, M.; Dhayabaran, V.V.; Sastikumar, D.; Shanmugavadivel, M. Development of room temperature fiber optic gas sensor using clad modified Zn3(VO4)2. J. Alloys Compd. 2018, 750, 153–163. [Google Scholar] [CrossRef]
  34. Zhao, Y.; Liu, Y.; Han, B.; Wang, M.; Wang, Q.; Zhang, Y.-N. Fiber optic volatile organic compound gas sensors: A review. Coord. Chem. Rev. 2023, 493, 215297. [Google Scholar] [CrossRef]
  35. Wang, S.; Zhu, B.; Liu, M.; Zhang, L.; Yu, J.; Zhou, M. Direct Z-scheme ZnO/CdS hierarchical photocatalyst for enhanced photocatalytic H2-production activity. Appl. Catal. B Environ. 2019, 243, 19–26. [Google Scholar] [CrossRef]
  36. Nie, Q.; Yang, L.; Cao, C.; Zeng, Y.; Wang, G.; Wang, C.; Lin, S. Interface optimization of ZnO nanorod/CdS quantum dots heterostructure by a facile two-step low-temperature thermal treatment for improved photoelectrochemical water splitting. Chem. Eng. J. 2017, 325, 151–159. [Google Scholar] [CrossRef]
  37. Saravanakumar, S.; Usha, K.S.; Prasath, G.V. Ammonia gas sensing performance of Co/Ni co-doped CdS thin films by chemical bath deposition. J. Mater. Sci. Mater. Electron. 2023, 34, 3. [Google Scholar] [CrossRef]
  38. Fu, T. Sensing behavior of CdS nanoparticles to SO2, H2S and NH3 at room temperature. Mater. Res. Bull. 2013, 48, 1784–1790. [Google Scholar] [CrossRef]
Figure 1. The fabrication of the sensitive material CdS/ZnO.
Chemosensors 12 00169 g001
Figure 2. Gas measurement experiment system.
Chemosensors 12 00169 g002
Figure 3. (a,b) SEM images of CdS/ZnO; (c) EDS spectra of ZnO/CdS QDs.
Chemosensors 12 00169 g003
Figure 4. (a,b) TEM and (c) HRTEM images of CdS/ZnO.
Chemosensors 12 00169 g004
Figure 5. (ad) Elemental mapping images of CdS/ZnO; (e,f) the magnified views of (c) and (d) respectively.
Chemosensors 12 00169 g005
Figure 6. XPS spectra of ZC-0 and ZC-10: (a) Zn 2p spectra; (b) O 1s spectra; (c) Cd 3d and (d) S 2p spectra.
Chemosensors 12 00169 g006
Figure 7. (a) Spectrogram of ZC-5-based sensor; (b) Spectral shift of ZC-5-based sensor as a function of NH3 concentration.
Chemosensors 12 00169 g007
Figure 8. Spectrogram of fiber gas sensor coated with (a) ZC-10 material and (b) ZC-0 material and (c) sensitivity comparison of sensors coated with different materials.
Chemosensors 12 00169 g008
Figure 9. (a) Repeatability of the ZC-10-based sensor; (b) the magnified views of (a).
Chemosensors 12 00169 g009
Figure 10. (a,b) Response/recovery time of the ZC-10-based sensor at 25 ppm NH3 concentration; (c) Response of the ZC-10-based sensor to different gases.
Chemosensors 12 00169 g010
Figure 11. (a) Principle of fiber optic sensors based on evanescent field; (b) the chemical reactions occurring in NH3.
Chemosensors 12 00169 g011
Table 1. Antoine constants.
GasABC
Ammonia7.554661002.711247.885
Butanol6.78574994.195210.2
Formaldehyde18.58753626.550−34.29
Ethanol8.044941554.300222.650
Acetone7.02441161.000224.000
Disclaimer/Publisher’s Note: The statements, opinions and data contained in all publications are solely those of the individual author(s) and contributor(s) and not of MDPI and/or the editor(s). MDPI and/or the editor(s) disclaim responsibility for any injury to people or property resulting from any ideas, methods, instructions or products referred to in the content.

