Circular Dichroism Reflectance Anisotropy of Chiral Atomically Thin Films

 , ,
, , 
Abstract
:1. Introduction
2. Materials and Methods
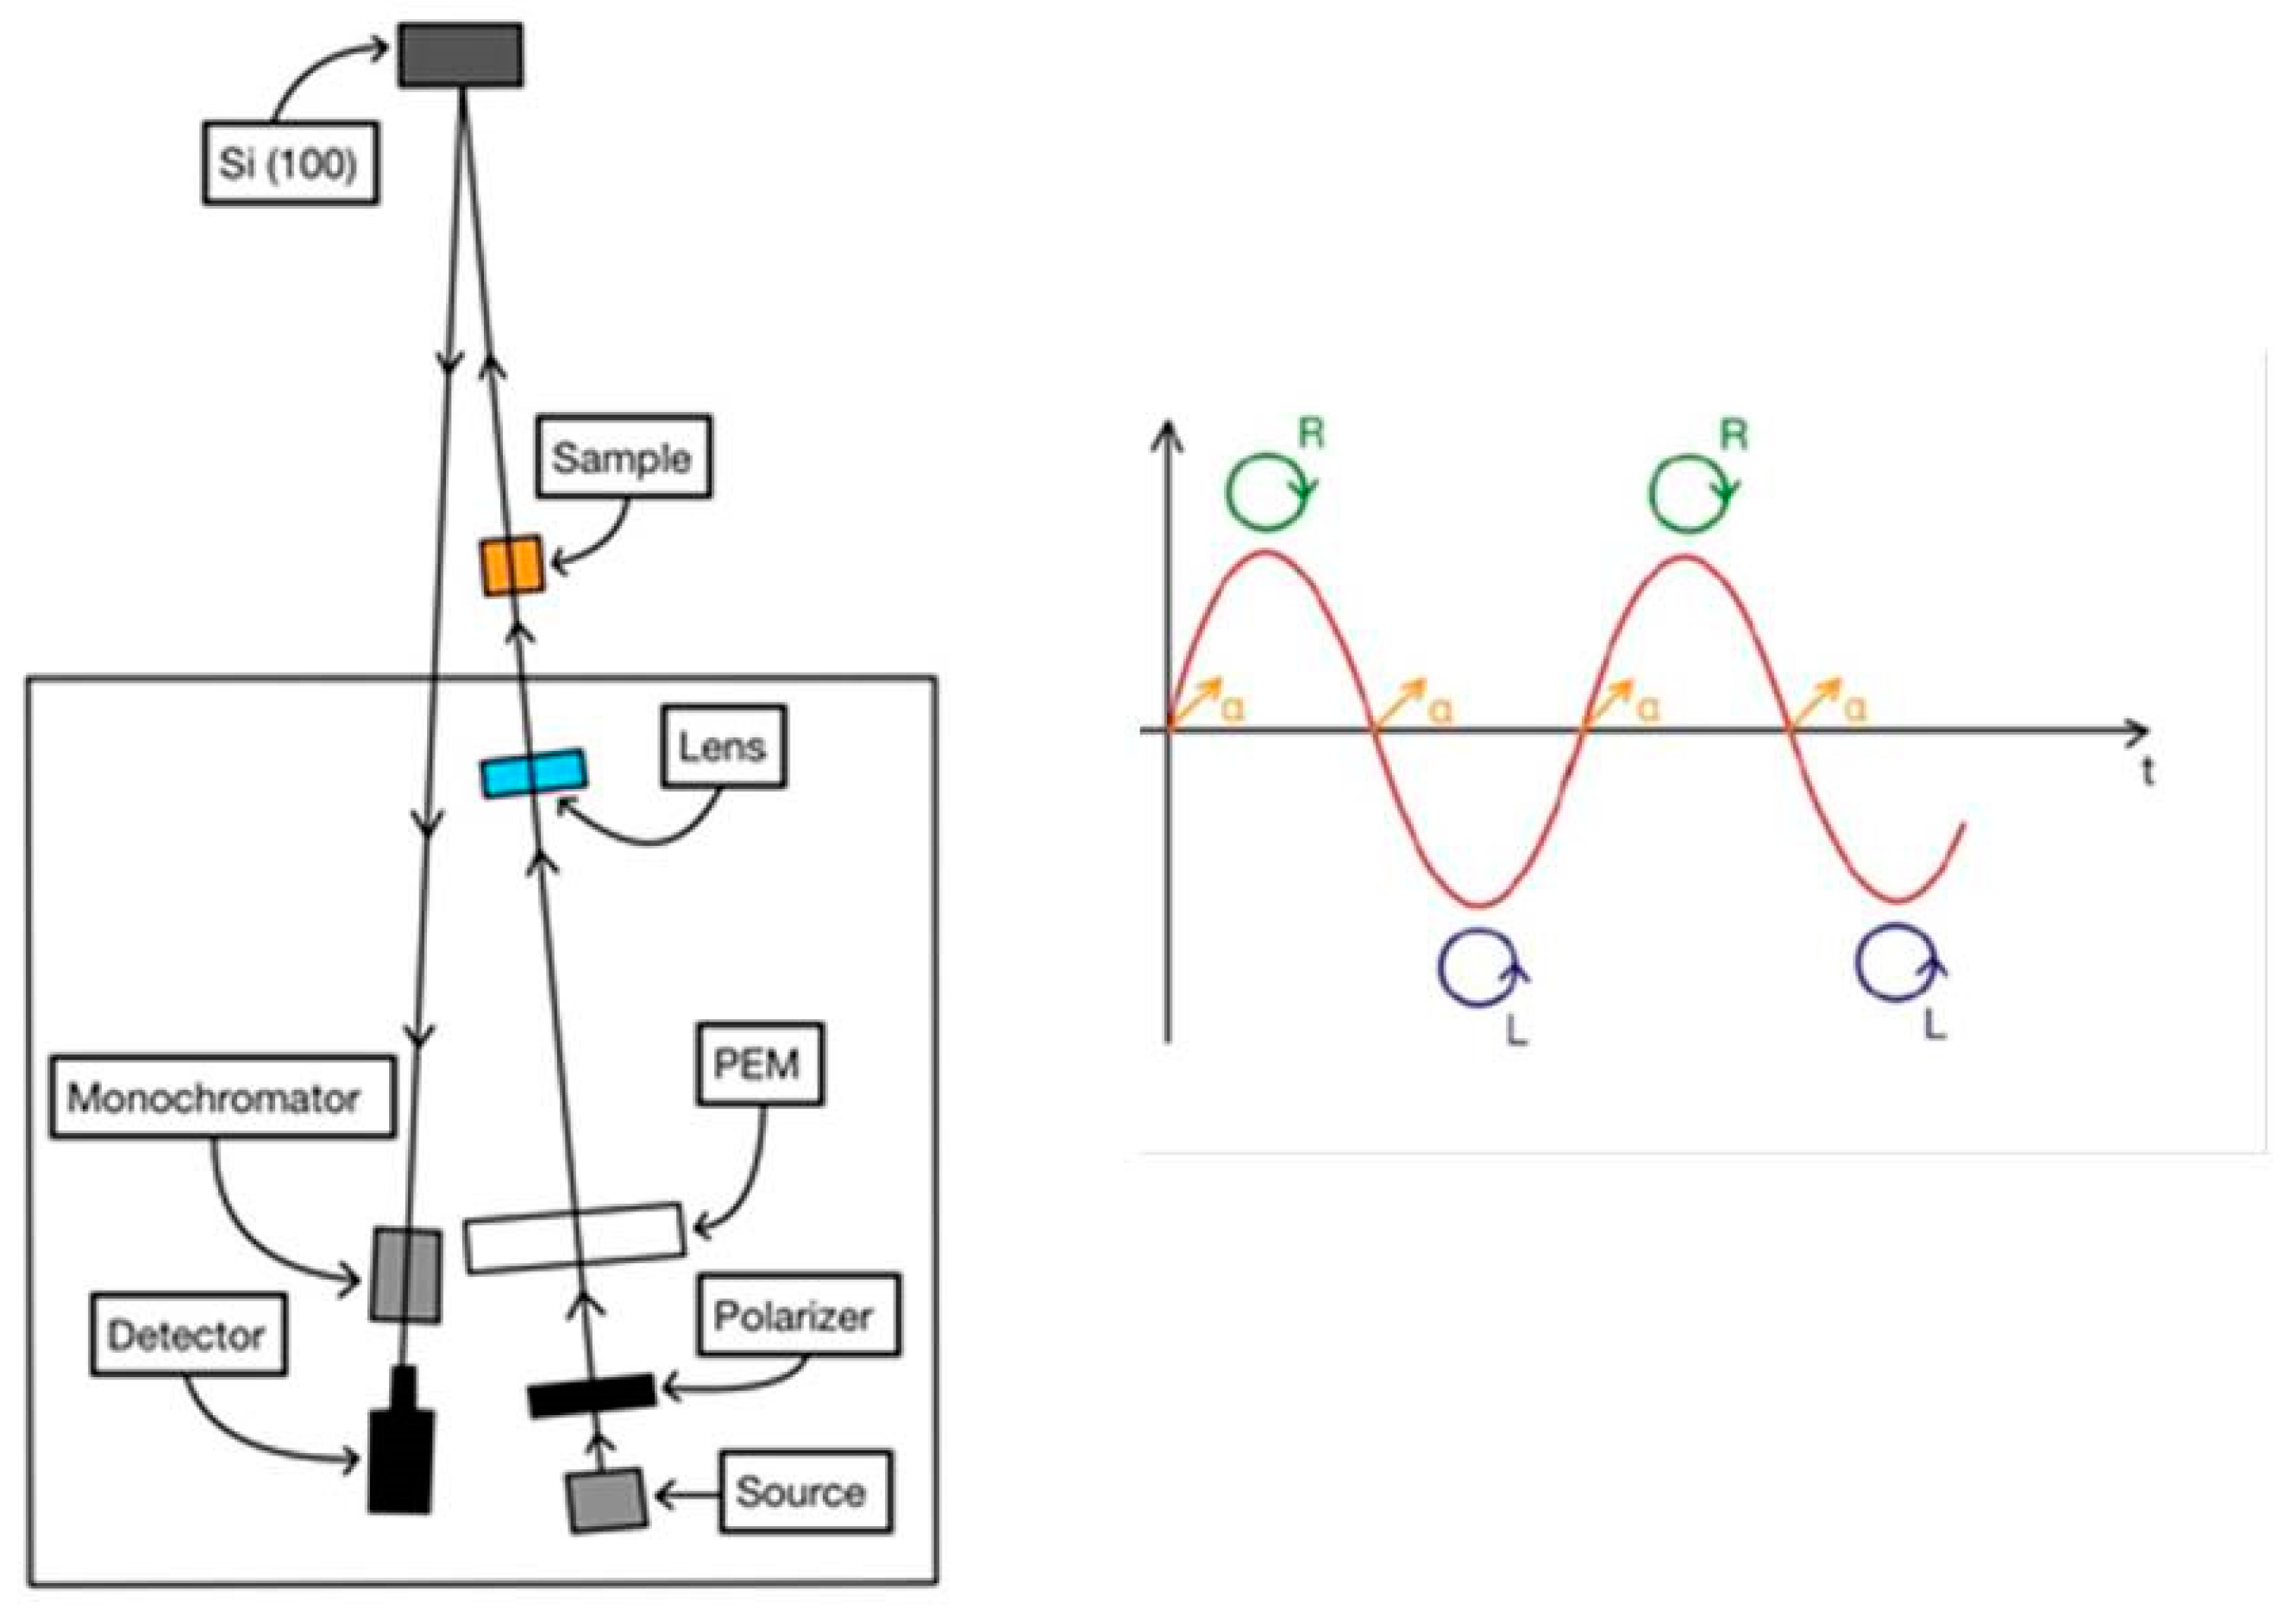
2.1. The CD-RAS Apparatus
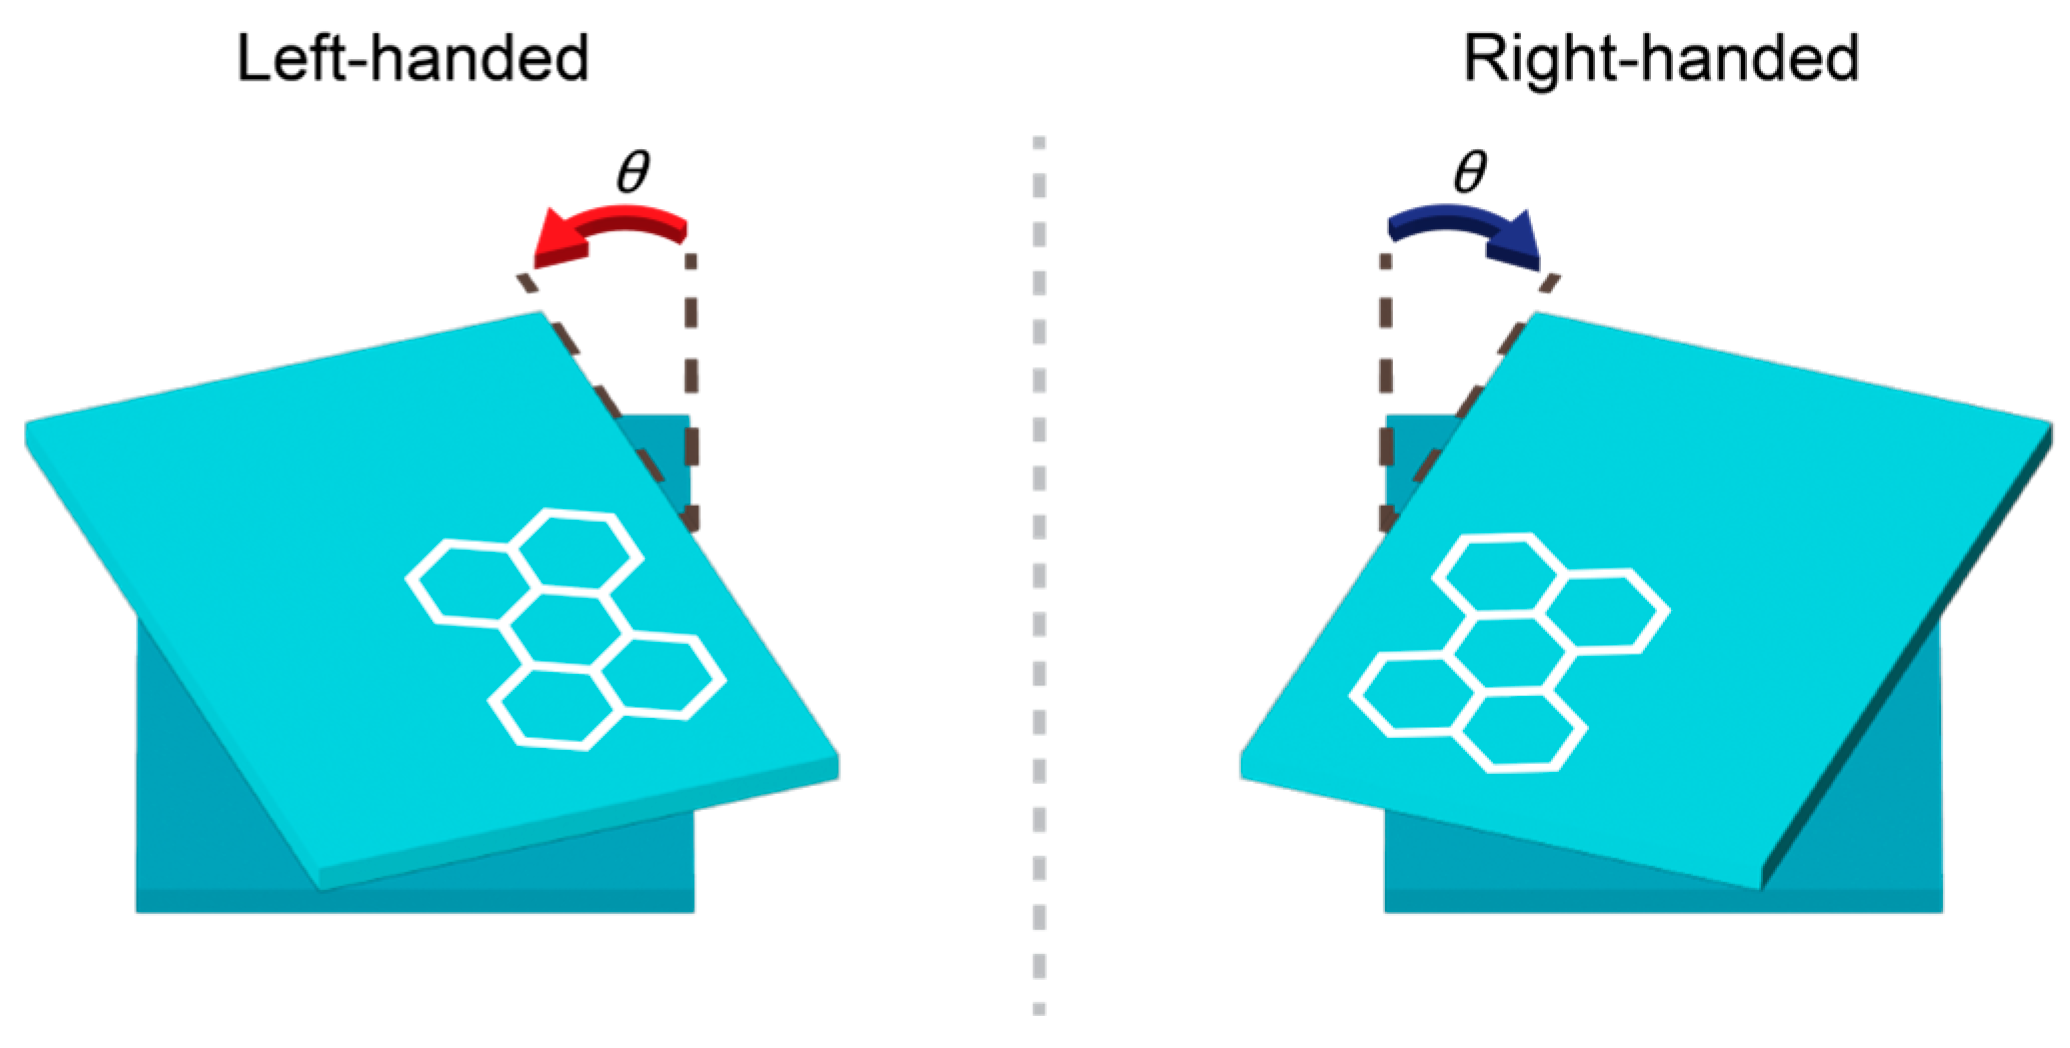
2.2. The Substrate
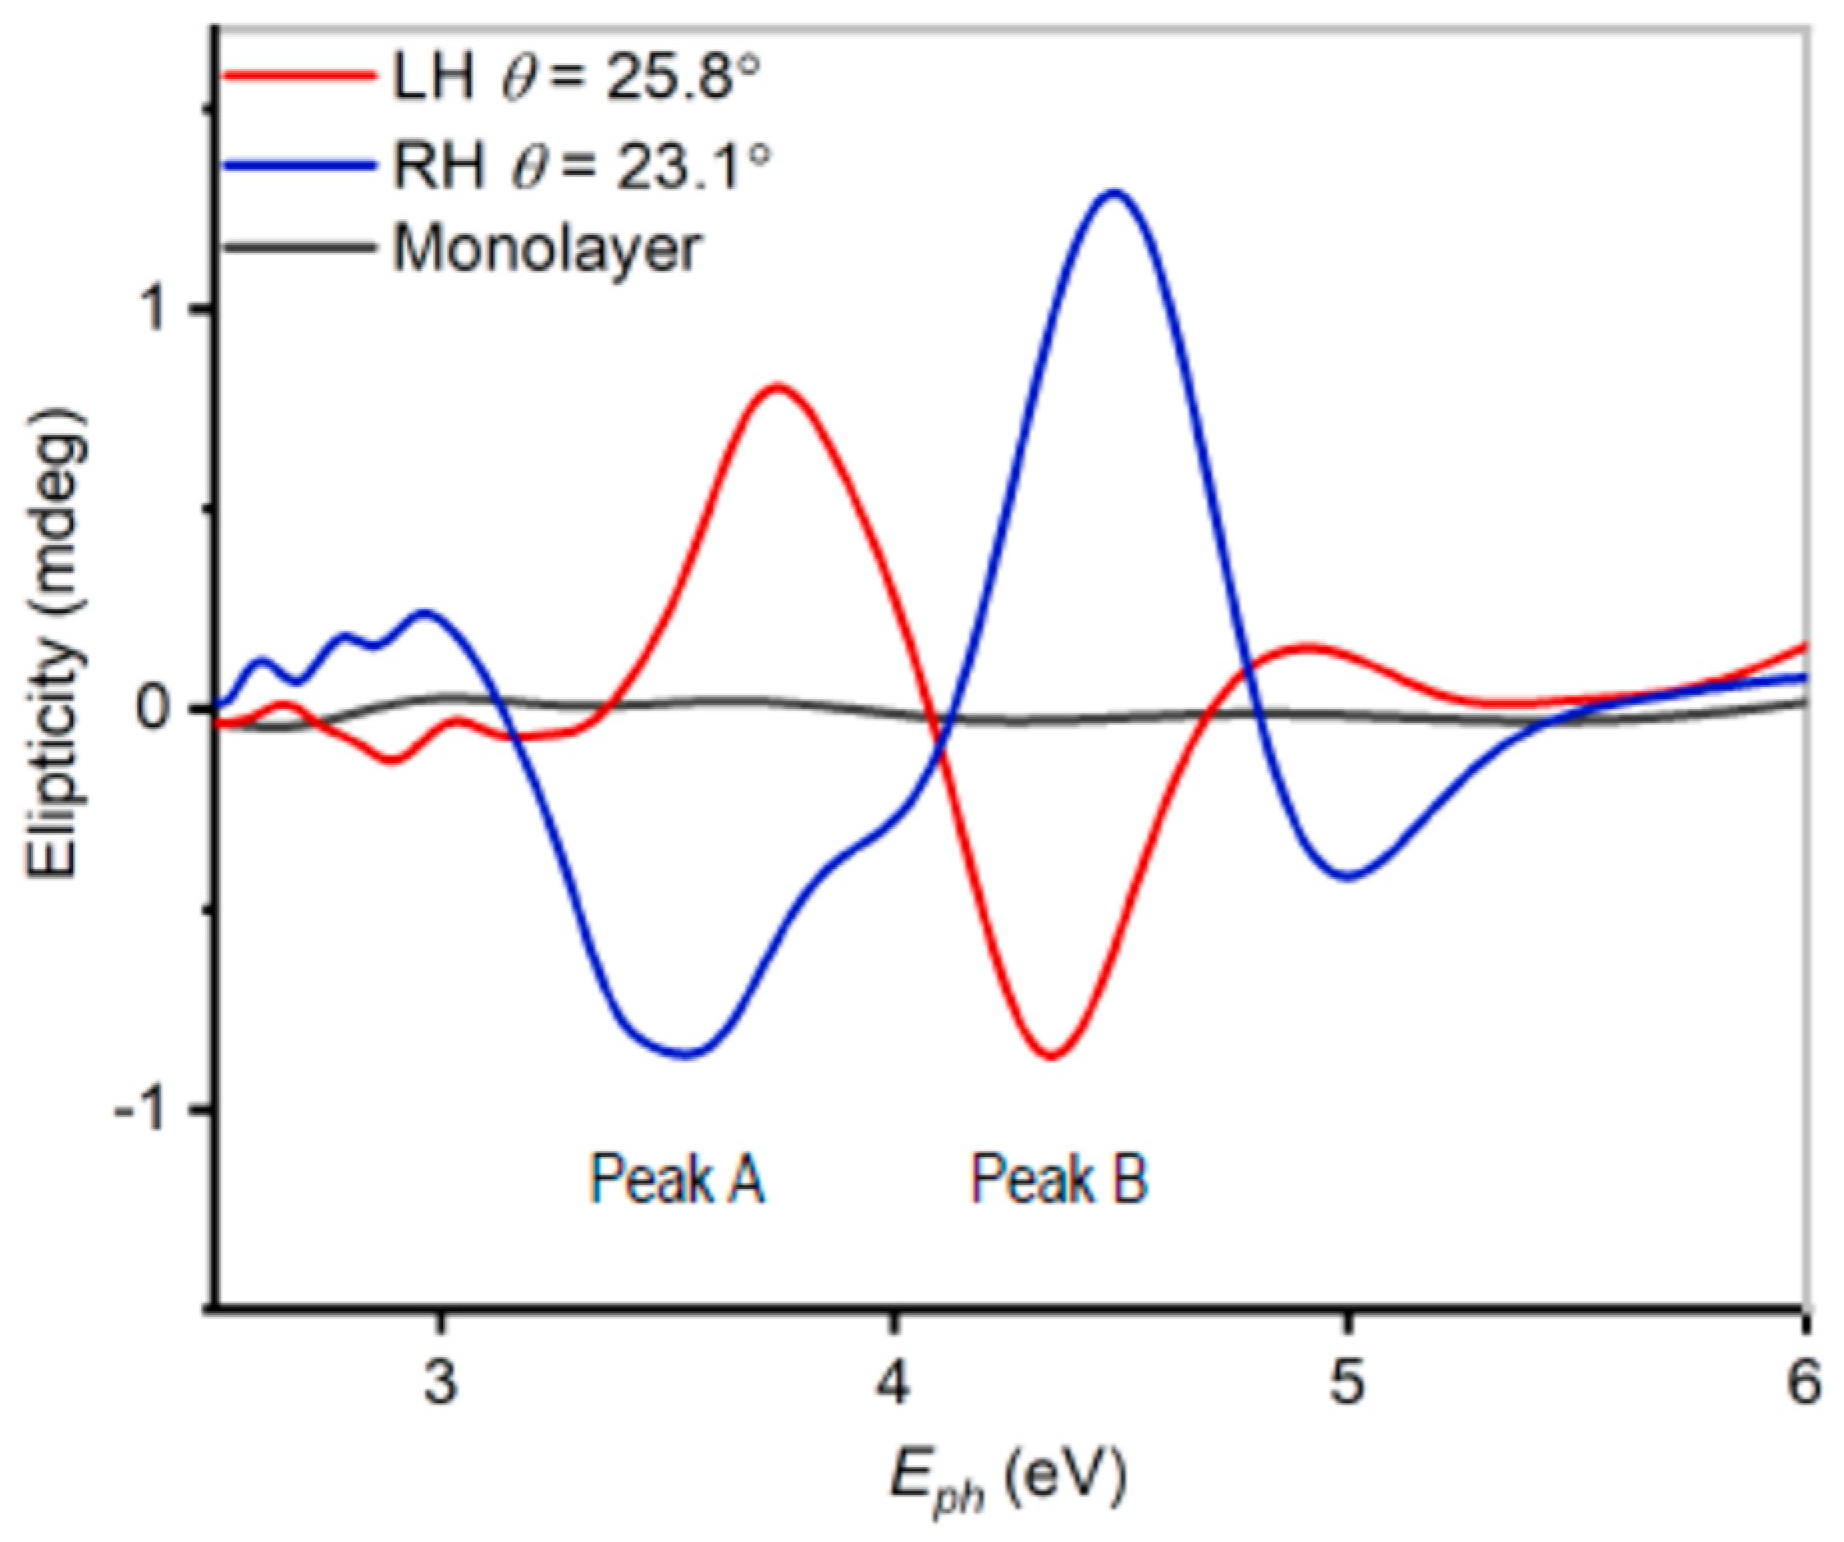
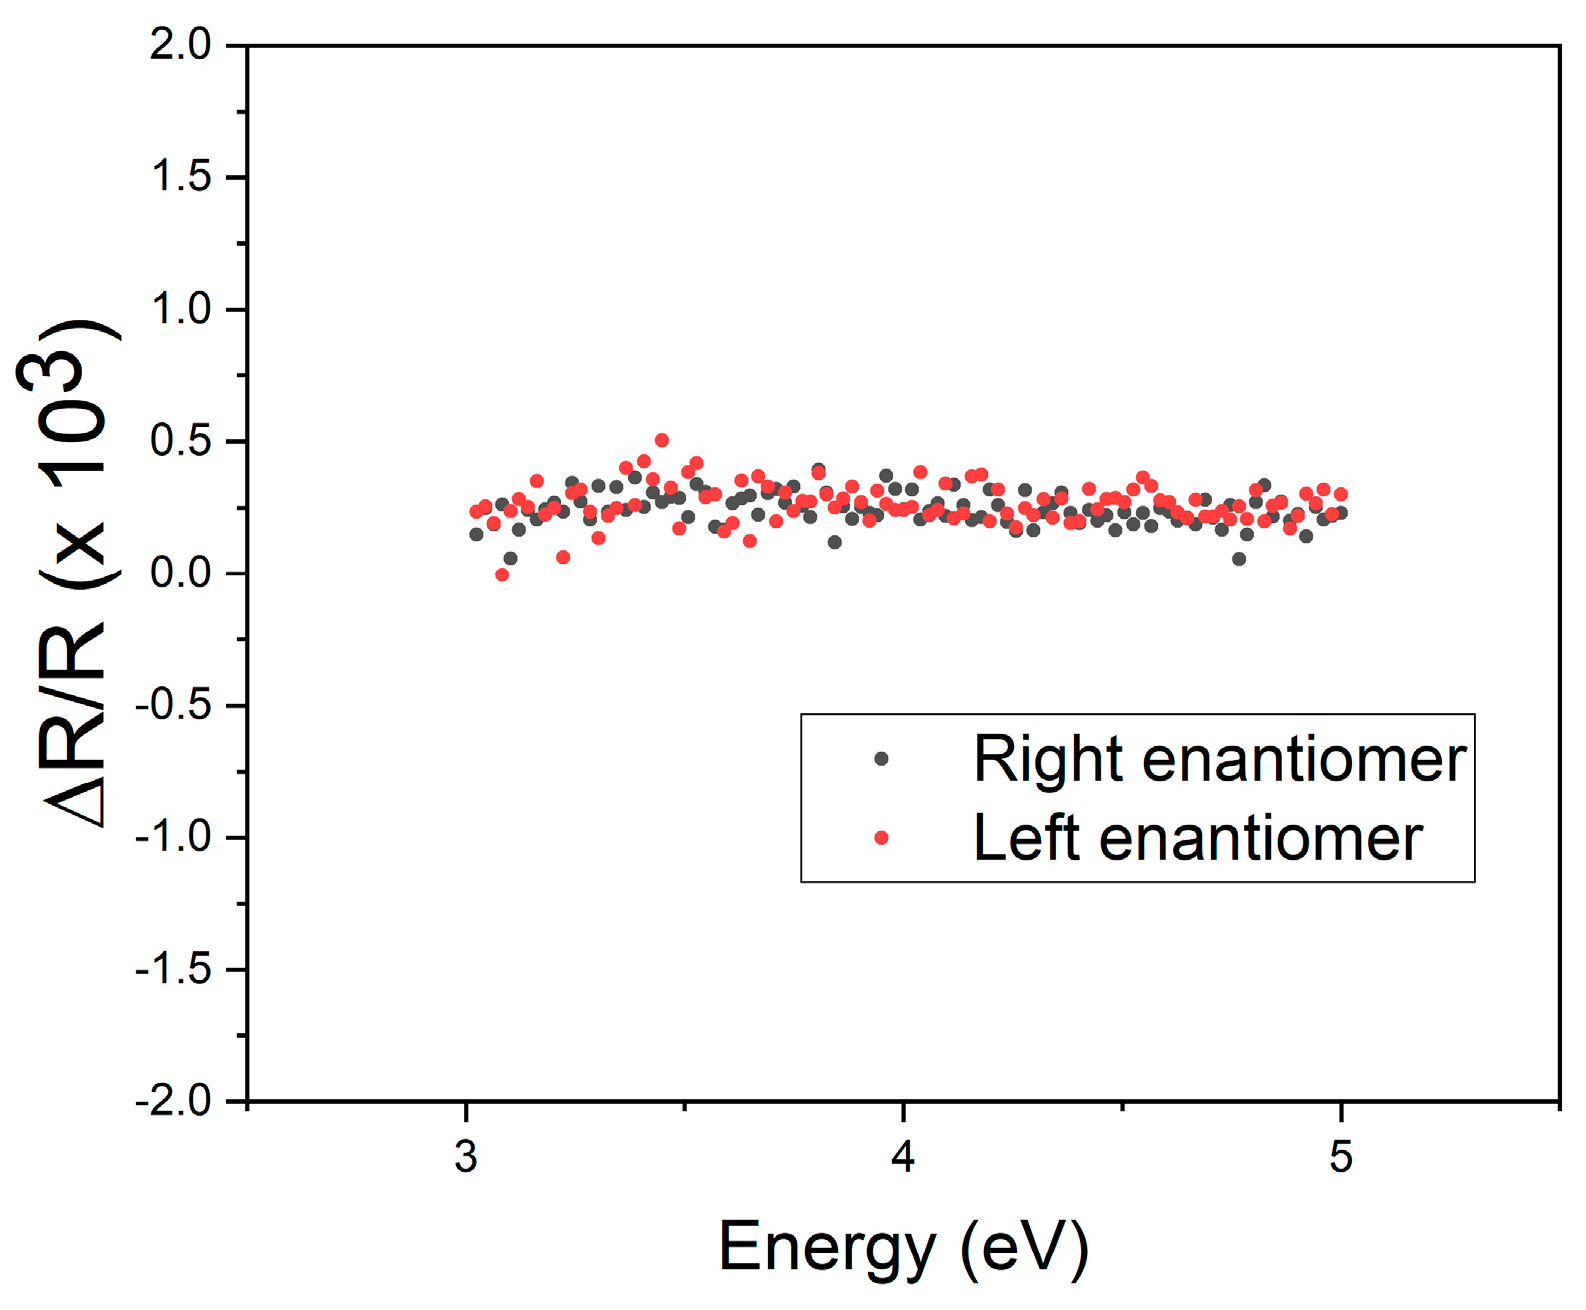
3. Results
4. Conclusions
Author Contributions
Funding
Data Availability Statement
Acknowledgments
Conflicts of Interest
References
- Kelvin, L. The Molecular Tactics of a Crystal; Clarendon Press: Oxford, UK, 1894. [Google Scholar]
- Barron, L.D. Symmetry and molecular chirality. Chem. Soc. Rev. 1986, 15, 189. [Google Scholar] [CrossRef]
- Yan, B. Structural Chirality and Electronic Chirality in Quantum Materials. Annu. Rev. Mater. Res. 2024, 54, 97–115. [Google Scholar] [CrossRef]
- Barron, L.D. Symmetry and chirality: Where physics shakes hands with chemistry and biology. Isr. J. Chem. 2021, 61, 517. [Google Scholar] [CrossRef]
- Zor, E.; Bingol, H.; Ersoz, M. Chiral sensors. TrAC Trends Anal. Chem. 2019, 121, 115662. [Google Scholar] [CrossRef]
- Brandenburg, A. Chirality in Astrophysics. In Chiral Matter—Proceedings of the Nobel Symposium; World Scientific Publishing Co. Pte. Ltd.: Singapore, 2023; Volume 167, p. 15. [Google Scholar]
- Zhang, L.; Wang, T.; Jiang, J.; Liu, M. Chiral porphyrin assemblies. Aggregate 2023, 4, e198. [Google Scholar] [CrossRef]
- Kingsbury, C.J.; Senge, M.O. The shape of porphyrins. Coord. Chem. Rev. 2021, 431, 213760. [Google Scholar] [CrossRef]
- Liu, M.; Zhang, L.; Wang, T. Supramolecular chirality in self-assembled systems. Chem. Rev. 2015, 115, 7304. [Google Scholar] [CrossRef]
- Monti, D. Recent Advancements in Chiral Porphyrin Self-Assembly. In Synthesis and Modification of Porphyrinoids—Topics in Heterocyclic Chemistry; Paolesse, R., Ed.; Springer: Berlin/Heidelberg, Germany, 2014; Volume 33, p. 231. [Google Scholar]
- Hembury, G.A.; Borovkov, V.V.; Inoue, Y. Chirality-sensing supramolecular systems. Chem. Rev. 2008, 108, 1–73. [Google Scholar] [CrossRef]
- Hwang, M.; Yeom, B. Fabrication of chiral materials in nano-and microscale. Chem. Mater. 2021, 33, 807. [Google Scholar] [CrossRef]
- Han, Z.; Wang, F.; Sun, J.; Wang, X.; Tang, Z. Recent advances in ultrathin chiral metasurfaces by twisted stacking. Adv. Mater. 2023, 35, 2206141. [Google Scholar] [CrossRef] [PubMed]
- Mu, X.; Hu, L.; Cheng, Y.; Fang, Y.; Sun, M. Chiral surface plasmon-enhanced chiral spectroscopy: Principles and applications. Nanoscale 2021, 13, 581. [Google Scholar] [CrossRef]
- Huang, S.; Xu, X. Optical chirality detection using a topological insulator transistor. Adv. Opt. Mater. 2021, 9, 2002210. [Google Scholar] [CrossRef]
- Tomei, I.; Bonanni, B.; Sgarlata, A.; Fanfoni, M.; Martini, R.; Di Filippo, I.; Magna, G.; Stefanelli, M.; Monti, D.; Paolesse, R.; et al. Chiral Porphyrin Assemblies Investigated by a Modified Reflectance Anisotropy Spectroscopy Spectrometer. Molecules 2023, 28, 3471. [Google Scholar] [CrossRef] [PubMed]
- Weightman, P.; Martin, D.S.; Cole, R.J.; Farrell, T. Reflection anisotropy spectroscopy. Rep. Progr. Phys. 2005, 68, 1251. [Google Scholar] [CrossRef]
- Kamiya, I.; Aspnes, D.E.; Florez, L.T.; Harbison, J.P. Reflectance-difference spectroscopy of (001) GaAs surfaces in ultrahigh vacuum. Phys. Rev. B 1992, 46, 15894. [Google Scholar] [CrossRef] [PubMed]
- Hofmann, P.; Rose, K.C.; Fernandez, V.; Bradshaw, A.M.; Richter, W. Study of Surface States on Cu(110) Using Optical Reflectance Anisotropy. Phys. Rev. Lett. 1995, 75, 2039. [Google Scholar] [CrossRef]
- Goletti, C.; Bussetti, G.; Arciprete, F.; Chiaradia, P.; Chiarotti, G. Infrared surface absorption in Si(111)2×1 observed with reflectance anisotropy spectroscopy. Phys. Rev. B 2002, 66, 153307. [Google Scholar] [CrossRef]
- Shkrebtii, A.I.; Esser, N.; Richter, W.; Schmidt, W.G.; Bechstedt, F.; Fimland, B.O.; Kley, A.; Del Sole, R. Reflectance anisotropy of GaAs (100): Theory and experiment. Phys. Rev. Lett. 1998, 81, 721. [Google Scholar] [CrossRef]
- Goletti, C.; Bussetti, G.; Violante, A.; Bonanni, B.; Di Giovannantonio, M.; Serrano, G.; Breuer, S.; Gentz, K.K.; Wandelt, K. Cu(110) Surface in Hydrochloric Acid Solution: Potential Dependent Chloride Adsorption and Surface Restructuring. J. Phys. Chem. C 2015, 119, 1782. [Google Scholar] [CrossRef]
- Yivlialin, R.; Brambilla, L.; Accogli, A.; Gibertini, E.; Tommasini, M.; Goletti, C.; Leone, M.; Duò, L.; Magagnin, L.; Castiglioni, C.; et al. Evidence of graphite blister evolution during the anion de-intercalation process in the cathodic regime. Appl. Surf. Sci. 2020, 504, 144440. [Google Scholar] [CrossRef]
- Serrano, G.; Bonanni, B.; Kosmala, T.; Di Giovannantonio, M.; Diebold, U.; Wandelt, K.; Goletti, C. In situ scanning tunneling microscopy study of Ca-modified rutile TiO2(110) in bulk water. Beilstein J. Nanotechnol. 2015, 6, 438–443. [Google Scholar] [CrossRef] [PubMed]
- Goletti, C.; Bussetti, G.; Chiaradia, P.; Sassella, A.; Borghesi, A. Highly sensitive optical monitoring of molecular film growth by organic molecular beam deposition. Appl. Phys. Lett. 2003, 83, 4146. [Google Scholar] [CrossRef]
- Sun, L.; Berkebile, S.; Weidlinger, G.; Koller, G.; Hohage, M.; Netzer, F.P.; Ramsey, M.; Zeppenfeld, P. Revealing the buried interface: Para-sexiphenyl thin films grown on TiO2(110). Phys. Chem. Chem. Phys. 2010, 12, 3141. [Google Scholar] [CrossRef] [PubMed]
- Zhao, B.; Yang, S.; Deng, J.; Pan, K. Chiral Graphene Hybrid Materials: Structures, Properties, and Chiral Applications. Adv. Sci. 2021, 8, 2003681. [Google Scholar] [CrossRef]
- Nechayev, S.; Barczyk, R.; Mick, U.; Banzer, P. Substrate-Induced Chirality in an Individual Nanostructure. ACS Photonics 2019, 6, 1876. [Google Scholar] [CrossRef]
- Berg, A.M.; Patrick, D.L. Preparation of Chiral Surfaces from Achiral Molecules by Controlled Symmetry Breaking. Angew. Chem. Int. Ed. 2005, 44, 1821–1823. [Google Scholar] [CrossRef] [PubMed]
- Kuroda, R.; Harada, T.; Shindo, Y. A solid-state dedicated circular dichroism spectrophotometer: Development and application. Rev. Sci. Instrum. 2001, 72, 3802. [Google Scholar] [CrossRef]
- Kuroda, R.; Harada, T.; Takahashi, H. Fast and artifact-free circular dichroism measurement of solid-state structural changes. Chirality 2024, 36, e3622. [Google Scholar] [CrossRef]
- Kuroda, R. Solid-state Chiroptical spectroscopy-rich information provided but attention needed. Chapter 30. In Chiral Luminescence: From Molecules to Materials and Devices; Akagi, K., Ed.; Wiley-VCH. Inc.: Weinheim, Germany, 2023; in press. [Google Scholar]
- Salvati, A.; Chiaradia, P. Analysis of reflectometers for surface anisotropy. Appl. Opt. 2000, 39, 5820. [Google Scholar] [CrossRef]
- Kemp, J.C. Piezo-Optical Birefringence Modulators: New Use for a Long-Known Effect. J. Opt. Soc. Am. 1969, 59, 950–954. [Google Scholar] [CrossRef]
- Berkovits, V.L.; Kiselev, V.A.; Safarov, V.I. Optical spectroscopy of (110) surfaces of III–V semiconductors. Surf. Sci. 1989, 211, 489. [Google Scholar] [CrossRef]
- Available online: https://jascoinc.com/products/spectroscopy/circular-dichroism/ (accessed on 10 August 2024).
- Yang, S.J.; Jung, J.-H.; Lee, E.; Han, E.; Choi, M.-Y.; Jung, D.; Choi, S.; Park, J.-H.; Oh, D.; Noh, S.; et al. Wafer-Scale Programmed Assembly of One-Atom-Thick Crystals. Nano Lett. 2022, 22, 1518. [Google Scholar] [CrossRef] [PubMed]
- Kim, C.-J.; Sánchez-Castillo, A.; Ziegler, Z.; Ogawa, Y.; Noguez, C.; Park, J. Chiral atomically thin films. Nat. Nanotechnol. 2016, 11, 520. [Google Scholar] [CrossRef]
- Goletti, C.; Bussetti, G.; Chiaradia, P.; Sassella, A.; Borghesi, A. In situ optical investigation of oligothiophene layers grown by organic molecular beam epitaxy. J. Phys. Condens. Matter 2004, 16, S4393. [Google Scholar] [CrossRef]
- Compton, O.C.; Nguyen, S.T. Graphene Oxide, Highly Reduced Graphene Oxide, and Graphene: Versatile Building Blocks for Carbon-Based Materials. Small 2010, 22, 711. [Google Scholar] [CrossRef] [PubMed]
- Available online: https://pnrr.inaf.it/progetto-stiles/ (accessed on 10 August 2024).
- Hazen, R.M. Geochemical origins of life. In Fundamentals of Geobiology; Knoll, A.H., Canfield, D.E., Konhauser, K.O., Eds.; Wiley-Blackwell: Oxford, UK, 2012; pp. 315–332. [Google Scholar]
- Hazen, R.M. Enantioselective adsorption on rock-forming minerals: A thought experiment. Surf. Sci. 2014, 629, 11. [Google Scholar] [CrossRef]
- Available online: https://hazen.carnegiescience.edu/publications/astrobiology-origin-life (accessed on 10 August 2024).
- Song, G.; Hao, H.; Yan, S.; Fang, S.; Xu, W.; Tong, L.; Zhang, J. Observation of Chirality Transfer in Twisted Few-Layer Graphene. ACS Nano 2024, 18, 17578. [Google Scholar] [CrossRef]
- Carr, S.; Massatt, D.; Fang, S.; Cazeaux, P.; Luskin, M.; Kaxiras, E. Twistronics: Manipulating the electronic properties of two-dimensional layered structures through their twist angle. Phys. Rev. B 2017, 95, 075420. [Google Scholar] [CrossRef]
- Ciarrocchi, A.; Tagarelli, F.; Avsar, A.; Kis, A. Excitonic devices with van der Waals heterostructures: Valleytronics meets twistronics. Nat. Rev. Mater. 2022, 7, 449–464. [Google Scholar] [CrossRef]
- Zhu, H.; Yakobson, B.I. Creating chirality in the nearly two dimensions. Nat. Mater. 2024, 23, 316–322. [Google Scholar] [CrossRef]
Disclaimer/Publisher’s Note: The statements, opinions and data contained in all publications are solely those of the individual author(s) and contributor(s) and not of MDPI and/or the editor(s). MDPI and/or the editor(s) disclaim responsibility for any injury to people or property resulting from any ideas, methods, instructions or products referred to in the content. |
© 2024 by the authors. Licensee MDPI, Basel, Switzerland. This article is an open access article distributed under the terms and conditions of the Creative Commons Attribution (CC BY) license (https://creativecommons.org/licenses/by/4.0/).
Share and Cite
Tomei, I.; Pierucci, F.; Bonanni, B.; Sgarlata, A.; Fanfoni, M.; Yang, S.-J.; Kim, C.-J.; Goletti, C. Circular Dichroism Reflectance Anisotropy of Chiral Atomically Thin Films. Chemosensors 2024, 12, 170. https://doi.org/10.3390/chemosensors12090170
Tomei I, Pierucci F, Bonanni B, Sgarlata A, Fanfoni M, Yang S-J, Kim C-J, Goletti C. Circular Dichroism Reflectance Anisotropy of Chiral Atomically Thin Films. Chemosensors. 2024; 12(9):170. https://doi.org/10.3390/chemosensors12090170
Chicago/Turabian StyleTomei, Ilaria, Filippo Pierucci, Beatrice Bonanni, Anna Sgarlata, Massimo Fanfoni, Seong-Jun Yang, Cheol-Joo Kim, and Claudio Goletti. 2024. "Circular Dichroism Reflectance Anisotropy of Chiral Atomically Thin Films" Chemosensors 12, no. 9: 170. https://doi.org/10.3390/chemosensors12090170
APA StyleTomei, I., Pierucci, F., Bonanni, B., Sgarlata, A., Fanfoni, M., Yang, S.-J., Kim, C.-J., & Goletti, C. (2024). Circular Dichroism Reflectance Anisotropy of Chiral Atomically Thin Films. Chemosensors, 12(9), 170. https://doi.org/10.3390/chemosensors12090170