Article

A Novel Colorimetric Biosensor for the Detection of Catalase-Positive Staphylococcus aureus Based on an Onion-like Carbon Nanozyme

1
Key Laboratory of Photochemical Conversion and Optoelectronic Materials, Technical Institute of Physics and Chemistry, Chinese Academy of Sciences, Beijing 100190, China
2
University of Chinese Academy of Sciences, Beijing 100049, China
*
Author to whom correspondence should be addressed.
Chemosensors 2024, 12(9), 176; https://doi.org/10.3390/chemosensors12090176
Submission received: 28 June 2024 / Revised: 27 August 2024 / Accepted: 30 August 2024 / Published: 2 September 2024
(This article belongs to the Collection pH Sensors, Biosensors and Systems)

Abstract

:
Staphylococcus aureus is one of the leading causes of skin and soft tissue infections, and it is even life-threatening if it enters the bloodstream, lung or heart. In the present work, we proposed a novel colorimetric biosensor for the detection of S. aureus through hydrogen peroxide consumption. An onion-like carbon nanozyme with high peroxidase-like activity was prepared, which competed with the endogenous catalase of S. aureus in consuming hydrogen peroxide. This reaction was further characterized by the colorimetric reaction of 3,3′,5,5′-tetramethylbenzidine. The results showed that our approach allowed for the simple and rapid determination of S. aureus, with a linear range of 2 × 10⁴ to 2 × 10⁷ CFU/mL. Moreover, our method displayed good selectivity, with Bacillus subtilis and Escherichia coli showing negligible responses at the concentration of 2 × 10⁵ CFU/mL. The application of the as-prepared biosensor to analyze S. aureus in real water samples yielded recovery rates ranging from 95% to 112%, with relative standard deviations less than 7%. The method demonstrated good accuracy and specificity, which offers a novel approach for the simple and selective detection of S. aureus.

1. Introduction

Bacterial infections are among the leading causes of illness and death, which presents a growing risk to public health. Staphylococcus aureus is among the most prevalent pathogens, causing a spectrum of infections including severe inflammation, skin ulceration, and suppuration [1,2,3], as well as more serious conditions such as endocarditis [4], pneumonia [5], and meningitis [6]. Despite the fact that regulations have been enacted to restrict S. aureus contamination, persistent risks remain in environments such as medical facilities [7]. Moreover, the presence of food-borne pathogens in meat and meat products poses a significant risk of infection to consumers, with livestock-associated workers at heightened risk of colonization and potential transmission [8,9]. Therefore, there is an urgent need to develop rapid and efficient techniques capable of detecting S. aureus and promptly identifying potential outbreaks.
The plate-counting approach, which has been the standard method for S. aureus detection, is a conventional culture-dependent microbiological method that is used to observe and enumerate viable microorganisms. In this method, bacterial concentration is reported as colony-forming units (CFUs), which is presumed to originate from a certain microorganism, and the bacterial colonies can also reflect specific characteristic features, such as color, size and shape. However, it usually requires several days to achieve trustworthy results, which no longer meets the demands for rapid pathogenic detection [10]. Consequently, considerable efforts have been directed towards the development of rapid detection methods. Polymerase chain reaction (PCR) and fluorescence-linked immunosorbent assay (FLISA) have significantly reduced the detection time to a few hours [11,12]. Biosensors are capable of converting signals arising from interactions between biological components and analytes into detectable physicochemical signals, which have been extensively used in applications ranging from medical treatment to environmental monitoring. Among them, colorimetric biosensors have emerged as a promising platform for rapid bacterial recognition [13,14]. These biosensors enable the quantitative measurement of specific analytes through chromogenic or discoloration reactions, such as nanozyme-mediated colorimetric reactions or the localized surface plasmon resonance of noble metal nanoparticles. Their merits of cost-effectiveness, straightforward interpretation of results, and rapid response render them well-suited for the on-site detection of S. aureus [15,16,17].
S. aureus is one of the representative Gram-positive bacteria, with most strains being catalase (CAT)-positive and capable of catalyzing the decomposition of hydrogen peroxide (H2O2) into O2 and water [18,19]. Catalase production represents a defense mechanism, allowing bacteria to better resist intracellular and extracellular killing by H2O2. The catalase-negative strain is observed to possess much lower pathogenic potential than the catalase-positive strain, which may contribute to the predominance of the catalase-positive strain in bacterial infections. Utilizing the endogenous catalase of S. aureus, Guarín et al. proposed an electrochemical sensor to monitor H2O2 consumption by S. aureus. Using a screen-printed gold electrode modified with cysteine and peroxidase (POD), this method demonstrated a sensitive response to H2O2, enabling the detection of S. aureus ranging from 3 × 10² to 3 × 10⁸ CFU/mL, with a detection limit of 102 CFU/mL [20]. Majumdar et al. applied an amperometric approach to detect H2O2 consumption for the quantification of S. aureus at a Pt microelectrode. This work realized the quantification of S. aureus in the range from 10 CFU/mL to 106 CFU/mL within 10 min [21]. Abdelhamid et al. reported a fluorescent biosensor based on chitosan modified CdS quantum dots, in which S. aureus showed accelerated decomposition of H2O2, resulting in a significant quenching of fluorescence emission, thereby offering high selectivity for CAT-positive S. aureus over Bacillus subtilis and Escherichia coli [22]. In comparison to other assays for the detection of S. aureus, these three biosensors offer the benefits of short detection periods and broad detection ranges. Also, the sensor preparation process is simplified as no additional recognition units are required.
Nanozymes, defined as nanomaterials with enzyme-like catalytical activity, have attracted increasing attention in biosensing applications over the past few years [23,24,25]. These nanozyme-based enzymatic reactions can generate or amplify signals for precise target detection, among which POD-like and oxidase-like nanozymes are commonly employed in biosensor construction. POD is defined as a class of oxidoreductases that catalyze the oxidation of a substrate by hydrogen peroxide or an organic peroxide [26]. Nanozymes that exhibit mimic peroxidase activity are known as POD-like nanozymes [27]. In addition to catalytic properties, nanomaterials offer enhanced electrical conductivity and compatibility with biorecognition elements, thereby improving biosensor performance. Onion-like carbon (OLC) is a carbonaceous nanomaterial with stacked layers of sp2 graphene sheets and exhibits high POD catalytic ability [28,29,30,31,32,33,34]. Its highly symmetric structure and large volume-to-surface ratio make it promising for applications in energy storage and pollutant degradation [35,36]. In the field of biosensing, OLC can be utilized as a modification material to increase the conductivity and biocompatibility of the electrodes [37,38,39,40]. OLC can serve as an effective linker between biomolecules and nanomaterials, facilitating electron transfer and signal amplification. Therefore, in combination with the intrinsic POD-like property of OLC, it is promising in the construction of biosensors with high sensitivity and specificity.
Herein, we proposed a novel approach for S. aureus detection utilizing its endogenous CAT activity. The accelerated consumption of H2O2 catalyzed by CAT was characterized using a colorimetric reaction involving 3,3′,5,5′-tetramethylbenzidine (TMB) in the presence of OLC. The analytical performance and anti-interference ability of the as-prepared colorimetric biosensor were examined. Additionally, the recovery experiments were conducted using real water samples to assess the feasibility of the present method in practical scenarios. The present work provided a simple and rapid approach for the detection of CAT-positive bacteria, which can be used in pathogen monitoring and environmental early warning.

2. Materials and Methods

2.1. Reagents and Materials

Staphylococcus aureus (ATCC 6538), Escherichia coli (ATCC 25922) and Bacillus subtilis (CGMCC 1.1086) were provided by the Testing Center for Antimicrobial Materials, Technical Institute of Physics and Chemistry, Chinese Academy of Sciences. Additionally, 3,3′,5,5′-tetramethylbenzidine (TMB), acetic acid (>99.7%) and dimethyl sulfoxide (DMSO) were provided by Macklin Co., Ltd. (Shanghai, China). Sodium acetate and 2,2′-azinobis(3-ethylbenzothiazoline-6-sulfonic acid ammonium salt) (ABTS) were provided by InnoChem Co., Ltd. (Shanghai, China). Hydrogen peroxide (H2O2) was purchased from Aladdin Co., Ltd. (Shanghai, China). Lysostaphin was provided by Sangon Co., Ltd. (Shanghai, China). Nutrient broth and nutrient agar were purchased from Haibo Co., Ltd. (Qingdao, China). Nanodiamonds (NDs) were purchased from Carbodeon (Finland). Phosphate-buffered saline (PBS, 0.1 M, pH = 7) and Tris-HCl buffer (0.05 M, pH = 7.4, sterile) were provided by Regan Co., Ltd. (Beijing, China). All chemicals were of reagent grade and used as received. Aqueous solutions were prepared with Milli-Q water (Millipore Merck, Burlington, MA, USA, R > 18.2 MΩ·cm). Real water samples were collected from the tap-water pipe.

2.2. Preparation of Onion-like Carbon Nanozyme

OLC was obtained by annealing NDs in an N2 atmosphere at 800 °C for 1 h. The morphology of as-prepared OLC was characterized by high-resolution transmission electron microscopy (TEM, JEOL JEM-2100F, Tokyo, Japan). The phase structure of OLC was obtained using an X-ray diffractometer (Bruker D8 focus, Karlsruhe, Germany). The composition of OLC was characterized using a Raman spectrometer (Renishaw InVia-Qontor, New Mills, UK) with an excitation light at 532 nm.

2.3. Detection of the POD-like Catalytic Activity of Onion-like Carbon Nanozyme

Chromogenic reactions based on TMB-H2O2 and ABTS-H2O2 double-substrate systems were used to detect the POD-like properties of the OLC nanozyme. Experiments on the TMB-H2O2 reaction were carried out with 250 μg/mL of OLC, 1 mM of H2O2 and 0.5 mM of TMB in 0.2 M NaAc-HAc buffer (pH = 4). The mixed solution was incubated at 37 °C for 10 min. Experiments on the ABTS-H2O2 reaction were performed in 0.2 M NaAc-HAc buffer (pH = 4) containing 250 μg/mL of OLC, 1 mM of H2O2 and 1 mM of ABTS. The mixed solution was placed at 37 °C for 10 min.

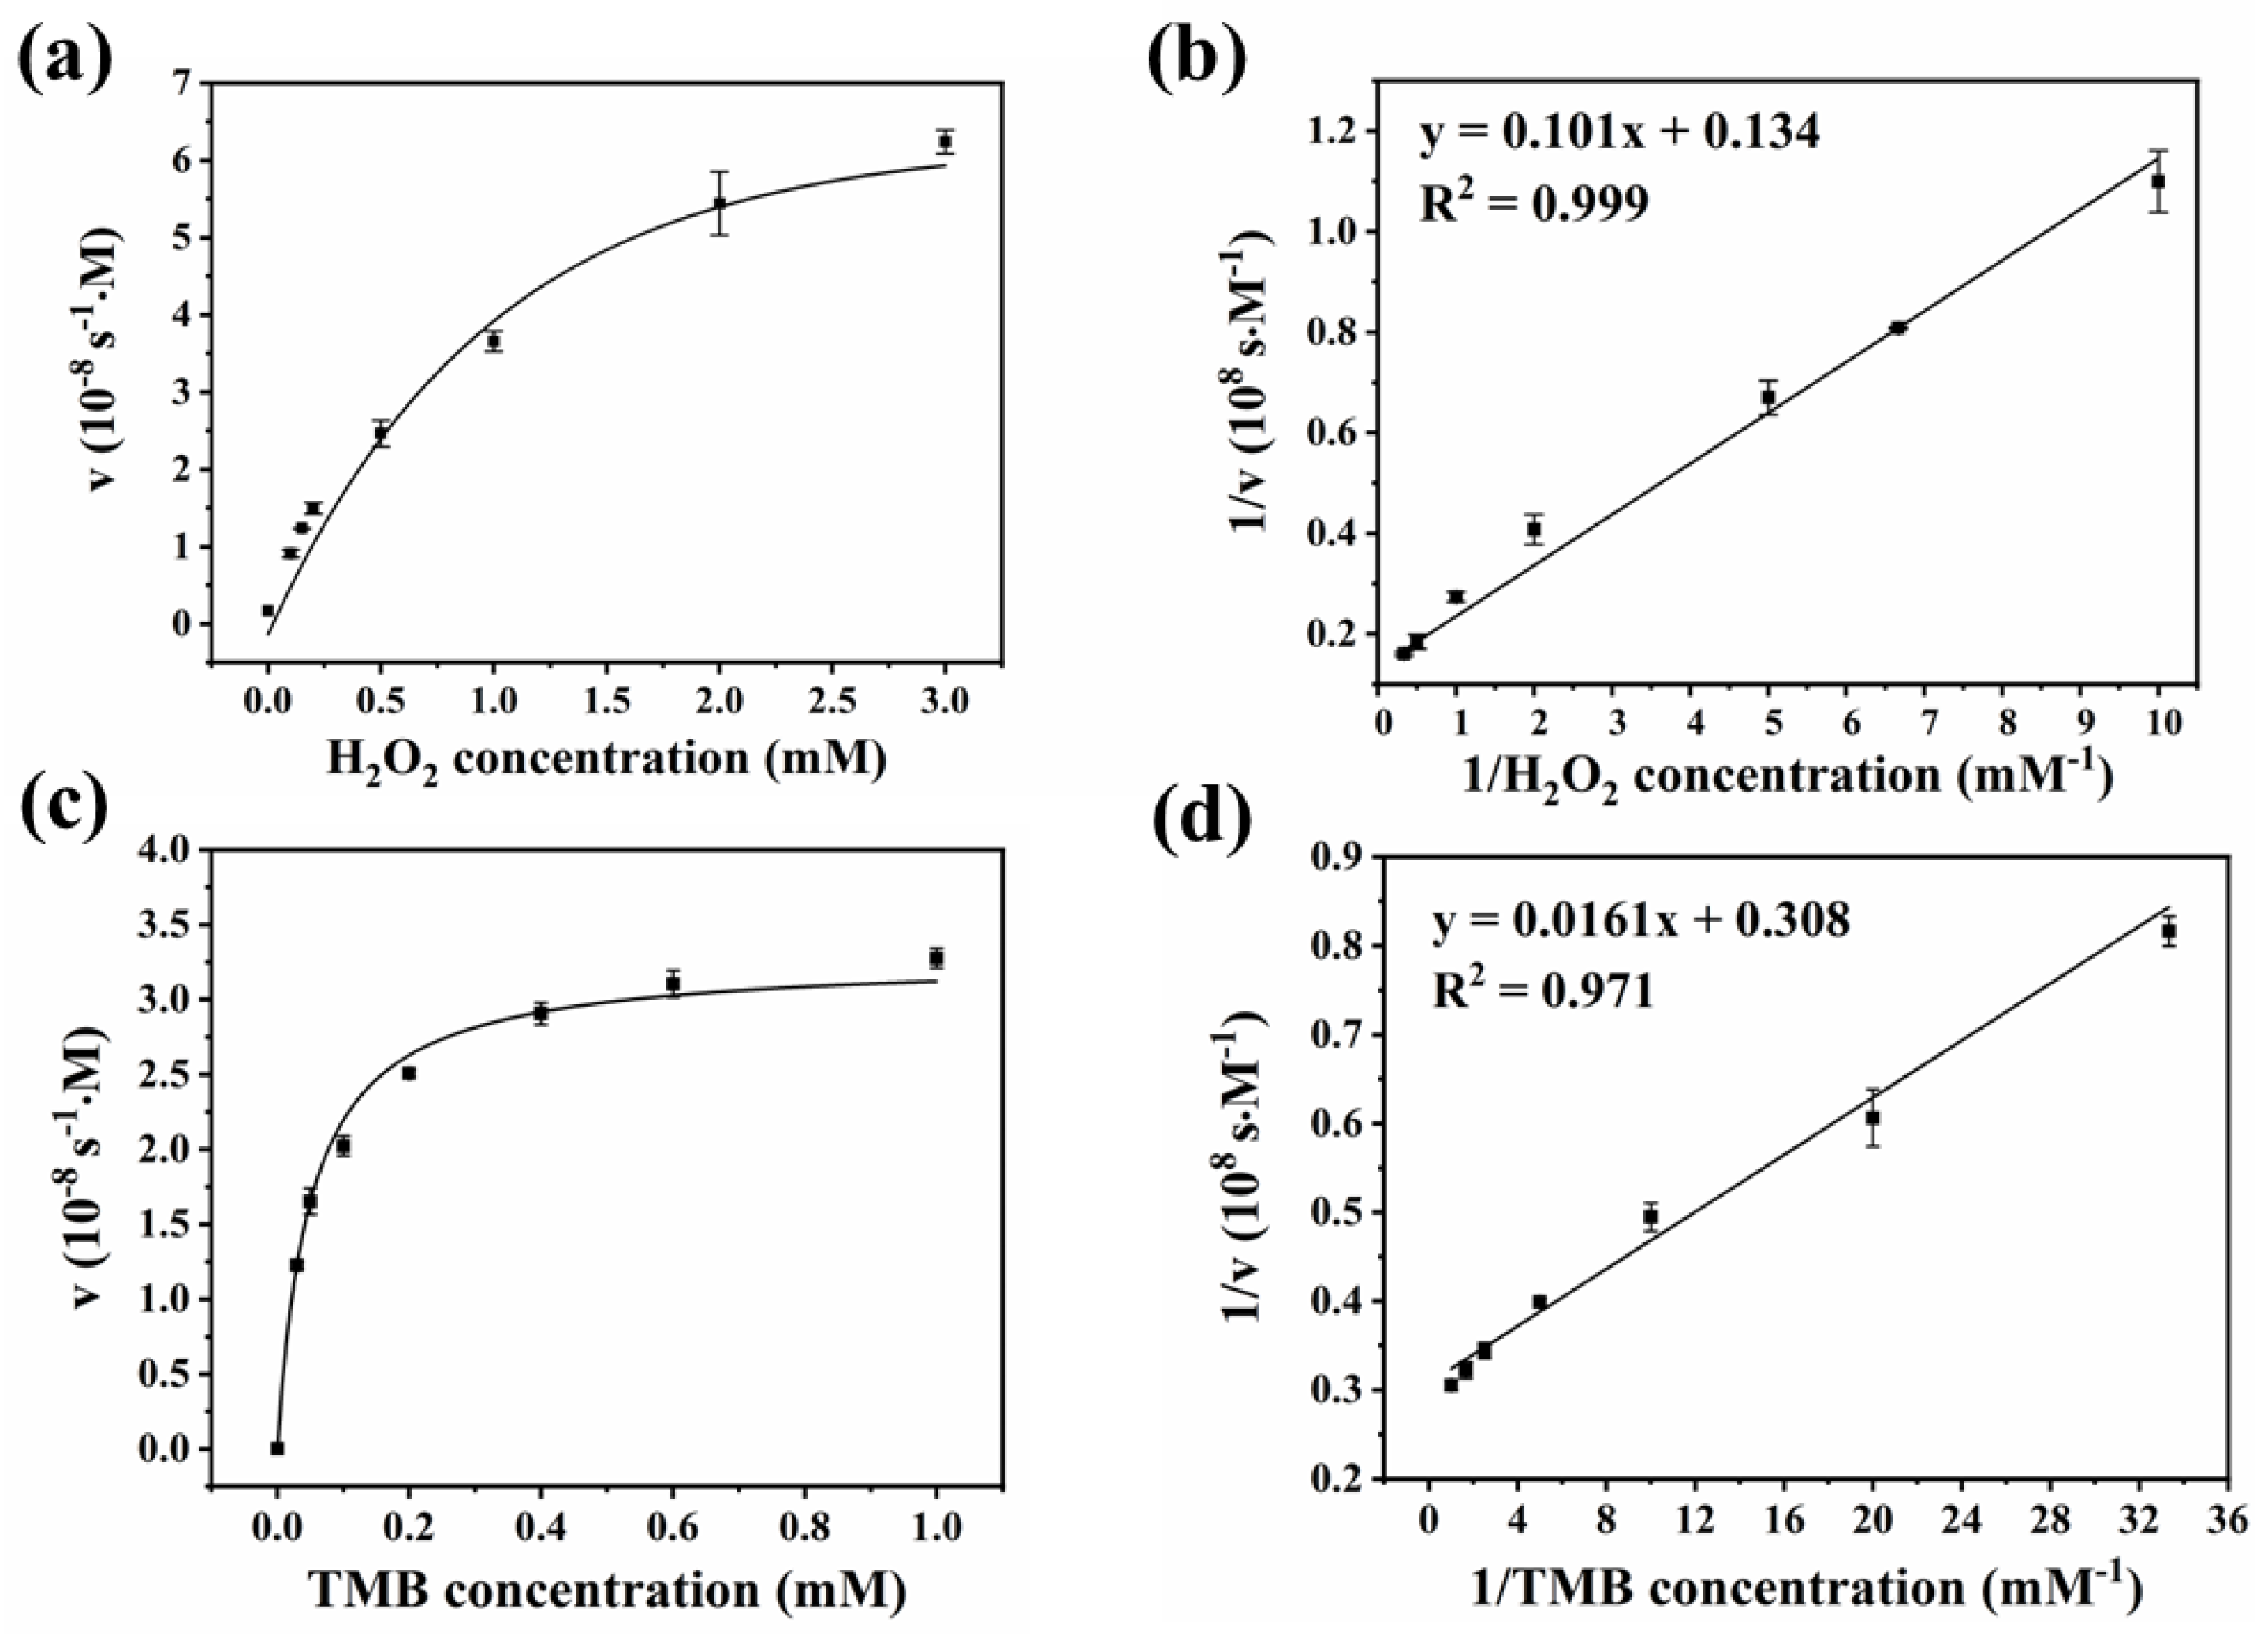
2.4. Catalytic Kinetic Determination of OLC’s POD-like Activity

The catalytic kinetic determination of OLC was carried out using TMB and H2O2 as substrates. The catalytic reaction was carried out in 0.2 M NaAc-HAc buffer (pH = 4). The concentration of OLC was 100 μg/mL. The concentration of TMB was 1 mM in the kinetic assay of H2O2 and the concentration of H2O2 was 1 mM in the kinetic assay of TMB. After reacting at room temperature for 10 min, the reaction mixture was filtered by a needle filter (0.22 μm × 13 mm), and the absorbance of the supernatant at 652 nm was measured on an ultraviolet-visible spectrophotometer (SECOMAM UVIKONXL). The Michaelis–Menten equation was used to calculate the Michaelis constant (KM) and maximum reaction rate (Vmax).

2.5. Bacterial Culture

The bacteria were cultured in LB broth that contained 10 g/L peptone, 3 g/L beef extract and 5 g/L NaCl. The broth was sterilized by autoclaving at 121 °C for 15 min. After cooling to room temperature, the bacteria were inoculated into the sterilized culture medium and cultured aerobically in a shaker at 37 °C. The culture time for S. aureus, E. coli and B. subtilis were 24 h, 16 h and 24 h, respectively. Subsequently, the microbial cells were harvested by centrifugation at 6000 rpm for 5 min and washed twice with PBS. The harvested bacteria were re-dispersed in Tris-HCl buffer, and the OD600 value of the bacterial solution was adjusted to 1.5 using an ultraviolet-visible spectrophotometer (SECOMAM UVIKONXL).
The concentration of bacteria was further determined by the plate-counting method according to the following procedure: First, the agar liquid medium that contained 10 g/L of peptone, 5 g/L of sodium chloride, 3 g/L of beef extract and 15 g/L of agar was well mixed and sterilized at 121 °C. After cooling to 46 °C, the liquid agar medium was poured onto the culture dishes and allowed to solidify at room temperature. Then, 100 μL of bacteria solution was added to the agar plate and spread evenly using a cell spreader. The plate was then flipped over and incubated for 24 h at 37 °C. After incubating, a colony counter was used to read the total number of bacterial colonies.

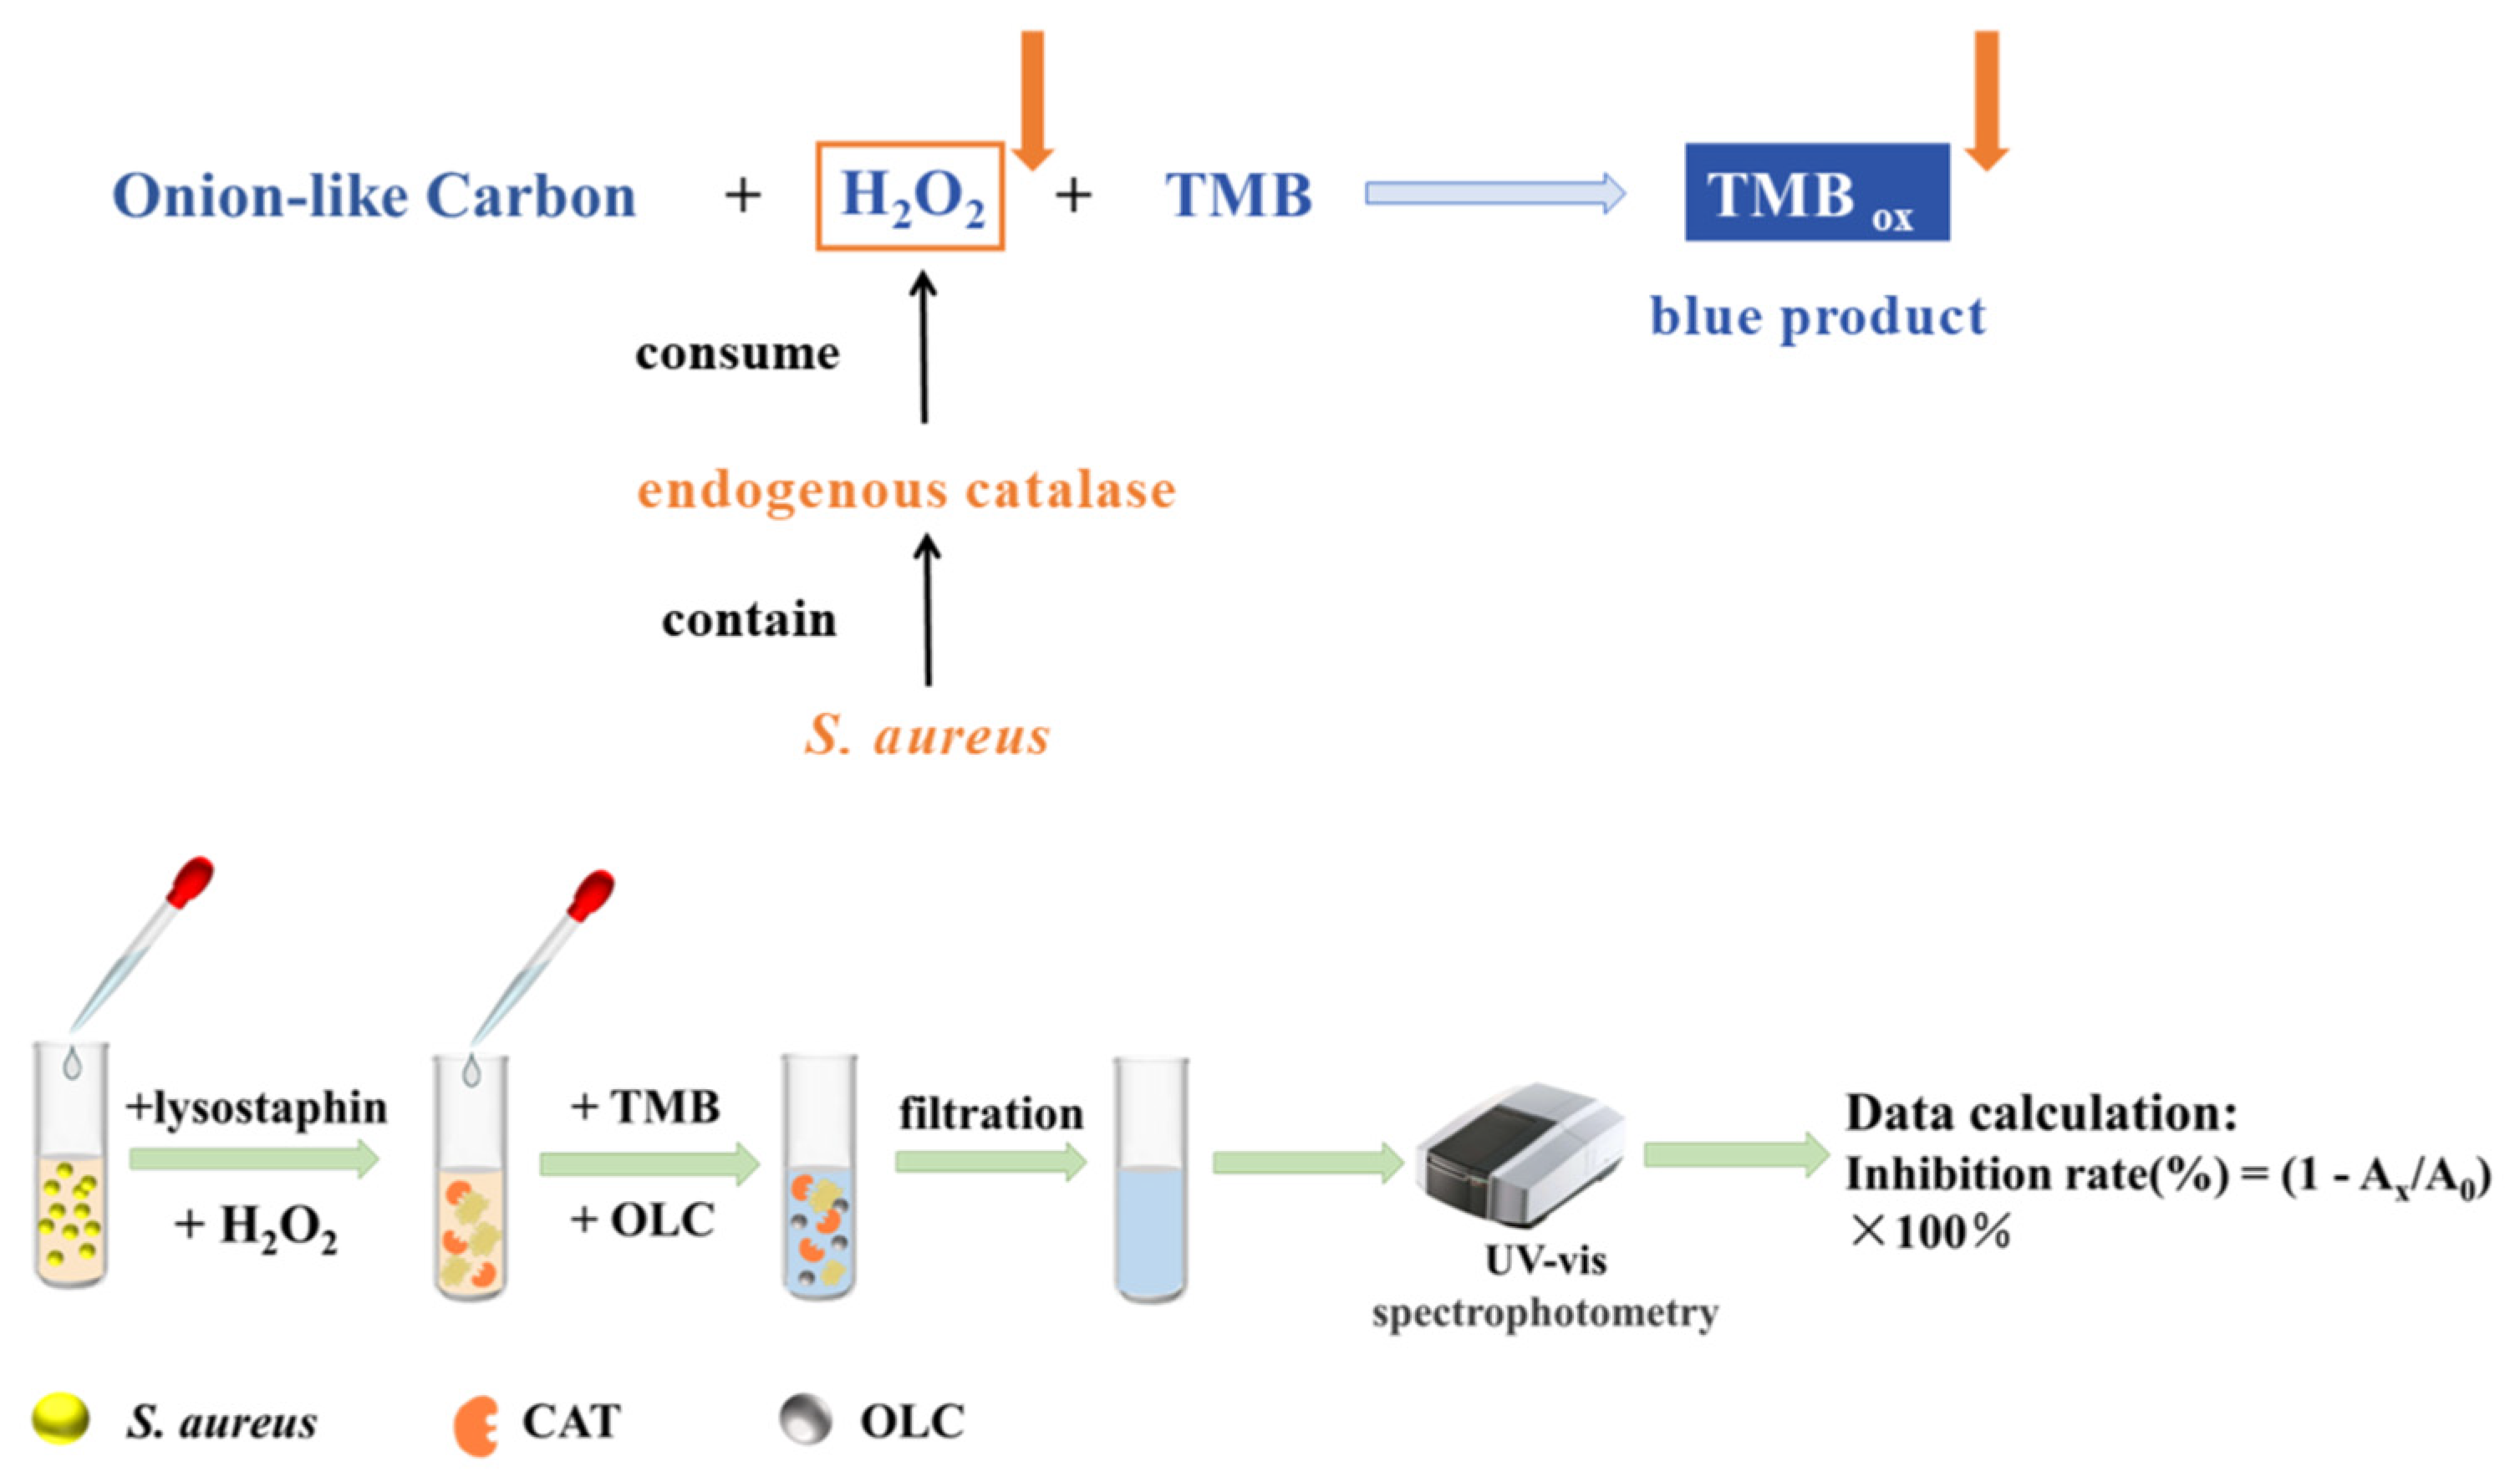
2.6. Colorimetric Detection of S. aureus

The detection principle of the colorimetric biosensor is illustrated in Scheme 1. To enhance detection specificity, lysostaphin was employed, as it selectively hydrolyzed the cell wall of Staphylococcus species [41,42]. Following incubation with lysostaphin, CAT was released from S. aureus and catalyzed the decomposition of H2O2. With the increase in S. aureus concentration, CAT concentration in the bacterial lysate increased, leading to the accelerated consumption of H2O2. As a result, less H2O2 was involved in the subsequent TMB oxidation, resulting in a decrease in the final absorbance of TMB oxide and an increase in the inhibition rate.
The detailed detection procedure was as follows: lysostaphin (13 μg/mL) was mixed with S. aureus solution to lyse S. aureus and release endogenous CAT. At the same time, H2O2 (0.5 mM) was added and consumed under the catalysis of CAT. The reaction was carried out at 37 °C for 20 min. After incubation, TMB (1 mM), OLC (250 μg/mL) and NaAc-HAc buffer (0.2 M, pH = 4) were added to the above solution. The reaction mixture was placed at room temperature for 10 min. Then, the solution was filtered with a needle filter of 0.22 μm × 13 mm to remove the bacteria and OLC nanozyme. Then, the absorbance of the supernatant at 652 nm was tested and recorded as Ax. In the blank group, the S. aureus solution was replaced with Tris-HCl buffer solution while all other conditions remained the same. The absorbance value of the blank group acted as the internal reference and was recorded as A0. The inhibition rate was used to characterize the bacterial concentration:
Inhibition rate (%) = (1 − Ax/A0) × 100%
Compared with the absolute value of absorbance, the use of the inhibition rate eliminated the influence of subjective errors and fluctuations in nanozyme activity on detection accuracy, which improved the precision and reliability of the results.

3. Results and Discussion

3.1. Structural and Catalytic Activity Characterization of OLC Nanozyme

OLC was obtained by annealing NDs at high temperature under an inert atmosphere. As shown in Figure 1a, the TEM image showed the presence of (111) planes of sp3-hybridized cubic diamond and (002) planes of sp2-hybridized graphitized carbon, with lattice spacing of 0.206 and 0.34 nm, respectively. OLC exhibited a quasi-spherical shape with a diameter of 5–10 nm. The X-ray diffraction pattern showed broad peaks of graphitic carbon at 27° and diffraction peaks of diamond at 44° and 75°, suggesting the presence of both sp2 and sp3 carbon in OLC (Figure 1b). We also observed peaks in the Raman spectra at 1320 cm−1 and 1535 cm−1, which belong to the D and G bands of graphene (Figure 1c). The above characterization confirmed the partial conversion from sp3 to sp2 carbon in pristine NDs, suggesting the successful synthesis of OLC. The abovementioned structural characterization in the present work is also consistent with our previous works, which can verify the formation of OLC [35,36].
The POD-like property of OLC was validated by the chromogenic reactions with TMB/ABTS and H2O2. Under the catalysis of OLC, the •OH was generated from the decomposition of H2O2, which subsequently oxidized TMB/ABTS into charge-transfer complex TMBOX (blue)/ABTS•+ (green) (Equations (2) and (3)). As shown in Figure 2, in the presence of H2O2 and OLC, TMB and ABTS underwent oxidation to produce blue and green products, respectively. However, the experimental groups in the absence of OLC showed almost no color change, indicating that OLC acted as an effective catalyst for the oxidation of TMB and ABTS in the presence of H2O2. Considering that TMB exhibits greater sensitivity in biosensing when compared to other chromogenic substrates, including ABTS [43,44], TMB was chosen as the substrate for subsequent detection.
TMB + H 2 O 2   O L C TMB OX + H 2 O
ABTS + H 2 O 2   O L C ABTS + + H 2 O
The POD-mimicking activity of the OLC nanozyme was further characterized according to the Michaelis–Menten equation (Equation (4)) and the Lineweaver–Burk equation (Equation (5)), which reflect the relationship between reaction rate and substrate concentration:
v = V m a x [ S ] K M + [ S ]
1 v = K M V m a x 1 [ S ] + 1 V m a x
v = Δ c t
A = ε L c
where [S] is the concentration of the substrate TMB or H2O2, v is the reaction rate, and Vmax refers to the maximum reaction rate when the enzyme is saturated by the substrate. The reaction rate v is determined by Equation (6), where Δ c is the concentration change of the chromogenic substance during the reaction, and t is the reaction time. The concentration of the chromogenic substance can be calculated from the absorbance value according to Lambert–Beer law (Equation (7)). A refers to the absorbance value measured by the UV-vis spectrophotometer. ε is the molar absorption coefficient. The ε value for TMB is 39,000 M−1 cm−1. c is the concentration of the chromogenic substance, and L is the optical path length. By calculating the Δ c values based on the changes of absorbance intensity, the reaction rates of TMB can be determined. KM is the Michaelis constant, representing the substrate concentration at which the reaction rate reaches half of Vmax. A smaller KM indicates a higher affinity between the enzyme and the substrate. Figure 3 shows the Michaelis–Menten and Lineweaver–Burk curves of OLC. Vmax and KM were determined from the fitted straight line between 1/v and 1/[S]. The intercept of the line refers to 1/Vmax. Therefore, Vmax can be obtained from the intercept. The slope refers to KM/Vmax. The value of KM can be calculated from the slope of the fitted line and Vmax. The KM and Vmax of both substrates were calculated and are listed in Table 1. OLC exhibited a higher Vmax when compared to other carbon nanomaterials with POD-like properties [45,46,47]. Furthermore, a smaller KM value was observed for OLC compared with graphdiyne oxide and C60[C(COOH)2]2, indicating that OLC had a high affinity to H2O2 and exhibited high POD-like catalytic activity.

3.2. Feasibility Verification of the As-Prepared Biosensor for S. aureus Detection

CAT is a biological enzyme capable of catalyzing the decomposition of H2O2 into water and oxygen [48,49], thereby playing a crucial role in protecting cells from oxidative damage induced by reactive oxygen species [50,51]. Firstly, the presence of CAT in S. aureus (ATCC 6538) cells was confirmed by incubating 108 CFU/mL S. aureus with 5 mM H2O2 at 37 °C for 30 min. Clear bubbles were observed in the solution (Figure 4a), corresponding to the generation of O2 under the catalysis of bacterial endogenous CAT.
Furthermore, to verify the feasibility of the as-prepared biosensor for S. aureus detection, the colorimetric responses of S. aureus solutions at different concentrations were recorded using TMB as the chromogenic agent. The bacteria were first incubated with 5 mM H2O2 for 30 min. Then, the bacteria were removed by filtration to avoid interfering with the subsequent absorbance detection. After filtration, OLC and TMB were added, and the colorimetric changes were observed after 5 min. In the presence of H2O2 and nanozymes, TMB easily loses one electron and produces a charge-transfer complex that displays a blue color. When TMB is exposed to an acidic condition or the amount of TMB is insufficient, it can then undergo further oxidation to produce a yellow diimine compound [52]. In present work, the TMB amount we used was sufficient, and the blue-colored reaction product TMBox was observed. As shown in Figure 4b, the intensity of the blue color decreased with increasing concentrations of S. aureus, owing to the higher consumption of H2O2 by S. aureus and less H2O2 being involved in subsequent TMB oxidation. In summary, the method proposed in the present work is feasible for S. aureus detection according to the colorimetric change of TMB.
To demonstrate the superior performance of the OLC nanozyme in our detection system, control experiments were performed using nanodiamonds and Fe3O4 nanoparticles as representative carbonaceous and non-carbonaceous nanomaterials, respectively. The control experiments were conducted at a S. aureus concentration of 105 CFU/mL. The detection procedures and parameters were consistent with those described in Section 2.6. The results are presented in Table 2. Under the same concentration of nanozymes (250 μg/mL), the highest change in TMB absorbance intensity was observed for OLC, indicating that OLC possessed the strongest POD-like properties. Additionally, OLC also demonstrated the highest inhibition rate, reflecting its enhanced sensitivity for S. aureus detection.

3.3. Optimization of Detection Conditions

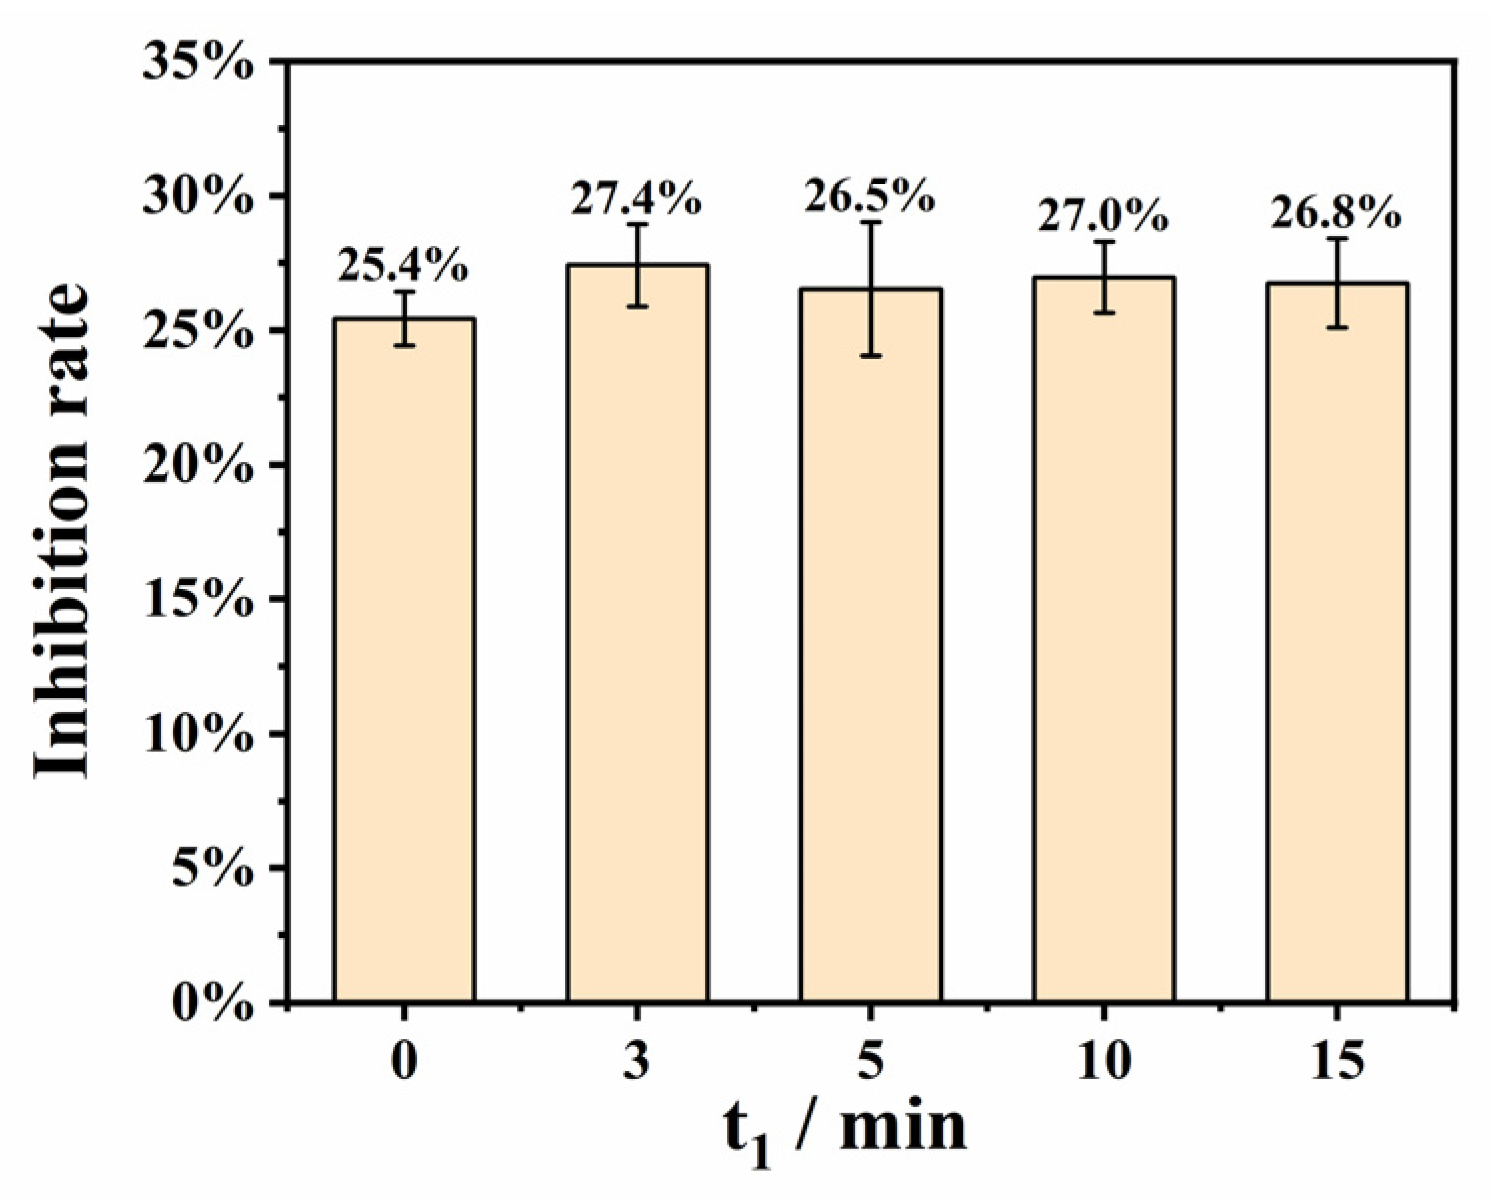
3.3.1. Optimization of the Incubation Time of Lysostaphin and S. aureus (t1)

To enhance the detection efficacy of the as-prepared biosensor, experimental conditions were systematically optimized. Firstly, considering the potential interference posed by the bacterial cell wall on the interaction between CAT within the S. aureus cells and H2O2 in the solution, lysostaphin was employed to facilitate bacterial lysis and ensure the release and adequate reaction between endogenous CAT and H2O2. Evaluation revealed that at a concentration of 106 CFU/mL S. aureus, lysostaphin treatment resulted in an inhibition rate of 49.11%, significantly higher than the 19.84% inhibition rate observed without lysostaphin, which proved the sensitivity enhancement facilitated by lysostaphin.
In the detection process, S. aureus was first incubated with lysostaphin to proceed bacterial lysis and release endogenous CAT, after which H2O2 was added. Considering a high concentration of H2O2 may hinder the lytic activity of lysostaphin, the incubation time of lysostaphin was first optimized by using 2 × 10⁵ CFU/mL S. aureus as the target analyte (Figure 5). The increase in t1 from 0 to 15 min did not yield significant changes in the inhibition rate, suggesting a rapid and complete lysis of S. aureus in a short period of time. Given that the inhibition rate was not sensitive to t1, lysostaphin and H2O2 were introduced to S. aureus simultaneously to simplify the detection process in the subsequent experiments.

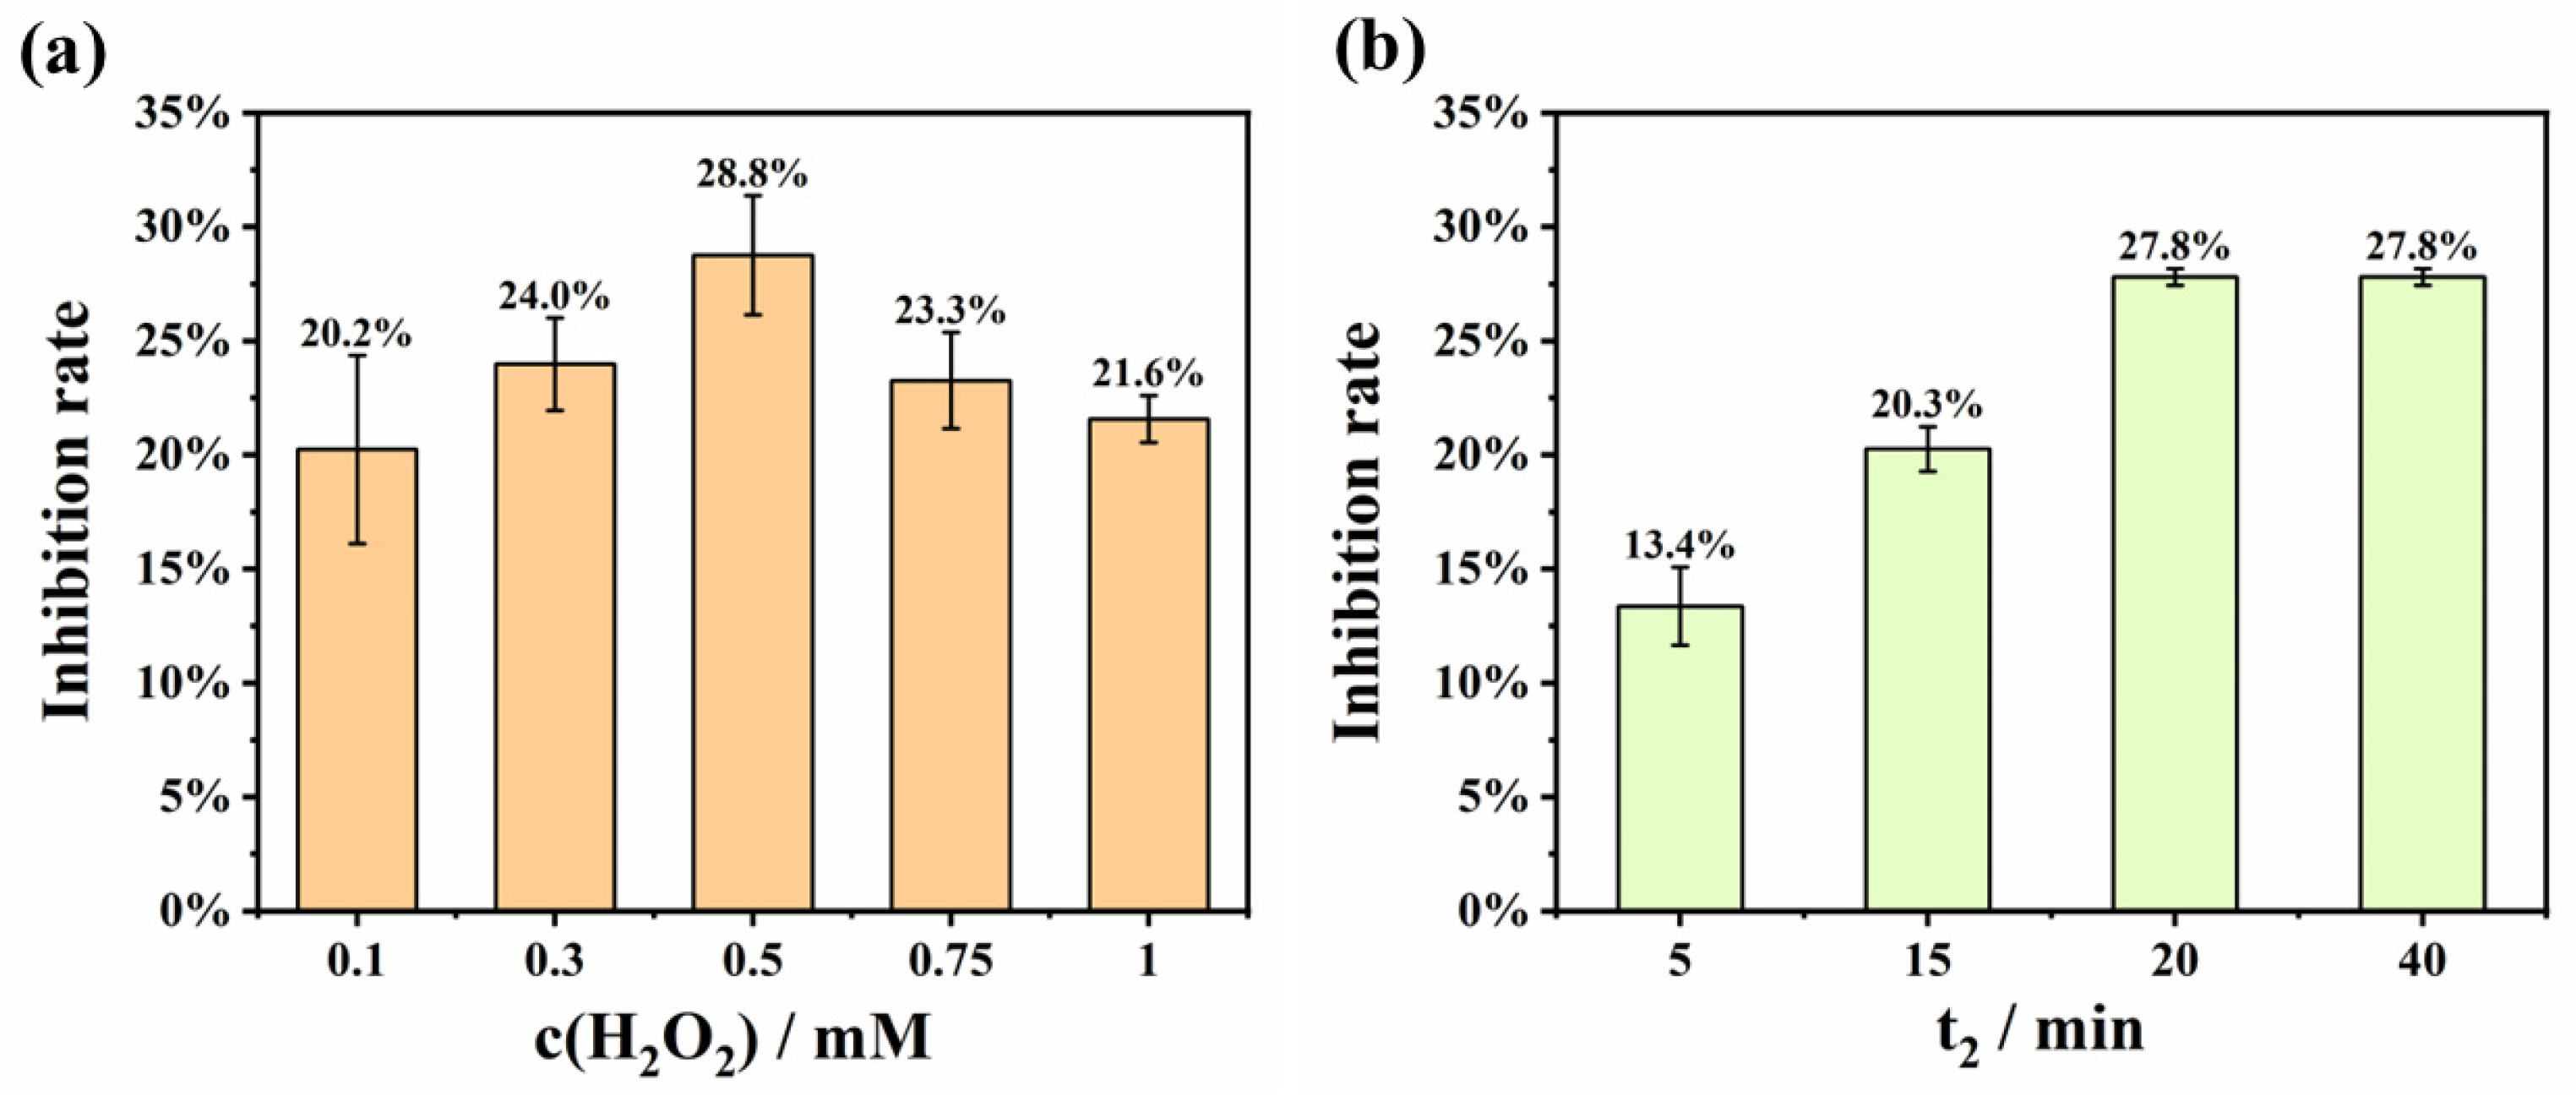
3.3.2. Optimization of H2O2 Concentration and H2O2 Reaction Time (t2)

Considering that the determination of S. aureus concentration relies on the enzymatic consumption of H2O2 by endogenous CAT, the initial concentration of H2O2 is essential in achieving optimal detection sensitivity. As depicted in Figure 6a, the inhibition rate exhibited an upward trend as the H2O2 concentration varied from 0.1 to 0.5 mM. However, the response of the biosensor to S. aureus exhibited a diminishing trend as the H2O2 concentration increased from 0.5 to 1 mM, with the maximum detection sensitivity observed at 0.5 mM. Consequently, 0.5 mM was selected as the optimal concentration.
Moreover, the influence of H2O2 reaction time was also investigated. As shown in Figure 6b, the inhibition rate increased, with the prolonged reaction time ranging from 5 to 20 min, and reached a plateau after 20 min, indicating that 20 min was sufficient for a complete reaction. Hence, 20 min was selected as the optimal reaction time for subsequent experiments.

3.4. Application of the As-Prepared Colorimetric Biosensor for S. aureus Detection

Under optimized conditions, the application of the as-prepared colorimetric biosensor for S. aureus detection was assessed. As depicted in Figure 7a, the final absorbance intensity decreased as the concentration of S. aureus was elevated. The relationship between the inhibition rate and the logarithm of bacterial concentration was fitted and is depicted in Figure 7b, revealing a strong linear correlation within the concentration range of 2 × 10⁴ to 2 × 10⁷ CFU/mL (R2 = 0.983). Since the sensitivity of our method relies on the measurement accuracy of the UV-vis spectrophotometer, we determined that our detection limit was reached when the absorbance intensity difference between the experimental and blank groups was less than 0.02. The limit of detection (LOD) was calculated as 3 Sb/m, where m represents the slope at low bacterial concentrations and Sb is the standard deviation of the blank group. The LOD value of our method was 9.2 × 10³ CFU/mL.

3.5. Assessment of Anti-Interference Ability

Two other types of pathogenic bacteria, Gram-positive B. subtilis and Gram-negative E. coli, were selected to evaluate the anti-interference capability of the present method. The detection of other pathogenic bacteria followed the same procedure. The colorimetric results showed an inhibition rate of 28.76% for S. aureus at the concentration of 2 × 10⁵ CFU/mL, while the E. coli and B. subtilis under the same concentration exhibited nearly no response (Figure 8). The good selectivity of the present method is attributed to two key factors. Firstly, the strain of S. aureus is CAT-positive, so it exhibits specific CAT catalytic activity that is different to other bacteria strains [22]. Secondly, the S. aureus-specific lysostaphin can selectively lyse the cell wall of S. aureus without affecting other bacteria. Together with the specific enzymatic activity of target S. aureus and the selective cell processing method, the as-prepared biosensor exhibited good anti-interference ability against other pathogenic bacteria.

3.6. Detection of S. aureus in Real Water Samples

3.6.1. Single Bacterial Test

Recovery experiments in real water samples were conducted to confirm the feasibility of the present method for S. aureus detection. Three samples with varying S. aureus concentrations were added to the collected real water sample, and the colorimetric assay was performed. The inhibition rates of real water samples spiked with different concentrations of S. aureus were calculated, and the detected bacterial concentration was converted according to the fitting relationship in Figure 7b. Real sample results for S. aureus are shown in Table 3. The recovery rates between the measured concentration and the spiked S. aureus concentration demonstrated the good accuracy of the present method in real water detection.
The practical anti-interference performance of our method was also evaluated by detecting the real water samples spiked with B. subtilis or E. coli at a concentration of 2 × 10⁵ CFU/mL, respectively. As listed in Table 4, negligible responses were observed for samples containing B. subtilis and E. coli. The results proved the effectiveness of our approach in detecting CAT-positive bacteria such as S. aureus, thereby offering a promising solution for rapid pathogen detection.

3.6.2. Mixed Bacterial Test

Natural water bodies often contain a wide range of bacteria, which potentially complicates the detection of target S. aureus due to interferences among different species. To assess the robustness of our assay under such conditions, we added the mixtures of S. aureus, E. coli and B. subtilis to the real water samples with each at a concentration of 2 × 10⁵ CFU/mL, and the found concentrations of S. aureus were determined. The found S. aureus concentrations in the mixed bacterial samples, as well as recovery rates and RSDs, are listed in Table 5. The results indicated that the presence of E. coli and B. subtilis had a minor effect on the detection of S. aureus, with recovery rates ranging from 95.5% to 101.5%. The above experiments demonstrated the capability of the present method in effectively mitigating interferences from co-existing bacteria. However, given that our method determines the S. aureus concentration by measuring the H2O2 consumption, it is plausible that substances that can react with H2O2 may interfere with the detection results. This could include sulfur ions and iodine ions, which may undergo redox reactions with H2O2. Additionally, industrial wastewater may also contain inorganic metal ions, such as Fe3+, which can accelerate the decomposition of H2O2 and potentially interfere with detection accuracy.

4. Conclusions

In this study, we proposed a colorimetric method for the detection of CAT-positive S. aureus based on its endogenous CAT activity. The POD-like property of an onion-like carbon nanozyme and a classical H2O2-TMB reaction were employed to monitor H2O2 consumption, which also served as the indicator for S. aureus concentration. In contrast to conventional biosensors for specific bacterial detection, our approach did not require the use of antibodies and aptamers, which greatly reduced the detection cost and manufacturing complexity. The method demonstrated a linear response to S. aureus from 2 × 10⁴ to 2 × 10⁷ CFU/mL with an LOD of 9.2 × 10³ CFU/mL. Furthermore, it exhibited robust anti-interference capability, enabling us to effectively distinguish S. aureus from co-existing pathogenic bacteria in real water samples. The underlying mechanism of the present sensing method could be further expanded to the detection of other CAT-positive bacteria, providing a straightforward and specific approach for pathogen detection.

Author Contributions

Conceptualization, Y.F. and G.G.; methodology, Y.F. and G.G.; validation, Y.F.; formal analysis, Y.F.; investigation, Y.F.; resources, G.G. and J.Z.; writing—original draft preparation, Y.F.; writing—review and editing, G.G. and J.Z.; visualization, Y.F. and G.G.; supervision, G.G. and J.Z.; project administration, G.G. and J.Z.; funding acquisition, G.G. and J.Z. All authors have read and agreed to the published version of the manuscript.

Funding

This research was funded by the National Key Research and Development Program, grant number 2022YFB3304003; and the Presidential Foundation of Technical Institute of Physics and Chemistry, grant number E2A8F301.

Institutional Review Board Statement

Not applicable.

Informed Consent Statement

Not applicable.

Data Availability Statement

The data supporting the conclusions of this article will be made available by the authors on request.

Conflicts of Interest

The authors declare no conflicts of interest.

References

  1. Tong, S.Y.C.; Davis, J.S.; Eichenberger, E.; Holland, T.L.; Fowler, V.G. Staphylococcus aureus Infections: Epidemiology, Pathophysiology, Clinical Manifestations, and Management. Clin. Microbiol. Rev. 2015, 28, 603–661. [Google Scholar] [CrossRef] [PubMed]
  2. Knox, J.; Uhlemann, A.-C.; Lowy, F.D. Staphylococcus aureus infections: Transmission within households and the community. Trends Microbiol. 2015, 23, 437–444. [Google Scholar] [CrossRef] [PubMed]
  3. Trilla, A.; Miro, J.M. Identifying high risk patients for Staphylococcus aureus infections: Skin and soft tissue infections. J. Chemother. 1995, 7, 37–43. [Google Scholar] [PubMed]
  4. Nicolau, D.P.; Marangos, M.N.; Nightingale, C.H.; Quintiliani, R. Influence of aspirin on development and treatment of experimental Staphylococcus aureus endocarditis. Antimicrob. Agents Chemother. 1995, 39, 1748–1751. [Google Scholar] [CrossRef]
  5. Robertson, L.; Caley, J.P.; Moore, J. Importance of Staphylococcus aureus in pneumonia in the 1957 epidemic of influenza A. Lancet 1958, 272, 233–236. [Google Scholar] [CrossRef]
  6. Kim, J.H.; van der Horst, C.; Mulrow, C.D.; Corey, G.R. Staphylococcus aureus Meningitis: Review of 28 Cases. Clin. Infect. Dis. 1989, 11, 698–706. [Google Scholar] [CrossRef]
  7. Solberg, C.O. Spread of Staphylococcus aureus in Hospitals: Causes and prevention. Scand. J. Infect. Dis. 2000, 32, 587–595. [Google Scholar] [CrossRef] [PubMed]
  8. Strommenger, B.; Layer, F.; Werner, G. Staphylococcus aureus and Methicillin-Resistant Staphylococcus aureus in Workers in the Food Industry. In Staphylococcus aureus; Fetsch, A., Ed.; Academic Press: Cambridge, MA, USA, 2018; pp. 163–188. [Google Scholar]
  9. Kadariya, J.; Smith, T.C.; Thapaliya, D. Staphylococcus aureus and Staphylococcal Food-Borne Disease: An Ongoing Challenge in Public Health. BioMed Res. Int. 2014, 2014, 827965. [Google Scholar] [CrossRef]
  10. Zhao, X.; Wei, C.; Zhong, J.; Jin, S. Research advance in rapid detection of foodborne Staphylococcus aureus. Biotechnol. Biotechnol. Equip. 2016, 30, 827–833. [Google Scholar] [CrossRef]
  11. Warren, D.K.; Liao, R.S.; Merz, L.R.; Eveland, M.; Dunne, W.M. Detection of Methicillin-Resistant Staphylococcus aureus Directly from Nasal Swab Specimens by a Real-Time PCR Assay. J. Clin. Microbiol. 2004, 42, 5578–5581. [Google Scholar] [CrossRef]
  12. Kim, J.-K.; Yun, H.-Y.; Kim, J.-S.; Kim, W.; Lee, C.-S.; Kim, B.-G.; Jeong, H.-J. Development of fluorescence-linked immunosorbent assay for rapid detection of Staphylococcus aureus. Appl. Microbiol. Biotechnol. 2023, 108, 2. [Google Scholar] [CrossRef] [PubMed]
  13. Nguyen, Q.H.; Kim, M.I. Nanomaterial-mediated paper-based biosensors for colorimetric pathogen detection. TrAC Trends Anal. Chem. 2020, 132, 116038. [Google Scholar] [CrossRef]
  14. Zhang, R.; Belwal, T.; Li, L.; Lin, X.; Xu, Y.; Luo, Z. Nanomaterial-based biosensors for sensing key foodborne pathogens: Advances from recent decades. Compr. Rev. Food Sci. Food Saf. 2020, 19, 1465–1487. [Google Scholar] [CrossRef] [PubMed]
  15. Yao, S.; Li, J.; Pang, B.; Wang, X.; Shi, Y.; Song, X.; Xu, K.; Wang, J.; Zhao, C. Colorimetric immunoassay for rapid detection of Staphylococcus aureus based on etching-enhanced peroxidase-like catalytic activity of gold nanoparticles. Microchim. Acta 2020, 187, 504. [Google Scholar] [CrossRef]
  16. Zhou, W.; Li, Y.; Zhu, G.; Xu, X.; Hu, Q.; Yang, Z.; Gu, X. High-sensitivity and high-specificity colorimetric detection of viable Staphylococcus aureus in ready-to-eat foods using a temperate-bacteriophage-based system with peroxidase-like activity. Sens. Actuators B Chem. 2024, 399, 134810. [Google Scholar] [CrossRef]
  17. Liu, Y.; Sun, M.; Qiao, W.; Cong, S.; Zhang, Y.; Wang, L.; Hu, Z.; Liu, F.; Wang, D.; Wang, P.; et al. Multicolor colorimetric visual detection of Staphylococcus aureus based on Fe3O4-Ag-MnO2 composites nano-oxidative mimetic enzyme. Anal. Chim. Acta 2023, 1239, 340654. [Google Scholar] [CrossRef] [PubMed]
  18. Bukharin, O.V.; Cherkasov, S.V.; Sgibnev, A.V.; Zabirova, T.M.; Ivanov, Y.B. Effects of microbial metabolites on catalase activity and growth of Staphylococcus aureus 6538 P. Bull. Exp. Biol. Med. 2000, 130, 679–681. [Google Scholar] [CrossRef] [PubMed]
  19. Bukharin, O.V.; Sgibnev, A.V.; Cherkasov, S.V.; Ivanov, Y.B. The Effect of the Intra- and Extracellular Metabolites of Microorganisms Isolated from Various Ecotopes on the Catalase Activity of Staphylococcus aureus ATCC 6538 P. Microbiology 2002, 71, 183–186. [Google Scholar] [CrossRef]
  20. Guarín, P.; Cristancho, J.; Castillo, J.J. Rapid electrochemical detection of Staphylococcus aureus based on screen-printed gold electrodes modified with cysteine and Guinea grass (Panicum maximum) peroxidase. Rev. Acad. Colomb. Cienc. Exactas Físicas Nat. 2020, 44, 835–844. [Google Scholar] [CrossRef]
  21. Majumdar, T.; Chakraborty, R.; Raychaudhuri, U. Rapid Electrochemical Quantification of Food Borne Pathogen Staphylococcus aureus Based on Hydrogen Peroxide Degradation by Catalase. J. Electrochem. Soc. 2013, 160, G75–G78. [Google Scholar] [CrossRef]
  22. Abdelhamid, H.N.; Wu, H.-F. Selective biosensing of Staphylococcus aureus using chitosan quantum dots. Spectrochim. Acta Part A Mol. Biomol. Spectrosc. 2018, 188, 50–56. [Google Scholar] [CrossRef] [PubMed]
  23. Wang, W.; Gunasekaran, S. Nanozymes-based biosensors for food quality and safety. TrAC Trends Anal. Chem. 2020, 126, 115841. [Google Scholar] [CrossRef]
  24. Baranwal, A.; Shukla, R.; Bansal, V. Nanozyme-enhanced paper-based biosensor technologies. TrAC Trends Anal. Chem. 2024, 172, 117573. [Google Scholar] [CrossRef]
  25. Wang, X.; Dong, S.; Wei, H. Recent Advances on Nanozyme-based Electrochemical Biosensors. Electroanalysis 2022, 35, e202100684. [Google Scholar] [CrossRef]
  26. Everse, J. Heme Proteins. In Encyclopedia of Biological Chemistry, 2nd ed.; Lennarz, W.J., Lane, M.D., Eds.; Academic Press: Cambridge, MA, USA, 2013; pp. 532–538. [Google Scholar]
  27. Ye, Y.; Zou, J.; Wu, W.; Wang, Z.; Wen, S.; Liang, Z.; Liu, S.; Lin, Y.; Chen, X.; Luo, T.; et al. Advanced nanozymes possess peroxidase-like catalytic activities in biomedical and antibacterial fields: Review and progress. Nanoscale 2024, 16, 3324–3346. [Google Scholar] [CrossRef] [PubMed]
  28. Lin, Y.; Sun, X.; Su, D.S.; Centi, G.; Perathoner, S. Catalysis by hybrid sp2/sp3 nanodiamonds and their role in the design of advanced nanocarbon materials. Chem. Soc. Rev. 2018, 47, 8438–8473. [Google Scholar] [CrossRef] [PubMed]
  29. Zeiger, M.; Jäckel, N.; Mochalin, V.N.; Presser, V. Review: Carbon onions for electrochemical energy storage. J. Mater. Chem. A 2016, 4, 3172–3196. [Google Scholar] [CrossRef]
  30. Dhand, V.; Yadav, M.; Kim, S.H.; Rhee, K.Y. A comprehensive review on the prospects of multi-functional carbon nano onions as an effective, high-performance energy storage material. Carbon 2021, 175, 534–575. [Google Scholar] [CrossRef]
  31. Su, D.S.; Maksimova, N.; Delgado, J.J.; Keller, N.; Mestl, G.; Ledoux, M.J.; Schlögl, R. Nanocarbons in selective oxidative dehydrogenation reaction. Catal. Today 2005, 102–103, 110–114. [Google Scholar] [CrossRef]
  32. Su, D.; Maksimova, N.I.; Mestl, G.; Kuznetsov, V.L.; Keller, V.; Schlögl, R.; Keller, N. Oxidative dehydrogenation of ethylbenzene to styrene over ultra-dispersed diamond and onion-like carbon. Carbon 2007, 45, 2145–2151. [Google Scholar] [CrossRef]
  33. Szymański, G.S.; Wiśniewski, M.; Olejnik, P.; Koter, S.; Castro, E.; Echegoyen, L.; Terzyk, A.P.; Plonska-Brzezinska, M.E. Correlation between the catalytic and electrocatalytic properties of nitrogen-doped carbon nanoonions and the polarity of the carbon surface: Experimental and theoretical investigations. Carbon 2019, 151, 120–129. [Google Scholar] [CrossRef]
  34. Butsyk, O.; Olejnik, P.; Romero, E.; Plonska-Brzezinska, M.E. Postsynthetic treatment of carbon nano-onions: Surface modification by heteroatoms to enhance their capacitive and electrocatalytic properties. Carbon 2019, 147, 90–104. [Google Scholar] [CrossRef]
  35. Shi, Y.; Zhao, Q.; Guan, B.; Li, J.; Gao, G.; Zhi, J. Onion-like carbon with controllable carbon atom hybridization embedded in BiVO4 photoanode for enhanced photoelectrochemical water splitting. Appl. Surf. Sci. 2023, 614, 156120. [Google Scholar] [CrossRef]
  36. Shi, Y.; Zhao, Q.; Li, J.; Gao, G.; Zhi, J. Onion-liked carbon-embedded graphitic carbon nitride for enhanced photocatalytic hydrogen evolution and dye degradation. Appl. Catal. B Environ. 2022, 308, 121216. [Google Scholar] [CrossRef]
  37. Ghanbari, M.H.; Norouzi, Z. A new nanostructure consisting of nitrogen-doped carbon nanoonions for an electrochemical sensor to the determination of doxorubicin. Microchem. J. 2020, 157, 105098. [Google Scholar] [CrossRef]
  38. Sok, V.; Fragoso, A. Amperometric biosensor for glyphosate based on the inhibition of tyrosinase conjugated to carbon nano-onions in a chitosan matrix on a screen-printed electrode. Microchim. Acta 2019, 186, 569. [Google Scholar] [CrossRef] [PubMed]
  39. Kim, Y.; Kang, E. A graphitic nano-onion/molybdenum disulfide nanosheet composite as a platform for HPV-associated cancer-detecting DNA biosensors. J. Nanobiotechnol. 2023, 21, 187. [Google Scholar] [CrossRef] [PubMed]
  40. Rizwan, M.; Hazmi, M.; Lim, S.A.; Ahmed, M.U. A highly sensitive electrochemical detection of human chorionic gonadotropin on a carbon nano-onions/gold nanoparticles/polyethylene glycol nanocomposite modified glassy carbon electrode. J. Electroanal. Chem. 2019, 833, 462–470. [Google Scholar] [CrossRef]
  41. Yoon, J.H.; Han, Y.D.; Lee, P.C.; Yoon, H.C. Lysostaphin-mediated fragmentation of microbial peptidoglycans for label-free electrochemical impedance immunoanalysis of Staphylococcus aureus. BioChip J. 2013, 7, 344–352. [Google Scholar] [CrossRef]
  42. Wang, M.; Fan, E.; Wu, Y.; Fu, Z. Daptomycin-modified magnetic beads integrated with lysostaphin for selective analysis of Staphylococcus. J. Pharm. Biomed. Anal. 2019, 175, 112785. [Google Scholar] [CrossRef]
  43. Lee, H.Y.; Atlasevich, N.; Granzotto, C.; Schultz, J.; Loike, J.; Arslanoglu, J. Development and application of an ELISA method for the analysis of protein-based binding media of artworks. Anal. Methods 2015, 7, 187–196. [Google Scholar] [CrossRef]
  44. Li, M.; Su, H.; Tu, Y.; Shang, Y.; Liu, Y.; Peng, C.; Liu, H. Development and Application of an Efficient Medium for Chromogenic Catalysis of Tetramethylbenzidine with Horseradish Peroxidase. ACS Omega 2019, 4, 5459–5470. [Google Scholar] [CrossRef]
  45. Ma, W.; Xue, Y.; Guo, S.; Jiang, Y.; Wu, F.; Yu, P.; Mao, L. Graphdiyne oxide: A new carbon nanozyme. Chem. Commun. 2020, 56, 5115–5118. [Google Scholar] [CrossRef] [PubMed]
  46. Li, R.; Zhen, M.; Guan, M.; Chen, D.; Zhang, G.; Ge, J.; Gong, P.; Wang, C.; Shu, C. A novel glucose colorimetric sensor based on intrinsic peroxidase-like activity of C60-carboxyfullerenes. Biosens. Bioelectron. 2013, 47, 502–507. [Google Scholar] [CrossRef] [PubMed]
  47. Song, Y.; Qu, K.; Zhao, C.; Ren, J.; Qu, X. Graphene Oxide: Intrinsic Peroxidase Catalytic Activity and Its Application to Glucose Detection. Adv. Mater. 2010, 22, 2206–2210. [Google Scholar] [CrossRef]
  48. Sepasi Tehrani, H.; Moosavi-Movahedi, A.A. Catalase and its mysteries. Prog. Biophys. Mol. Biol. 2018, 140, 5–12. [Google Scholar] [CrossRef] [PubMed]
  49. Kaushal, J.; Mehandia, S.; Singh, G.; Raina, A.; Arya, S.K. Catalase enzyme: Application in bioremediation and food industry. Biocatal. Agric. Biotechnol. 2018, 16, 192–199. [Google Scholar] [CrossRef]
  50. Galasso, M.; Gambino, S.; Romanelli, M.G.; Donadelli, M.; Scupoli, M.T. Browsing the oldest antioxidant enzyme: Catalase and its multiple regulation in cancer. Free Radic. Biol. Med. 2021, 172, 264–272. [Google Scholar] [CrossRef]
  51. Kirkman, H.N.; Gaetani, G.F. Mammalian catalase: A venerable enzyme with new mysteries. Trends Biochem. Sci. 2007, 32, 44–50. [Google Scholar] [CrossRef]
  52. Josephy, P.D.; Eling, T.; Mason, R.P. The horseradish peroxidase-catalyzed oxidation of 3,5,3′,5′-tetramethylbenzidine. Free radical and charge-transfer complex intermediates. J. Biol. Chem. 1982, 257, 3669–3675. [Google Scholar] [CrossRef]
Scheme 1. Schematic representation of the detection process.
Chemosensors 12 00176 sch001
Figure 1. Structural and compositional characterizations of OLC: (a) TEM image; (b) XRD pattern; (c) Raman spectra.
Chemosensors 12 00176 g001
Figure 2. (a) The digital photos of color changes in different groups: (a) TMB substrate; (b) ABTS substrate, respectively.
Chemosensors 12 00176 g002
Figure 3. Michaelis–Menten and Lineweaver–Burk curves of OLC: (a,b) H2O2 substrate; c(TMB) = 1 mM, c(OLC) = 100 μg/mL; (c,d) TMB substrate, c(H2O2) = 1 mM, c(OLC) = 100 μg/mL.
Chemosensors 12 00176 g003
Figure 4. (a) The digital photos of the bubbles after mixing S. aureus with H2O2; (b) The digital photos of color changes caused by different concentrations of S. aureus.
Chemosensors 12 00176 g004
Figure 5. Effect of lysostaphin incubation time on detection sensitivity, c(S. aureus) = 2 × 10⁵ CFU/mL, c(H2O2) = 0.5 mM, t2 = 20 min.
Chemosensors 12 00176 g005
Figure 6. (a) Effect of H2O2 concentration on inhibition rate, c(S. aureus) = 2 × 10⁵ CFU/mL, t1 = 0 min, t2 = 20 min; (b) Effect of H2O2 reaction time on inhibition rate, c(S. aureus) = 2 × 10⁵ CFU/mL, c(H2O2) = 0.5 mM, t1 = 0 min.
Chemosensors 12 00176 g006
Figure 7. (a) UV-visible absorption spectrum at varying concentrations of S. aureus; (b) Linear fitting curve of inhibition rate–logarithm of bacterial concentration.
Chemosensors 12 00176 g007
Figure 8. Comparison of the detection results of 2 × 10⁵ CFU/mL E. coli, B. subtilis and S. aureus.
Chemosensors 12 00176 g008
Table 1. Comparisons of kinetic parameters between OLC and other carbon nanozymes.
NanozymeKM (mM)Vmax (10−8 M s−1)Reference
H2O2TMBH2O2TMB
graphdiyne oxide2.590.621.771.92[45]
C60[C(COOH)2]224.580.230.400.35[46]
GO-COOH3.990.023.853.45[47]
OLC0.770.057.483.25This work
Table 2. Results of different materials in S. aureus detection.
MaterialsOLCNanodiamondsFe3O4
Nanoparticles
Absorbance of experimental group1.180.130.45
Absorbance of blank group1.450.140.53
Inhibition rates18.6%7.1%15.1%
Table 3. Results of S. aureus detection in real water samples.
Spiked Concentration of S. aureus (CFU/mL)Inhibition RateFound Concentration
(CFU/mL)
Recovery RateRSD
5 × 1049.14%5.16 × 104103.20%2.71%
2 × 10527.16%2.06 × 105103.00%6.45%
2 × 10788.17%2.24 × 107112.00%3.94%
Table 4. Results of 2 × 10⁵ CFU/mL E. coli or B. subtilis detection in real water samples.
Inhibition RateRSD
E. coli3.74%0.97%
B. subtilis1.25%0.55%
Table 5. Results of the mixed bacterial test in real water samples.
Spiked SamplesInhibition RateFound Concentration
(CFU/mL)
Recovery RateRSD
S. aureus + E. coli26.93%2.03 × 105101.50%4.94%
S. aureus + B. subtilis26.20%1.92 × 10596.00%2.42%
S. aureus + E. coli + B. subtilis26.14%1.91 × 10595.50%4.00%
Disclaimer/Publisher’s Note: The statements, opinions and data contained in all publications are solely those of the individual author(s) and contributor(s) and not of MDPI and/or the editor(s). MDPI and/or the editor(s) disclaim responsibility for any injury to people or property resulting from any ideas, methods, instructions or products referred to in the content.

