Article

Optimization by Hydrogen Plasma Treatment of a-CH and Hydrogen/Nitrogen-Assisted a-CH Layers for SAW Sensors

National Institute for Laser, Plasma and Radiation Physics, 409 Atomistilor Str., 077125 Magurele, Romania
*
Authors to whom correspondence should be addressed.
Chemosensors 2024, 12(9), 194; https://doi.org/10.3390/chemosensors12090194
Submission received: 21 August 2024 / Revised: 17 September 2024 / Accepted: 19 September 2024 / Published: 20 September 2024
(This article belongs to the Special Issue Functional Nanomaterial-Based Gas Sensors and Humidity Sensors)

Abstract

:
The high toxicity of hydrogen sulfide combined with poor sensitivity at room operating temperature urge for the development of new sensitive materials for sensors complying with this requirement, as well as a fast response and low cost. In this work, we have successfully developed materials for surface acoustic wave (SAW) sensors sensitive to H2S gas that provide a reversible response at room temperature. The sensitive materials were created by plasma-enhanced chemical vapor deposition of a-CH films using methane as a precursor with argon and argon admixed with hydrogen or nitrogen and applied on piezoelectric quartz substrates. Smooth films, with an AFM root mean square below 1.5 nm, were obtained in all cases, although slight topographical variations were noted, depending on the gas types. XPS detected varying degrees of oxidation, indicating that the assisting gases played a crucial role in introducing oxygen-containing functional groups, thus influencing the material’s surface chemistry and sensitivity response. A hydrogen plasma treatment was applied on the a-CH deposited sensors as a further sensor preparation step. The hydrogen plasma treatment resulted in significant modifications in the topographical features, including roughness increase and notable variations in the surface aspect ratios, as confirmed through AFM data analysis, which involved advanced pixel height analysis and line profile processing. X-ray photoelectron spectroscopy (XPS) studies indicated the formation of new functional groups, increased defect density, and a significant reduction in electron transitions following hydrogen plasma treatment. The sensors demonstrated a reversible response to H2S gas within 8 to 20 ppm concentration ranges, effectively detecting these levels. The sensitivity of the sensors was significantly enhanced, up to 39% through hydrogen plasma treatment, reaching an improved overall performance in detecting low concentrations of H2S down to 0.9 ppm. These findings highlight a-CH thin films as an excellent candidate for next-generation SAW sensors. The study also suggests the potential for experimenting with various assisting gases during plasma deposition and additional plasma treatments to push detection capabilities to below ppm levels.

1. Introduction

Hydrogen sulfide (H2S) is a highly dangerous and flammable gas with a foul odor [1]. It is commonly found in various industrial processes, including petroleum refining and mining [2], biogas production [3], and wastewater treatment plants [4]. Exposure to hydrogen sulfide (H2S) poses significant health risks in both the short and long term. Every year, more than 3 million tons of manmade H2S gas are released into the environment, causing elevated H2S concentrations around factories and certain urban areas. High concentrations, exceeding 500 ppm, can potentially lead to immediate acute poisoning and even death in humans and animals [5]. Even at low concentrations, exposure to H2S can cause headaches, nausea, insomnia, and conjunctivitis, while, at higher concentrations, it can lead to acute poisoning, severe eye irritation, and olfactive and respiratory paralysis [6,7,8]. Therefore, it is essential to develop gas sensors capable of detecting and monitoring the concentration of H2S to prevent its adverse effects on safety and the environment. There are multiple approaches for H2S detection [9], such as metal oxide sensors, spectroscopy sensors, and electrochemical sensors. Metal oxide sensors operate by detecting hydrogen sulfide (H2S) through the process of gas adsorption on the surface of a metal oxide, which, in turn, leads to a measurable change in sensor resistance [10,11]. Although widely used for their sensitivity and cost-effectiveness, metal oxide-based H2S sensors have several drawbacks that limit their performance. They are sensitive to temperature and humidity, leading to inconsistent readings [12], and often lack specificity, causing cross-sensitivity with other gases. These sensors also suffer from long-term stability issues and require frequent recalibration. Additionally, they necessitate operation at elevated temperatures, in most cases, that result in increased power consumption that makes them less ideal for portable applications. These limitations affect their accuracy and reliability, especially in demanding or variable environments. Spectroscopy sensors [13] offer exceptional precision and stability by analyzing the spectral properties of gases. However, they are often characterized by their larger size and higher cost compared to other types of gas sensors. Electrochemical sensors are designed to measure the potential or current that is proportional to the concentration of a gas [11]—in this case, H2S—to detect its presence. However, these sensors encounter challenges in terms of response speed, sensitivity, and selectivity [14]. Compared to traditional H2S gas sensing technologies, surface acoustic wave (SAW)-based gas sensors have become increasingly popular due to their exceptional sensitivity, rapid response time [15], selectivity, compact dimensions, wireless operation capability, and potential for integration into security systems, making them highly versatile and practical for a wide range of applications [13,16,17,18,19]. Surface acoustic wave (SAW) sensors operate by detecting specific gas species adsorbed into a sensitive layer deposited on a piezoelectric substrate via mechanisms such as mass loading, viscoelastic effects, and acoustic–electric interactions [17,20,21]. When gas molecules interact with the sensitive layer of the SAW sensor, it causes changes in the wave characteristics, thereby modifying the electrical output signal and allowing for the identification of the presence of specific gases such as H2S. The sensitive element of SAW sensors can be made from a wide range of materials, including semiconductor metal oxides, metals, polymers, composite materials, carbon nanotubes, and carbon-based materials [22]. This enables their use in mechanical sensing, biological sensing, chemical sensing, gas sensing, and microfluidics [8,21]. SAW sensors are highly versatile and are well suited for a wide range of sensing applications. These include monitoring exhaust gases and air quality in automotive applications [23], detecting gas leaks and ensuring cabin air safety in aerospace [24], and sensing biochemical compounds and monitoring environmental conditions in medical facilities within the biomedical industry [25].
Among various sensitive layers used for SAW sensors, carbon-based films offer significant advantages. Carbon-based sensors demonstrate higher sensitivity, with the ability to detect H2S at much lower concentrations, sometimes down to parts per billion (ppb) levels, compared to metal oxide sensors, which typically detect H2S in the ppm range [26]. The unique properties of carbon-based materials, such as high surface area, electrical conductivity, and chemical stability, enable faster response and recovery times and better selectivity toward H2S, reducing the probability of interference from other gases [27]. Furthermore, carbon-based sensors operate effectively at room temperature, avoiding the higher power consumption associated with metal oxide sensors. This makes carbon-based sensors particularly suitable for portable and low-power applications. Although still emerging, the superior performance of carbon-based sensors positions them as a promising alternative to traditional metal oxide sensors for H2S detection. Especially, amorphous hydrogenated carbon (a-CH) materials have garnered significant interest for their potential in surface acoustic wave (SAW) sensor applications due to their exceptional properties. These materials exhibit high hardness, low friction, chemical inertness, water resistance, and impressive resistance to wear and corrosion. The presence of polar terminating bonds in a-CH films enables the adsorption of gas molecules, leading to alterations in mass, elastic modulus, and electrical conductivity, which are critical for their use in sensing applications [28]. The gas adsorption capability of a-CH materials significantly enhances the sensitivity of SAW sensors, allowing for the detection of even low concentrations of gases. Additionally, their high resistance to wear and corrosion make them particularly well suited for use in harsh environments, extending the lifespan of SAW sensors. Moreover, the chemical inertness of a-CH films ensures that they remain unreactive with other substances, thereby providing stable and reliable sensor performance. The low friction properties of a-CH materials also reduce energy loss and enhance the overall efficiency of SAW sensors. Materials based on amorphous hydrogenated carbon (a-CH) can be deposited using a variety of methods, such as ion beam deposition, cathodic arc deposition, sputtering, and plasma-enhanced chemical vapor deposition (PECVD). Among these methods, PECVD is particularly favored, because it offers high uniformity, large-area processability, and excellent step coverage at low temperatures [29]. The exceptional properties of a-CH materials make them a valuable component in the development of advanced SAW sensors. Their adaptability and robustness enable their use in a wide range of industries, enhancing the capability and reliability of sensing technologies.
Nevertheless, it is crucial to exercise precise control over the deposition parameters to optimize the performance of a-CH-based SAW sensors effectively [27]. This study focuses on creating a-CH thin films that are customized for surface acoustic wave (SAW) sensors to detect hydrogen sulfide. The main goal is to optimize the chemical and surface properties in order to improve the piezoelectric properties of the SAW device by modifying the sensor functional bonds upon assisting the deposition process led in Ar/CH4 plasma with nitrogen and hydrogen gases. To improve sensor performance, an additional hydrogen plasma treatment process was utilized to customize the films characteristics. The influence of the plasma deposition and treatment conditions on the films’ topographical, structural, and chemical properties was analyzed, allowing to affirm the identification of the optima to identify the best a-CH films suitable for SAW applications.

2. Materials and Methods

2.1. Plasma Synthesis of a-CH Thin Films

Each prepared SAW sensor was composed from quartz piezoelectric substrate with two pairs of gold ITDs (interdigital transducers) and the sensitive a-CH layer. The quartz substrate was a ST-X cut, having parallelogram geometry with a 45° angle, to reduce the unwanted acoustic wave reflections from the edge of the quartz.
The dimensions of the SAW sensor substrates are 38 mm in length, 10 mm in width, and 0.5 mm in thickness. The quartz substrate of the SAW sensor confers a good stability at room temperature (RT).
Amorphous hydrogenated carbon (a-CH) films were produced using plasma-enhanced chemical vapor deposition (PECVD) with three different gas mixtures: Ar/CH4, Ar/CH4/H2, and Ar/CH4/N2 at flow rate ratios of 50/25 and 50/25/5 SCCM (standard cubic centimeters per minute), respectively. The deposition process was conducted on the quartz substrates coated with gold interdigital transducers, where CH4 served as the carbon source, Ar as the carrier gas, and H2 or N2 as the a-CH deposition assisting gases. The deposition was carried out at a working pressure of approximately 3 × 10⁻⁴ mbar using a radio frequency (RF) power of 100 W for 60 min. Furthermore, the three types of sensitive a-CH layers underwent an additional H2 postdeposition plasma treatment. This treatment was conducted in an Ar/H2 plasma at a gas ratio of 100/25 SCCM at a pressure of 1 × 10⁻³ mbar using 100 W of RF power for 15 min. This additional process aimed to improve the sensor’s performance by modifying the surface properties of the a-CH films. The experimental conditions for each as-obtained a-CH sensitive layer for SAW sensors are outlined in Table 1.

2.2. Characterization of the Deposited a-CH Layers

Atomic force microscopy (AFM) was employed to evaluate the surface topography of the a-CH active layer in the SAW sensors. Measurements, ranging from 0.5 µm × 0.5 µm to 1 µm × 1 µm, were conducted in non-contact mode using a Park Systems XE-100 AFM (Suwon, Korea). The surface roughness, feature dimensions, and material properties were quantitatively analyzed through subsequent AFM image processing, which involved line profiling and pixel height distribution analysis using dedicated AFM data software.
X-ray photoelectron spectroscopy (XPS) was used to analyze the chemical structure of the a-CH thin films in detail. The measurements were carried out using a K-Alpha Thermo Scientific (Waltham, MA, USA) (ESCALAB™ XI+) spectrometer equipped with a 180° double-focusing hemispherical analyzer, located in East Grinstead, UK. The instrument was calibrated using the standard C1s peak at 284.6 eV for precise energy reference. Survey spectra were obtained at a pass energy of 50 eV to determine the surface elemental composition, while high-resolution spectra for C1s, O1s, and N1s were acquired at a pass energy of 20 eV to analyze the bonding states in detail. Data acquisition and processing were carried out using Avantage data software (Thermo Avantage v5 9921).

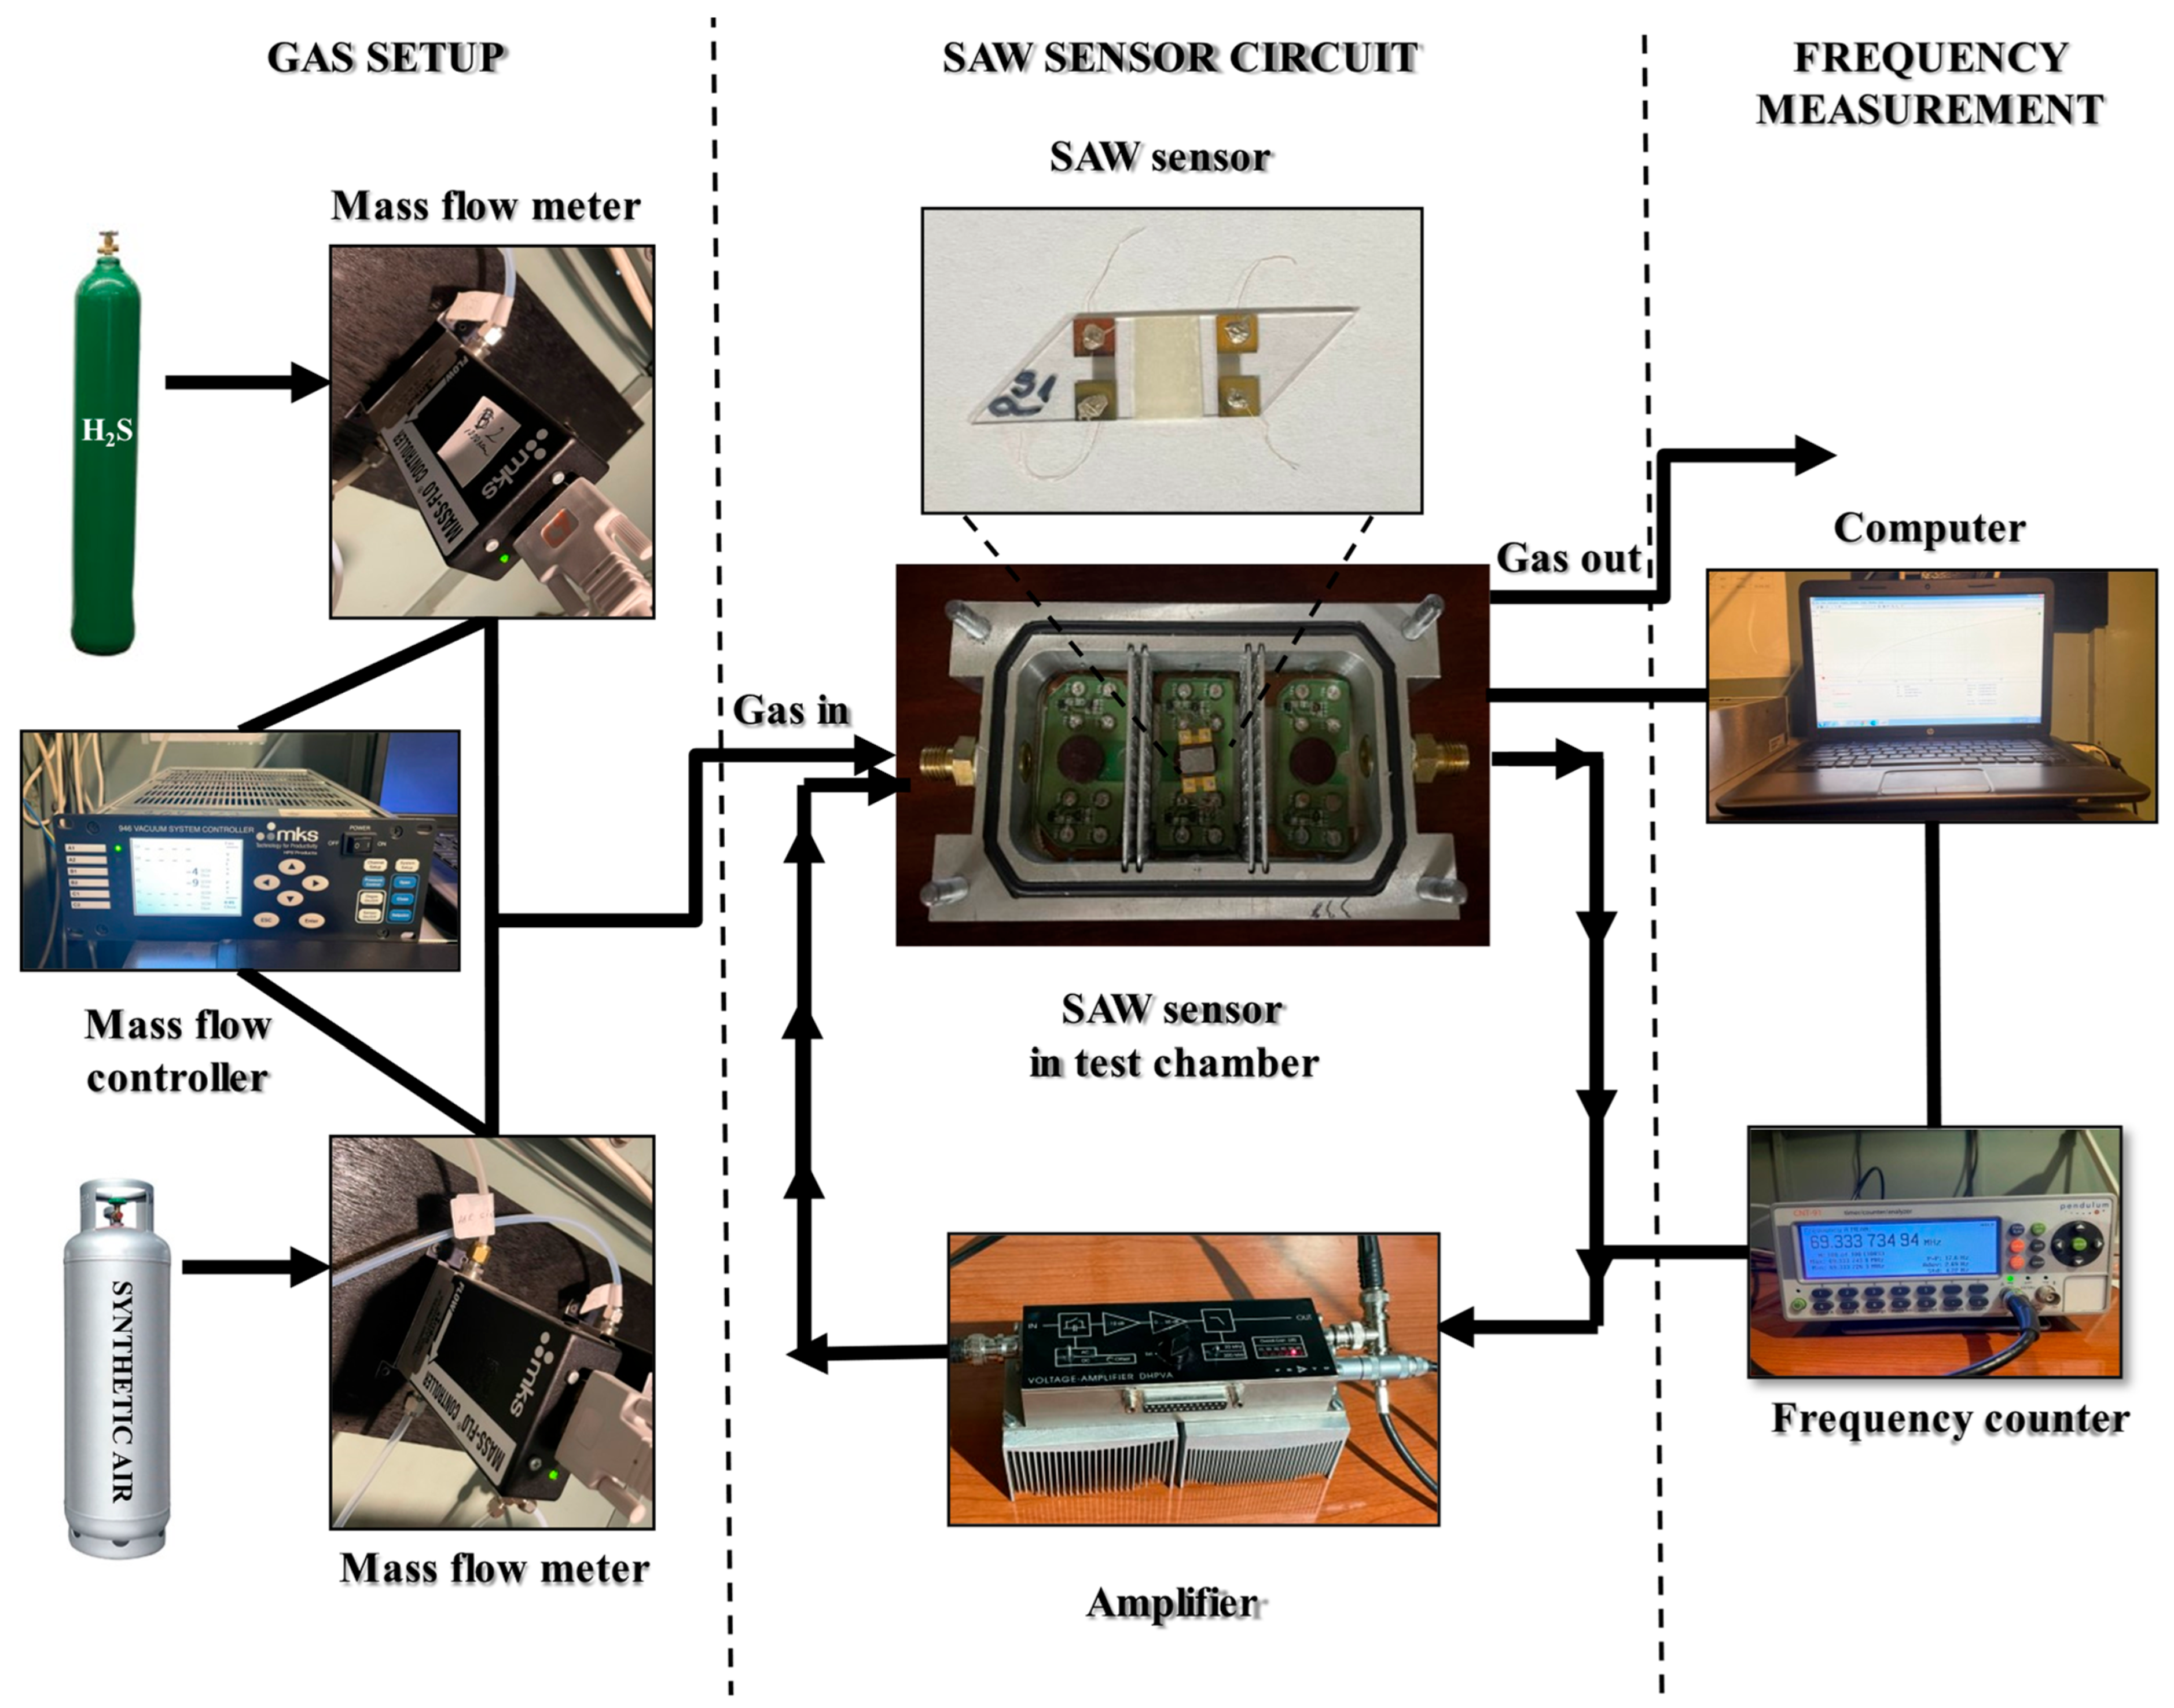
2.3. Sensor Structure and Testing

The ITDs were made of gold, and to ensure strong adhesion of gold to the substrate, the photolithographic method was employed, involving the deposition of a 10 nm chromium layer beneath the 150 nm gold ITDs. The ITDs contain 50 straight pairs with a wavelength of 45.2 µm, acoustic aperture of 2.5 mm, and 10 mm of acoustic path length [8,10,30]. The experimental testing system, presented in Figure 1 can be split into three sections: gas exposure setup, SAW sensor, and frequency measurement circuitry. The sensors were tested at room temperature (RT) at concentrations between 8 and 20 ppm of H2S. The gas concentration was adjusted using a mass flow controller connected to two mass flow meters, allowing the combining of H2S with synthetic air, thus ensuring the desired concentrations. The total flow rate of the admixtures of gases was maintained at 500 SCCM to avoid parasite frequency shifts. Similar experiments were performed by introducing CH4 and H2 in the testing device in order to assess the response of the system to selective environments. Moreover, to minimize the potential interference from water molecules, all measurements were conducted under constant humidity (50%) and temperature conditions (24 °C). The results were processed using TimeView 3 software, connected to a DHPVA-200 FEMTO amplifier (Messtechnik GmbH, Berlin, Germany) and a CNT-91 Pendulum Frequency Counter (Spectracom Corp, Rochester, NY, USA). To make up for the amplitude losses, the sensor was connected to an amplifier. A frequency counter was linked to a computer to measure the frequency shift.

3. Results and Discussion

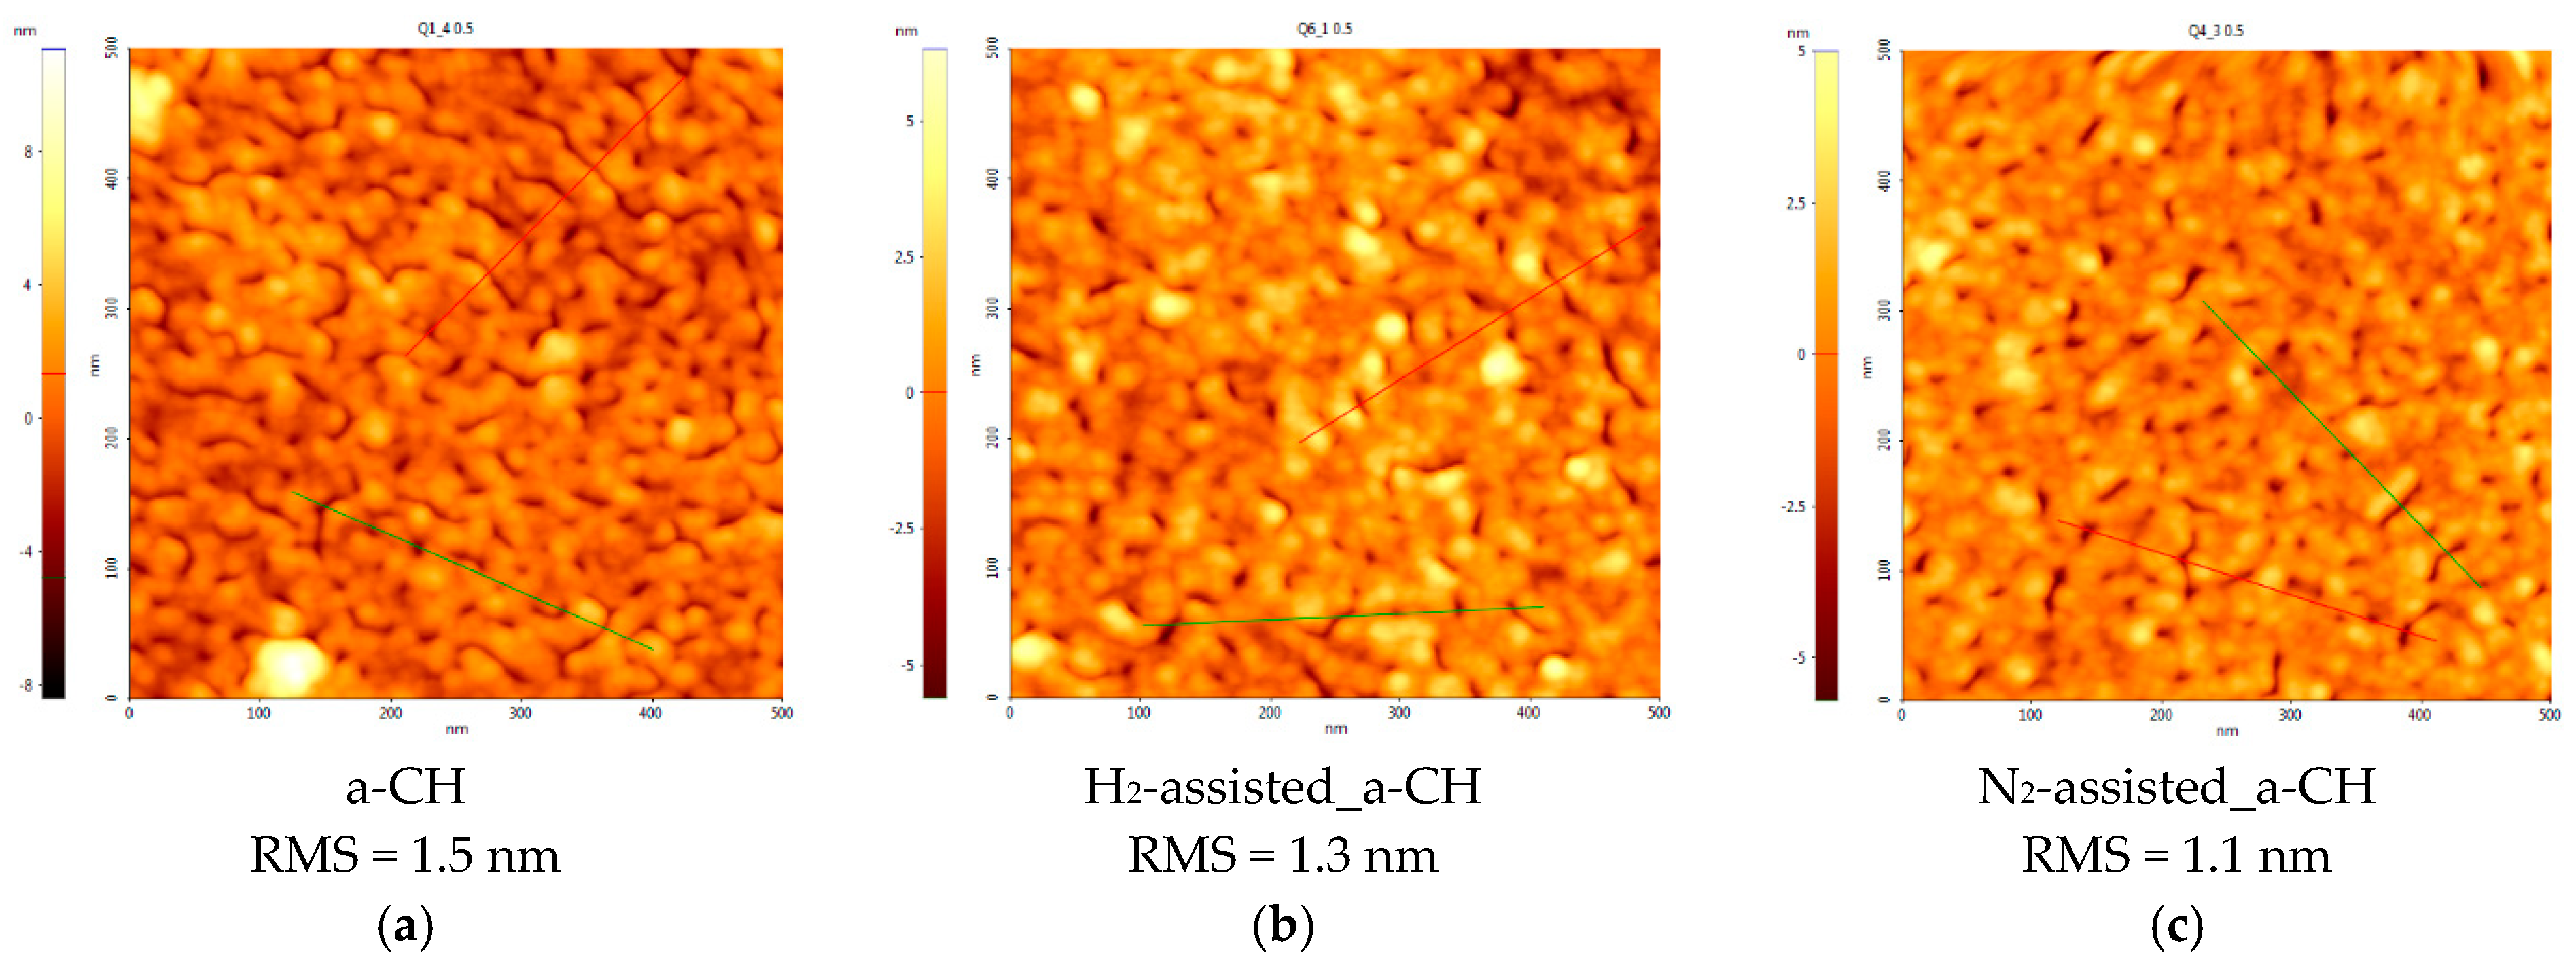
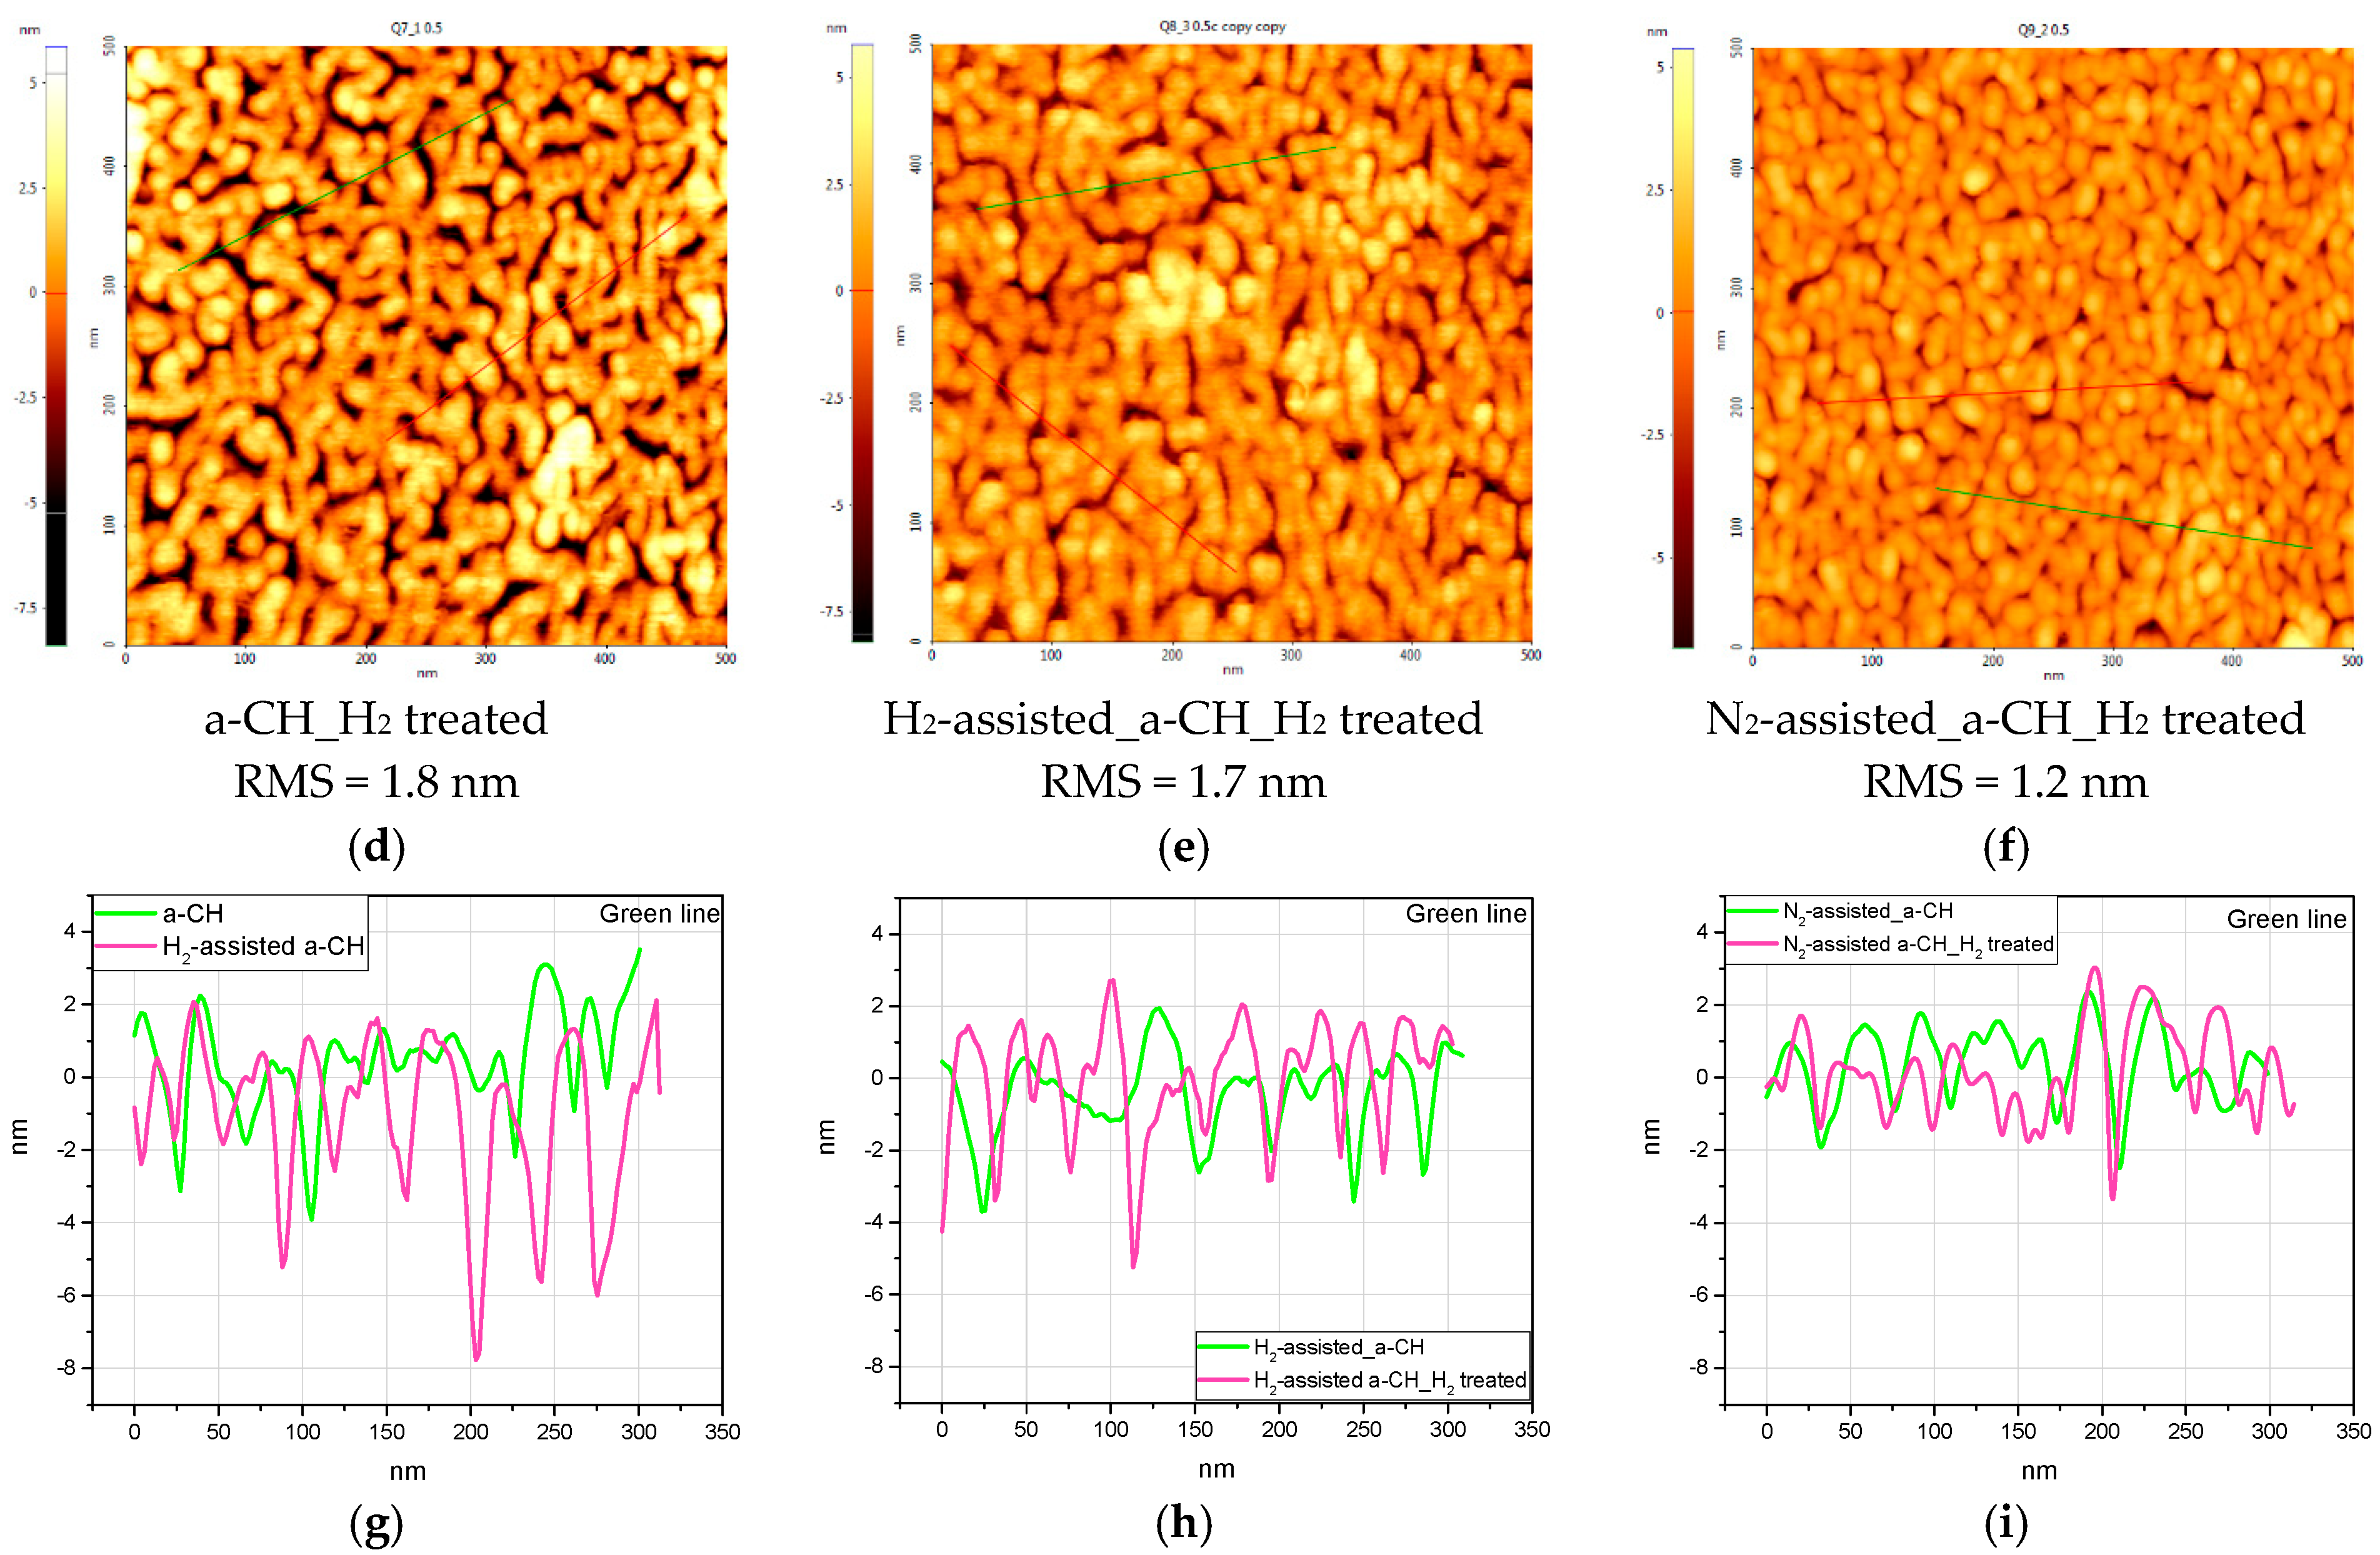
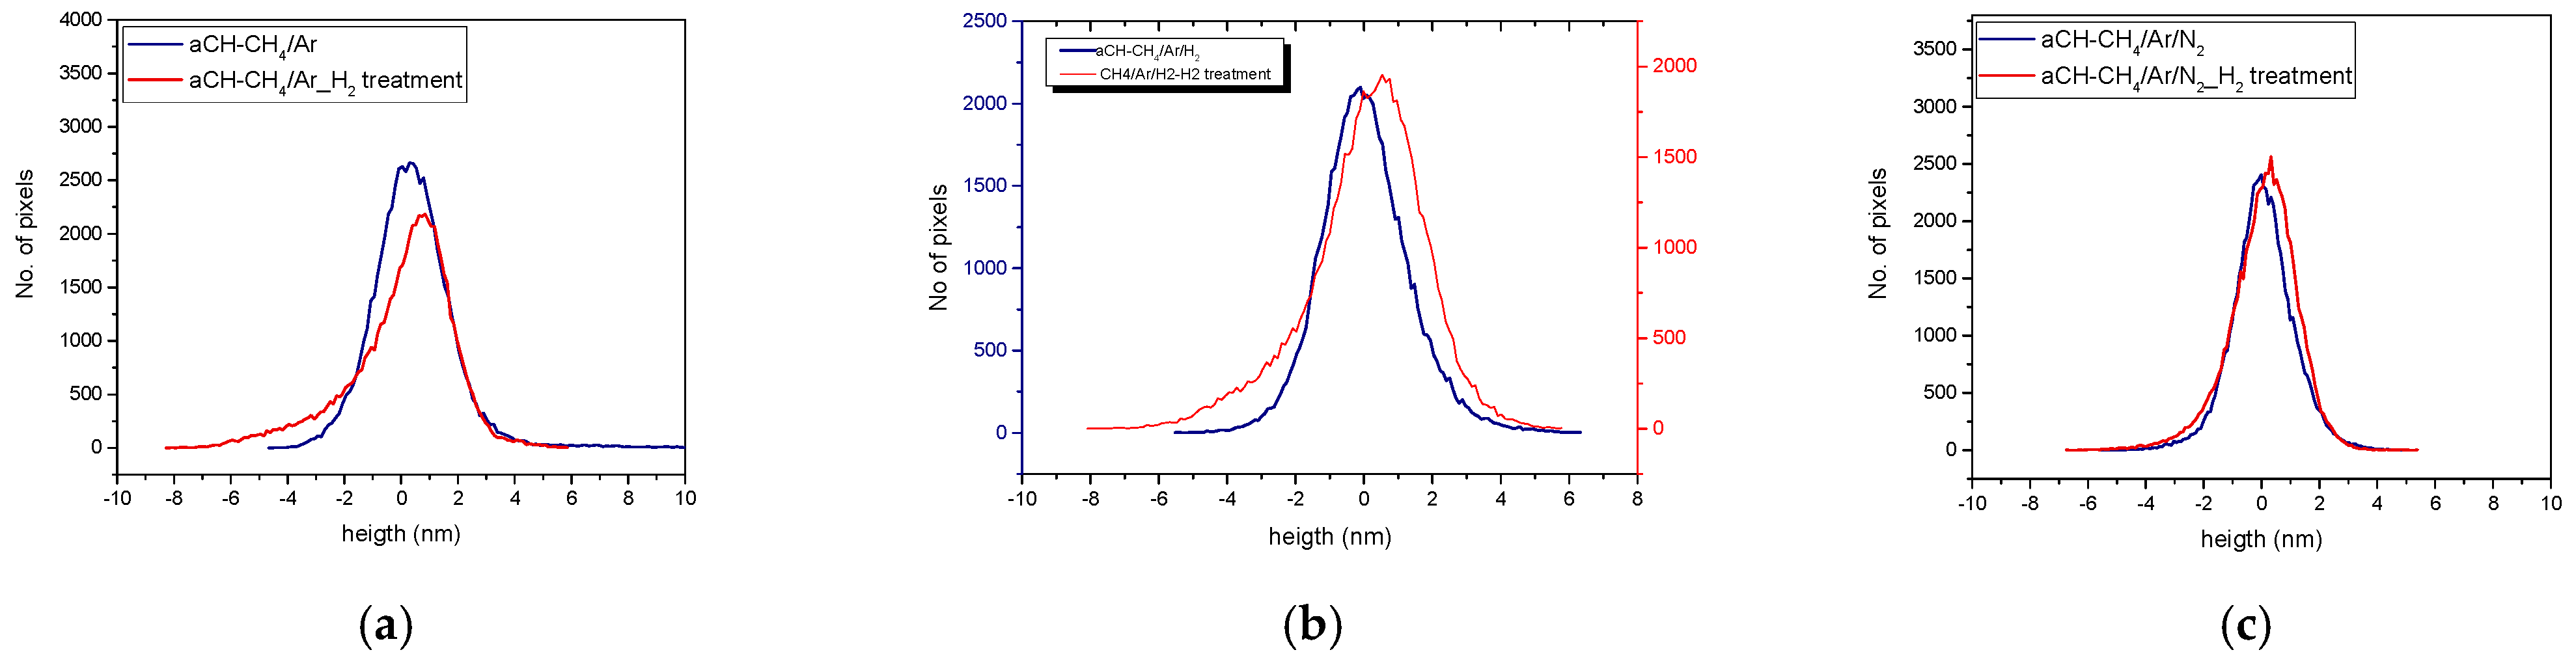
3.1. Topographical Characterization

To highlight the surface alterations in the topographical characteristics of a-CH thin films as deposited and hydrogen plasma-treated a-CH ones, atomic force microscopy (AFM) measurements were performed on 0.5 × 0.5 μm2 areas, as illustrated in Figure 2.
All the initially deposited a-CH thin films exhibit distinct topographical characteristics specific to the plasma deposition parameters. The a-CH-like thin films display a unique worm-like structure with pronounced deep-flowing channels with a typical length about 50 nm. In the case of hydrogen-assisted a-CH-like coating, the surface shows a more compact surface with a limited number of channels and some porous features, while the nitrogen-assisted a-CH-like materials present a combination of worm-like and granular-like features, while the presence of pores is also observed. Despite this variety in surface features, the AFM root mean square roughness (RMS) for all the investigated a-CH as-deposited thin films remains very low, below 1.5 nm for all samples, indicating a very smooth surface texture.
Hydrogen plasma treatment of the a-CH coatings leads to significant changes in the surface topography, as illustrated in Figure 2d–f. For the a-CH material obtained by mixing Ar/CH4 gases, after the hydrogen plasma treatment, we can notice thinner worm-like features and larger flowing channels, while the interspaces between these worm-like features become significantly wider compared to those from the as-deposited samples, suggesting the etching of carbonic materials in narrow spaces. In the case of nitrogen-assisted a-CH material, the surface of the films after hydrogen plasma treatment appears granular, with a transition from worm-like to globular structures, with features around 10 nm in diameter well separated. In the case of a hydrogen-doped a-CH thin film, the etching effect of the additional hydrogen plasma treatment is more pronounced as the surface changes from compact to more aerated and worm-like. It is worth noting that, for all investigated a-CH materials, the hydrogen plasma treatment resulted in higher surface aspect ratios, noticed not only by the general aspect but also by an increase in the root mean square surface roughness, which is higher by 20% in the case of a-CH and hydrogen-assisted a-CH depositions, and only by 10% for the nitrogen-assisted a-CH thin film treated in hydrogen plasma. These modifications in topography and roughness may contribute to the overall sensors’ sensitivity.
In Figure 2g–i are presented the height profiles along the green lines marked on the images (a–f), presented comparatively for the as-deposited and hydrogen plasma-treated samples obtained under various gas assistance. They evidenced deeper and broader channels for the simple and hydrogen-assisted deposition and only minimum difference encountered in the case of nitrogen-assisted deposition.
To quantitatively assess the modifications noticed in the AFM images after the hydrogen plasma treatment, we show in Figure 3 the histogram distribution of the data before and after the plasma treatment. As such, on the y-axis, we have the number of pixels with a given height, while, on the x-axis, we have the respective heights. The total number of points is 256 × 256, as defined by the AFM resolution. The histograms reveal mathematically the information given in 3D by the AFM measurements, pointing out the etching induced by hydrogen plasma in all cases employing the shift of pixels with negative x values. The most evident etching is noticed in the case of simple a-CH films deposited only in the Ar/CH4 environment, where the initial sample shows wide wings on the positive side of the distribution, while, upon plasma treatment, a strong widening is noticed on the negative side, in correlation with the well-interconnected channels of larger thickness. On the opposite side, in the case of the nitrogen-assisted a-CH deposition, the histogram distribution is much narrower and almost symmetric, both before and after the hydrogen plasma treatment, with a width of 2.08 nm initially and 2.3 nm after plasma treatment. Also, in the case of hydrogen-assisted a-CH deposition, the histogram width at half-maximum is around 2.64 nm in the as-deposited sample and increases up to 3.2 nm after hydrogen plasma. The topographical variations observed post-treatment indicate increased surface aspect ratios across all investigated samples, a crucial factor for enhancing the sensitivity of sensors fabricated from these materials. Also, it is important to note that the surface characteristics varied depending on the type of assisting gas used.

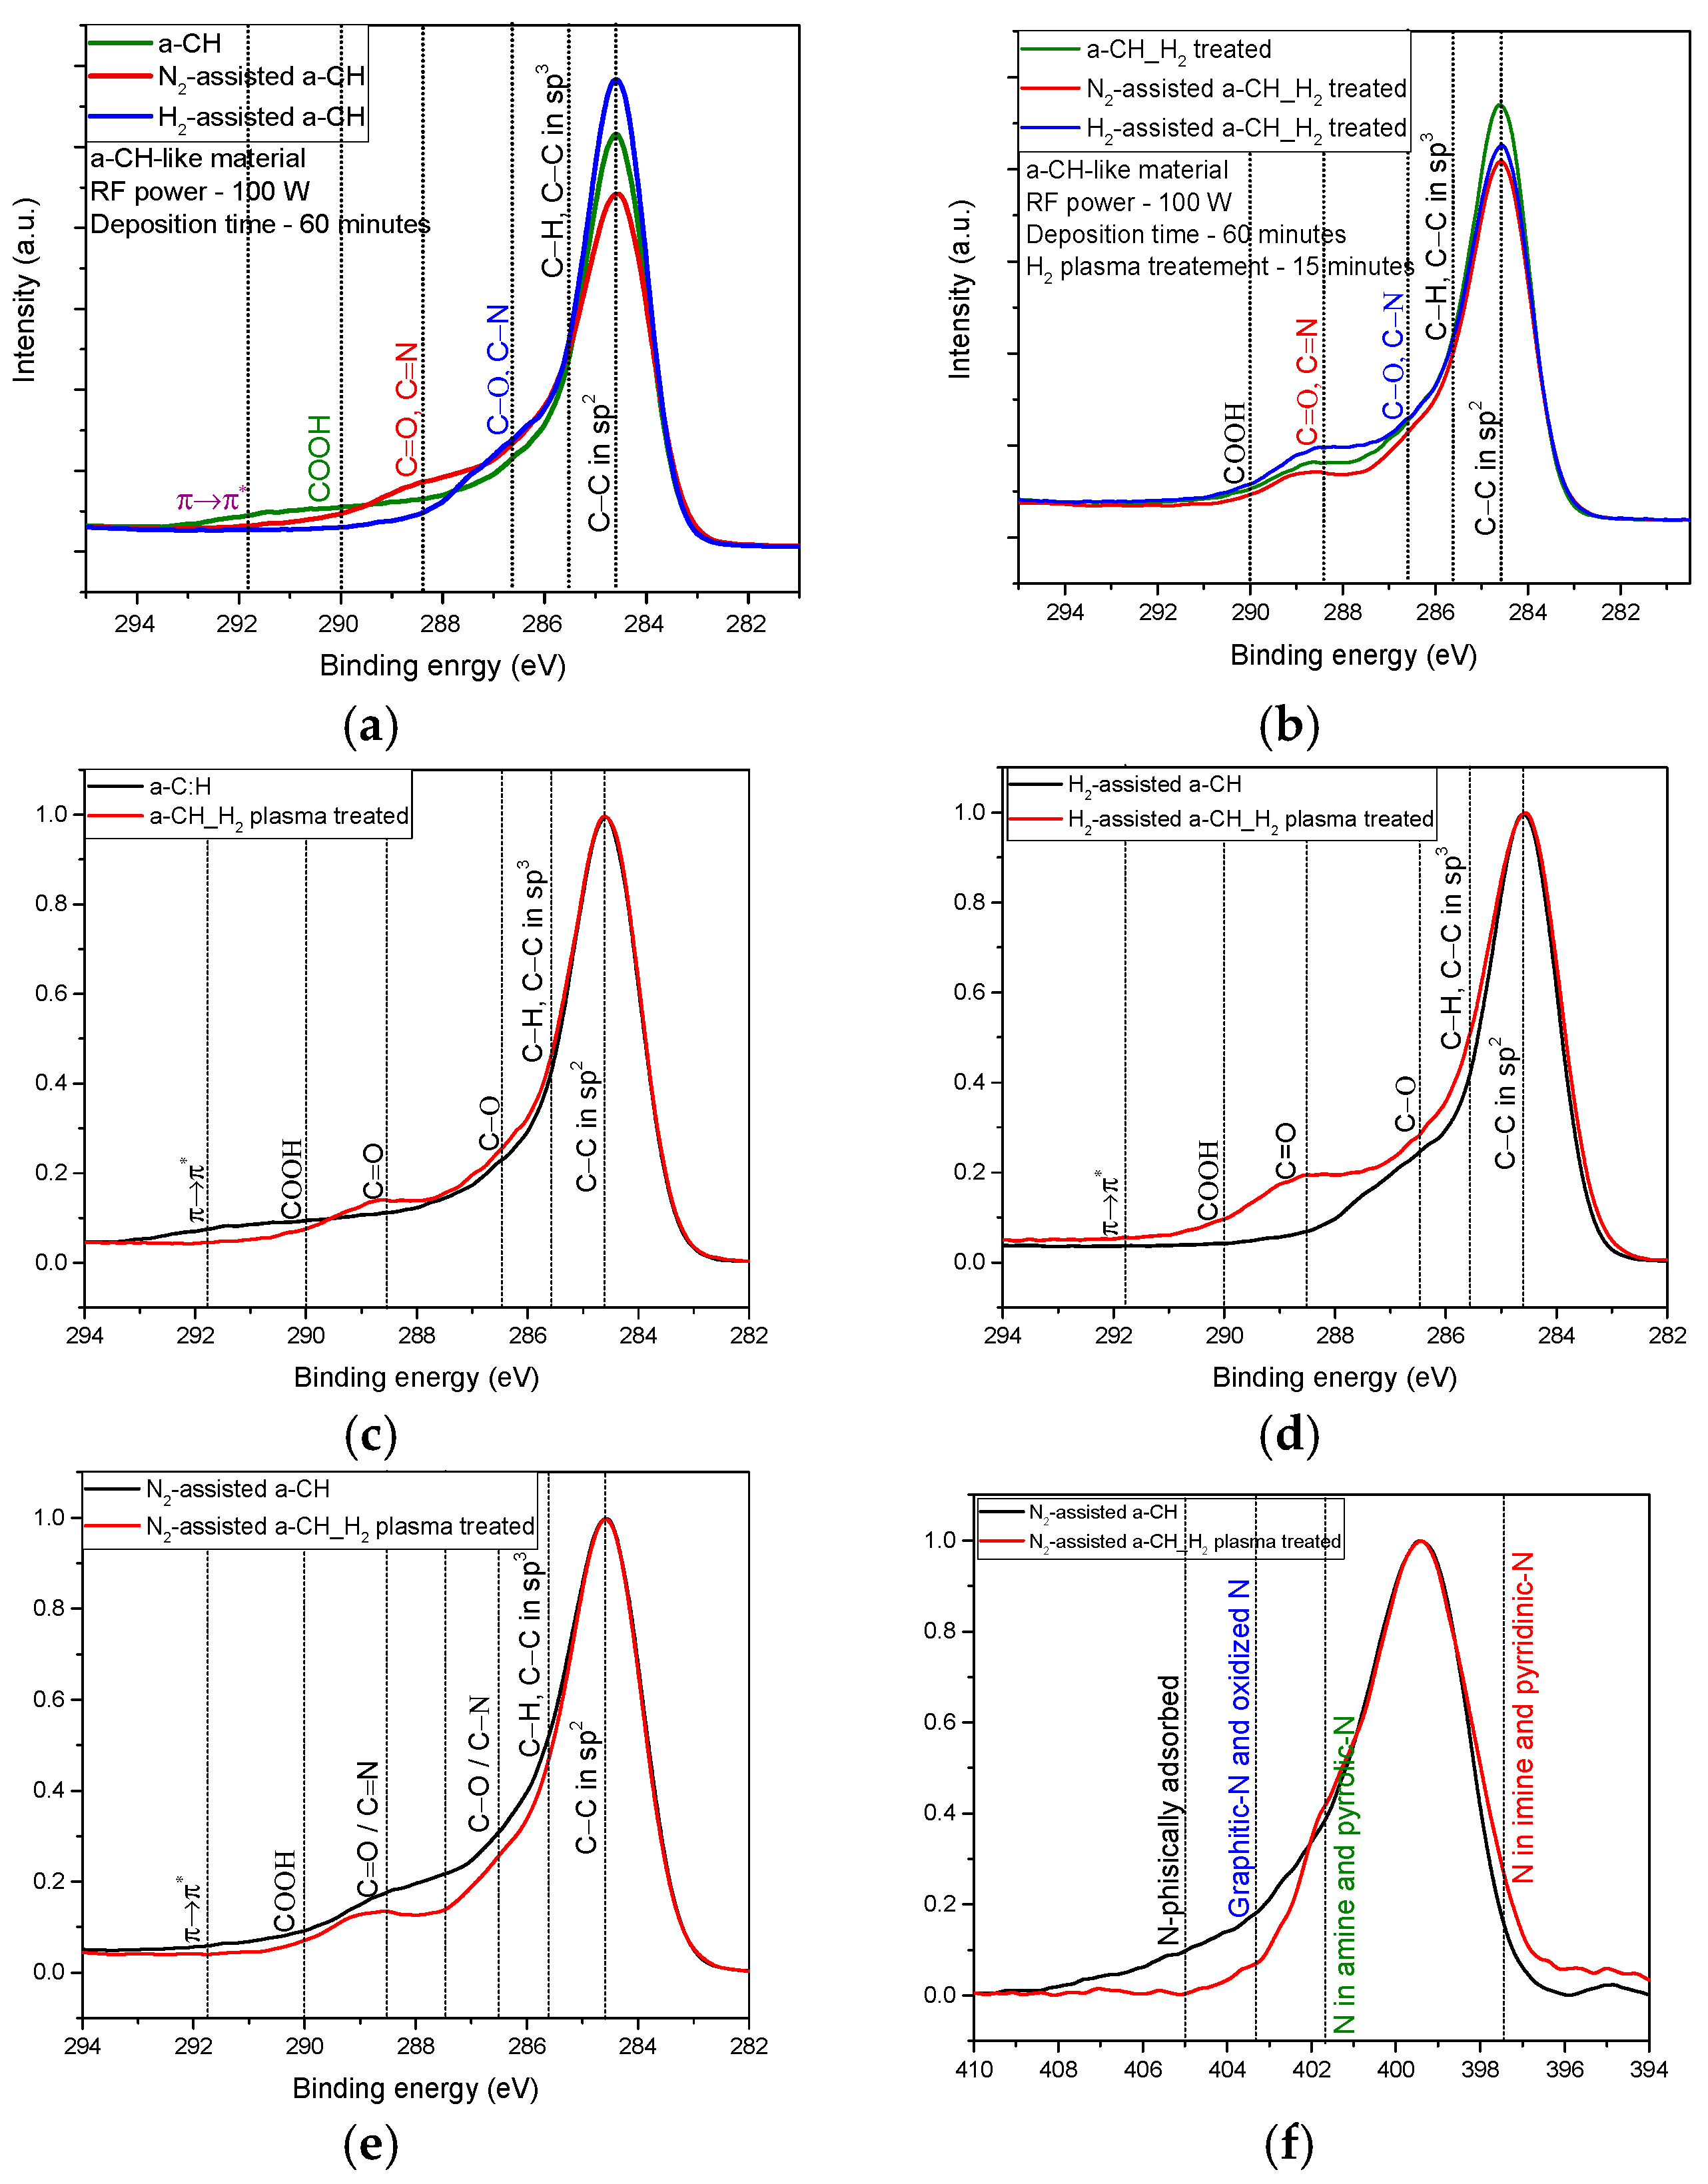
3.2. Chemical Composition

XPS investigations have provided valuable insights into the chemical bonding of a-CH materials and the modifications in surface chemistry due to hydrogen plasma treatment, which are necessary for advanced materials development. Table 2 presents the atomic concentrations of elements derived from the XPS survey spectra and the O/C ratio for all the investigated samples. This includes the as-deposited a-CH materials and the H2 plasma-treated samples. The spectra analysis reveals that the as-deposited a-CH samples primarily comprising carbon, oxygen, and nitrogen are also present on the surface, likely due to surface contamination during plasma treatment or exposure to ambient conditions and to the nitrogen plasma-assisted deposition process, respectively. Following hydrogen plasma treatment, we observed a significant increase in the O/C ratio for all the investigated samples. This observation indicates a higher degree of surface oxidation, attributable to the incorporation of additional oxygen-containing chemical groups from the plasma medium and ambient atmosphere. The change in composition, characterized by the introduction of more oxygen atoms, is likely due to the removal of carbon atoms by hydrogen plasma, which creates vacant sites for oxygen to occupy. Additionally, the higher number of surface-free bonds, either saturated during plasma synthesis or through subsequent atmospheric exposure, further contributes to the increased oxygen content. Consequently, the surface becomes more reactive, exhibiting increased dangling bonds, which enhances the sensing properties of a-CH-based SAW sensors.
Figure 4 presents the overlay of high-resolution spectra for the C1s and N1s regions for a-CH samples before and after hydrogen plasma treatment. The comparative graphs of the C1s region for the as-synthesized a-CH samples, shown in Figure 4a, reveal distinct bonding states influenced by the assisted gases during plasma deposition. A detailed analysis of the C1s region for the as-deposited a-CH samples reveals six distinct subpeaks after calibrating the initial C1s peak to 284.6 eV. These subpeaks are assigned as follows: C=C (sp2) at 284.6 eV, C–C (sp3 or defects) and C–H bonds at 285.5 eV, C-O and C–N at 286.6 eV, C=O and C=N bonds at 288.4 eV, COOH bonds at 290.0 eV, and a subpeak at approximately 291.8 eV attributed to delocalized orbitals, also known as π–π* transitions [31,32].
The comparative graphs of the C1s region for the as-synthesized a-CH samples, shown in Figure 4a, reveal distinct bonding states influenced by the plasma deposition assisting gases. For instance, the samples deposited using Ar/CH4 (a-CH) plasma exhibit pronounced oxidation, suggesting a higher degree of dangling bonds and the incorporation of oxygen atoms both from the plasma medium and the ambient atmosphere. Additionally, a π–π* transition is evidenced in the as-deposited a-CH material. In the nitrogen-assisted a-CH samples, the spectra also reveal the presence of C–N bonds, indicating the successful incorporation of nitrogen atoms into the chemical structure. The C1s spectra for the hydrogen-assisted a-CH material show a high sp2/sp3 ratio and a minimal contribution of C–O bonds, likely formed due to exposure to the ambient atmosphere.
In the case of all the hydrogen plasma-treated a-CH materials shown in Figure 4b, we observed a uniformization of the chemical bonding states, with the surface chemical properties exhibiting a consistent pattern, and it seems to be independent of the initial material.
The C1s region for the hydrogen plasma-treated a-CH materials can be deconvoluted into five components: C–C (sp2), C–C (sp3 or defects) or C–H bonds, C–O/ C–N, C=O bonds, and COOH groups. Figure 4c–e compare the normalized C1s spectra before and after hydrogen plasma treatment. Hydrogen plasma treatment of the a-CH materials results in an increased relative concentration of C–C (sp3) groups or defects, along with a rise in the contribution of C–O and C=O bonds. However, this treatment also causes a significant reduction in the COOH contribution and the delocalized π orbitals. Although a higher oxygen content can disrupt the conjugated π-electron system in carbon materials, thereby reducing the electrical conductivity, it simultaneously increases the chemical reactivity of the surface, which is advantageous for sensing applications. For the nitrogen-assisted a-CH sample, hydrogen plasma treatment results in a decrease in C–N and C=N bonds while simultaneously increasing the contribution of C=O bonds. This is evidenced by a narrower and well-separated peak at 288.8 eV, indicating similar surface oxidation as observed in the other samples. This chemical surface change for all the investigated samples is likely due to hydrogenation, which can convert sp2-hybridized carbon into sp3-hybridized carbon and oxidation, which can disrupt the π-electrons conjunction. However, these alterations in the surface chemistry significantly influenced the absorption of H2S molecules by the sensor’s a-CH-sensitive layer, as confirmed by the sensor tests conducted after the hydrogen plasma treatment.
The high-resolution N1s spectra for the untreated nitrogen-assisted a-CH layer and the hydrogen plasma-treated layer are presented in Figure 4e. The N1s spectra can be deconvoluted into four components as follows: N in imine and pyridinic nitrogen at approximately 397.5 eV, N in amine and pyrrolic nitrogen at 398.9 eV, graphitic nitrogen at around 402.3 eV, and N-physically adsorbed at about 405 eV [33,34]. After hydrogen plasma treatment, an increase in the relative concentration of pyridinic and pyrrolic nitrogen has been observed, along with a decrease in the relative concentration of graphitic and physically adsorbed nitrogen.

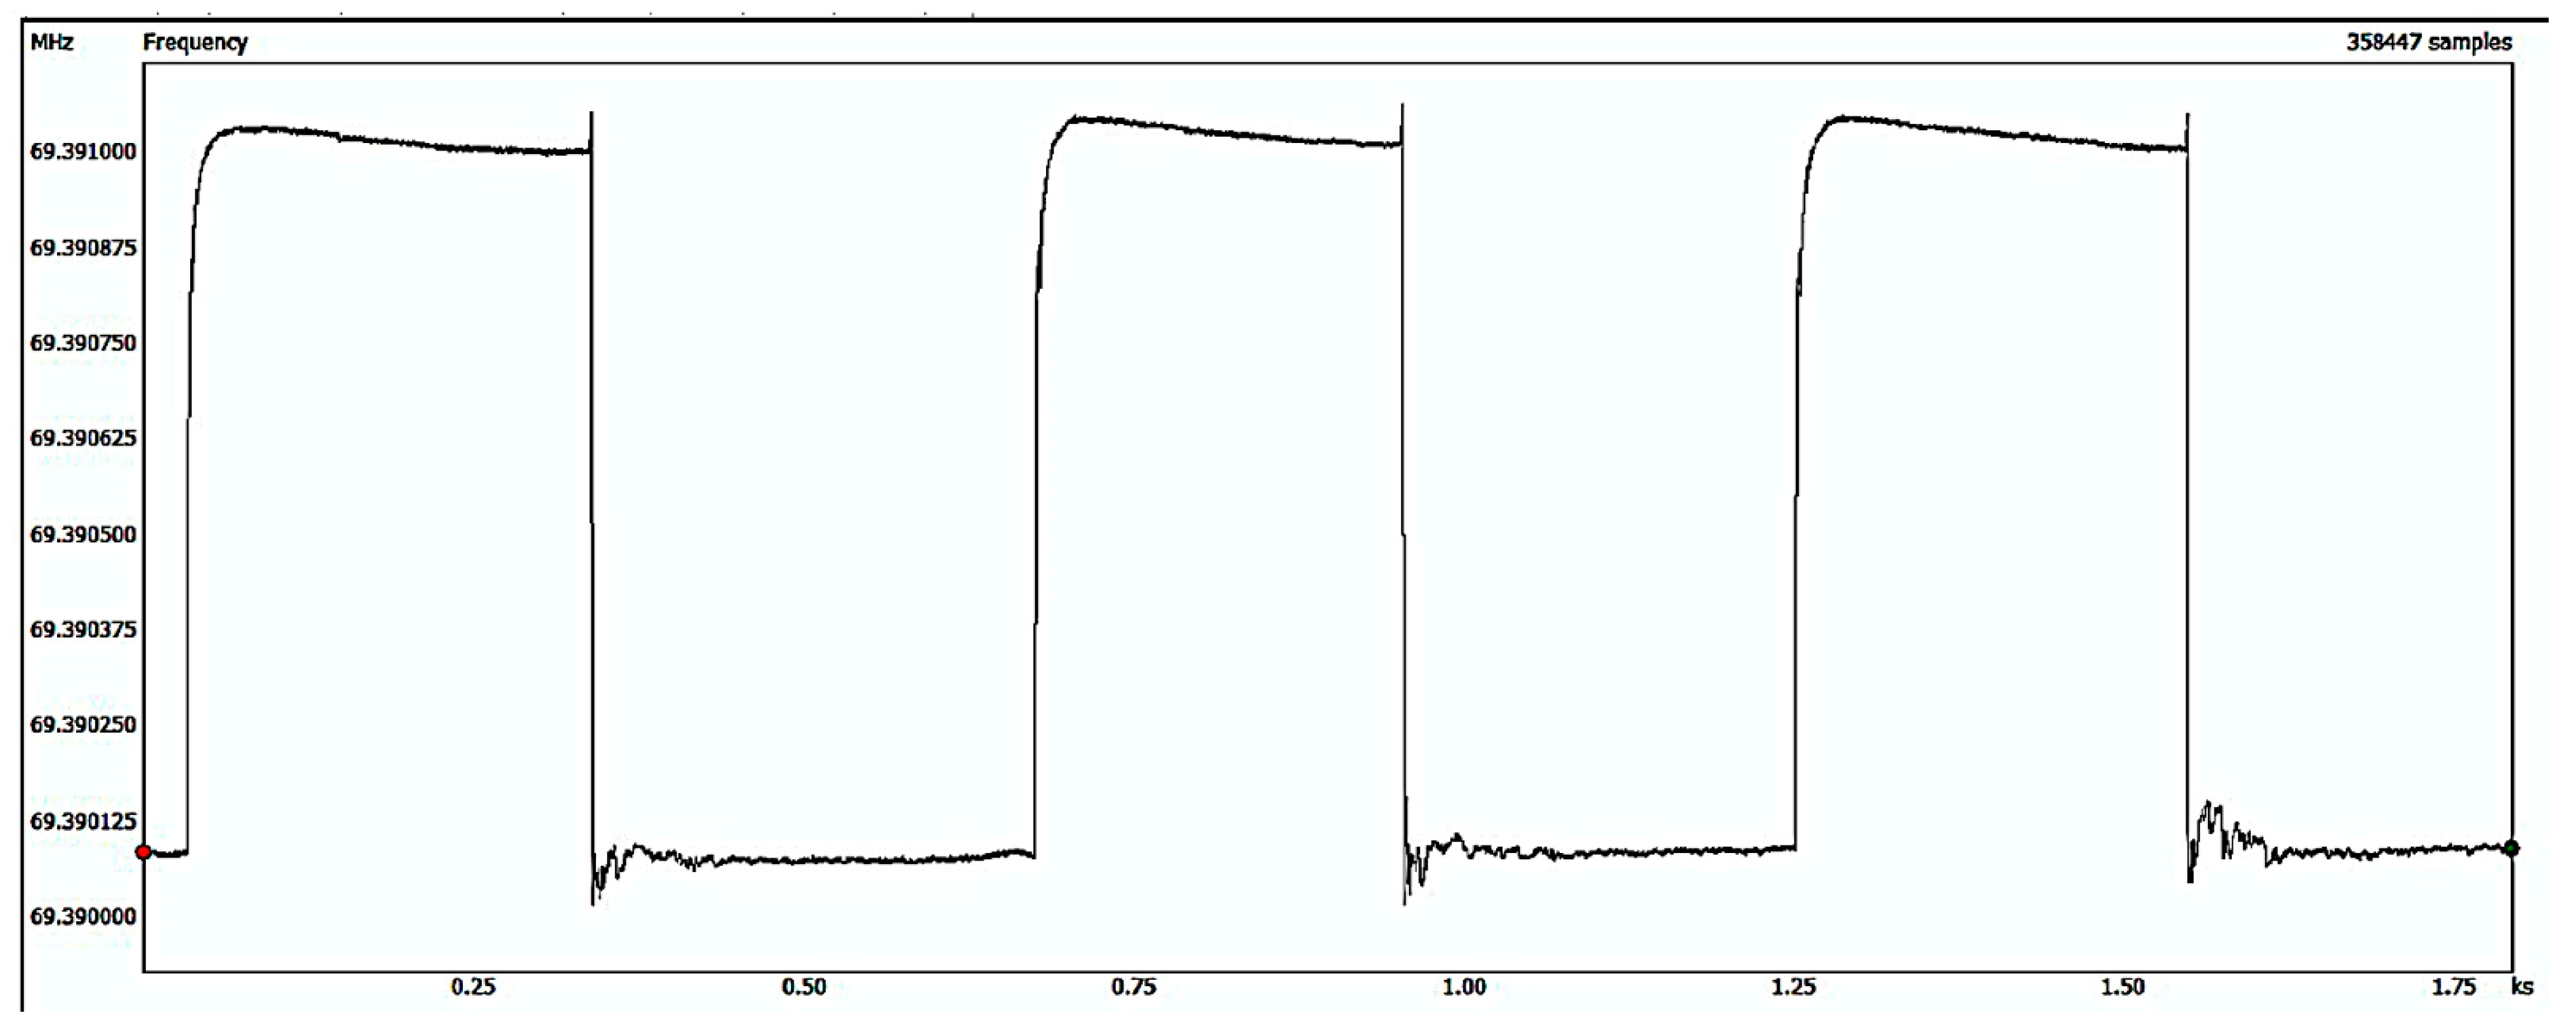
3.3. Gas Sensing Performance of the Sensors

The initial evaluation involved testing untreated hydrogen plasma a-CH-sensitive layers on surface acoustic wave (SAW) sensors to assess their ability to detect hydrogen (H2), hydrogen sulfide (H2S), and methane (CH₄) at a concentration of 20 parts per million (ppm). The sensors exhibited oscillations at a frequency of approximately 69 MHz, and it was observed that the noise level for all the samples tested was 60 Hz. Among the three distinct gases, the sensors exhibited the strongest response to hydrogen sulfide (H2S). More specific, the frequency shift was around 1.5 times higher in the case of H2S exposure as compared to CH4 exposure for all the tested a-CH materials, regardless of the deposition environment, while reaching a frequency shift up to three times higher in the case of exposure to H2S as compared to H2 gas. These results prompted us to prioritize the optimization of the sensitive coating towards this particular gas; as such, all the results on the device response were focused on H2S. Therefore, detailed studies of surface acoustic wave (SAW) sensors were employed to detect hydrogen sulfide (H2S) gas at concentrations ranging from 8 ppm to 20 ppm under normal room temperature conditions and constant humidity.
To exemplify the functionality and stability of the constructed SAW devices based on a-CH active layer to H2S gas, Figure 5 illustrates the dynamic responses of the N2-assisted a-CH-based SAW sensor to a 16 ppm H2S gas concentration. The graph evidences that, upon alternatively being introduced and removed from the cell unit three times, under a H2S exposure time in each sequence exceeding 250 s, the frequency shift of the device under each subsequent measurement remains the same, and in all cases, the sensor exhibited a fast response and recovery time. As such, we can affirm that our devices show good reversibility demonstrated by the dynamic response. Similar results were obtained for all the samples, which showed a response time in the range of 30–45 s and a recovery time of 60–90 s.
The frequency shift of the surface acoustic wave (SAW) sensors based on a-CH at different concentrations of H2S gas is illustrated in Figure 5. It is evident that the employment of hydrogen plasma treatment of a-CH-like films improves the functionality of treated SAW sensors. For all the a-CH-sensitive layers of the SAW sensors exposed to hydrogen plasma treatment and then tested in a H2S environment, there is a considerable enhancement in sensitivity, as indicated in Figure 6. This confirms that plasma methods, with proper tuning parameters, are promising for creating an effective active layer for SAW sensor applications.
H2-assisted a-CH films after H2 plasma treatment with a SAW sensor show the best response in frequency shift, even if the initial sensor before treatment presents a signal in between the values of the other two types of tested films.
Sensitivity is defined as the ratio of the relative frequency shift to the concentration of the analyte. The limit of detection (LOD) is calculated as three times the noise level divided by the sensor sensitivity [17]. In our study, by comparing various types of sensors, it was discovered that sensors utilizing a-CH and hydrogen-assisted a-CH treated by hydrogen plasma demonstrated superior performance in detecting H2S gas at room temperature (RT). These sensors exhibited the same values of sensitivity of 68 Hz/ppm and a limit of detection (LOD) of 0.9 ppm. However, the improvement induced by hydrogen plasma treatment of the active films was more pronounced for the hydrogen-assisted a-CH deposition. The results evidenced a 39% increase of the sensor sensitivity and a decreased limit of detection by 25%, reaching a LOD below 1 ppm, with respect to the as-deposited sample. For further information, please refer to Table 3.
The deposited films exhibited surface roughness and structural compositions, depending on the plasma deposition-assisted gases. The C–C sp2 combined with the surface aspect ratio of the as-obtained a-CH materials played a vital role in achieving a good sensor response. During the sensor testing, sp2 phases, which are predominant in all synthesized films, have a major role in the sensor’s response and their sensitivity and stability [35]. The sensors’ performance was attributed to the optimized structure and composition of the initial films, which facilitated efficient acoustic wave propagation and stronger piezoelectric effects, thereby confirming their crucial role in the functionality of SAW sensors. After further treatment with hydrogen plasma, the film exhibited a significant reduction in unwanted/low-bonded carbon phases and the incorporation of C–O and C=O chemical groups that act as active sites for H2S molecule adsorption. This process led to a more uniform and refined microstructure within the film, minimizing the defects and irregularities that could impede acoustic wave propagation. As a result, there was a substantial improvement in the transmission of acoustic waves through the film. This enhancement in wave transmission is critical for the overall efficiency and sensitivity of surface acoustic wave (SAW) sensors, as it ensures the more accurate and reliable detection of analytes. The improved film quality, with reduced carbon clusters, directly contributes to better sensor performance, including faster response times and higher detection accuracy.
The detection limit of around 1 ppm achieved in this study after hydrogen plasma treatment positions our materials among the top-performing carbon-based materials in comparison to others reported in the literature [34,35,36]. For instance, MoO₃–rGO chemiresistors have demonstrated a response to hydrogen sulfide only down to 50 ppm at 70 °C [37]. Similarly, the SnO2/rGO-based sensors reported by Choi et al. exhibited a detection range of 34–5 ppm H2S at an operating temperature of 200 °C, with response and recovery times around 100 s [37]. Additionally, Fe2O₃/rGO composites synthesized via a supercritical CO2-assisted thermal method, as reported by Jiang et al., showed a detection limit of less than 10 ppm H2S at 130 °C [38]. Furthermore, rGO/Cu2O sensing materials have been reported to detect H2S in the range of 1–4 ppm at 40 °C, with a response of 20% toward 1 ppm H2S [39].

4. Conclusions

This study demonstrates the potential of plasma-enhanced chemical vapor deposition of producing a-CH thin films starting from Ar/CH4 admixture, as well as under the assistance of a secondary gas such as H2 and N2 suitable for surface acoustic wave-based sensors. By fine-tuning the deposition conditions, particularly through gas-assisted plasma deposition and hydrogen plasma treatment, the properties of these films can be significantly altered, thereby enhancing the sensor’s performance. As such, we demonstrated through AFM investigations that hydrogen plasma treatment increased the roughness and porosity, augmenting the surface area for toxic gas adsorption, which would contribute to the sensor’s detection capability and faster recovery time. Moreover, XPS analysis revealed that the initial a-CH thin films had various ratios of sp2 and sp3 carbon, depending on the gas mixture used during the deposition. Ar/H2 plasma treatment stabilizes the sp2 phase and increases the number of defects and C–O/C=O functionalities, allowing toxic gas molecules to be attached and significantly boosting the sensor’s sensitivity and response time.
We explored the H2S gas sensing capabilities of quartz surface acoustic wave (SAW) sensors using these a-CH coatings as the sensing layers. The sensors were tested for their ability to detect hydrogen sulfide (H2S) concentrations ranging from 8 ppm to 20 ppm. The results revealed a robust and consistent response to H2S exposure within this low concentration range.
The sensors exhibited notable sensitivity, characterized by a distinct and measurable frequency shift proportional to the H2S concentration. Additionally, the response time of the sensors was rapid (30–45 s), indicating their capability to quickly detect the presence of H2S gas and reduce any possible toxic gas accumulation. The recovery time was also swift, allowing the sensors to return to their baseline state promptly after the removal of the gas, which is crucial for applications requiring continuous monitoring. The LOD of below 1 ppm in the case of hydrogen plasma-treated active layers evidences the beneficial effect induced upon plasma exposure, in correlation with the topographic and chemical modifications induced by plasma. These performance metrics highlight the effectiveness of the a-CH-like films in enhancing the gas sensing capabilities of quartz SAW sensors. The combination of a good response and fast recovery times makes these sensors particularly suitable for the real-time monitoring and detection of H2S in various industrial and environmental settings. Future studies regarding the optimization of sensors based on a-CH active surface media include their testing in different levels of water vapors, as well as measurements of their response to gases with strong absorption in water vapor that undergo electrolytic dissociation. Also, further plans include the development of a sensor assembly with an integrated reference sensor to better mitigate environmental influences and focus on achieving selective detection in more complex conditions.

Author Contributions

Conceptualization, V.S. and C.V.; methodology, V.S., C.V., S.V. and G.D.; formal analysis, S.V., M.P. and S.B.; investigation, V.S., S.V., M.P., S.B. and C.V.; writing—original draft preparation, V.S., S.V., B.M. and C.V.; writing—review and editing, V S., G.D., S.V., B.M. and C.V. All authors have read and agreed to the published version of the manuscript.

Funding

This research was funded by the Romanian Ministry of Research, Innovation and Digitization through the project ELI-RO Program, ELI-RO/RDI/2024_039, and the Romanian National Core Program LAPLAS VII, contract no. 30N/2023 of the National Institute for Lasers, Plasma and Radiation Physics.

Institutional Review Board Statement

Not applicable.

Informed Consent Statement

Not applicable.

Data Availability Statement

The data are included in the article.

Conflicts of Interest

The authors declare no conflicts of interest.

References

  1. Public Health England. Compendium of Chemical Hazards: Hydrogen Sulphide, Hydrogen Sulphide Toxicological Overview; Public Health England: London, UK, 2016; p. 2014790. [Google Scholar]
  2. Minier-Matar, J.; Janson, A.; Hussain, A.; Adham, S. Application of Membrane Contactors to Remove Hydrogen Sulfide from Sour Water. J. Membr. Sci. 2017, 541, 378–385. [Google Scholar] [CrossRef]
  3. Peluso, A.; Gargiulo, N.; Aprea, P.; Pepe, F.; Caputo, D. Nanoporous Materials as H2S Adsorbents for Biogas Purification: A Review. Sep. Purif. Rev. 2018, 48, 78–89. [Google Scholar] [CrossRef]
  4. Coe, L.C.C. Ambient Hydrogen Sulfide Levels at a Wastewater Treatment Plant. Environ. Monit. Assess. 1985, 5, 101–108. [Google Scholar] [CrossRef]
  5. Jiang, J.; Chan, A.; Ali, S.; Moon, C.; Vasdev, S.; Mantha, S.; Kartha, V.; Mukherjee, S.D. Hydrogen Sulfide—Mechanisms of Toxicity and Development of an Antidote. Sci. Rep. 2016, 6, 20831. [Google Scholar] [CrossRef]
  6. Wu, W.; Long, J.; Guo, Y.; Zu, X.; Li, S.; Xiang, X. P-CuO/n-TiO2 Heterojunction Nanostructure-Based Surface Acoustic Wave Sensor with Strong Electric Loading Effect for Highly Sensitive H2S Gas Sensing. Sens. Actuators B Chem. 2023, 394, 134380. [Google Scholar] [CrossRef]
  7. Li, D.; Wang, L.; Zhao, Z.; Ma, J.; Liu, Y.; Zhang, H.; Ma, J. High Humidity Enhanced Surface Acoustic Wave (SAW) H2S Sensors Based on Sol–Gel CuO Films. Sens. Actuators B Chem. 2019, 294, 55–61. [Google Scholar] [CrossRef]
  8. Tang, Y.; Wu, W.; Wang, B.; Dai, X.; Xie, W.; Yang, Y.; Zhang, R.; Shi, X.; Zhu, H.; Luo, J.; et al. H2S Gas Sensing Performance and Mechanisms Using CuO-Al2O3 Composite Films Based on Both Surface Acoustic Wave and Chemiresistor Techniques. Sens. Actuators B Chem. 2020, 325, 128742. [Google Scholar] [CrossRef]
  9. Shin, J.; Lee, G.; Choi, M.; Jang, H.; Lim, Y.; Kim, G.-S.; Nam, S.-H.; Baek, S.-H.; Song, H.-C.; Kim, J.; et al. Atomically Mixed Catalysts on a 3D Thin-Shell TiO2 for Dual-Modal Chemical Detection and Neutralization. J. Mater. Chem. A 2023, 11, 18195–18206. [Google Scholar] [CrossRef]
  10. Maier, K.; Helwig, A.; Müller, G.; Hille, P.; Eickhoff, M. Effect of Water Vapor and Surface Morphology on the Low Temperature Response of Metal Oxide Semiconductor Gas Sensors. Materials 2015, 8, 6570–6588. [Google Scholar] [CrossRef]
  11. Constantinoiu, I.; Viespe, C. Hydrogen Detection with SAW Polymer/Quantum Dots Sensitive Films. Sensors 2019, 19, 4481. [Google Scholar] [CrossRef]
  12. Abdullah, A.N.; Kamarudin, K.; Kamarudin, L.M.; Adom, A.H.; Mamduh, S.M.; Mohd Juffry, Z.H.; Bennetts, V.H. Correction Model for Metal Oxide Sensor Drift Caused by Ambient Temperature and Humidity. Sensors 2022, 22, 3301. [Google Scholar] [CrossRef] [PubMed]
  13. Du, Z.; Zhang, S.; Li, J.; Gao, N.; Tong, K. Mid-Infrared Tunable Laser-Based Broadband Fingerprint Absorption Spectroscopy for Trace Gas Sensing: A Review. Appl. Sci. 2019, 9, 338. [Google Scholar] [CrossRef]
  14. Wang, X.; Zhang, S.; Liu, J.; Sun, Y.; Zhang, X. Pd/Ni Nanowire Film Coated SAW Hydrogen Sensor with Fast Response. Sens. Actuators B Chem. 2021, 345, 130952. [Google Scholar] [CrossRef]
  15. Liu, X.; Wang, W.; Zhang, Y.; Pan, Y.; Liang, Y.; Li, J. Enhanced Sensitivity of a Hydrogen Sulfide Sensor Based on Surface Acoustic Waves at Room Temperature. Sensors 2018, 18, 3796. [Google Scholar] [CrossRef]
  16. Nicolae, I.; Viespe, C.; Grigoriu, C. Nanocomposite Sensitive Polymeric Films for SAW Sensors Deposited by the MAPLE Direct Write Technique. Sens. Actuators B Chem. 2011, 158, 418–422. [Google Scholar] [CrossRef]
  17. Ballantine, D.S.; White, R.M.; Martin, S.J.; Ricco, A.J.; Zellers, E.T.; Frye, G.C.; Wohtjen, H. Acoustic Wave Sensors, Theory, Design, and Physico-Chemical Applications; Academic Press: San Diego, CA, USA, 1997. [Google Scholar]
  18. Falconer, R.S. A Versatile SAW-Based Sensor System for Investigating Gas-Sensitive Coatings. Sens. Actuators B Chem. 1995, 24–25, 54–57. [Google Scholar] [CrossRef]
  19. Yoo, B.K.; Park, Y.W.; Kang, C.Y.; Yoon, S.J.; Kim, J.S. Surface Acoustic Wave Sensors to Detect Volatile Gases by Measuring Output Phase Shift. J. Electroceram. 2006, 17, 1013–1017. [Google Scholar] [CrossRef]
  20. Marcu, A.; Nicolae, I.; Viespe, C. Active Surface Geometrical Control of Noise in Nanowire-SAW Sensors. Sens. Actuators B Chem. 2016, 231, 469–473. [Google Scholar] [CrossRef]
  21. Marcu, A.; Viespe, C. Surface Acoustic Wave Sensors for Hydrogen and Deuterium Detection. Sensors 2017, 17, 1417. [Google Scholar] [CrossRef]
  22. Zhu, H.; Xie, D.; Lin, S.; Zhang, W.; Yang, Y.; Zhang, R.; Shi, X.; Wang, H.; Zhang, Z.; Zu, X.; et al. Elastic Loading Enhanced NH3 Sensing for Surface Acoustic Wave Sensor with Highly Porous Nitrogen-Doped Diamond-like Carbon Film. Sens. Actuators B Chem. 2021, 344, 130175. [Google Scholar] [CrossRef]
  23. Kalinin, V. Wireless Physical SAW Sensors for Automotive Applications. In Proceedings of the 2011 IEEE International Ultrasonics Symposium (IUS), Orlando, FL, USA, 18–21 October 2011; pp. 212–221. [Google Scholar] [CrossRef]
  24. Wilson, W.C.; Malocha, D.C.; Kozlovski, N.; Gallagher, D.R.; Fisher, B.; Pavlina, J.; Saldanha, N.; Puccio, D.; Atkinson, G.M. Orthogonal Frequency Coded SAW Sensors for Aerospace SHM Applications. IEEE Sens. J. 2009, 9, 1546–1556. [Google Scholar] [CrossRef]
  25. Tittmann, B.R. Recent Results and Trends in Health Monitoring with Surface Acoustic Waves (SAWs). In Testing, Reliability, and Application of Micro- and Nano-Material Systems; Meyendorf, N., Baaklini, G.Y., Michel, B., Eds.; SPIE: Bellingham, WA, USA, 2003; Volume 5045, pp. 37–46. [Google Scholar] [CrossRef]
  26. Chevallier, E.; Scorsone, E.; Bergonzo, P. New Sensitive Coating Based on Modified Diamond Nanoparticles for Chemical SAW Sensors. Sens. Actuators B Chem. 2011, 154, 238–244. [Google Scholar] [CrossRef]
  27. Mohasin Sulthana, N.; Ganesan, K.; Ajikumar, P.K. Enhanced Sensitivity of Partial O-Terminated H-Diamond for H2S Detection at Room Temperature. Diam. Relat. Mater. 2023, 140, 110568. [Google Scholar] [CrossRef]
  28. Rao, X.; Yang, J.; Chen, Z.; Yuan, Y.; Chen, Q.; Feng, X.; Qin, L.; Zhang, Y. Tuning C–C sp2/sp3 Ratio of DLC Films in FCVA System for Biomedical Application. Bioact. Mater. 2020, 5, 192–200. [Google Scholar] [CrossRef]
  29. Zia, A.W.; Hussain, S.A.; Rasul, S.; Bae, D.; Pitchaimuthu, S. Progress in Diamond-Like Carbon Coatings for Lithium-Based Batteries. J. Energy Storage 2023, 72, 108803. [Google Scholar] [CrossRef]
  30. Luo, W.; Fu, Q.; Deng, J.; Yan, G.; Zhou, D.; Gong, S.; Hu, Y. An Integrated Passive Impedance-Loaded SAW Sensor. Sens. Actuators B Chem. 2013, 187, 215–220. [Google Scholar] [CrossRef]
  31. Nilkar, M.; Ghodsi, F.E.; Jafari, S.; Thiry, D.; Snyders, R. Effects of Nitrogen Incorporation on N-Doped DLC Thin Film Electrodes Fabricated by Dielectric Barrier Discharge Plasma: Structural Evolution and Electrochemical Performances. J. Alloys Compd. 2021, 853, 157298. [Google Scholar] [CrossRef]
  32. Li, O.L.; Chiba, S.; Wada, Y.; Panomsuwan, G.; Ishizaki, T. Synthesis of Graphitic-N and Amino-N in Nitrogen-Doped Carbon via a Solution Plasma Process and Exploration of Their Synergic Effect for Advanced Oxygen Reduction Reaction. J. Mater. Chem. A 2017, 5, 2073. [Google Scholar] [CrossRef]
  33. Chen, Z.; Jaworski, A.; Chen, J.; Budnyak, T.M.; Szewczyk, I.; Rokicińska, A.; Dronskowski, R.; Hedin, N.; Kuśtrowski, P.; Slabon, A. Graphitic Nitrogen in Carbon Catalysts Is Important for the Reduction of Nitrite as Revealed by Naturally Abundant 15N NMR Spectroscopy. Dalton Trans. 2021, 50, 6857–6866. [Google Scholar] [CrossRef]
  34. Niu, K.; Gao, J.; Wu, L.; Lu, X.; Chen, J. Nitrogen-Doped Graphdiyne as a Robust Electrochemical Biosensing Platform for Ultrasensitive Detection of Environmental Pollutants. Anal. Chem. 2021, 93, 8656–8662. [Google Scholar] [CrossRef]
  35. Vizireanu, S.; Constantinoiu, I.; Satulu, V.; Stoica, S.D.; Viespe, C. High-Sensitivity H2 and CH4 SAW Sensors with Carbon Nanowalls and Improvement in Their Performance after Plasma Treatment. Chemosensors 2023, 11, 566. [Google Scholar] [CrossRef]
  36. MalekAlaie, M.; Jahangiri, M.; Rashidi, A.M.; HaghighiAsl, A.; Izadi, N. Selective Hydrogen Sulfide (H2S) Sensors Based on Molybdenum Trioxide (MoO3) Nanoparticle Decorated Reduced Graphene Oxide. Mater. Sci. Semicond. Process. 2015, 38, 93–100. [Google Scholar] [CrossRef]
  37. Choi, S.J.; Jang, B.H.; Lee, S.J.; Min, B.K.; Rothschild, A.; Kim, I.D. Selective Detection of Acetone and Hydrogen Sulfide for the Diagnosis of Diabetes and Halitosis Using SnO2 Nanofibers Functionalized with Reduced Graphene Oxide Nanosheets. ACS Appl. Mater. Interfaces 2014, 6, 2588–2597. [Google Scholar] [CrossRef] [PubMed]
  38. Jiang, Z.; Li, J.; Aslan, H.; Li, Q.; Li, Y.; Chen, M.; Huang, Y.; Froning, J.P.; Otyepka, M.; Zboril, R.; et al. A High Efficiency H2S Gas Sensor Material: Paper-Like Fe2O3/Graphene Nanosheets and Structural Alignment Dependency of Device Efficiency. J. Mater. Chem. A 2014, 2, 6714–6717. [Google Scholar] [CrossRef]
  39. Zhou, Y.; Wang, Y.; Guo, Y. Cuprous Oxide Nanowires/Nanoparticles Decorated on Reduced Graphene Oxide Nanosheets: Sensitive and Selective H2S Detection at Low Temperature. Mater. Lett. 2019, 254, 336–339. [Google Scholar] [CrossRef]
Figure 1. Experimental setup for the evaluation of the SAW sensors.
Chemosensors 12 00194 g001
Figure 2. Comparative investigations by means of the AFM technique of as-deposited and hydrogen plasma-treated materials. (af) The 2D AFM images of thin films [(a) a-CH, (b) H2-assisted a-CH, (c) N2-assisted a-CH-sensitive layers, (d) a-CH, (e) H2-assisted a-CH, (f) N2-assisted a-CH-sensitive layers], and (gi) the comparative height profiles of as-deposited and hydrogen plasma-treated thin films of (g) a-CH, (h) H2-assisted a-CH, and (i) N2-assisted a-CH.
Chemosensors 12 00194 g002aChemosensors 12 00194 g002b
Figure 3. Comparative distribution of pixel heights for as-synthetized and hydrogen plasma-treated a-CH layers: (a) a-CH, (b) H2-assisted a-CH, and (c) N2-assisted a-CH.
Chemosensors 12 00194 g003
Figure 4. High-resolution XPS spectra for the C1s region of the (a) as-deposited a-CH layers and (b) hydrogen plasma-treated a-CH layers, comparative spectra of the C1s region for the (c) as-deposited and H2 plasma-treated a-CH sample; (d) as-deposited and H2 plasma-treated layers of the H2-assisted a-CH samples; comparative spectra of the as-deposited and H2 plasma-treated layers of the N2-assisted a-CH samples for the (e) C1s region and (f) N1s region.
Chemosensors 12 00194 g004
Figure 5. Dynamic responses of the N2-assisted a-CH-based SAW sensor to a 16 ppm H2S gas concentration.
Chemosensors 12 00194 g005
Figure 6. The frequency shift of the SAW sensors at different H2S gas concentrations, evidencing a linear response.
Chemosensors 12 00194 g006
Table 1. Experimental conditions for synthesizing a-CH-sensitive layers for SAW sensors.
SamplesPlasma Deposition
Environment
Plasma Exposure
Time (min)
Plasma Treatment
Environment
a-CHCH4/Ar—50/2560-
H2-assisted a-CHCH4/Ar/H2—50/25/560-
N2-assisted a-CHCH4/Ar/N2—50/25/560
a-CH_H2 treated 15Ar/H2—100/25
H2-assisted a-CH_H2 treated 15Ar/H2—100/25
N2-assisted a-CH_H2 treated 15Ar/H2—100/25
Table 2. The relative atomic concentration a-CH-based materials and H2 plasma-treated a-CH deposited onto SAW electrodes.
Sample/ElementPP At. %
C1sO1sN1sO/C Ratio
a-CH86.0713.93-0.16
a-CH_H2 treatment61.0938.91-0.64
H2-assisted a-CH91.158.85-0.10
H2-assisted a-CH_H2 treatment61.6638.34-0.62
N2-assisted a-CH86.8110.962.240.13
N2-assisted a-CH_H2 treatment48.3850.391.231.04
Table 3. Sensitivity and LOD of the sensors in the H2S tests.
SensorSensitivity
(Δf/c)
(Hz/ppm)
LOD
(3xn)/(Δf/c)
(ppm)
a-CH531.14
a-CH_H2 treated680.9
H2-assisted a-CH491.2
H2-assisted a-CH_H2 treated680.9
N2-assisted a-CH451.3
N2-assisted a-CH_H2 treated650.9
Legend: Δf—frequency shift, c—H2S concentration, and n—noise level.
Disclaimer/Publisher’s Note: The statements, opinions and data contained in all publications are solely those of the individual author(s) and contributor(s) and not of MDPI and/or the editor(s). MDPI and/or the editor(s) disclaim responsibility for any injury to people or property resulting from any ideas, methods, instructions or products referred to in the content.

