Ceramic Nanotubes—Conducting Polymer Assemblies with Potential Application as Chemosensors for Breath Ammonia Detection in Chronic Kidney Disease

 , and
, and
Abstract
:1. Introduction
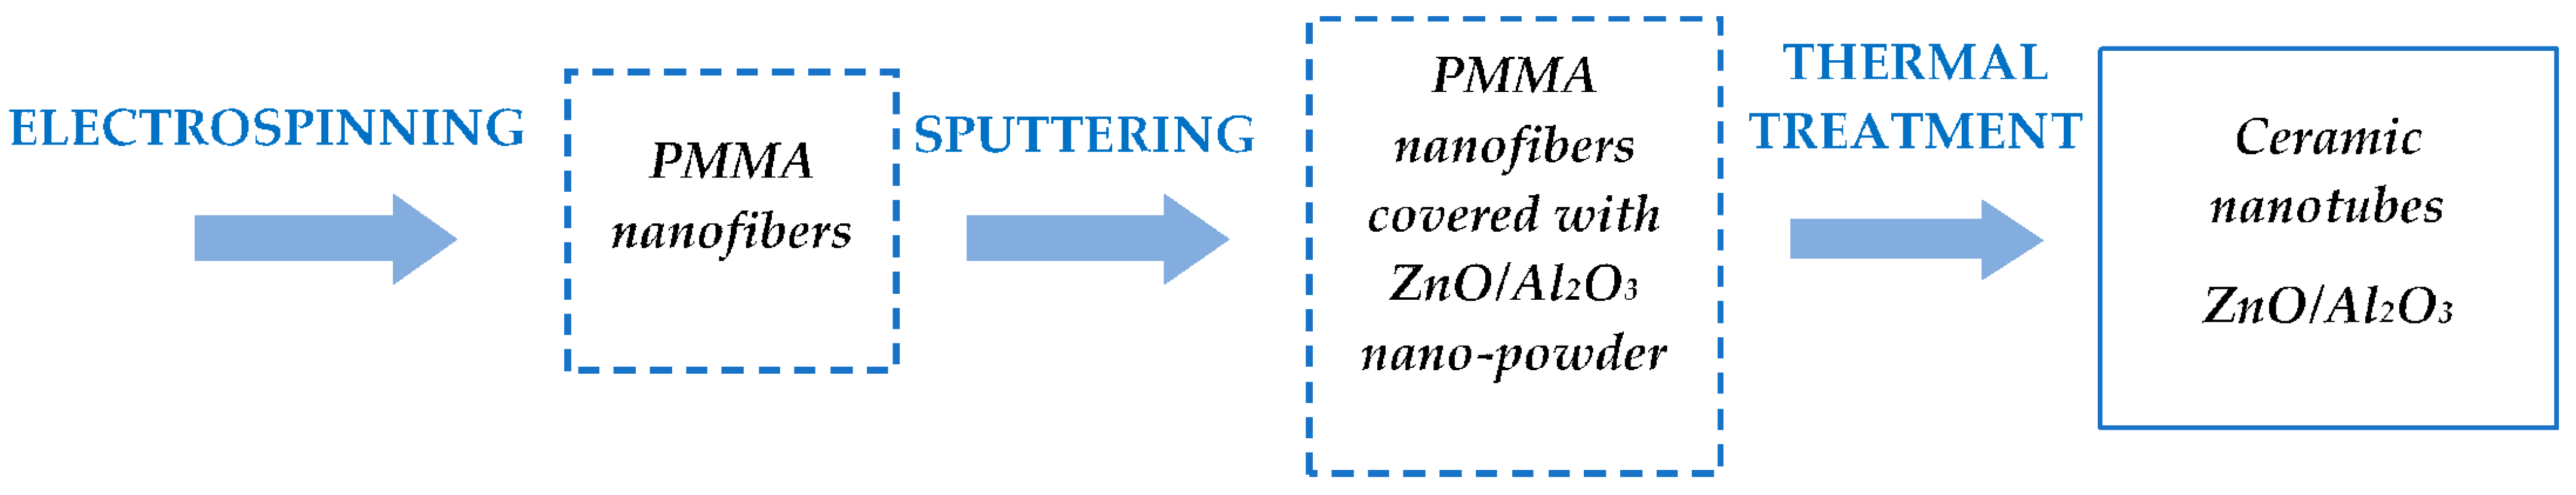
2. Technology for Obtaining Hybrid Nanostructures from Ceramic Nanotubes and Conducting Polymers
2.1. Technological Equipment
2.2. Materials and Preparation Methods
3. Results and Discussion
3.1. Characterization Equipment
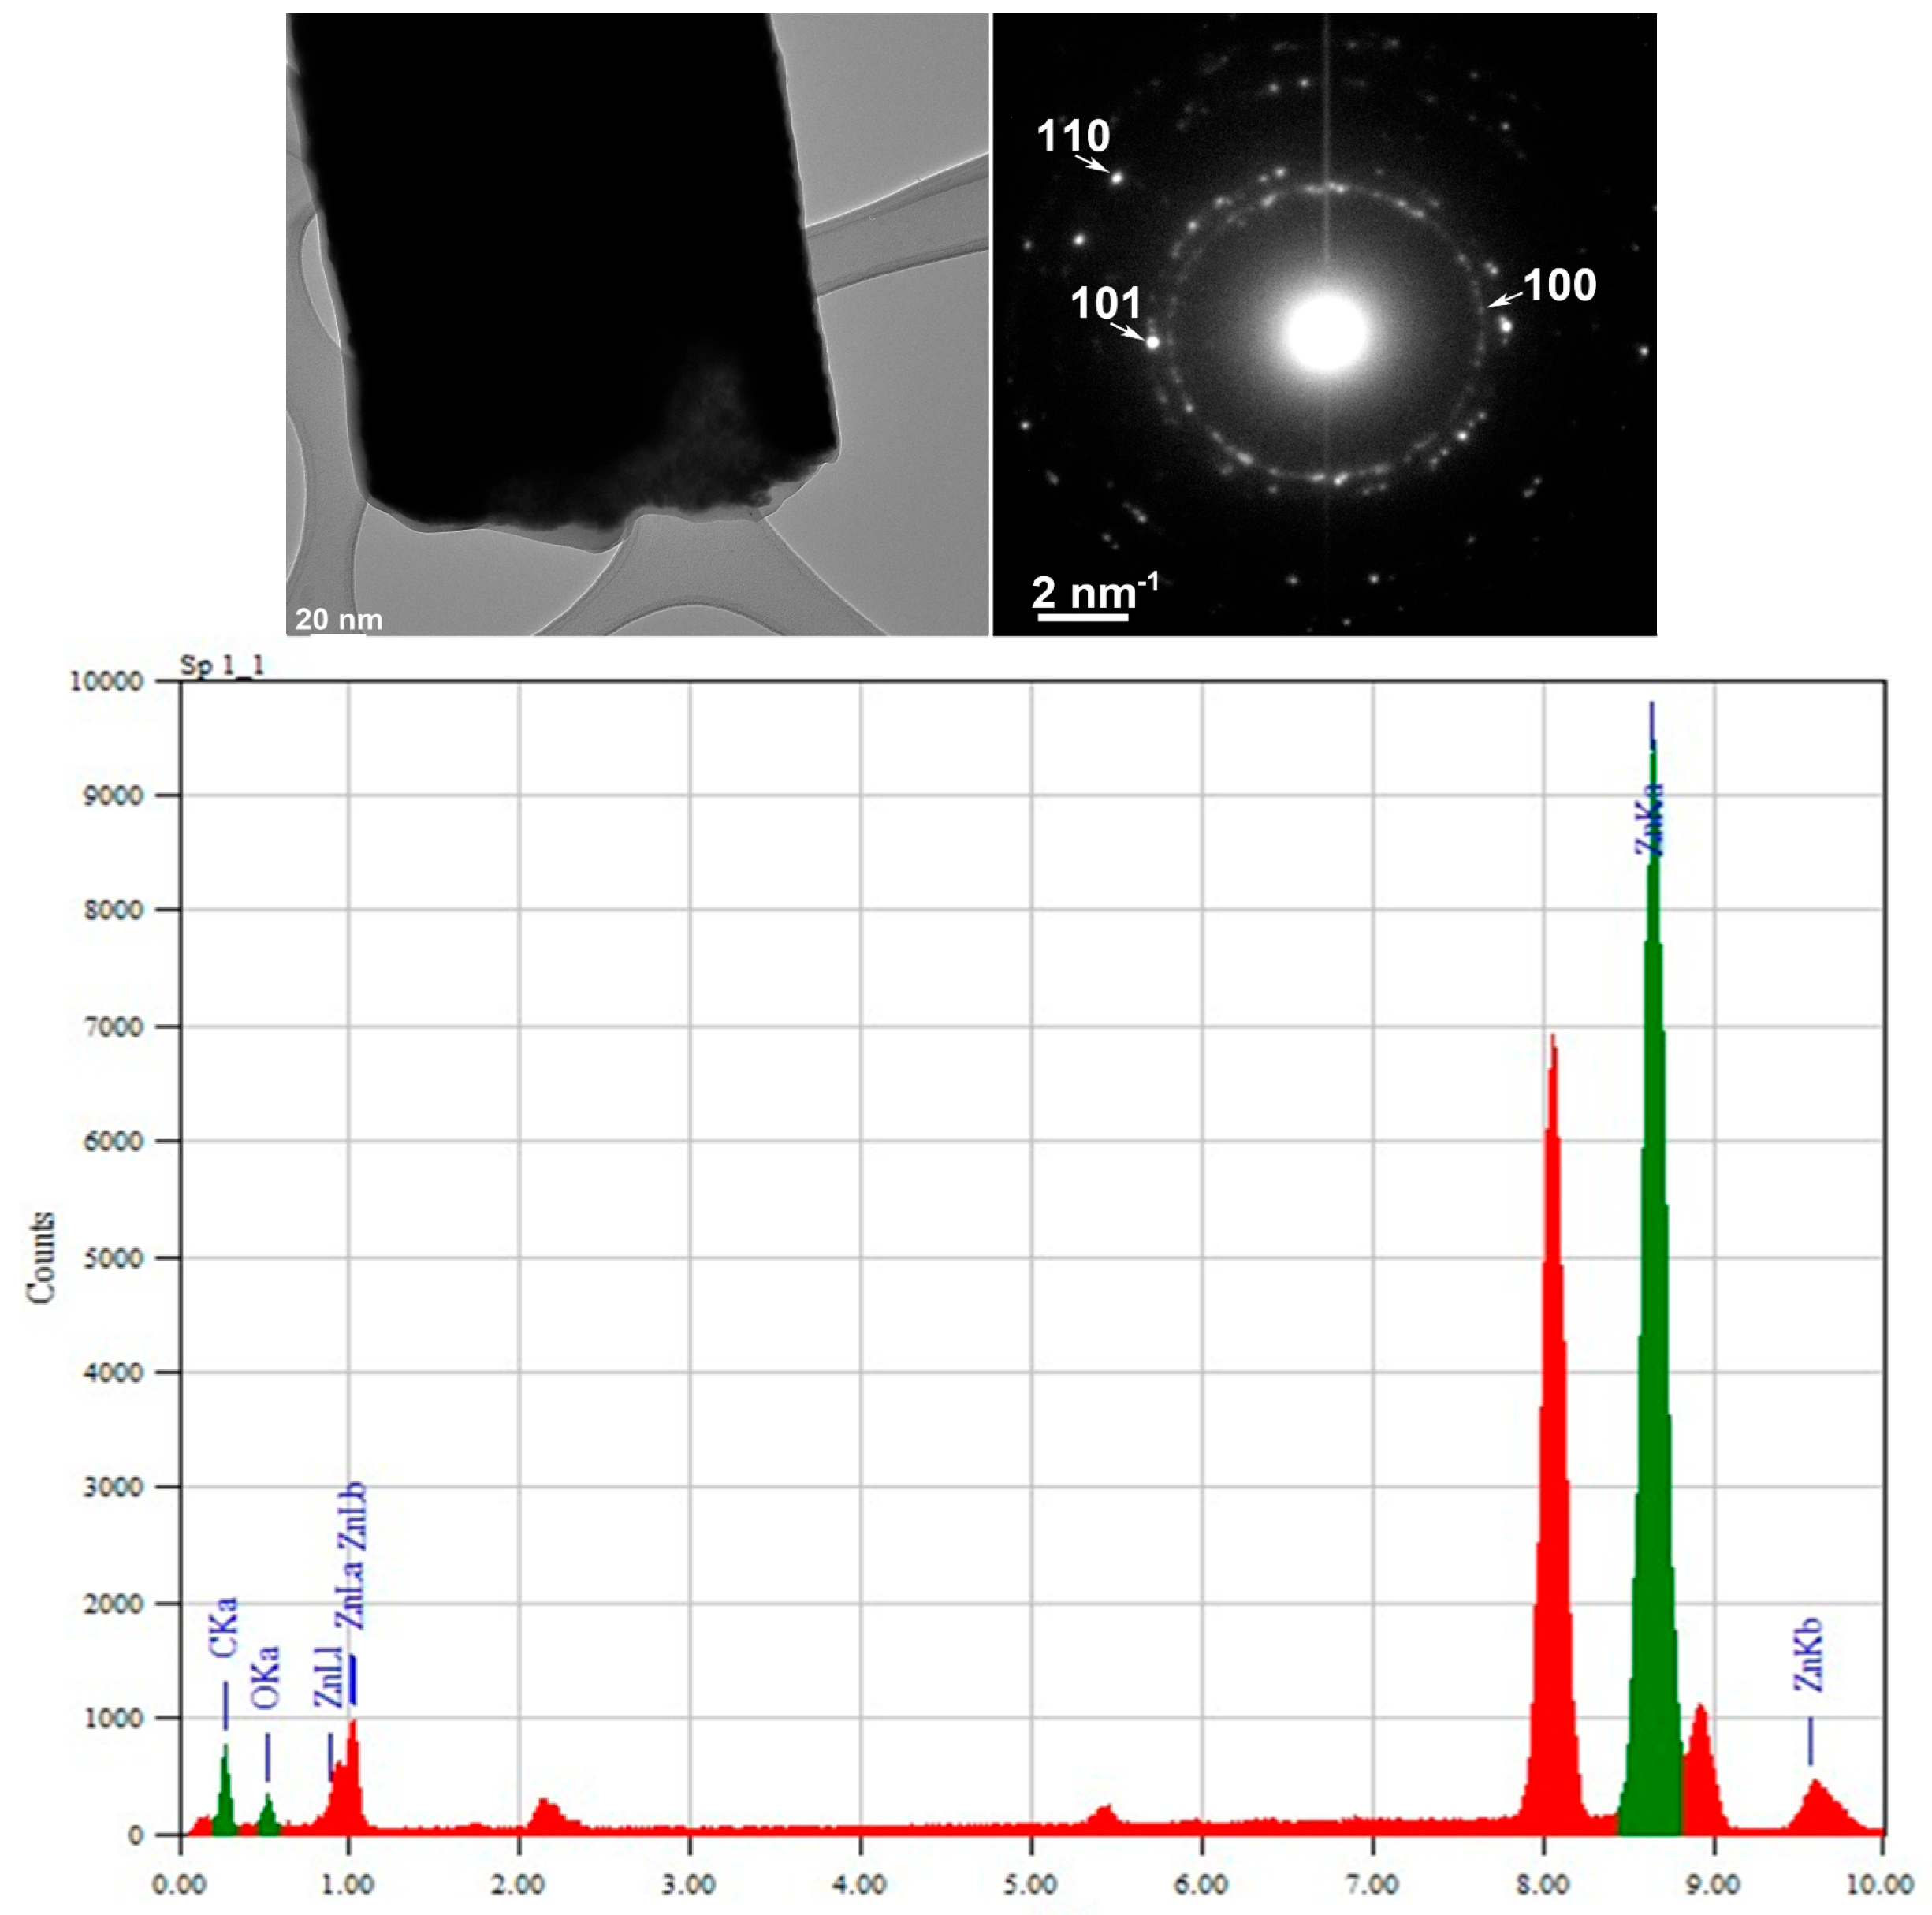
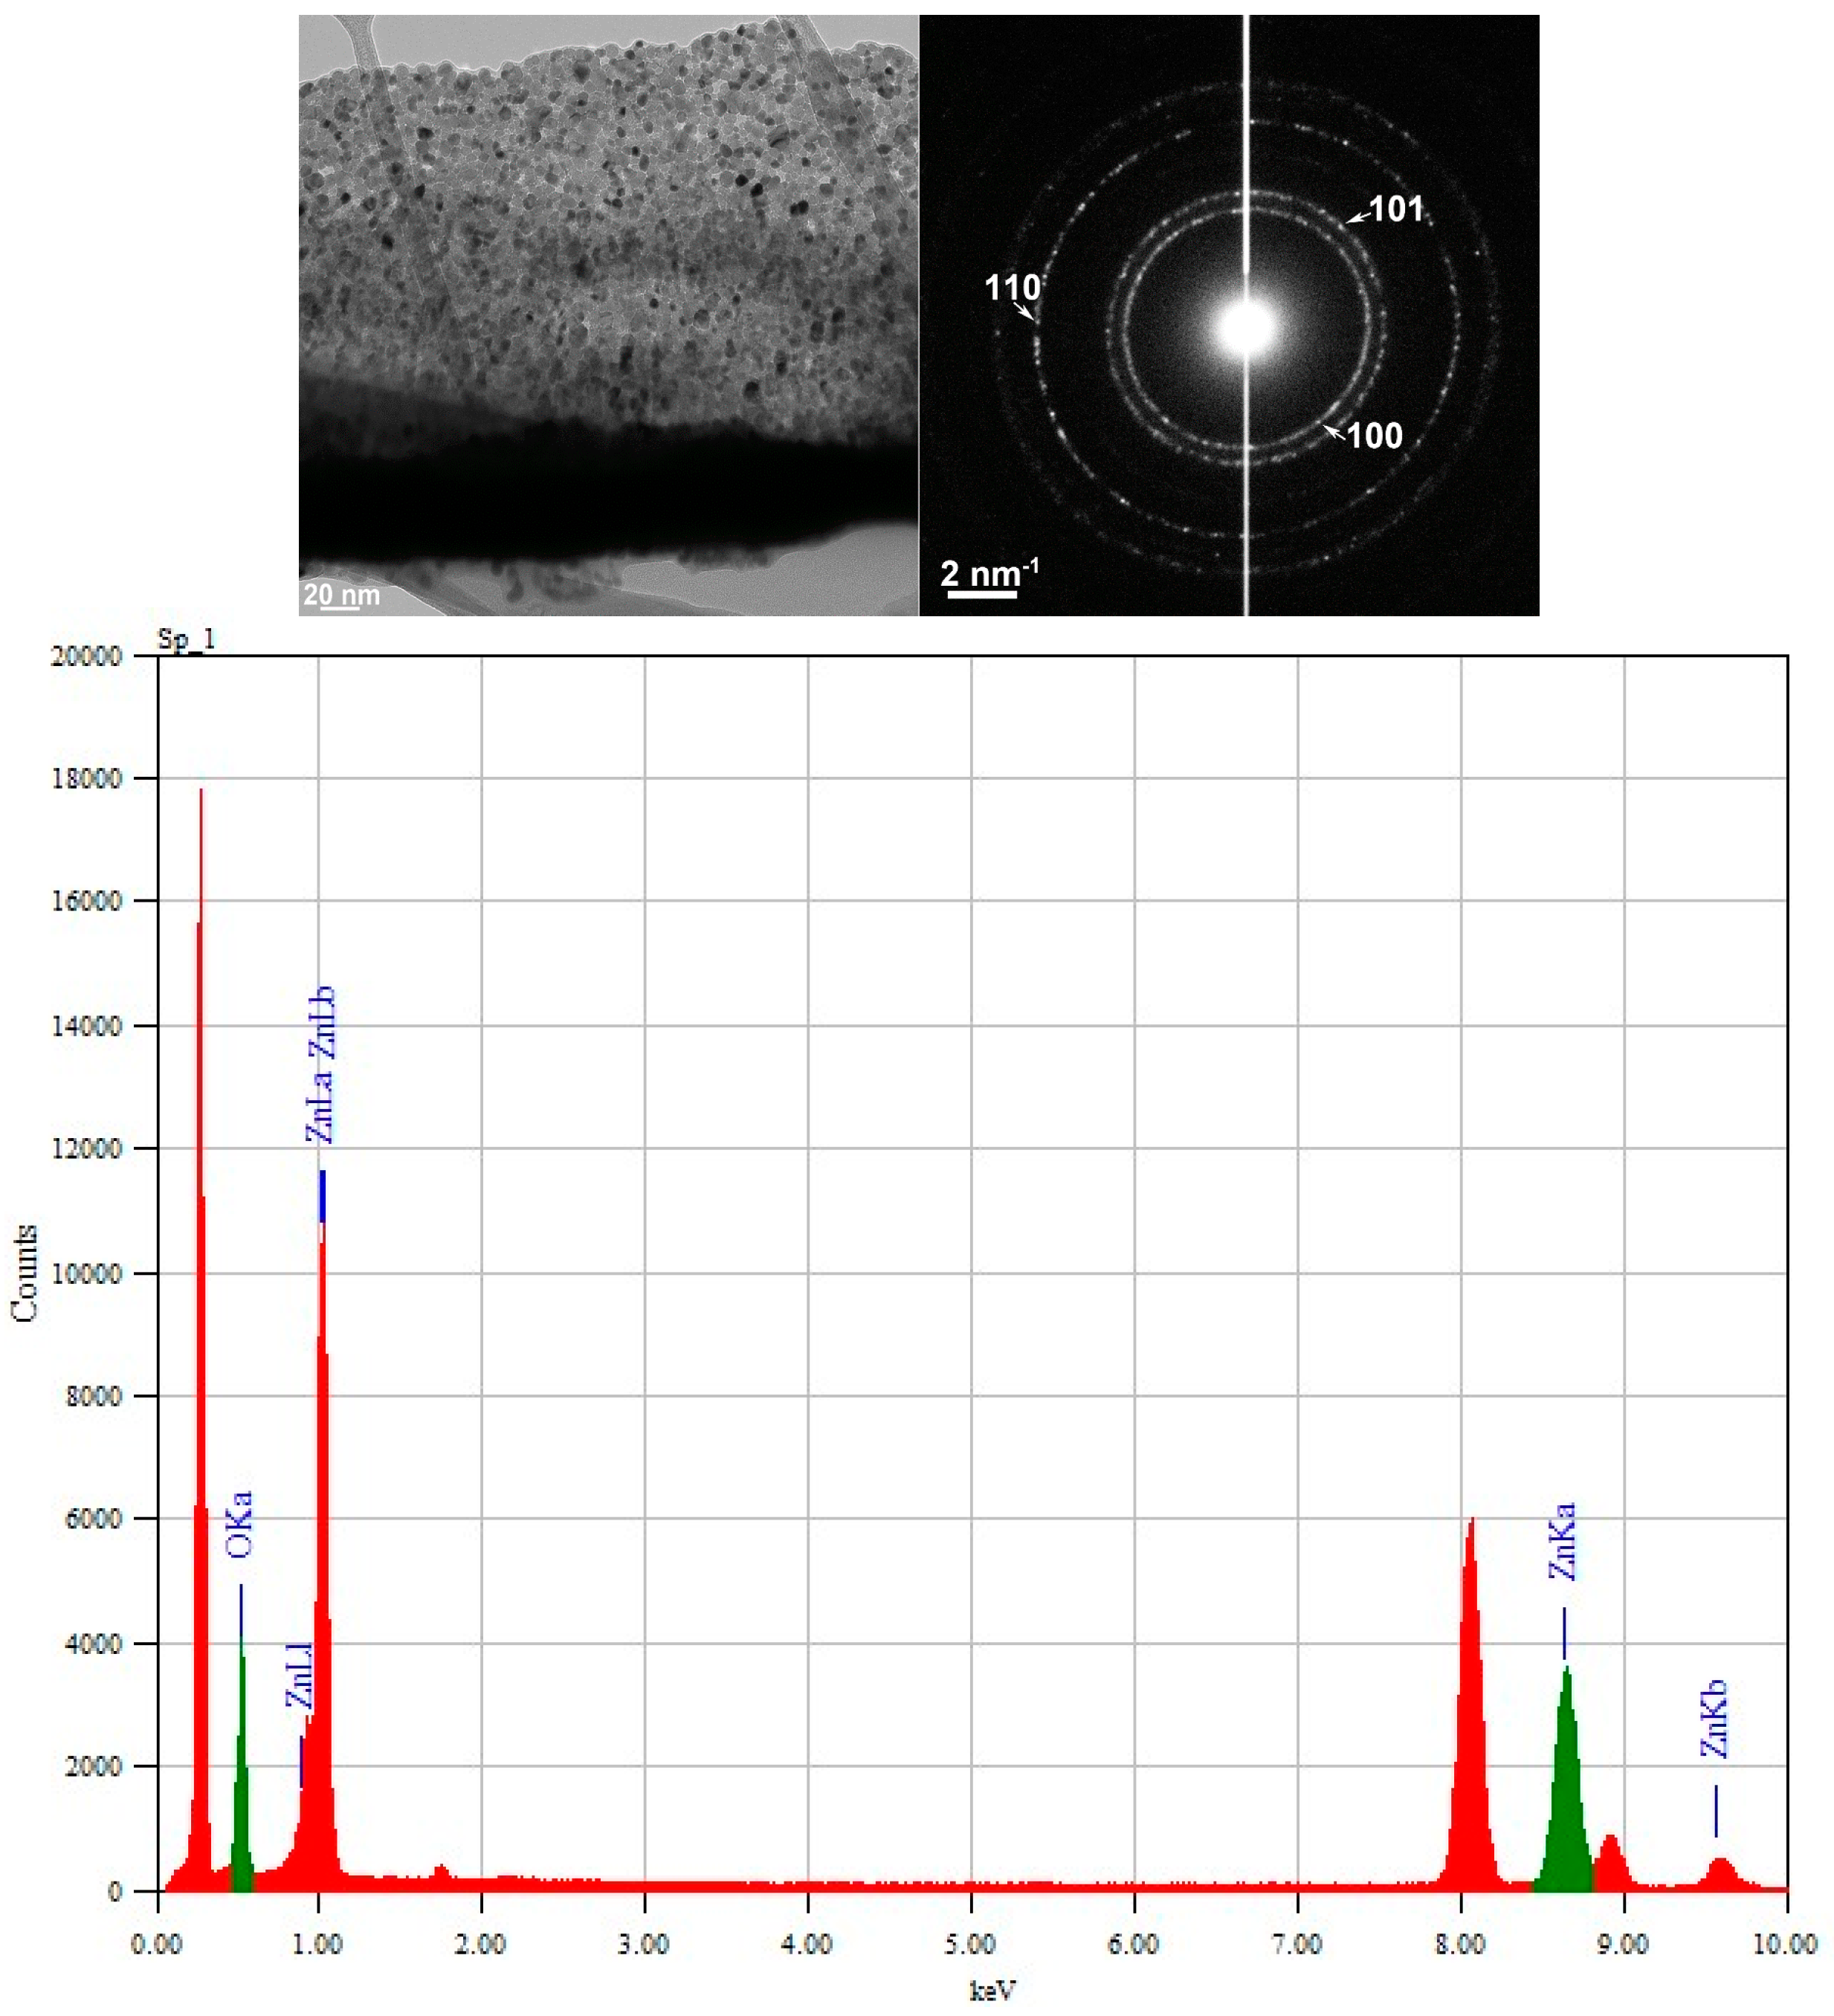
3.2. TEM and Selected Area (Electron) Diffraction (SAED) Analysis
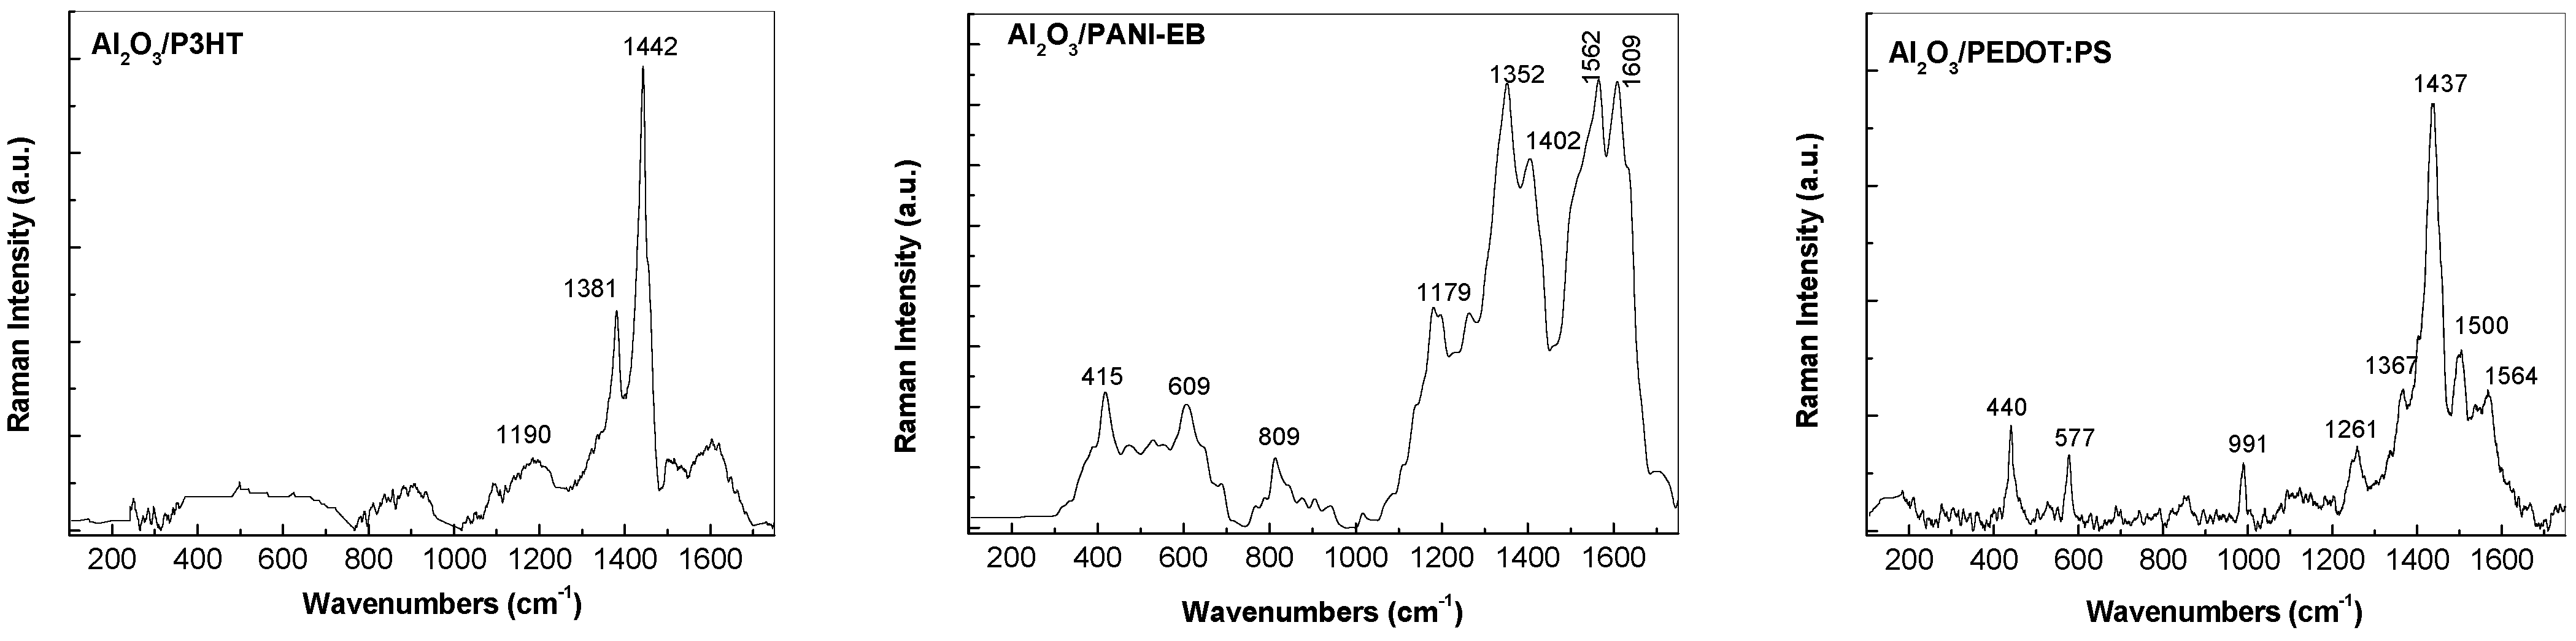
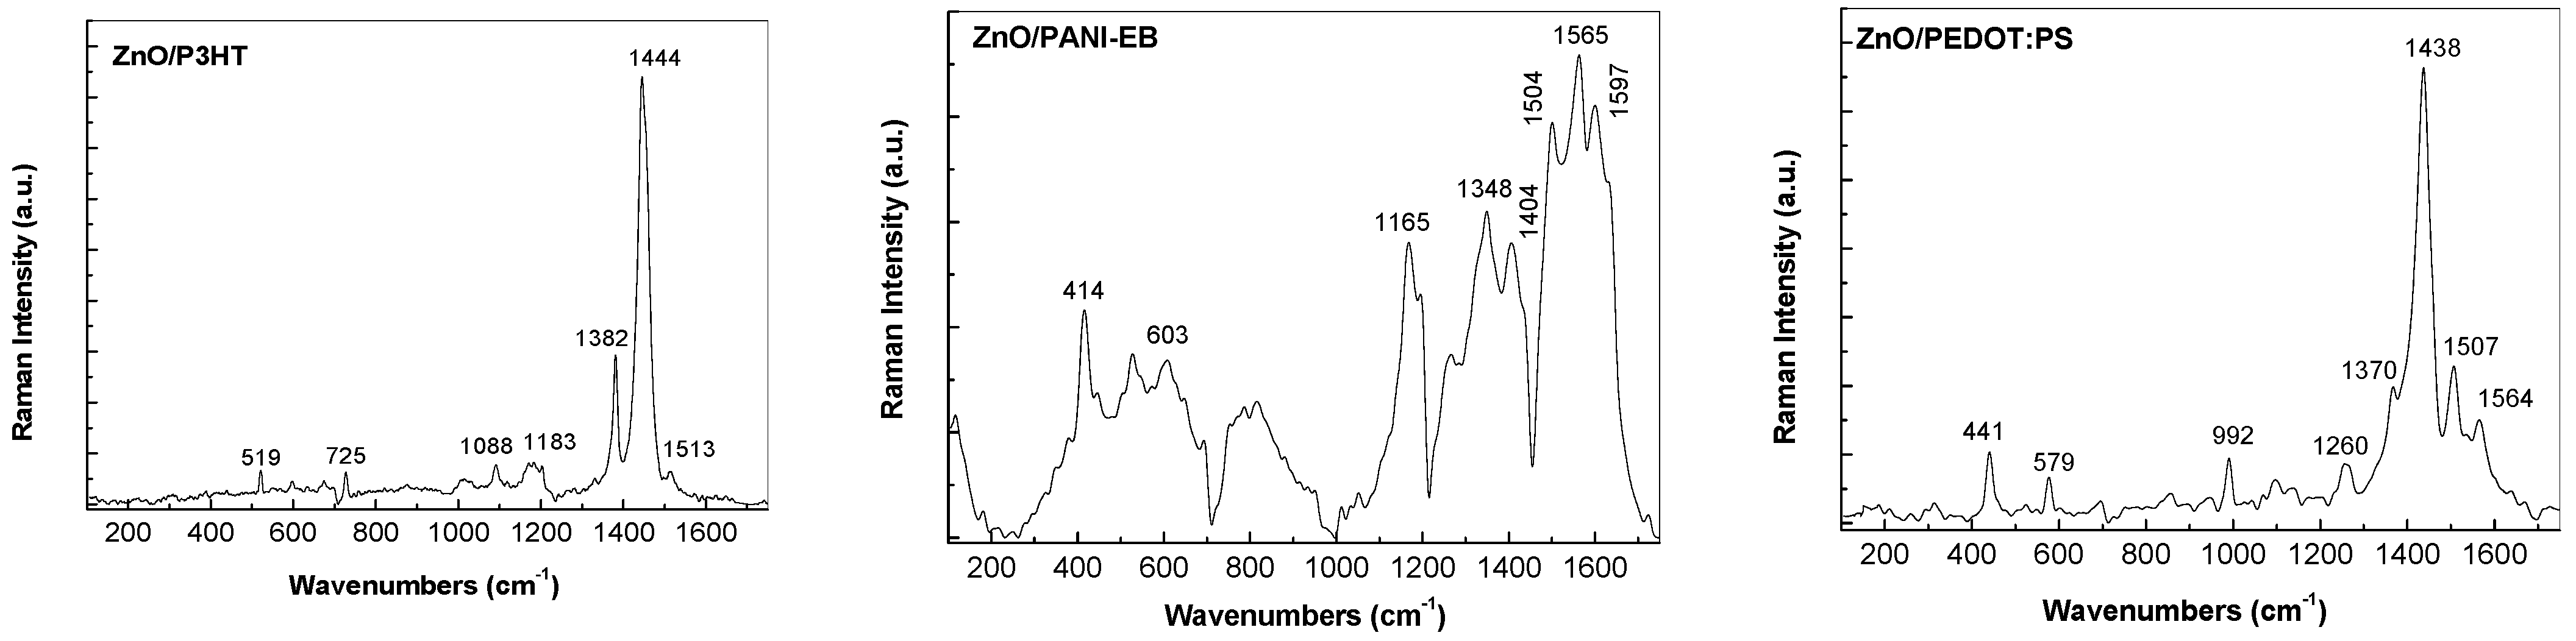
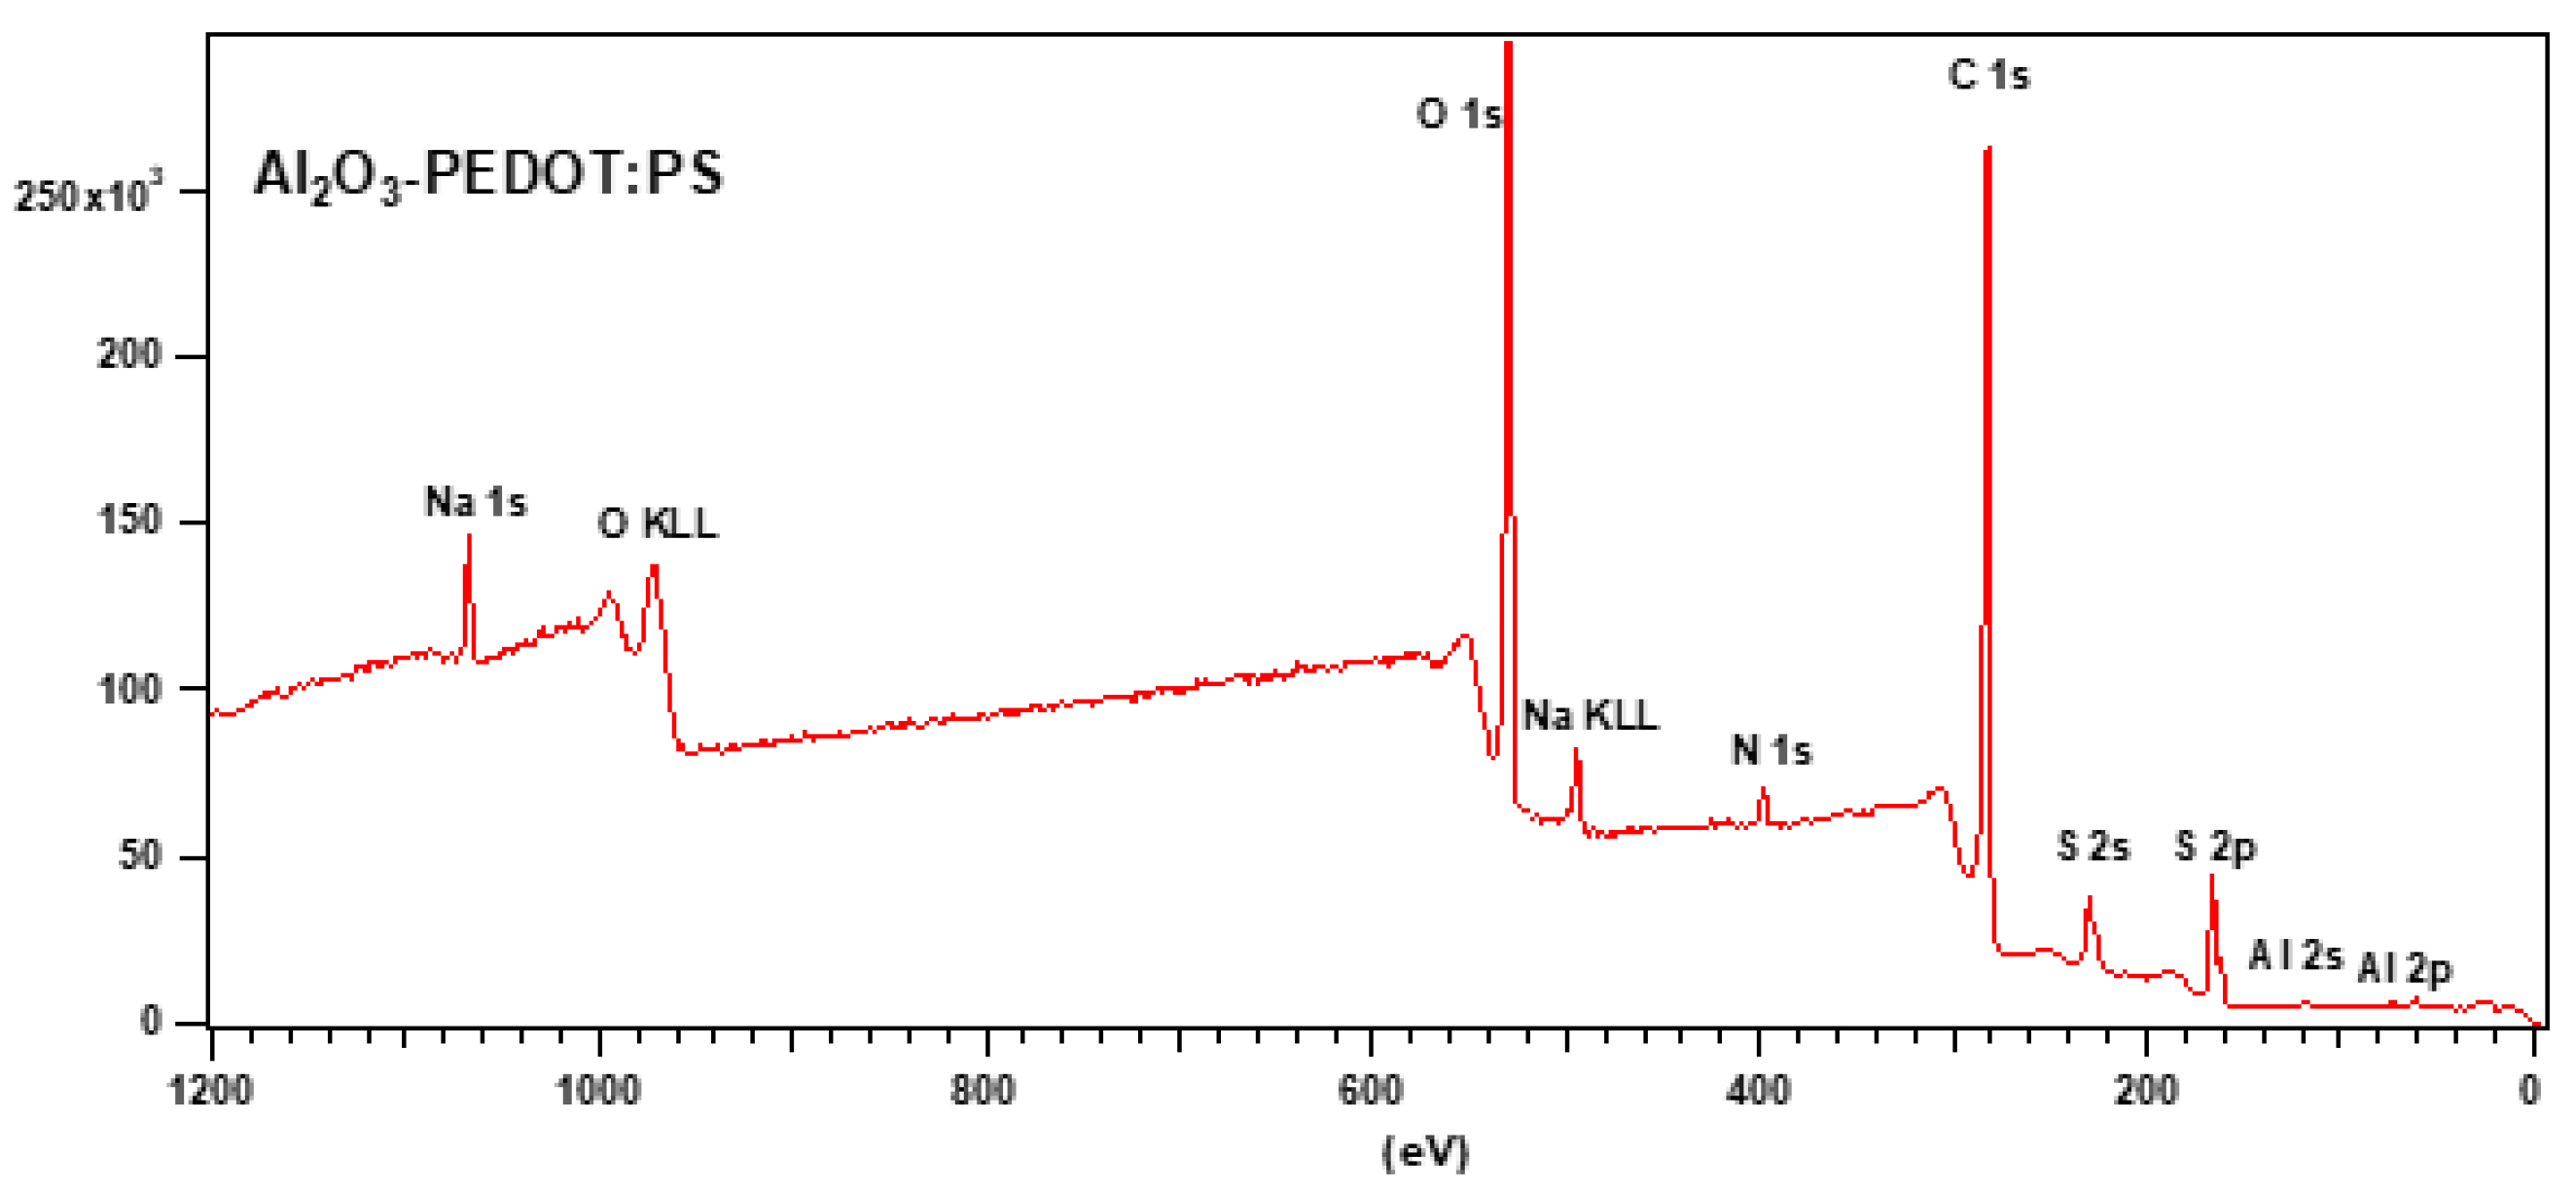
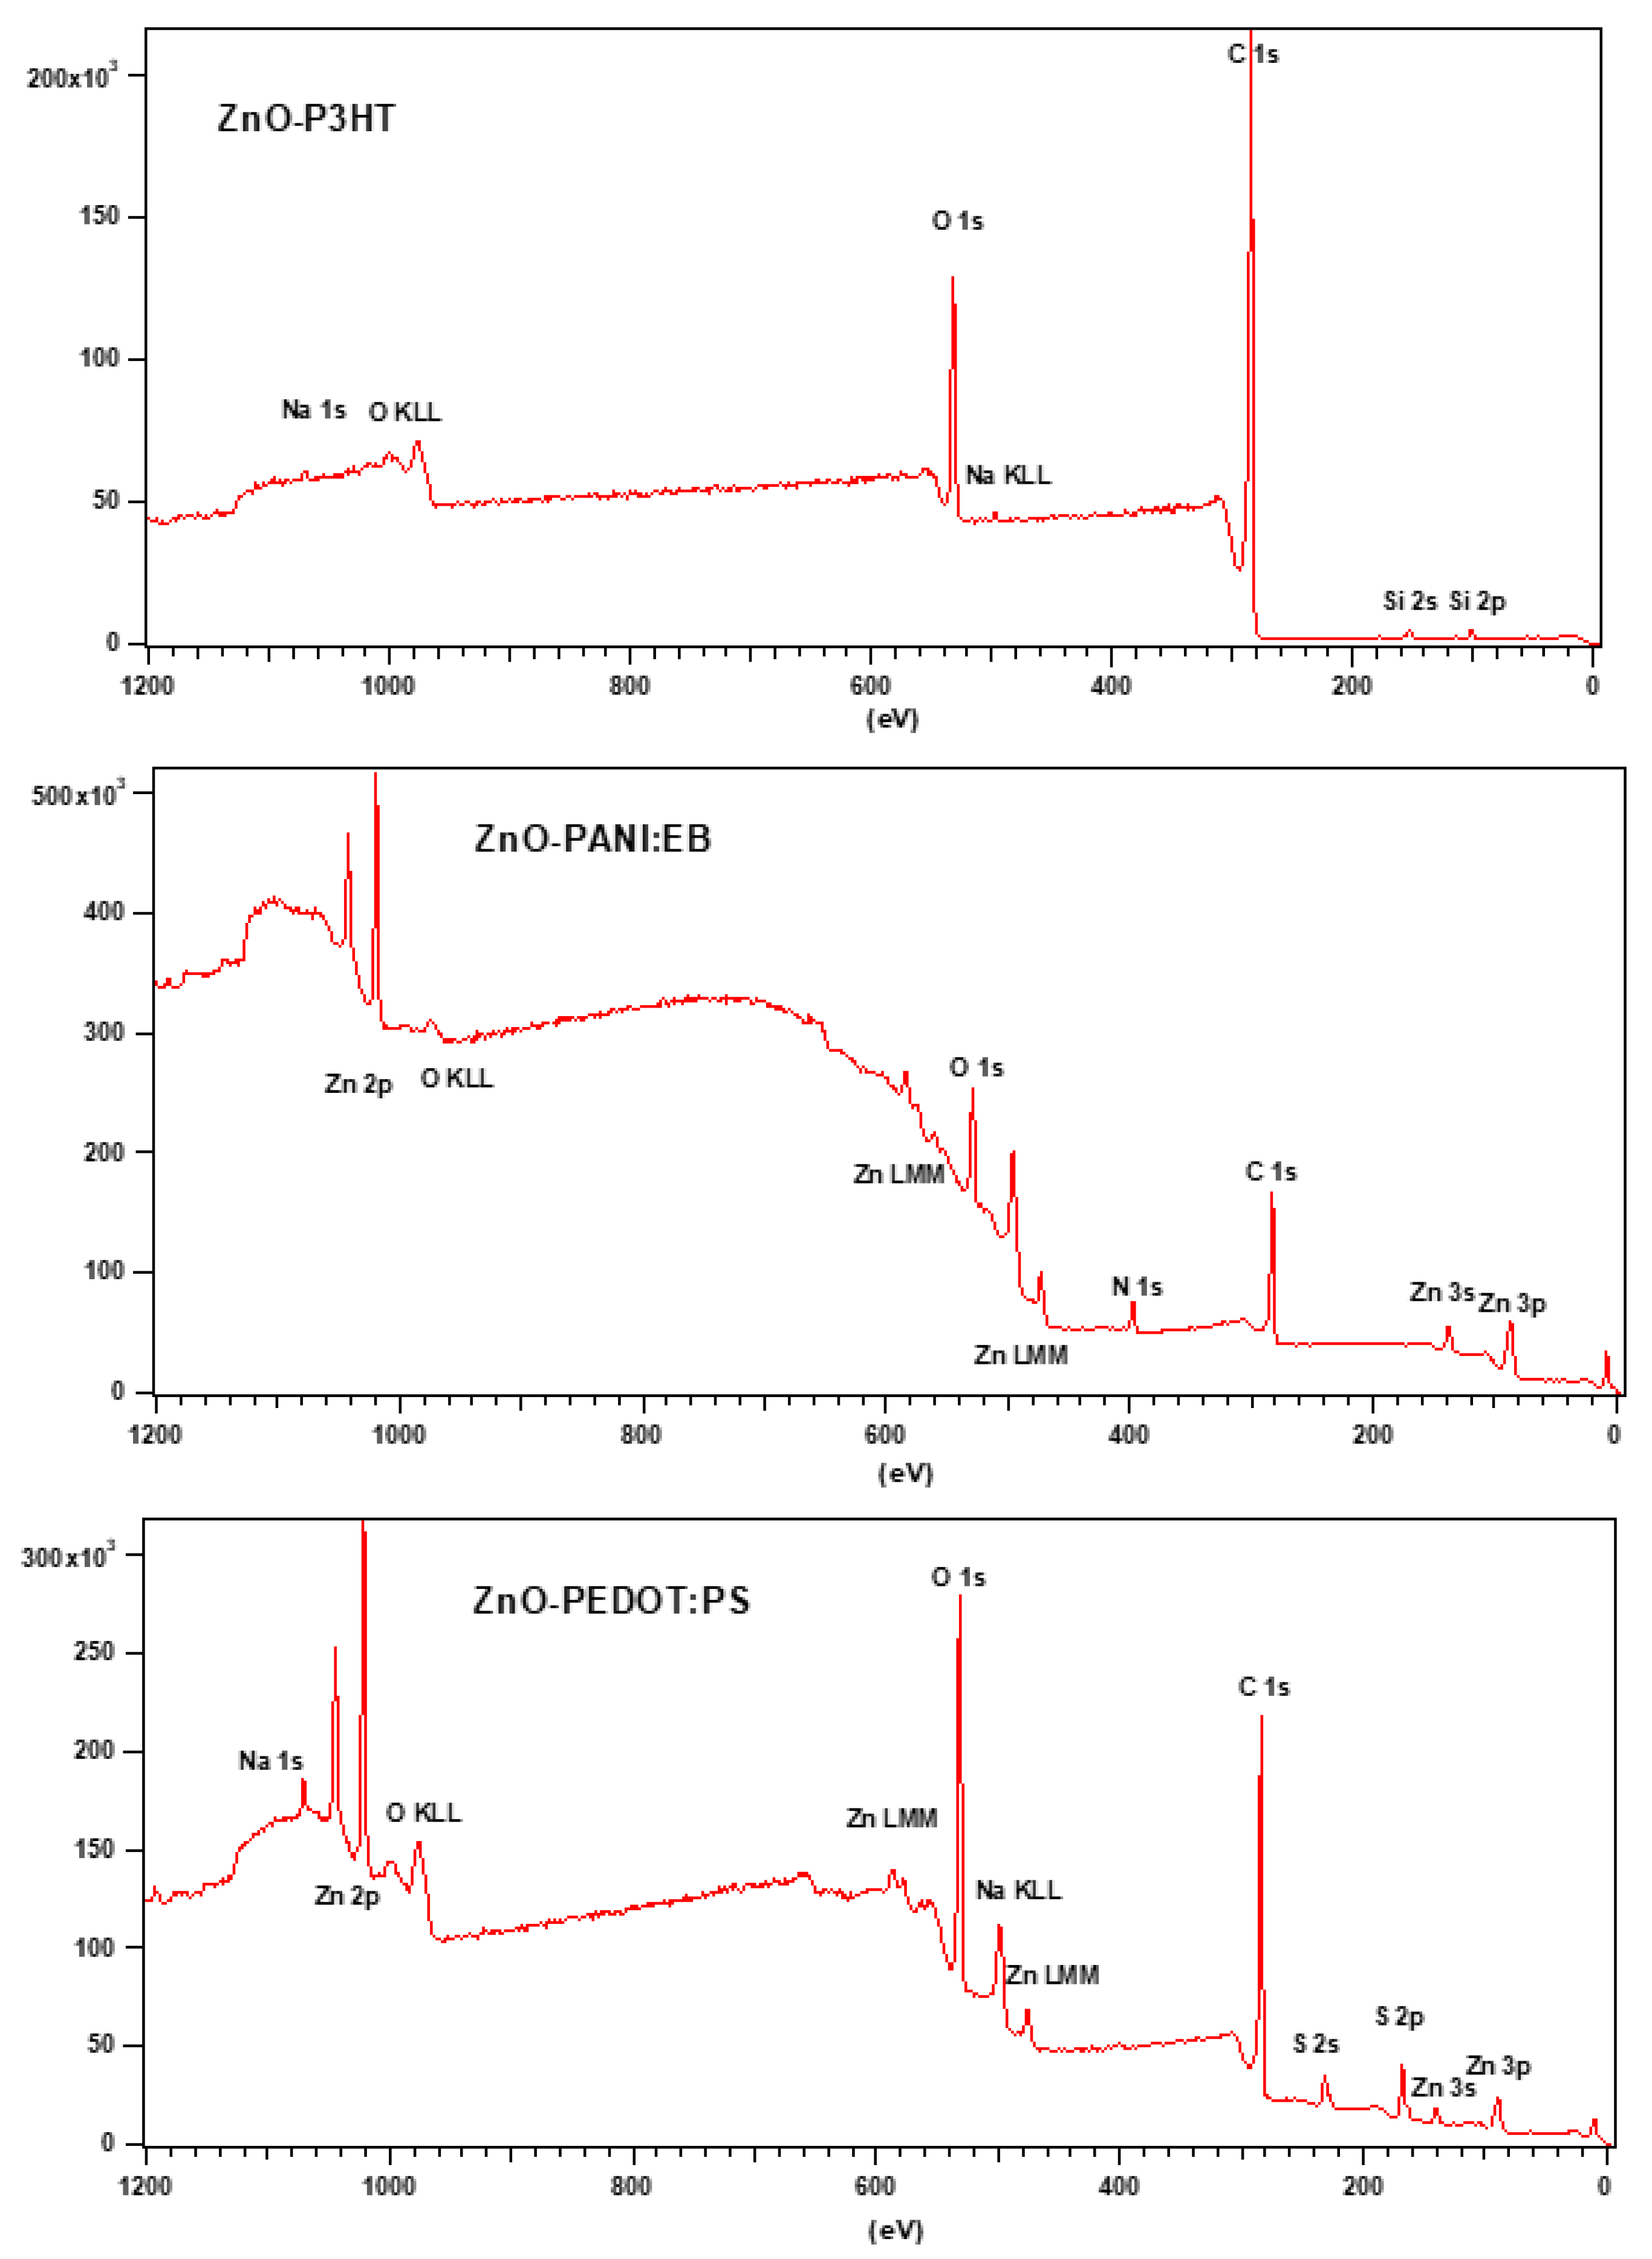
3.3. Raman and FTIR, XPS, and EDS Analysis
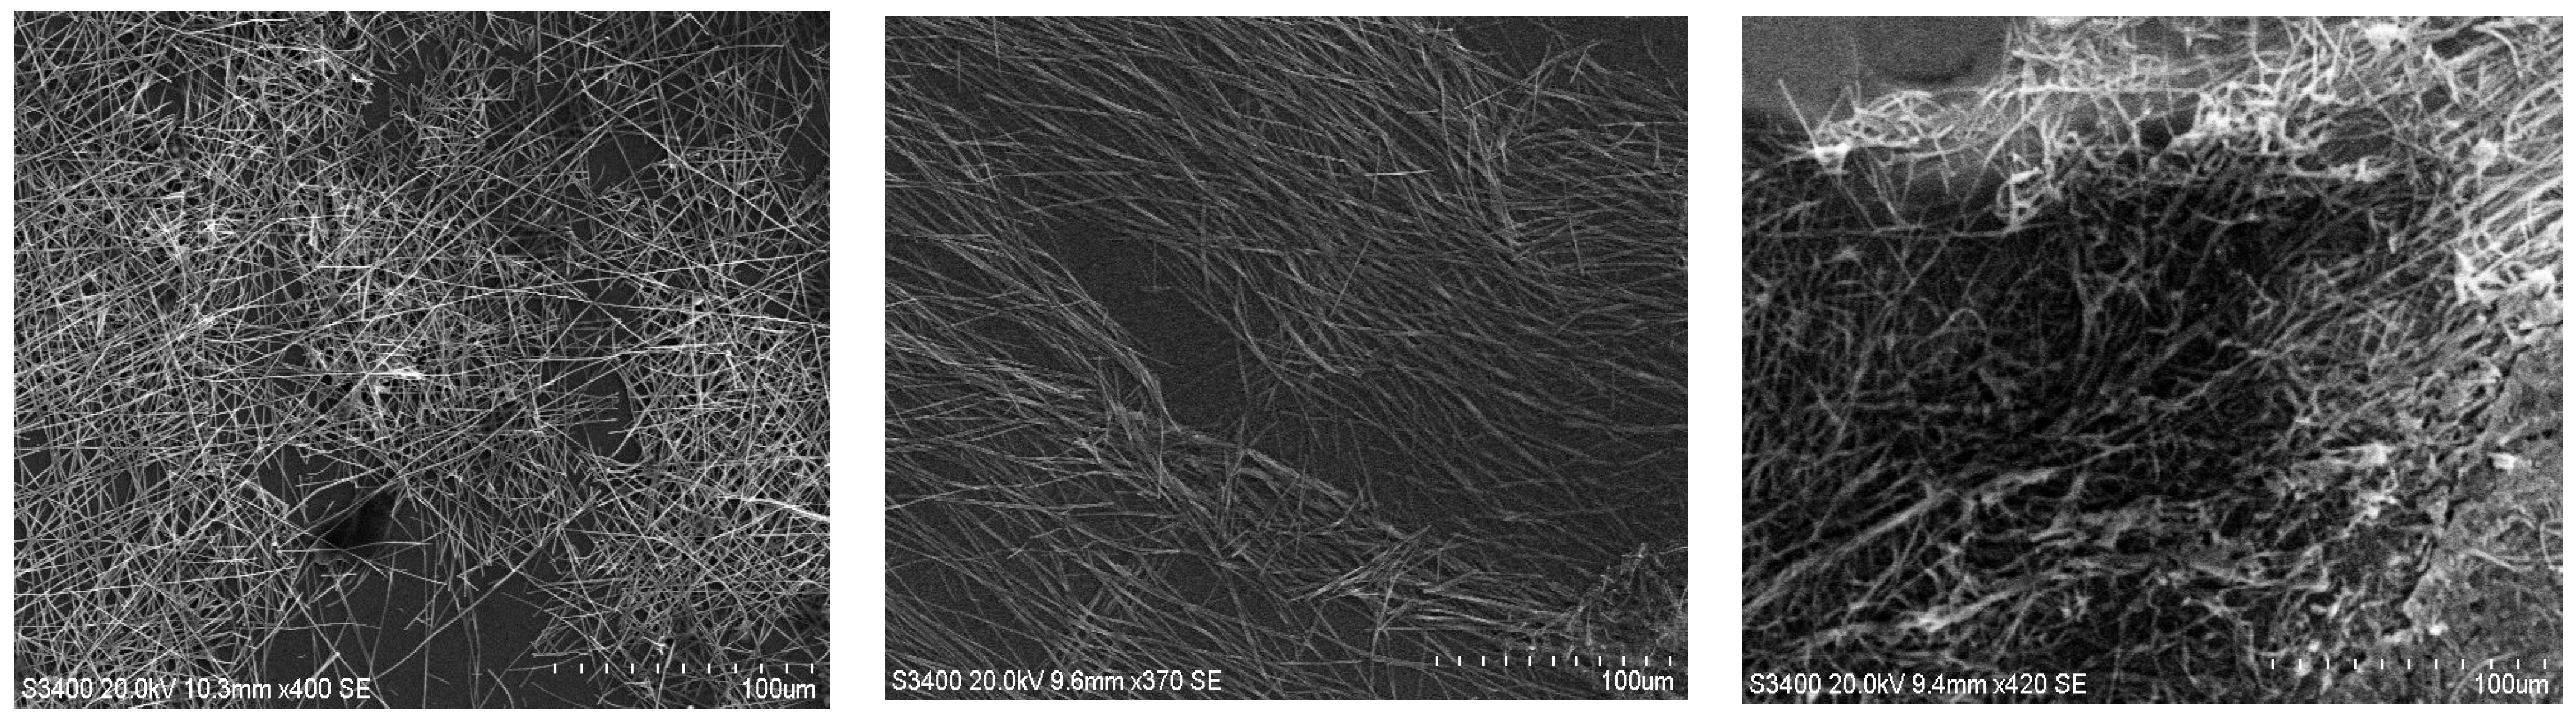
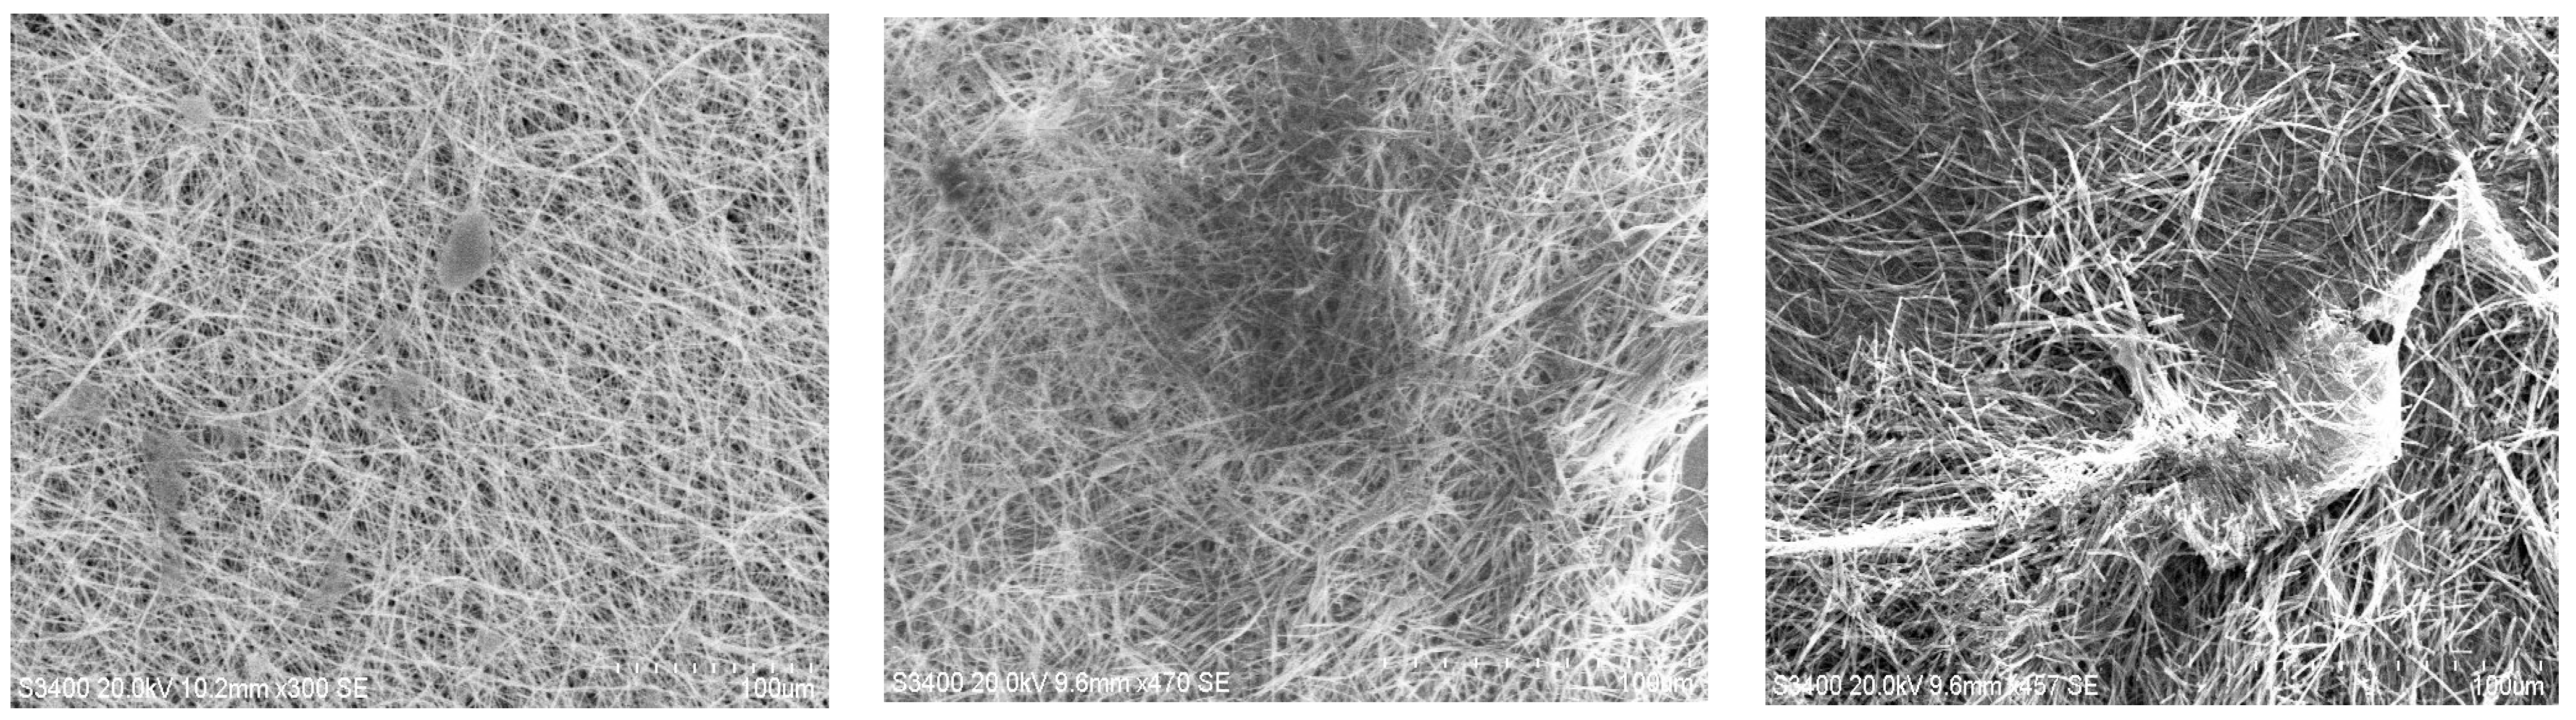
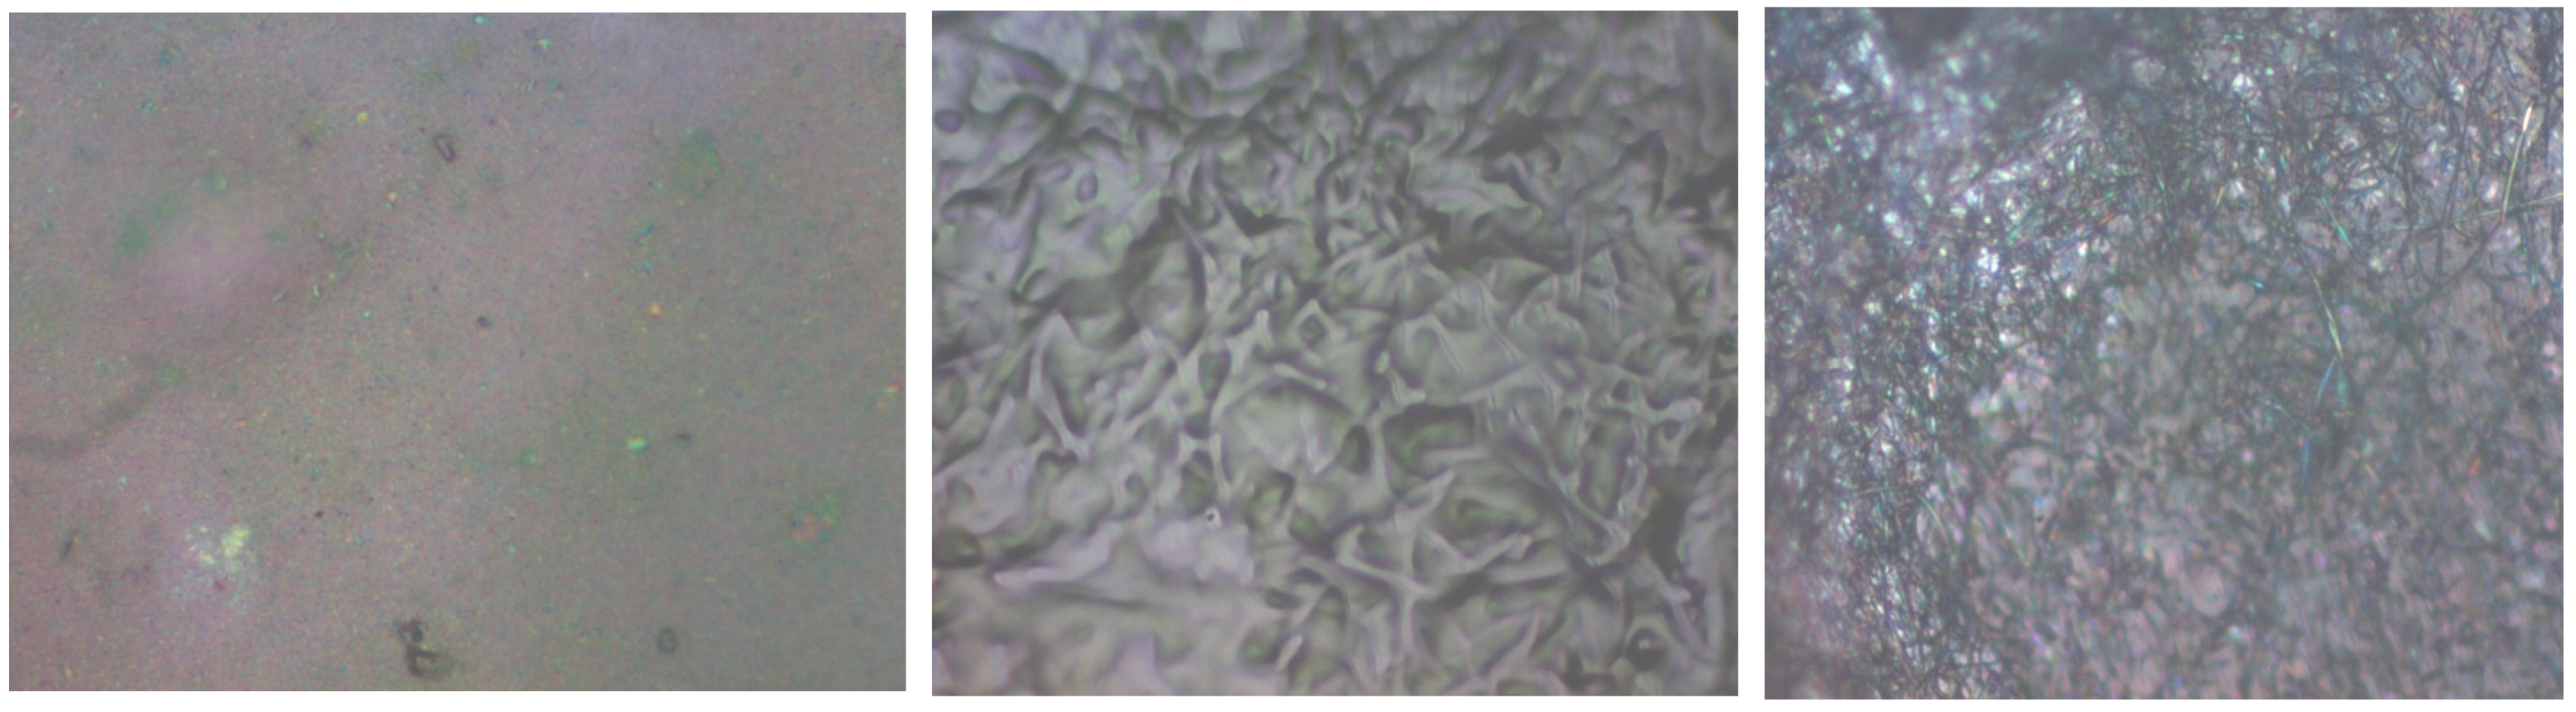
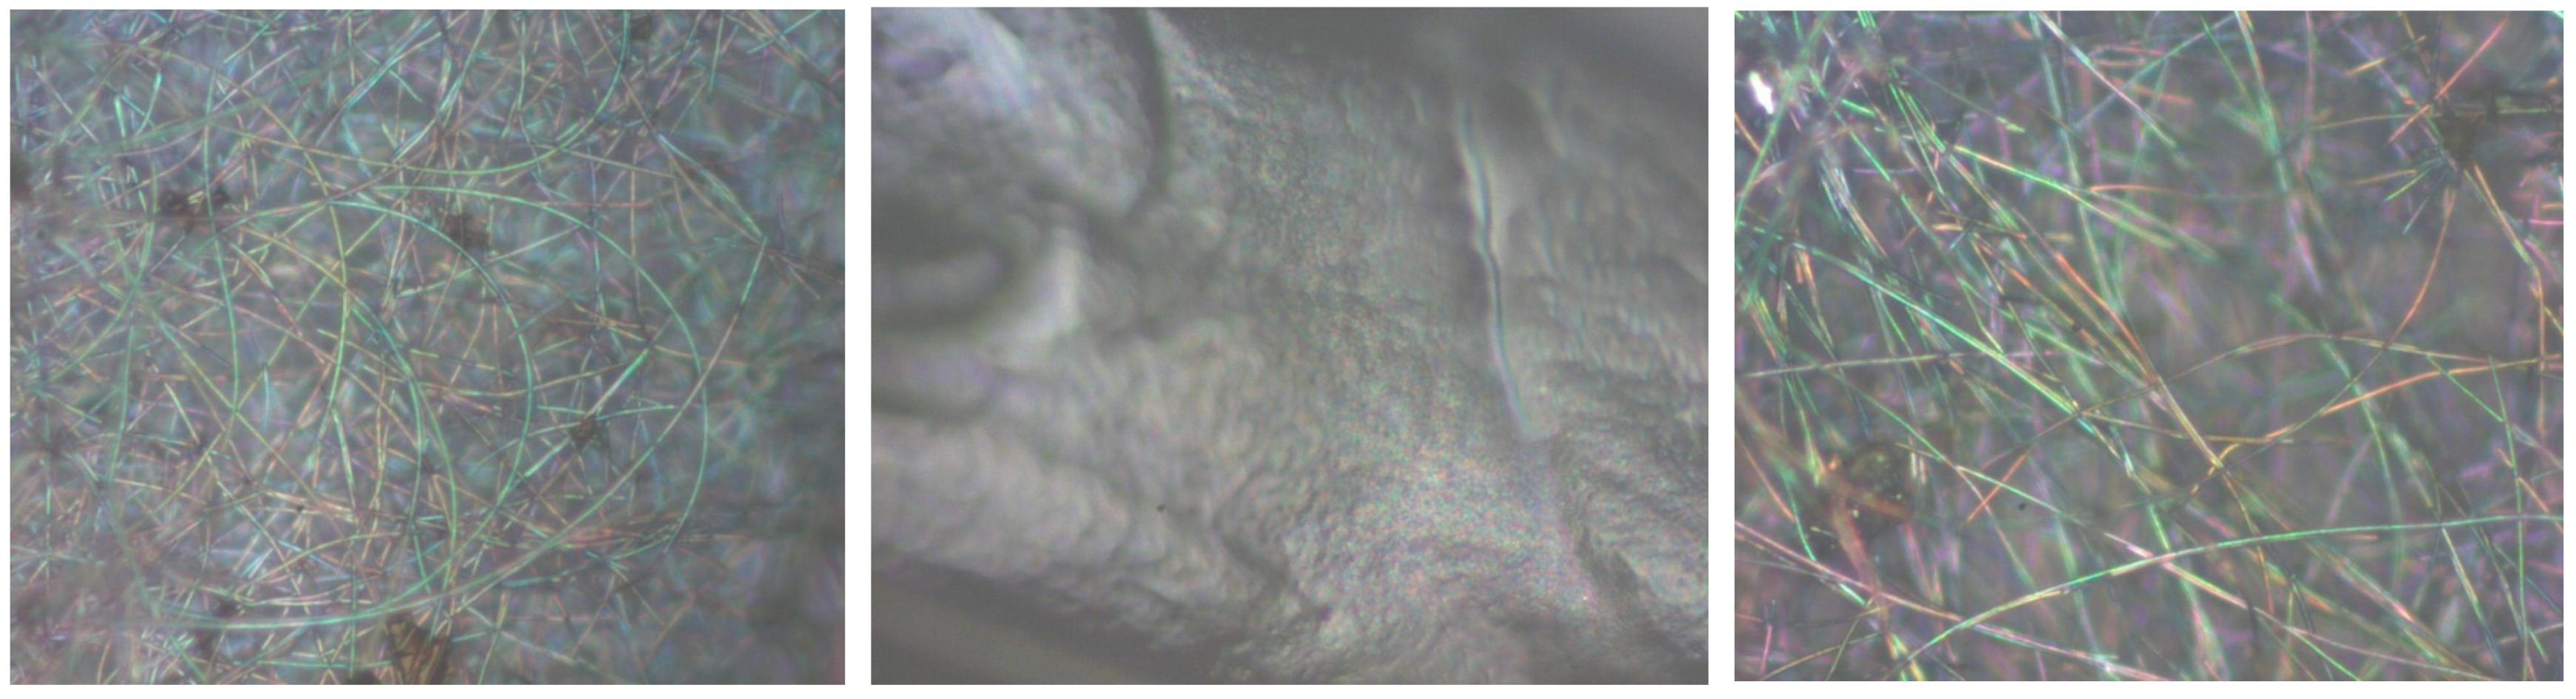
3.4. SEM Analysis
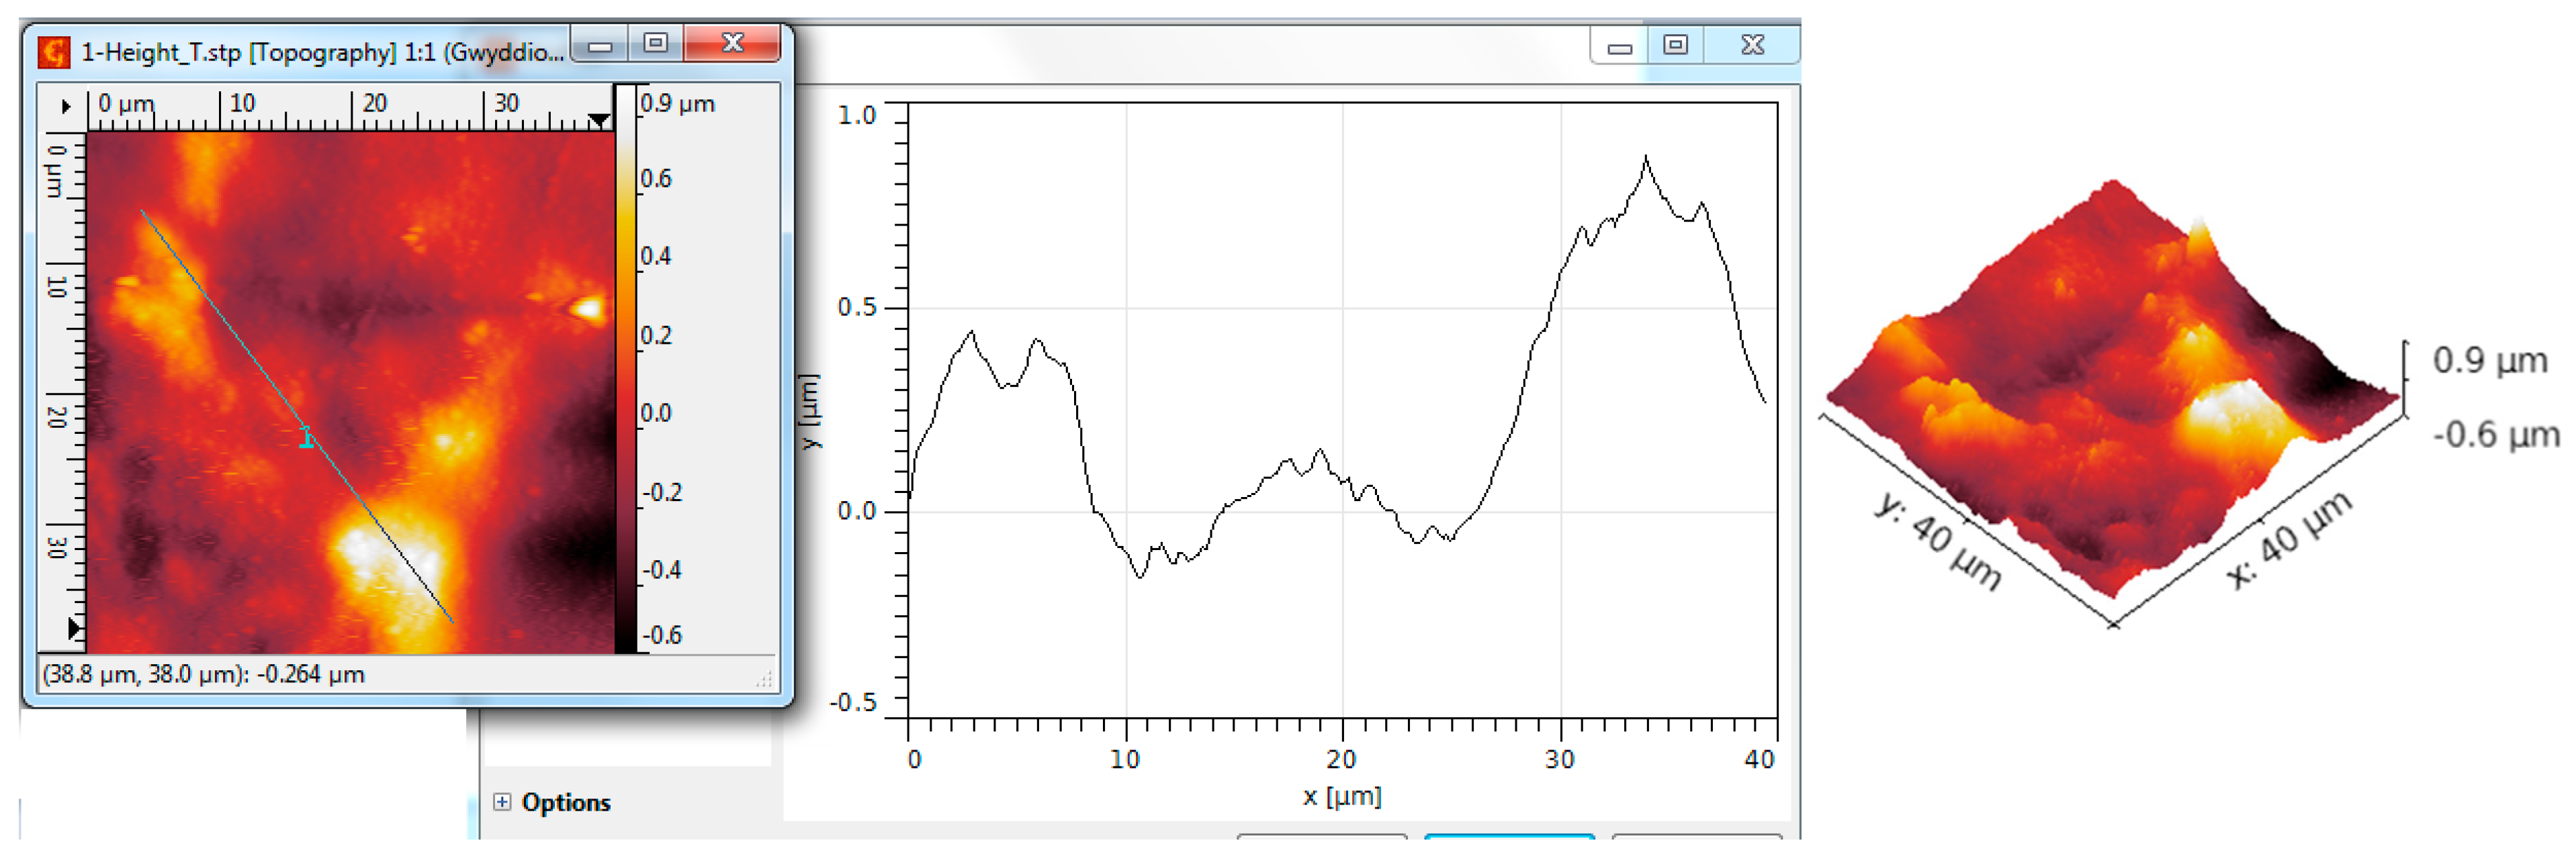
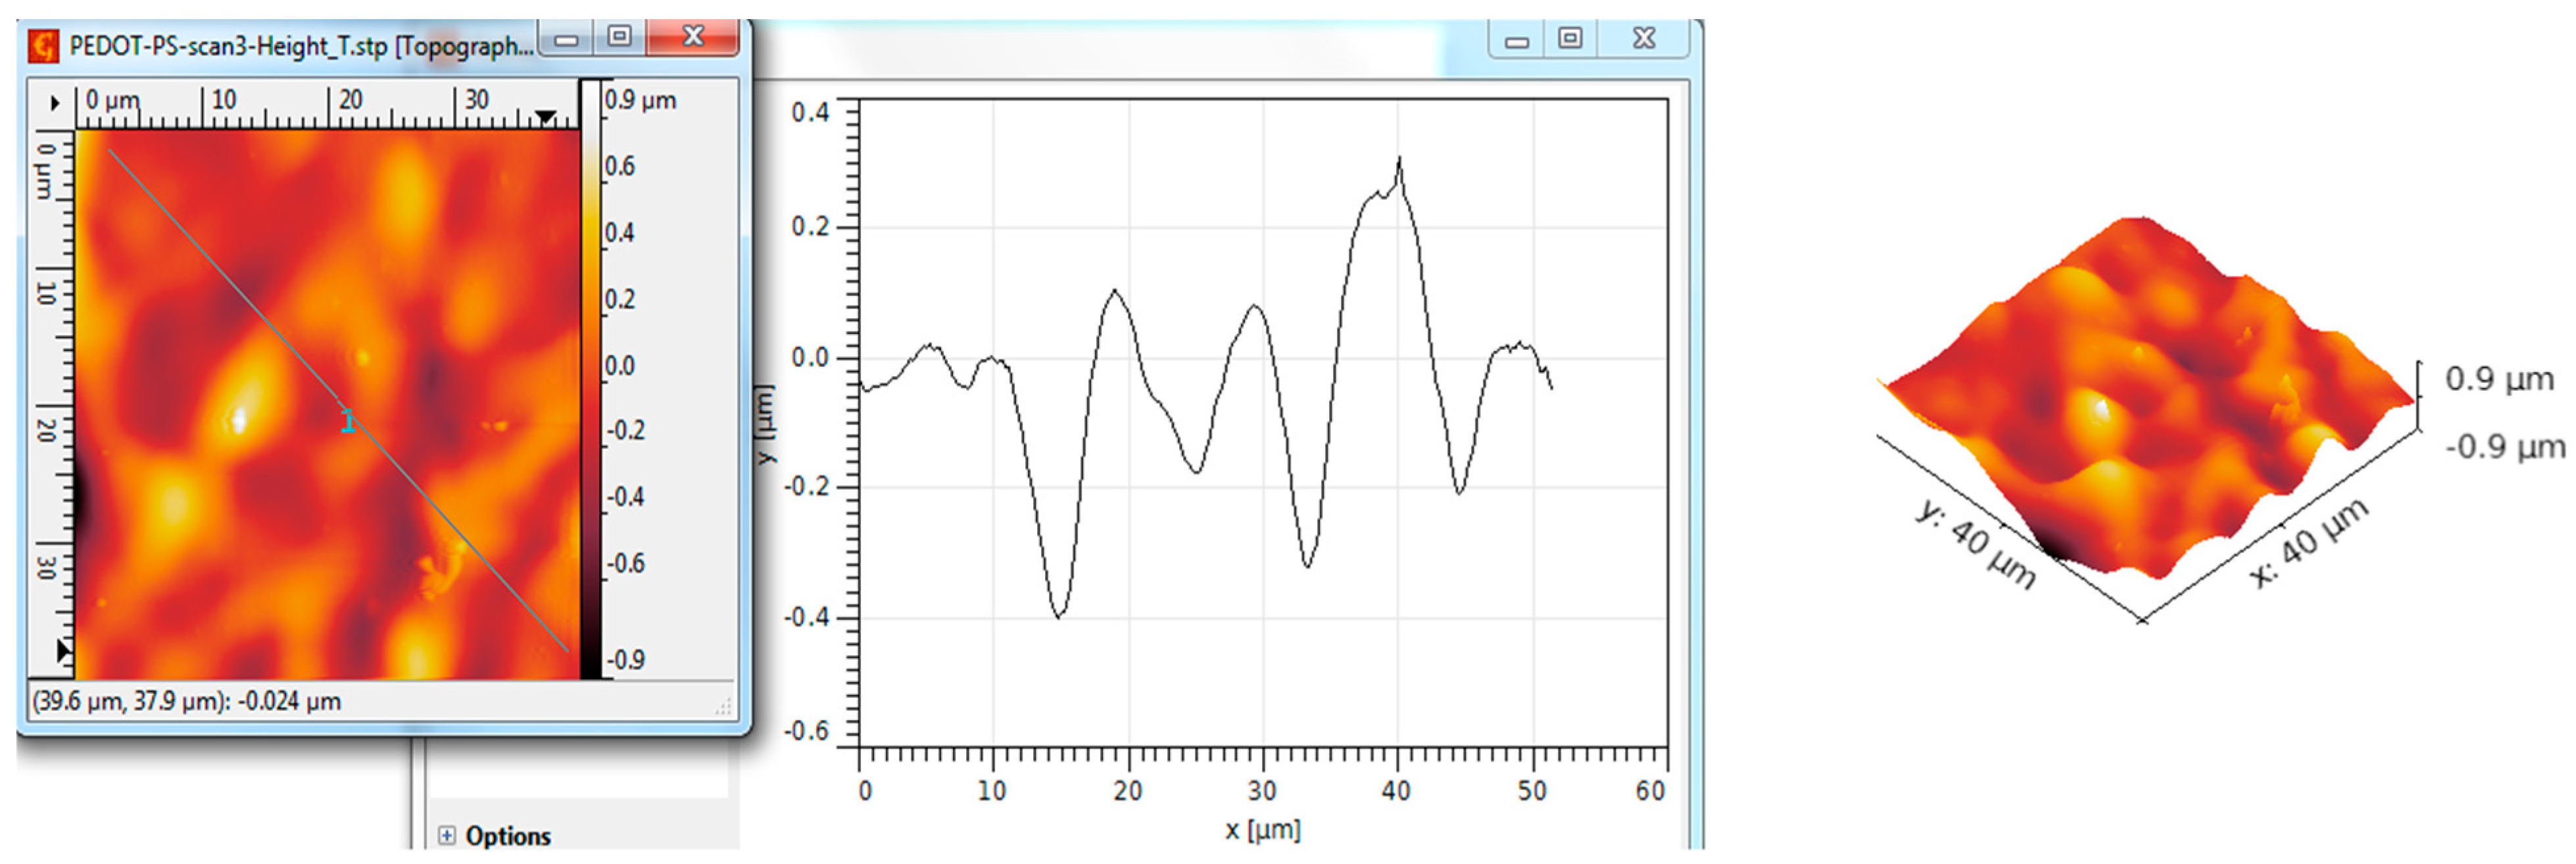
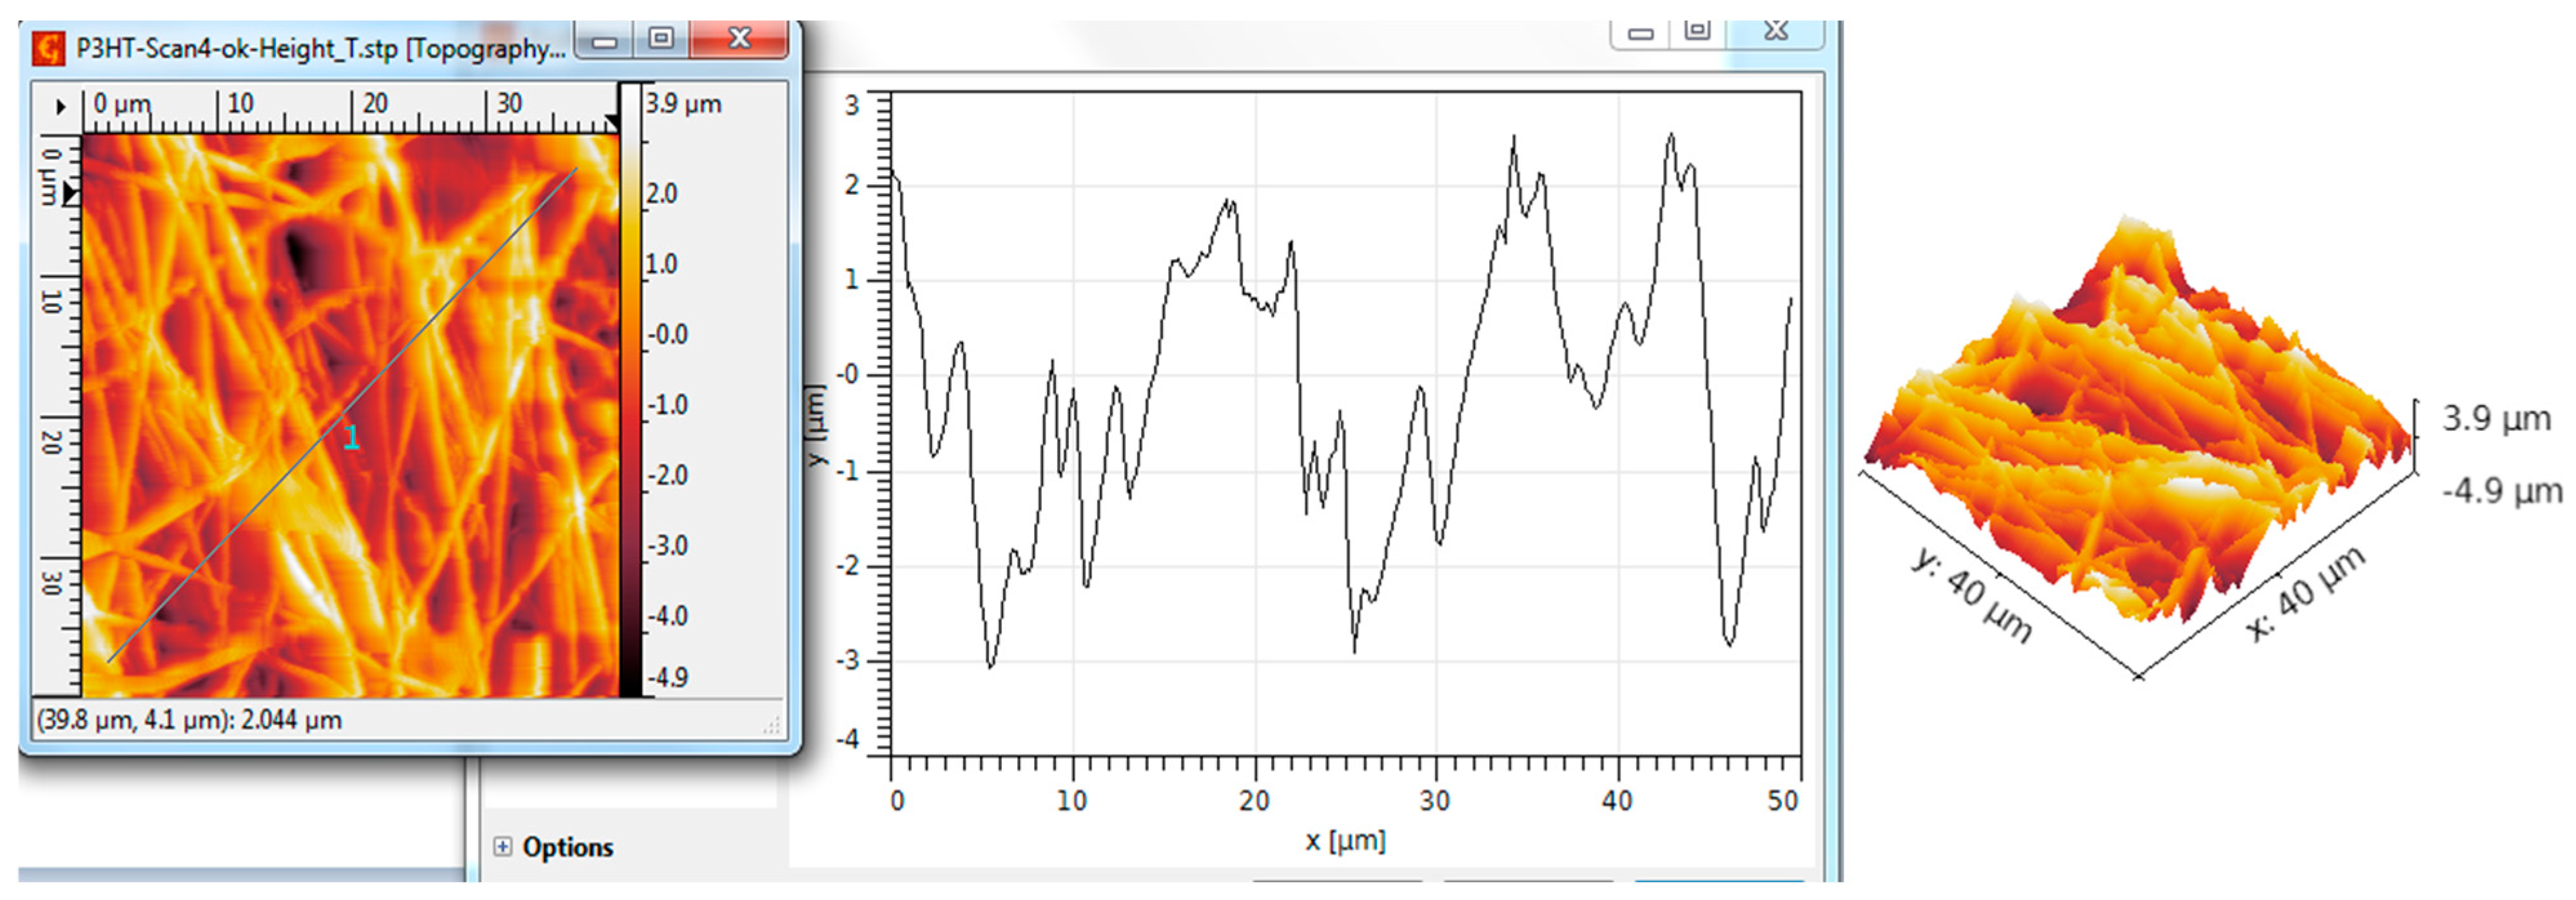
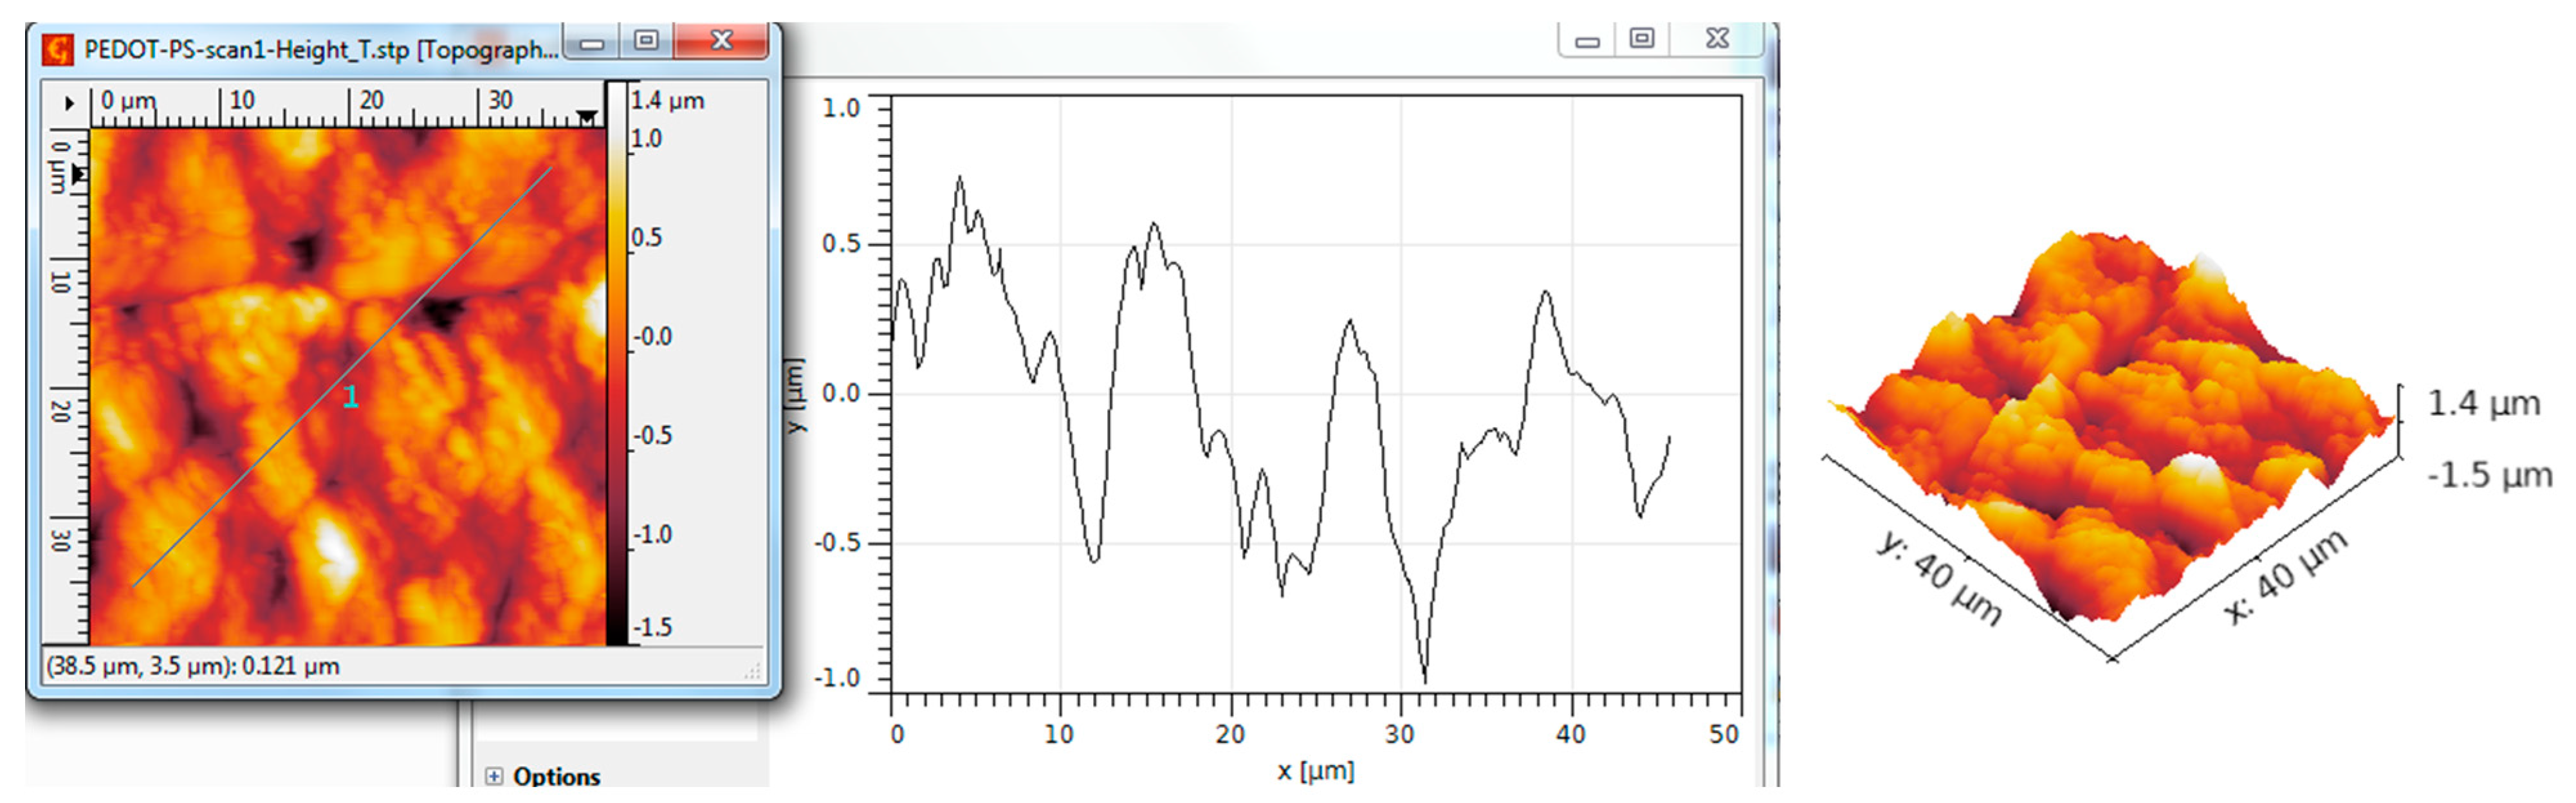
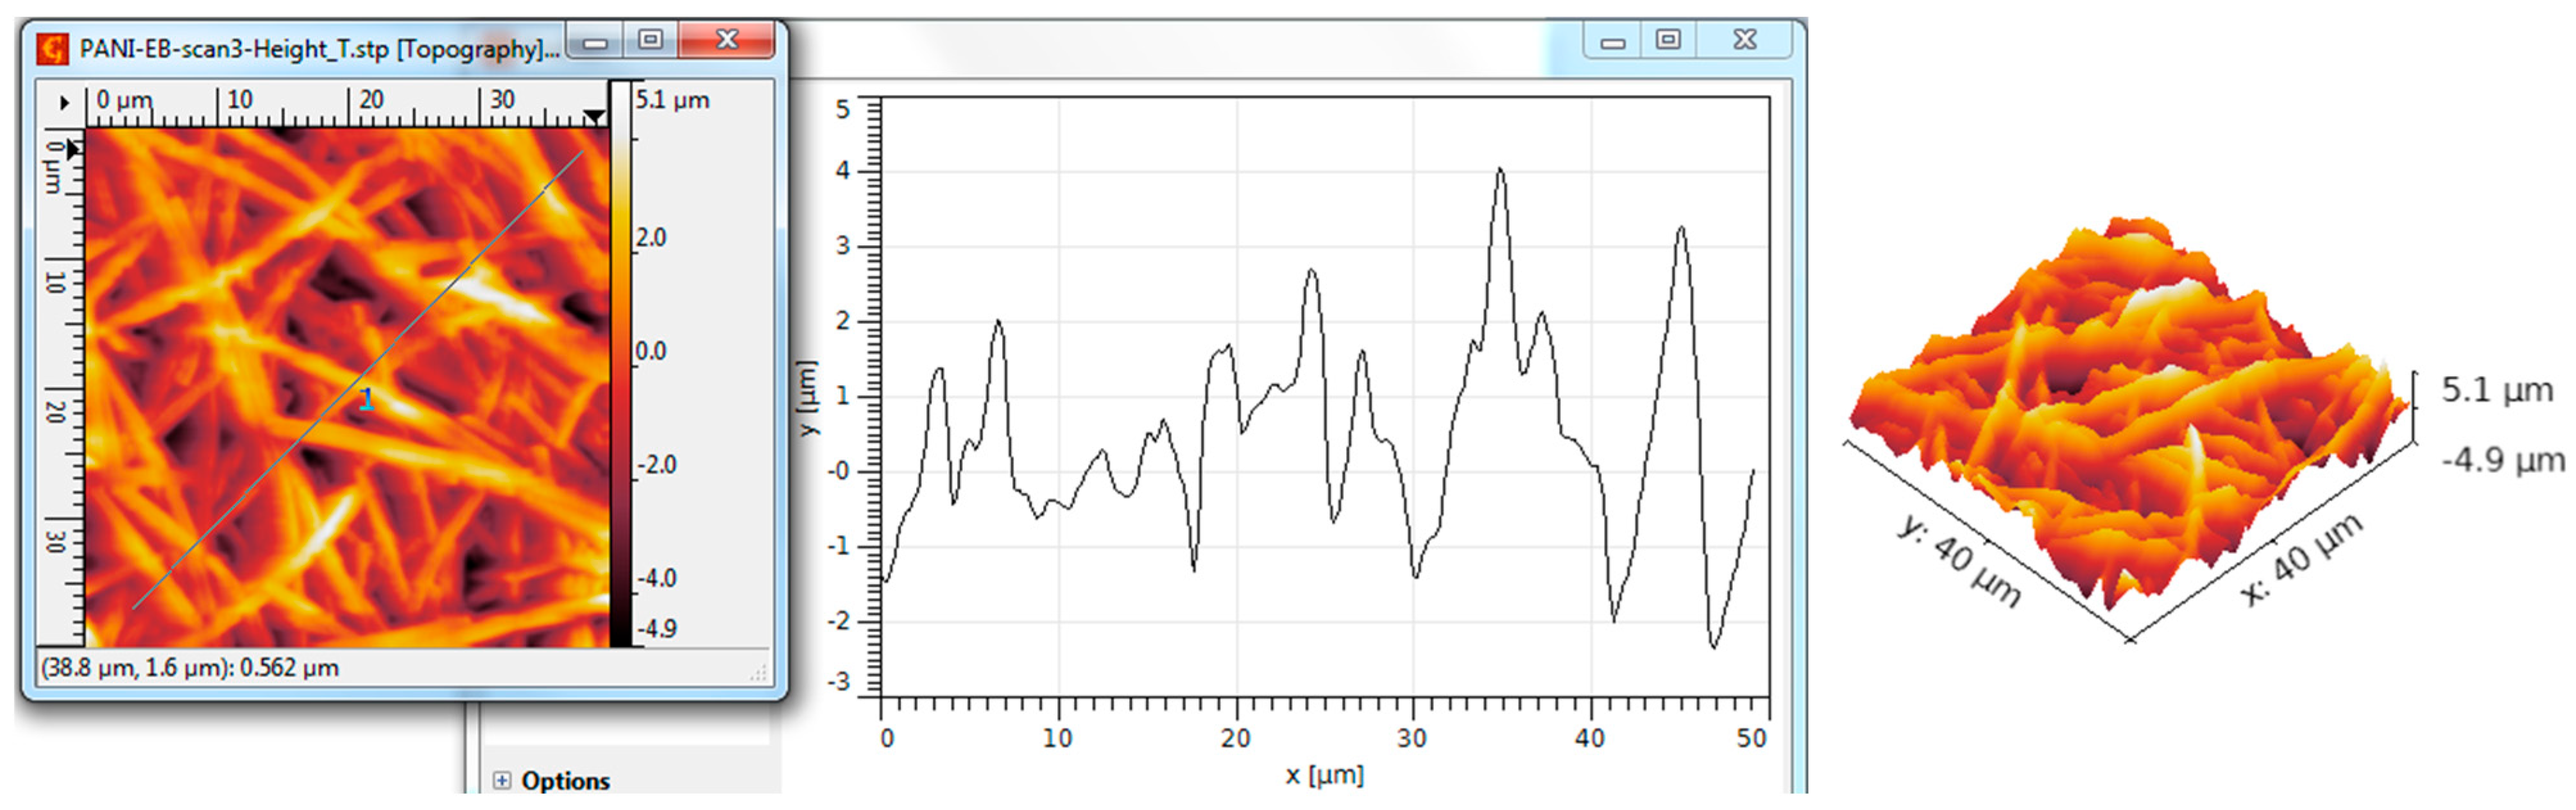
3.5. AFM Analysis
4. Analysis of Functionality as Gas Sensors for Ammonia
5. Conclusions
Author Contributions
Funding
Institutional Review Board Statement
Informed Consent Statement
Data Availability Statement
Conflicts of Interest
References
- Ohatkar, S.; Rane, S.; Ambesange, A.; More, A.; Rane, S. Nanostructured Metal Oxide Based Thick Film Sensors. Int. J. Latest Technol. Eng. Manag. Appl. Sci. 2016, 5, 93–97. Available online: https://www.ijltemas.in/DigitalLibrary/Vol.5Issue5/93-97.pdf (accessed on 12 June 2024).
- Ayyala, S.; Covington, J. Nickel-Oxide Based Thick-Film Gas Sensors for Volatile Organic Compound Detection. Chemosensors 2021, 9, 247. [Google Scholar] [CrossRef]
- Balhaddad, A.A.; Garcia, I.M.; Mokeem, L.; Alsahafi, R.; Collares, F.M.; de Melo, M.A.S. Metal Oxide Nanoparticles and Nanotubes: Ultrasmall Nanostructures to Engineer Antibacterial and Improved Dental Adhesives and Composites. Bioengineering 2021, 8, 146. [Google Scholar] [CrossRef]
- Lee, M.; Kim, T.; Bae, C.; Shin, H.; Kim, J. Fabrication and applications of metal-oxide nano-tubes. JOM 2010, 62, 44–49. [Google Scholar] [CrossRef]
- Researchers Learn to Control the Dimensions of Metal Oxide Nanotubes. 2007. Available online: https://phys.org/news/2007-08-dimensions-metal-oxide-nanotubes.html (accessed on 10 April 2023).
- Enculescu, M.; Costas, A.; Evanghelidis, A.; Enculescu, I. Fabrication of ZnO and TiO2 Nanotubes via Flexible Electrospun Nanofibers for Photocatalytic Applications. Nanomaterials 2021, 11, 1305. [Google Scholar] [CrossRef]
- Ramasamy, P.; Lim, D.H.; Kim, J.; Kim, J. A general approach for synthesis of functional metal oxide nanotubes and their application in dye-sensitized solar cells. RSC Adv. 2014, 4, 2858–2864. [Google Scholar] [CrossRef]
- Li, Y.; Yang, X.Y.; Feng, Y.; Yuan, Z.Y.; Su, B.L. One-Dimensional Metal Oxide Nanotubes, Nanowires, Nanoribbons, and Nanorods: Synthesis, Characterizations, Properties and Applications. Crit. Rev. Solid State Mater. Sci. 2012, 37, 1–74. Available online: https://www.tandfonline.com/doi/abs/10.1080/10408436.2011.606512 (accessed on 12 June 2024). [CrossRef]
- Azevedo, J.; Fernández-García, M.P.; Magén, C.; Mendes, A.; Araújo, J.P.; Sousa, C.T. Double-walled iron oxide nanotubes via selective chemical etching and Kirkendall process. Sci. Rep. 2019, 9, 11994. [Google Scholar] [CrossRef]
- Parthangal, P. Direct synthesis of tin oxide nanotubes on microhotplates using carbon nanotubes as templates. J. Mater. Res. 2011, 26, 430–436. [Google Scholar] [CrossRef]
- Muench, F.; Sun, L.; Kottakkat, T.; Antoni, M.; Schaefer, S.; Kunz, U.; Molina-Luna, L.; Duerrschnabel, M.; Kleebe, H.-J.; Ayata, S.; et al. Free-Standing Networks of Core–Shell Metal and Metal Oxide Nanotubes for Glucose Sensing. ACS Appl. Mater. Interfaces 2017, 9, 1, 771–781. [Google Scholar] [CrossRef] [PubMed]
- Kang, D.Y. Single-Walled Metal Oxide Nanotubes and Nanotube Membranes for Molecular Separations. Ph.D. Thesis, Georgia Institute of Technology, Atlanta, GA, USA, 2012. Available online: https://core.ac.uk/reader/10189860 (accessed on 10 April 2024).
- Muto, H.; Sato, Y.; Tan, W.K.; Yokoi, A.; Kawamura, G.; Matsuda, A. Controlled formation of carbon nanotubes incorporated ceramic composite granules by electrostatic integrated nano-assembly. Nanoscale 2022, 14, 9669–9674. [Google Scholar] [CrossRef] [PubMed]
- Mallakpour, S.; Khadem, E. Carbon nanotube–metal oxide nanocomposites: Fabrication, properties and applications. Chem. Eng. J. 2016, 302, 344–367. [Google Scholar] [CrossRef]
- Rahat, S.S.M.; Hasan, K.M.Z.; Mondol, M.M.H.; Mallik, A.K. A comprehensive review of carbon nanotube-based metal oxide nanocomposites for supercapacitors. J. Energy Storage 2023, 73, 108847. [Google Scholar] [CrossRef]
- Gupta, V.; Saleh, T. Syntheses of Carbon Nanotube-Metal Oxides Composites; Adsorption and Photo-Degradation. In Carbon Nanotubes-From Research to Applications; InTechOpen: London, UK, 2011; Available online: https://www.intechopen.com/chapters/16834 (accessed on 10 April 2024).
- Trandabat, A.F.; Ciobanu, R.C.; Schreiner, O.D.; Aradoaei, M.; Aradoaei, S.T. Manufacturing of TiO2, Al2O3 and Y2O3 Ceramic Nanotubes for Application as Electrodes for Printable Electrochemical Sensors. Crystals 2024, 14, 454. [Google Scholar] [CrossRef]
- Saboor, F.H.; Ataei, A. Decoration of Metal Nanoparticles and Metal Oxide Nanoparticles on Carbon Nanotubes. Adv. J. Chem. 2024, 7, 122–145. [Google Scholar]
- Kumar, N.; Navani, N.K.; Manhas, S.K. Effect of Metal Oxide Nanoparticles on Carbon Nanotube Device Characteristics. J. Electron. Mater. 2021, 50, 528–536. [Google Scholar] [CrossRef]
- SUZHOU LEANSTAR ELECTRONICS TECH. Suzhou Industrial Park, Jiangsu Province, China: Preparation Method of Nano Metal Oxide Functionalized Carbon Nanotubes and Gas Sensor. Patent Application No. CN103058173B, 13 August 2014. Available online: https://eureka.patsnap.com/patent-CN103058173B (accessed on 10 April 2024).
- Cho, H.H.; Smith, B.A.; Wnuk, J.D.; Fairbrother, D.H.; Ball, W.P. Influence of Surface Oxides on the Adsorption of Naphthalene onto Multiwalled Carbon Nanotubes. Environ. Sci. Technol. 2008, 42, 2899–2905. [Google Scholar] [CrossRef]
- Ali, M.A.; Solanki, P.R.; Srivastava, S.; Singh, S.; Agrawal, V.V.; John, R.; Malhotra, B.D. Protein Functionalized Carbon Nanotubes-based Smart Lab-on-a-Chip. ACS Appl. Mater. Interfaces 2015, 7, 5837–5846. [Google Scholar]
- Wang, H.; Boghossian, A. Covalent conjugation of proteins onto fluorescent single-walled carbon nanotubes for biological and medical applications. Mater. Adv. 2023, 4, 823–834. [Google Scholar] [CrossRef]
- Lange, U.; Mirsky, V. Chemiresistors based on conducting polymers: A review on measurement techniques. Anal. Chim. Acta 2011, 687, 105–113. [Google Scholar] [CrossRef]
- Lei, W.; Si, W.; Xu, Y.; Gu, Z.; Hao, Q. Conducting polymer composites with graphene for use in chemical sensors and bio-sensors. Microchim. Acta 2014, 181, 707–722. [Google Scholar] [CrossRef]
- Rahman, A.; Pal, R.K.; Islam, N.; Freeman, R.; Berthiaume, F.; Mazzeo, A.; Ashraf, A. A Facile Graphene Conductive Polymer Paper Based Biosensor for Dopamine, TNF-α, and IL-6 Detection. Sensors 2023, 23, 8115. [Google Scholar] [CrossRef] [PubMed]
- Wang, Y.; Liu, A.; Han, Y.; Li, T. Sensors based on conductive polymers and their composites: A review. Polym. Int. 2020, 69, 7–17. Available online: https://onlinelibrary.wiley.com/doi/abs/10.1002/pi.5907 (accessed on 12 June 2024). [CrossRef]
- Lin, C.-H.; Lin, J.-H.; Chen, C.-F.; Ito, Y.; Luo, S.-C. Conducting polymer-based sensors for food and drug analysis. J. Food Drug Anal. 2021, 29, 544–558. [Google Scholar] [CrossRef]
- Elanjeitsenni, V.P.; Vadivu, K.; Prasanth, M. A review on thin films, conducting polymers as sensor devices. Mater. Res. Express 2022, 9, 022001. [Google Scholar] [CrossRef]
- Hira, S.A.; Yusuf, M.; Annas, D.; Nagappan, S.; Song, S.; Park, S.; Park, K.H. Recent Advances on Conducting Polymer-Supported Nanocomposites for Nonenzymatic Electrochemical Sensing. Ind. Eng. Chem. Res. 2021, 60, 13425–13437. [Google Scholar] [CrossRef]
- Mooss, V.; Kesari, Y.; Athawale, A. Conducting polymer and metal-based sensors for the detection of vapours and toxic gases: A concise review. J. Mater. Nanosci. 2022, 9, 37–46. [Google Scholar]
- Resistive Gas Sensor. Available online: https://www.electricity-magnetism.org/resistive-gas-sensor/ (accessed on 12 March 2024).
- Baier, D.; Priamushko, T.; Weinberger, C.; Kleitz, F.; Tiemann, M. Selective Discrimination between CO and H2 with Copper–Ceria-Resistive Gas Sensors. ACS Sens. 2023, 8, 1616–1623. [Google Scholar] [CrossRef]
- Cheng, Y.; Li, Z.; Cheng, L.; Yuan, Y.; Xie, E.; Cao, X.; Xin, Z.; Liu, Y.; Tang, T.; Hu, X.; et al. Thickness-Dependent Room-Temperature Optoelectronic Gas Sensing Performances of 2D Nonlayered Indium Oxide Crystals from a Liquid Metal Printing Process. ACS Appl. Mater. Interfaces 2023, 15, 57496–57506. [Google Scholar] [CrossRef]
- Elkady, M.F.; Hassan, H.S.; Amer, W.A.; Salama, E.; Algarni, H.; Shaaban, E.R. Novel Magnetic Zinc Oxide Nanotubes for Phenol Adsorption: Mechanism Modeling. Materials 2017, 10, 1355. [Google Scholar] [CrossRef]
- Ansari, H.R.; Mirzaei, A.; Shokrollahi, H.; Kumar, R.; Kim, J.-Y.; Kim, H.W.; Kumar, M.; Kim, S.S. Flexible/wearable resistive gas sensors based on 2D materials. J. Mater. Chem. C 2023, 11, 6528–6549. [Google Scholar] [CrossRef]
- Chesler, P.; Hornoiu, C. MOX-Based Resistive Gas Sensors with Different Types of Sensitive Materials (Powders, Pellets, Films), Used in Environmental Chemistry. Chemosensors 2023, 11, 95. [Google Scholar] [CrossRef]
- Jian, Y.; Hu, W.; Zhao, Z.; Cheng, P.; Haick, H.; Yao, M.; Wu, W. Gas Sensors Based on Chemi-Resistive Hybrid Functional Nanomaterials. Nano Micro Lett. 2020, 12, 71. [Google Scholar] [CrossRef] [PubMed]
- Chronic Kidney Disease. Available online: https://www.hopkinsmedicine.org/health/conditions-and-diseases/chronic-kidney-disease (accessed on 10 April 2024).
- Chan, M.-J.; Li, Y.-J.; Wu, C.-C.; Lee, Y.-C.; Zan, H.-W.; Meng, H.-F.; Hsieh, M.-H.; Lai, C.-S.; Tian, Y.-C. Breath Ammonia is a Useful Biomarker Predicting Kidney Function in Chronic Kidney Disease Patients. Biomedicines 2020, 8, 468. [Google Scholar] [CrossRef]
- Bevc, S.; Mohorko, E.; Kolar, M.; Brglez, P.; Holobar, A.; Kniepeiss, D.; Podbregar, M.; Piko, N.; Hojs, N.; Knehtl, M.; et al. Measurement of breath ammonia for detection of patients with chronic kidney disease. Clin. Nephrol. 2017, 88, 14–17. [Google Scholar] [CrossRef] [PubMed]
- Ricci, P.; Gregory, O. Sensors for the detection of ammonia as a potential biomarker for health screening. Sci. Rep. 2021, 11, 7185. [Google Scholar] [CrossRef]
- Wang, C.; Wang, T.; Li, Z.; Xu, X.; Zhang, X.; Li, D. An Electrochemical Enzyme Biosensor for Ammonium Detection in Aquaculture Using Screen-Printed Electrode Modified by Gold Nanoparticle/Polymethylene Blue. Biosensors 2021, 11, 335. [Google Scholar] [CrossRef]
- Uzunçar, S.; Meng, L.; Turner, A.P.; Mak, W.C. Processable and nanofibrous polyaniline: Polystyrene-sulphonate (nano-PANI: PSS) for the fabrication of catalyst-free ammonium sensors and enzyme-coupled urea biosensors. Biosens. Bioelectron. 2021, 171, 112725. [Google Scholar] [CrossRef]
- Ando, B.; Baglio, S.; Castorina, S.; Graziani, S.; Messina, M.; Petralia, S.; Tondepu, S.V.G. A Capacitive Readout Strategy for Ammonia Detection: Design Flow, Modeling and Simulation. In Proceedings of the 2021 IEEE Sensors Applications Symposium (SAS), Sundsvall, Sweden, 2–4 August 2021. [Google Scholar] [CrossRef]
- Song, G.; Jiang, D.; Wu, J.; Sun, X.; Deng, M.; Wang, L.; Hao, C.; Shi, J.; Liu, H.; Tian, Y.; et al. An ultrasensitive fluorescent breath ammonia sensor for noninvasive diagnosis of chronic kidney disease and helicobacter pylori infection. Chem. Eng. J. 2022, 440, 135979. [Google Scholar] [CrossRef]
- Silva, L.G.; Bueno, S.C.E.; da Silva, M.G.; Mota, L.; Sthel, M.S.; de Castro, M.P.P.; Neto, R.M.S.; Kuba, V.M. Photoacoustic detection of ammonia exhaled by individuals with chronic kidney disease. Lasers Med. Sci. 2022, 37, 983–991. [Google Scholar] [CrossRef]
- Luo, S.-X.L.; Swager, T.M. Wireless Detection of Trace Ammonia: A Chronic Kidney Disease Biomarker. ACS Nano 2024, 18, 364–372. [Google Scholar] [CrossRef]
- Latour, R.; Chumanov, G. At-Home/Point-of-Care Breath-Based Ammonia In-vitro Diagnostic Platform for CKD Patients; CURF: Clemson, SC, USA, 2021; Available online: https://curf.clemson.edu/technology/at-home-point-of-care-breath-based-ammonia-in-vitro-diagnostic-platform-for-ckd-patients/ (accessed on 10 April 2024).
- Li, D.; McCann, J.T.; Xia, Y.; Marquez, M. Electrospinning: A Simple and Versatile Technique for Producing Ceramic Nanofibers and Nanotubes. J. Am. Ceram. Soc. 2006, 89, 1861–1869. [Google Scholar] [CrossRef]
- Trznadel, M.; Zagórska, M.; Lapkowski, M.; Louarn, G.; Lefrant, S.; Pron, A. UV–VIS–NIR and Raman spectroelectrochemistry of regioregular poly(3-octylthiophene): Comparison with its non-regioregular analogue. J. Chem. Soc. Faraday Trans. 1998, 24, 3527–3780. [Google Scholar] [CrossRef]
- Quillard, S.; Louarn, G.; Lefrant, S.; Macdiarmid, A.G. Vibrational analysis of polyaniline: A comparative study of leucoemeraldine, emeraldine, and pernigraniline bases. Phys. Rev. B 1994, 50, 12496. [Google Scholar] [CrossRef]
- Garreau, S.; Louarn, G.; Buisson, J.P.; Froyer, G.; Lefrant, S. In Situ Spectroelectrochemical Raman Studies of Poly(3,4-ethylenedioxythiophene) (PEDT). Macromolecules 1999, 32, 6807–6812. [Google Scholar] [CrossRef]
- Diédhiou, I.; Fall, B.; Gaye, C.; Sall, M.L.; Diaw, A.K.D.; Gningue-Sall, D.; Fall, M.; Raouafi, N. Preparations and applications of organic conducting polymers/graphene composites in heavy metal ion sensing: A review. Int. J. Mater. Res. 2023, 114, 79–99. [Google Scholar] [CrossRef]
- Chen, W.; Zhou, Q.; Wan, F.; Gao, T. Gas Sensing Properties and Mechanism of Nano-SnO2-Based Sensor for Hydrogen and Carbon Monoxide. J. Nanomater. 2012, 2012, 612420. [Google Scholar] [CrossRef]
- Niyat, F.Y.; Abadi, M.H.S. COMSOL-Based Modeling and Simulation of SnO2/rGO Gas Sensor for Detection of NO2. Sci. Rep. 2018, 8, 2149. [Google Scholar] [CrossRef]
- Verma, A.; Gupta, R.; Verma, A.S.; Kumar, T. A review of composite conducting polymer-based sensors for detection of industrial waste gases. Sens. Actuators Rep. 2023, 5, 100143. [Google Scholar] [CrossRef]
- Liu, X.; Zheng, W.; Kumar, R.; Kumar, M.; Zhang, J. Conducting polymer-based nanostructures for gas sensors. Coord. Chem. Rev. 2022, 462, 214517. [Google Scholar] [CrossRef]
- Wong, Y.C.; Ang, B.C.; Haseeb, A.S.M.A.; Baharuddin, A.A.; Wong, Y.H.; Wong, Y.C.; Ang, B.C.; Haseeb, A.S.M.A.; Baharuddin, A.A.; Wong, Y.H. Conducting Polymers as Chemiresistive Gas Sensing Materials: A Review. J. Electrochem. Soc. 2020, 167, 037503. [Google Scholar] [CrossRef]
- Cheon, H.J.; Shin, S.Y.; Van Tran, V.; Park, B.; Yoon, H.; Chang, M. Preparation of conjugated polymer/reduced graphene oxide nano-composites for high-performance volatile organic compound sensors. Chem. Eng. J. 2021, 425, 131424. [Google Scholar] [CrossRef]
- Probst, D.; Lee, Y.; Dick, J.; Sode, K. Surface area independent response of closed bipolar electrodes. Sens. Actuators Rep. 2023, 5, 100138. [Google Scholar] [CrossRef]
- Yan, Y.; Yang, G.; Xu, J.L.; Zhang, M.; Kuo, C.C.; Wang, S.D. Conducting polymer-inorganic nanocomposite-based gas sensors: A review. Sci. Technol. Adv. Mater. 2020, 21, 768–786. [Google Scholar] [CrossRef]
- Zegebreal, L.; Tegegne, N.; Hone, F. Recent progress in hybrid conducting polymers and metal oxide nanocomposite for room-temperature gas sensor applications: A review. Sens. Actuators A Phys. 2023, 359, 114472. [Google Scholar] [CrossRef]
- Sudheep, C.V.; Verma, A.; Jasrotia, P.; Hmar, J.J.L.; Gupta, R.; Verma, A.S.; Kumar, A.; Kumar, T. Revolutionizing gas sensors: The role of composite materials with conducting polymers and transition metal oxides. Results Chem. 2024, 7, 101255. [Google Scholar] [CrossRef]
- Wuloh, J.; Agorku, E.S.; Boadi, N.O. Modification of Metal Oxide Semiconductor Gas Sensors Using Conducting Polymer Materials. J. Sens. 2023, 2023, 7427986. [Google Scholar] [CrossRef]
- Nikolic, M.V.; Milovanovic, V.; Vasiljevic, Z.Z.; Stamenkovic, Z. Semiconductor Gas Sensors: Materials, Technology, Design, and Application. Sensors 2020, 20, 6694. [Google Scholar] [CrossRef]
- Goel, N.; Kunal, K.; Kushwaha, A.; Kumar, M. Metal oxide semiconductors for gas sensing. Eng. Rep. 2023, 5, e12604. [Google Scholar] [CrossRef]
- Witkiewicz, Z.; Jasek, K.; Grabka, M. Semiconductor Gas Sensors for Detecting Chemical Warfare Agents and Their Simulants. Sensors 2023, 23, 3272. [Google Scholar] [CrossRef]
- Chai, H.; Zheng, Z.; Liu, K.; Xu, J.; Wu, K.; Luo, Y.; Liao, H.; Debliquy, M.; Zhang, C. Stability of Metal Oxide Semiconductor as Sensors: A Review. IEEE Sens. J. 2022, 22, 5470–5481. [Google Scholar] [CrossRef]
- Molleman, B.; Alessi, E.; Krol, D.; Morton, P.A.; Daly, K. Application of metal oxide semiconductor for detection of ammonia emissions from agricultural sources. Sens. Bio Sens. Res. 2022, 38, 100541. [Google Scholar] [CrossRef]
- Ammonia NH3 Sensor—50 PPM Range. Available online: https://www.pranaair.com/air-quality-sensor/ammonia-nh3-sensor/ (accessed on 10 April 2024).
- Ammonia Sensors and Detectors. Available online: https://vocsens.com/ammonia-nh3-sensors/ (accessed on 10 April 2024).
- NH3 Gas and Its Sensor. Available online: https://www.blacklinesafety.com/solutions/gas-sensors/nh3 (accessed on 10 April 2024).
- Hagenaar, J.J.; Oshovsky, G.V.; Tempelman, C.H.; Majstorovic, M.; Herselman, J.F. Bio-Based Colorimetric Sensors for Detecting Ammonia in the Air. In Proceedings of the 2023 IEEE Sensors Conference, Vienna, Austria, 29 October–1 November 2023. [Google Scholar] [CrossRef]
- Usman, F.; Ghazali, K.H.; Muda, R.; Dennis, J.O.; Ibnaouf, K.H.; Aldaghri, O.A.; Alsadig, A.; Johari, N.H.; Jose, R. Detection of Kidney Complications Relevant Concentrations of Ammonia Gas Using Plasmonic Biosensors: A Review. Chemosensors 2023, 11, 119. [Google Scholar] [CrossRef]
- Fermion: MEMS Ammonia NH3 Gas Detection Sensor (Breakout, 1–300 ppm). Available online: https://www.dfrobot.com/product-2706.html (accessed on 10 April 2024).
- Irritable Bowel Syndrome (IBS). Available online: https://www.nhs.uk/conditions/irritable-bowel-syndrome-ibs/ (accessed on 10 April 2024).


| Scanned Material | RMS (nm) | Ra (nm) | RSk | RKu |
|---|---|---|---|---|
| Al2O3 nanotubes—P3HT | 198 | 123 | 0.62 | 5.86 |
| Al2O3 nanotubes—PEDOT:PS | 273 | 194 | 0.16 | 3.97 |
| Al2O3 nanotubes—PANI-EB | 881 | 702 | 0.08 | 3.44 |
| ZnO nanotubes—P3HT | 1191 | 956 | −0.15 | 2.88 |
| ZnO nanotubes—PEDOT:PS | 265 | 196 | −0.13 | 4.23 |
| ZnO nanotubes—PANI-EB | 1413 | 1086 | −0.21 | 2.89 |
Disclaimer/Publisher’s Note: The statements, opinions and data contained in all publications are solely those of the individual author(s) and contributor(s) and not of MDPI and/or the editor(s). MDPI and/or the editor(s) disclaim responsibility for any injury to people or property resulting from any ideas, methods, instructions or products referred to in the content. |
© 2024 by the authors. Licensee MDPI, Basel, Switzerland. This article is an open access article distributed under the terms and conditions of the Creative Commons Attribution (CC BY) license (https://creativecommons.org/licenses/by/4.0/).
Share and Cite
Trandabat, A.F.; Ciobanu, R.C.; Schreiner, O.D.; Schreiner, T.G.; Aradoaei, S. Ceramic Nanotubes—Conducting Polymer Assemblies with Potential Application as Chemosensors for Breath Ammonia Detection in Chronic Kidney Disease. Chemosensors 2024, 12, 198. https://doi.org/10.3390/chemosensors12090198
Trandabat AF, Ciobanu RC, Schreiner OD, Schreiner TG, Aradoaei S. Ceramic Nanotubes—Conducting Polymer Assemblies with Potential Application as Chemosensors for Breath Ammonia Detection in Chronic Kidney Disease. Chemosensors. 2024; 12(9):198. https://doi.org/10.3390/chemosensors12090198
Chicago/Turabian StyleTrandabat, Alexandru Florentin, Romeo Cristian Ciobanu, Oliver Daniel Schreiner, Thomas Gabriel Schreiner, and Sebastian Aradoaei. 2024. "Ceramic Nanotubes—Conducting Polymer Assemblies with Potential Application as Chemosensors for Breath Ammonia Detection in Chronic Kidney Disease" Chemosensors 12, no. 9: 198. https://doi.org/10.3390/chemosensors12090198