Abstract
Notwithstanding the success of SnO2 as a fundamental material for gas sensing, it has often been criticized for its cross-sensitivity and high operational temperatures. Therefore, in this study, RF-sputtered SnO2 thin films were subjected to a modification process through doping with a rare earth element, dysprosium (Dy), and subsequently deposited onto two different types of substrates: alumina and glass substrates. All thin films underwent a comprehensive series of characterizations aimed at ensuring their suitability as NO2 sensors. The dysprosium doping levels ranged from 1 to 7 wt.% in increments of 2% (wt.%). X-ray patterns showed that all deposited films exhibited the tetragonal rutile structure of SnO2. The optical band gap energy (Eg) increased with Dy doping, while the Urbach energy decreased with Dy doping. Field emission scanning electron microscopy (FESEM) revealed highly compacted grainy surfaces with high roughness for alumina substrate thin films, which also exhibited higher resistivity that increased with the levels of Dy doping. Energy-dispersive X-ray spectroscopy (EDX) analyses confirmed the stoichiometry of both types of thin films. Gas sensing tests were conducted at different operating temperatures, where the highest response to nitrogen dioxide, over 42%, was recorded for the higher dopant level at 250 °C. Moreover, the sensor’s selectivity toward nitrogen dioxide traces was evaluated by introducing interfering gases at higher concentrations. However, the sensors showed also significant responses when operated at room temperature. Also, we have demonstrated that higher stability is related to the temperature of the sensors and Dy ratio. Hence, a detailed discussion of the gas-sensing mechanisms was undertaken to gain a deeper insight into the NO2 sensitivity exhibited by the Dy-doped SnO2 layer.
1. Introduction
In an era marked by remarkable technological strides, where innovation and progress intertwine seamlessly, there is one sobering reality: relentless air pollution. Air rather disgustingly filled up with the well-designed webs of pollutants poses a serious threat not only to health but also to entire ecosystems and even the so-called tissue of the environment, for all the unprecedented technology that society possesses. This paradox translates into an urgent need to address the persistent challenges of air quality monitoring, recognizing that the solutions to this environmental menace must be as advanced and interconnected as the technologies that, paradoxically, contribute to the ongoing struggle against pollution.
Actually, no one can deny that anthropogenic air pollutants have a detrimental impact on human health, such as chronic obstructive pulmonary disease, heart disease, chronic bronchitis, asthma, and lung cancer that leads probably to death. This is supported by the studies implemented by the World Health Organization, which indicate that approximately 4.2 million people worldwide die prematurely per year due to environmental pollution [1]. Notably, nitrogen oxides (NOxs), particularly NO2, rank among the top five pollutants responsible for degrading ambient air quality. NOxs are generated from combustion processes, such as motor vehicle exhausts, power stations, off-road equipment and industrial processes [2]. The effect of NO2 is always very deleterious on the environment, where it directly contributes to the formation of ground-level ozone, acid rain, and inorganic ambient particulate matter [3].
The annual standard for NO2 set by the U.S. Environmental Protection Agency is 53 parts per billion (ppb), averaged over a year [4], as exposure above this concentration can be extremely dangerous to our health. Additionally, keeping it in acceptable concentrations remains an important challenge. Therefore, the monitoring of NO2 at trace levels in the environment is crucial for implementing life-saving measures and the conservation of our environment.
Extensive research endeavors have led to the continuous evolution of methods aimed at detecting and mitigating toxic gases. The inception of gas detectors dates back to the utilization of chemical reactions, wherein certain materials interacted with toxic gases, triggering discernible changes [5]. Gas detection technology has evolved significantly over time. Initially, gas detectors relied on chemical reactions to indicate the presence of specific gases. These early devices utilized chemical reagents that changed color upon exposure to certain gases. However, in the mid-20th century, electronic chemoresistors and electrochemical cells emerged, replacing these initial prototypes.
In the contemporary era, the latest advancements in gas detection involve the fusion of sensors with wireless communications and data processing capabilities. These intelligent gas detection systems offer real-time monitoring of gas levels, remote access to data, and predictive analytics for early hazard detection [6]. Achieving such high-tech functionality necessitates the development of new materials with heightened sensitivity. These materials must align with the evolving capabilities of detectors to ensure reliability, accuracy, and cost-effectiveness, particularly in detecting and monitoring low concentrations of gases like NO2 in real-time.
Nitrogen dioxide (NO2) is a major air pollutant that is primarily produced from combustion processes, industrial activities, and vehicular emissions. Its presence in the atmosphere contributes to environmental issues such as acid rain, photochemical smog, and the formation of fine particulate matter, which have severe implications for air quality and human health. Due to these concerns, the detection and monitoring of NO2 have gained significant attention, particularly in environmental applications. Beyond environmental monitoring, NO2 detection is also critical in biomedical applications, such as breath analysis. Exhaled NO2 levels serve as a potential biomarker for respiratory conditions, including asthma and chronic obstructive pulmonary disease (COPD) [7]. Monitoring NO2 at trace concentrations is essential for real-world applications, as its threshold limits vary depending on the context. For instance, the World Health Organization (WHO) recommends a maximum exposure of 200 ppb for 1 h in ambient air, while in medical diagnostics, NO2 concentrations as low as 10–50 ppb can indicate respiratory inflammation. However, at elevated concentrations, NO2 becomes hazardous to human health. Short-term exposure at levels under 20 ppm can cause mild respiratory irritation, while exposure approaching 100 ppm may lead to severe lung inflammation and pulmonary edema. At concentrations above 100 ppm, NO2 is considered immediately dangerous to life and health (IDLH) due to its potential to cause fatal lung damage. Long-term exposure to even low levels (≥1 ppm) increases the risk of chronic lung diseases and susceptibility to respiratory infections [8]. To regulate exposure, occupational and environmental safety agencies have established strict limits. The Occupational Safety and Health Administration (OSHA) sets a permissible exposure limit (PEL) of 5 ppm as a ceiling value, meaning that it should not be exceeded at any time [9]. The National Institute for Occupational Safety and Health (NIOSH) recommends a lower exposure limit of 1 ppm for short-term exposure (15 min) [10]. These regulatory limits emphasize the need for highly sensitive NO2 sensors to ensure workplace safety, air quality monitoring, and medical diagnostics. Therefore, the development of advanced sensing materials with excellent selectivity, stability, and low detection limits is important for both environmental and biomedical applications.
Over the past few decades, there has been extensive exploration into semiconductive metal oxide materials for their potential applications as gas detectors [11]. Notable examples include TiO2 [12], ZnO [13], WO3 [14], and CdO [15], among others. Among these metal oxides, SnO2 stands out as a venerable material that continues to garner research attention. This enduring interest is attributed to its remarkable properties, including affordability, versatility in growing various nanostructures, and the capacity for property manipulation with high 3S-factors, namely, sensitivity, selectivity, and stability. SnO2 boasts a notably elevated melting point and exhibits minimal reactivity toward oxygen and water vapor [16,17]. Consequently, it holds significant promise for the development of advanced gas sensors, as well as for the construction of high-performance optical and electrical devices [12].
Typically, the sensing capabilities of semiconductive metal oxides are influenced by various factors, including the contact surface quality, porosity, morphology, structural characteristics, presence of defects, deposition techniques, and temperature conditions during fabrication. A thorough understanding and investigation of these factors can be leveraged to effectively enhance the properties of detectors.
Nevertheless, the inherent sensitivity of pure SnO2 to NO2 falls short of meeting the required standard, necessitating an intervention to address this limitation. One effective approach involves implementing proven methods to enhance sensitivity or to reduce the optimum operating temperature while ensuring long-term stability.
In recent times, rare earth (RE) metals have garnered attention as additives owing to their distinctive electron configurations [18]. This characteristic allows them to demonstrate exceptional sensing capabilities, rendering them highly suitable for gas detection purposes. Moreover, the structural alterations induced by the sizable ionic radii of rare earth elements lead to enhanced sensitivity of SnO2 materials [19]. For instance, S. Maheswari et al. have used yttrium to enhance the NH3-sensing properties of SnO2 thin films, proving that the response time and recovery are getting shorter with SnO2:Y (5 wt.%) [20].
Dysprosium (Dy), among the spectrum of rare earth elements, has been very seldom studied for enhancing the sensing capabilities of metal oxides. S. Bahtia et al. examined the impact of Dy doping on ZnO, uncovering heightened sensing capabilities with increasing Dy concentrations in comparison to pure ZnO samples [21]. Moreover, G. Singh has proven the positive effect of Dy doping in SnO2 thick films on detecting NO2 [22]. Additionally, F.I. Shaikh et al. succeeded in incorporating Dy in the SnO2 lattice to improve the sensing response to ethanol vapors [23]. Dysprosium (Dy), one of the most plentiful rare earth elements, demonstrates notable surface reactivity, assisting in the absorption and release of gas molecules onto TCO surfaces, and can heighten the interaction between the sensing material and the intended gas, potentially resulting in swifter response and recovery times, along with an enhanced dynamic range and stability [24].
This paper seeks to enhance the understanding of the impact of dysprosium on various properties of SnO2 thin films, with the aim of developing them into gas detectors. Thin films of Dy-doped SnO2 were fabricated using RF sputtering and deposited onto two different substrates. A comprehensive comparative analysis was conducted to explore the effects of dysprosium doping across all characterization aspects.
This initiative is inspired by the extensive research efforts dedicated to the application of rare earth elements in enhancing the functionality of semiconductor materials. To the best of our knowledge, few studies have delved into the characterization of Dy:SnO2 thin films. Therefore, it is paramount to thoroughly examine the optical, structural, and gas-sensing properties of Dy-doped SnO2.
Our goal is to optimize the sensors to detect concentrations of an oxidizing species at trace levels (i.e., at ppb levels), knowing that the results achieved so far for SnO2:Dy materials report the detection of reducing species at hundreds of ppm only. Achieving this would enable the sensors to respond more rapidly and provide timely alerts, which are critical priorities for effective gas sensing technology. Furthermore, our investigation encompasses an exploration of how the morphology and varying Dy doping rates influence the gas sensing capabilities of Dy:SnO2 thin films.
2. Materials and Methods
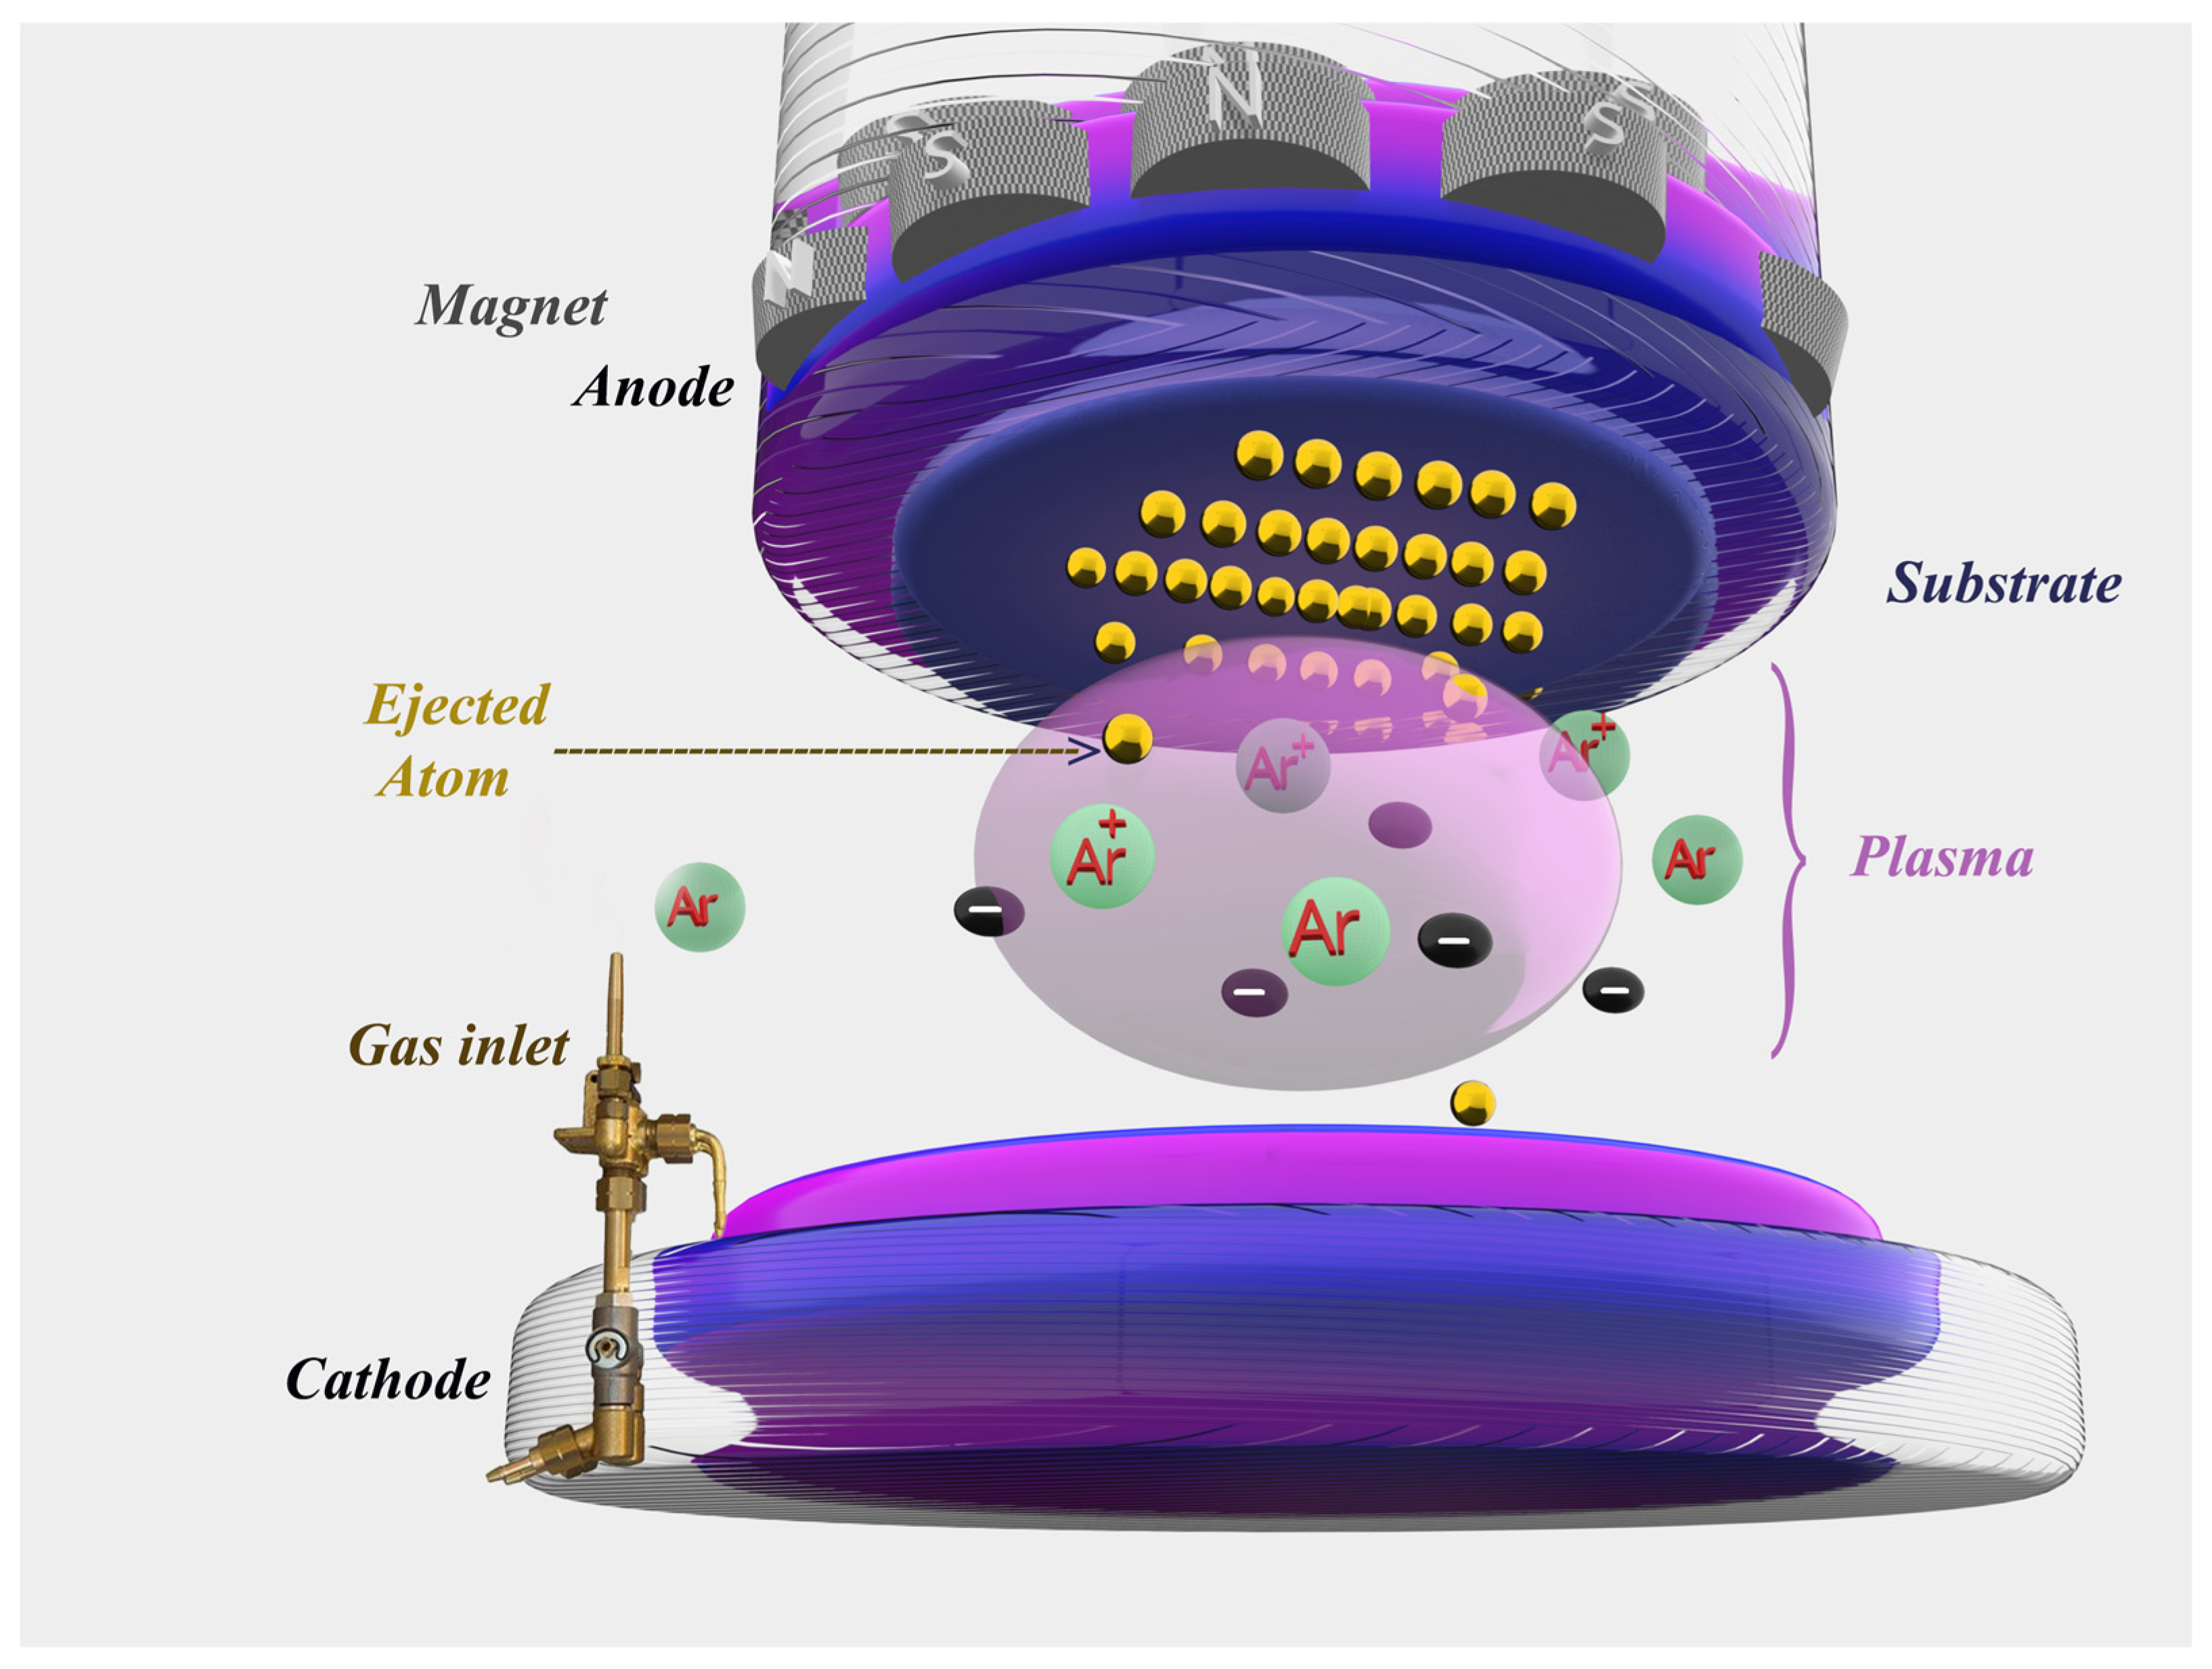
Undoped and dysprosium-doped SnO2 thin films were directly deposited onto glass and alumina substrates featuring screen-printed, interdigitated platinum electrodes on one side and a platinum resistor heater on the opposite side, as illustrated in Figure 1. The deposition process was conducted at room temperature using the RF magnetron sputtering method. Preceding the deposition, the glass substrates underwent ultrasonic cleaning with a soap solution, followed by degreasing with acetone. Subsequently, they were thoroughly rinsed with deionized water and dried in an oven at a temperature of 120 °C.

Figure 1.
Diagram of the operating principle of the “RF sputtering” cathode sputtering technique.
The focus of this study is to investigate the impact of doping SnO2 with the rare earth metal dysprosium (Dy). To achieve this, SnO2 and Dy2O3 powders were meticulously mixed, with Dy concentrations in the range of 0, 1, 3, 5, and 7% by weight. Following a 5 min mixing process in a crusher to ensure uniform compositions, the powder was gently compacted on a backing plate to attain a consistent thickness. The target–substrate distance was set at 65 mm, and the substrates were rotated at 15 rpm. An argon (Ar) flow of 13 sccm (0.6 Pa) was kept constant throughout the process. The RF power in the sputter chamber was adjusted to 200 W, and the chamber was evacuated to a base pressure of 10−4 Pa to prevent contamination of the layers. The deposition time, a crucial parameter, was fixed at 3 h.
2.1. Material Characterization Techniques
The thin films underwent structural characterization through X-ray diffraction (XRD) using a Bruker D8-DISCOVER (Billerica, MA, USA) diffractometer, covering an angular 2θ diffraction range of 20 to 70 degrees. Optical properties were examined using a Shimadzu-UV1800 (Kyoto, Japan) spectrophotometer. Surface morphology was studied using field emission scanning electron microscopy (FESEM) with Hitachi 2000 (Tokyo, Japan) and FEI Helios Nanolab 650 (Hillsboro, OR, USA), and the cross-section FESEM analysis was facilitated by depositing a thin layer of platinum onto the targeted thin film, ensuring the film’s safety during the cutting operation. The surface roughness, indicated by the root mean square (RMS), was analyzed via atomic force microscopy (AFM) Agilent 5500 (Santa Clara, CA, USA). Data analysis for AFM was performed using Gwiddyon (version 2.2.64 of Develop software).
The compositional investigation was carried out using energy-dispersive X-ray spectroscopy (EDS). Electrical properties were determined through a Hall effect analysis using an HMS-50003 (Phoenix, AZ, USA) type device for electrical measurements with a current of 10 µA, providing a magnetic field 0.55 T. Two electrodes were applied by painting them on the thin film’s extremities with conductive silver paste. Hall effect measurements were conducted at various temperatures, with the wired samples placed inside a furnace.
2.2. Gas Sensing Tests
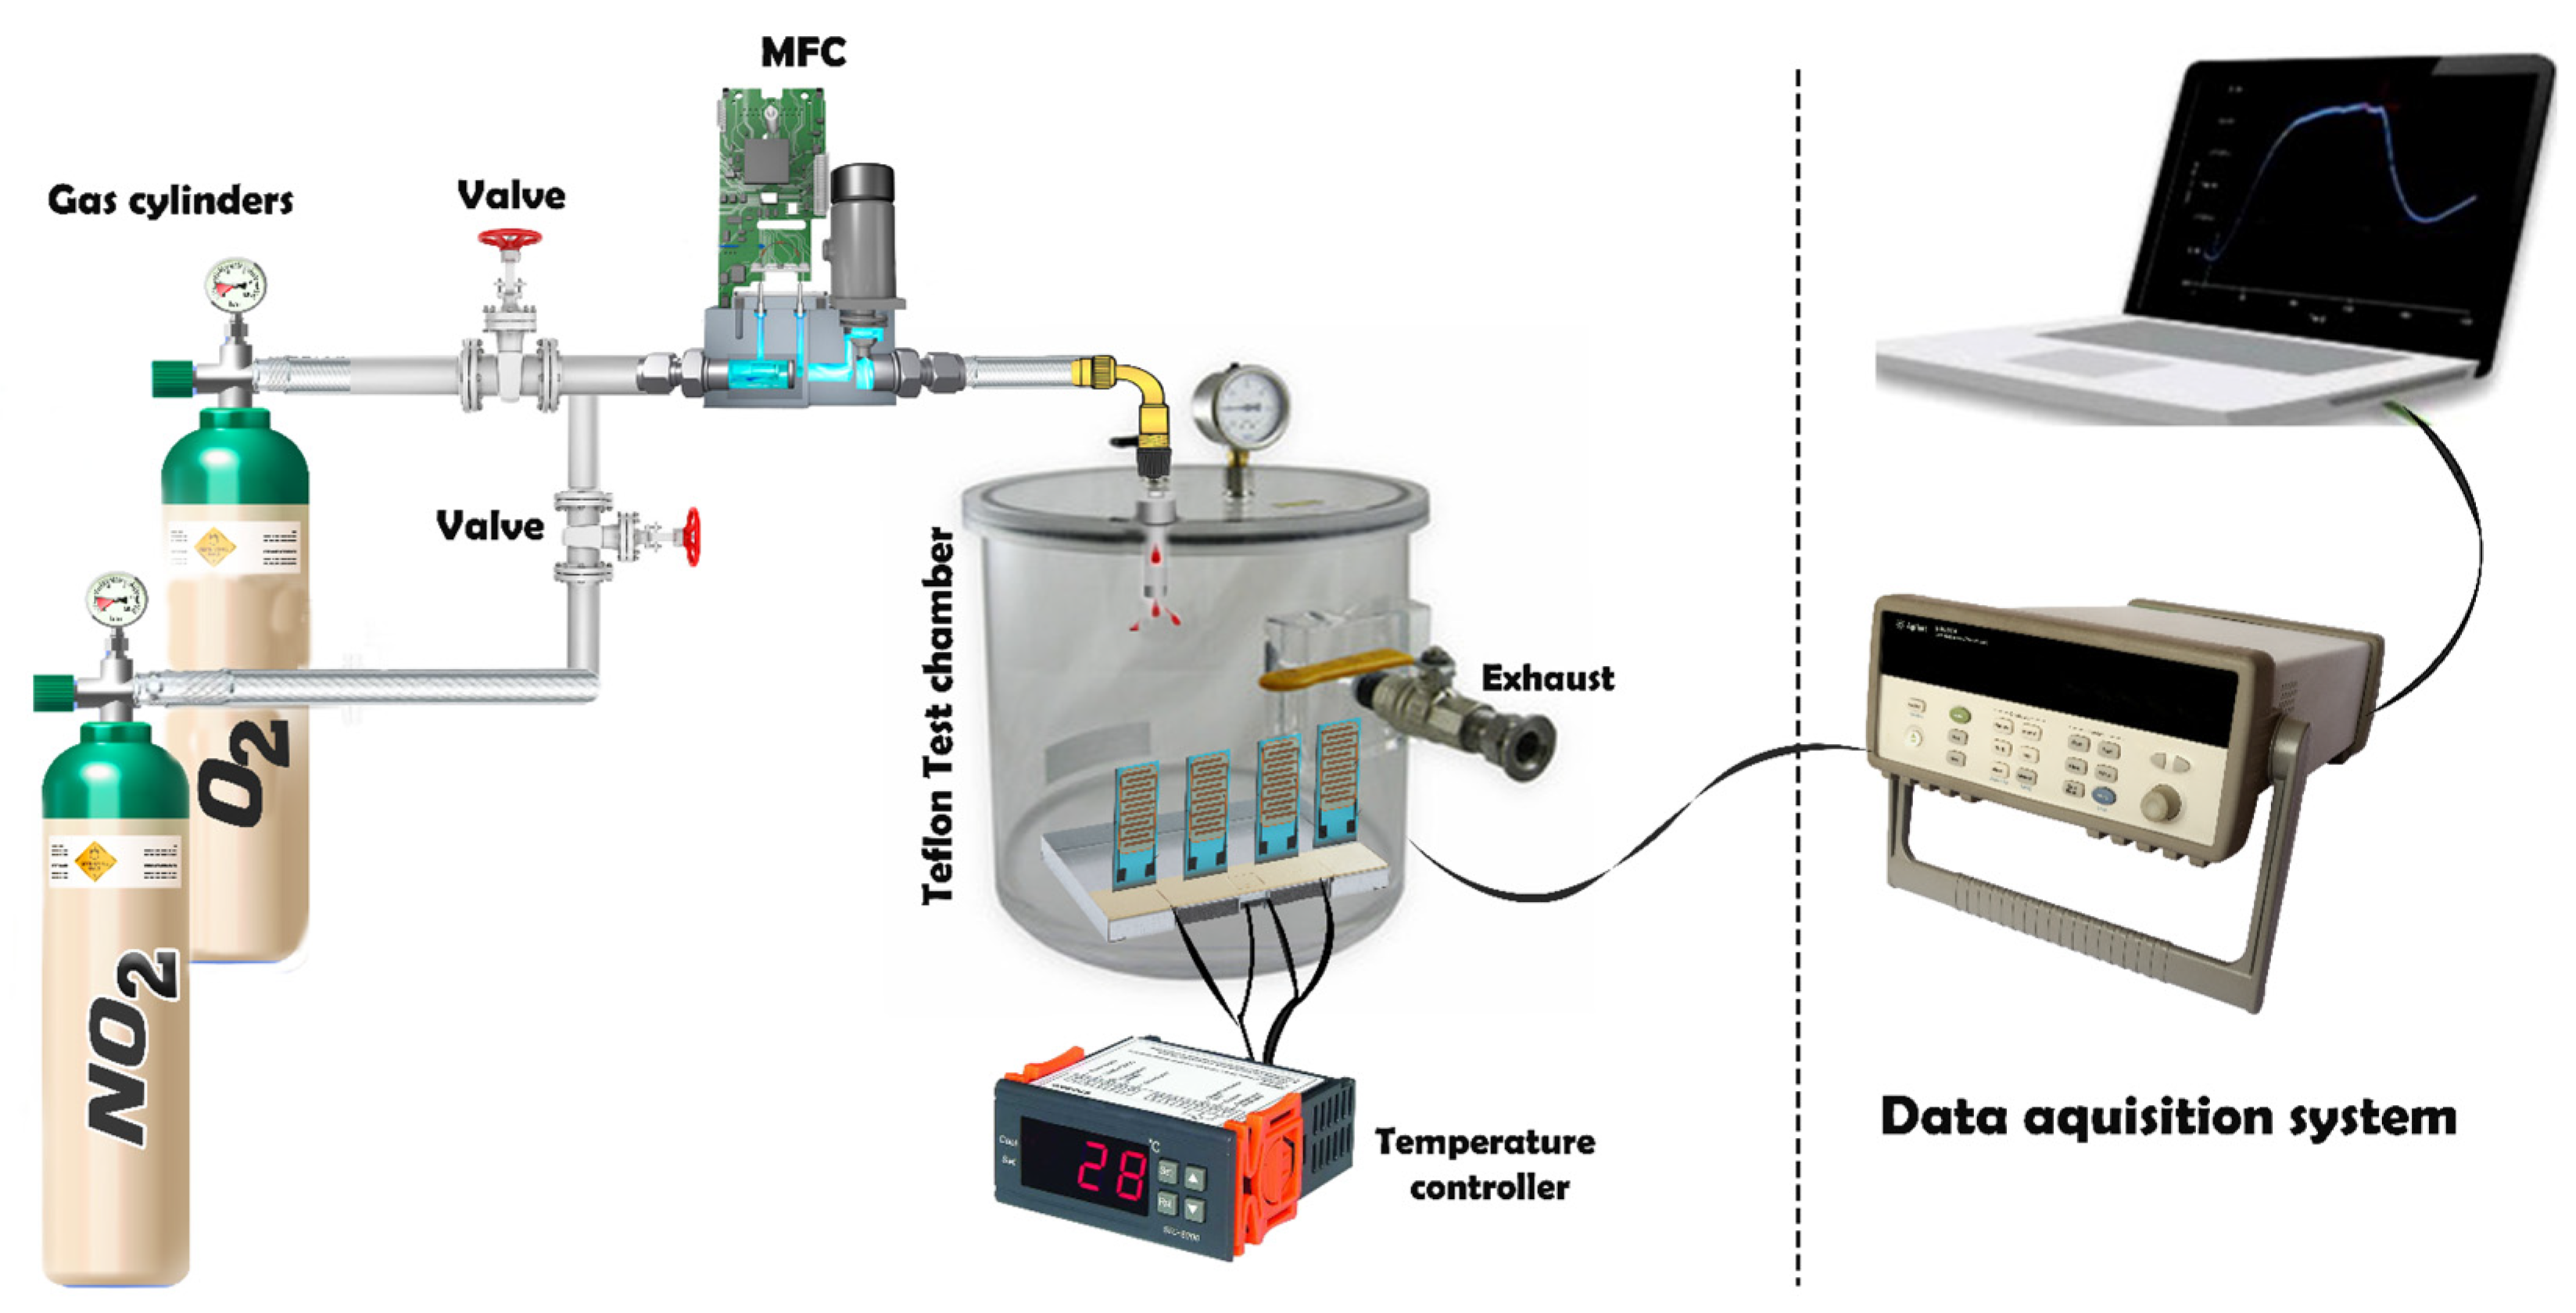
With the objective of investigating and comparing the gas sensing characteristics of undoped and dysprosium-doped SnO2 thin films, we deposited the sensitive films onto commercial alumina substrates (0.4 × 2.25 cm in size). The sensing devices consisted of 0.25 × 0.73 cm screen-printed interdigitated platinum electrodes on the front side and a heating resistor (6 Ω) positioned on the reverse side. The resultant gas sensors were enclosed in an airtight Teflon chamber and subjected to varying concentrations of the NO2 target gas at different operating temperatures (from 50 to 250 °C in steps of 50 °C). The electrical resistance was gauged using an Agilent-34972A (Santa Clara, CA, USA) multimeter, while the operating temperature was regulated by an external power supply. NO2 gas concentrations within the ppb range were measured. The gas sensing properties were assessed based on the response percentage, detection limit, and repeatability. The sensor response (Res) is defined as the percentage change in the baseline resistance of the sensor when exposed to an analyte gas. This can be calculated using the Formula (1), as follows [25]:
In this context, Rair and Rgas represent the sensor resistance before and after exposure to the gas, respectively.
In the beginning, the sensor was kept for a stabilization period in a stream of dry synthetic air (Air Premier, purity: 99.995%) at a flow rate of 100 mL/min, lasting for 4 h to establish its baseline resistance. The exposure to analyte gases was fixed at a duration of 10 min. Following this exposure, the chamber was flushed with dry air for 180 min to facilitate the recovery of the sensor’s baseline resistance.
Figure 2 illustrates the setup for the gas sensing measurement system, which operates by injecting target gases, sourced from calibrated gas cylinders and balanced in dry synthetic air, into a Teflon chamber containing the sensors. The chamber volume is 200 cm3, ensuring a uniform gas distribution. This testing chamber is connected to a fully automated, continuous gas flow measurement system capable of supplying diluted gas mixtures through mass flow controllers (MFCs). The Pt heater meander was assessed to determine the operating temperature of the sensor, which was regulated by an external power supply (Agilent, model 3492A). Throughout the gas sensing characterization experiments, dry air served as the carrier and balance gases.
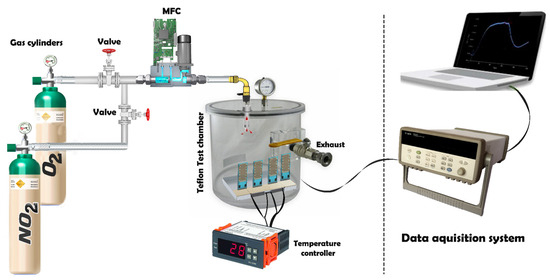
Figure 2.
Gas sensing measurement system setup.
3. Results and Discussion
3.1. Structural Properties: XRD Analysis
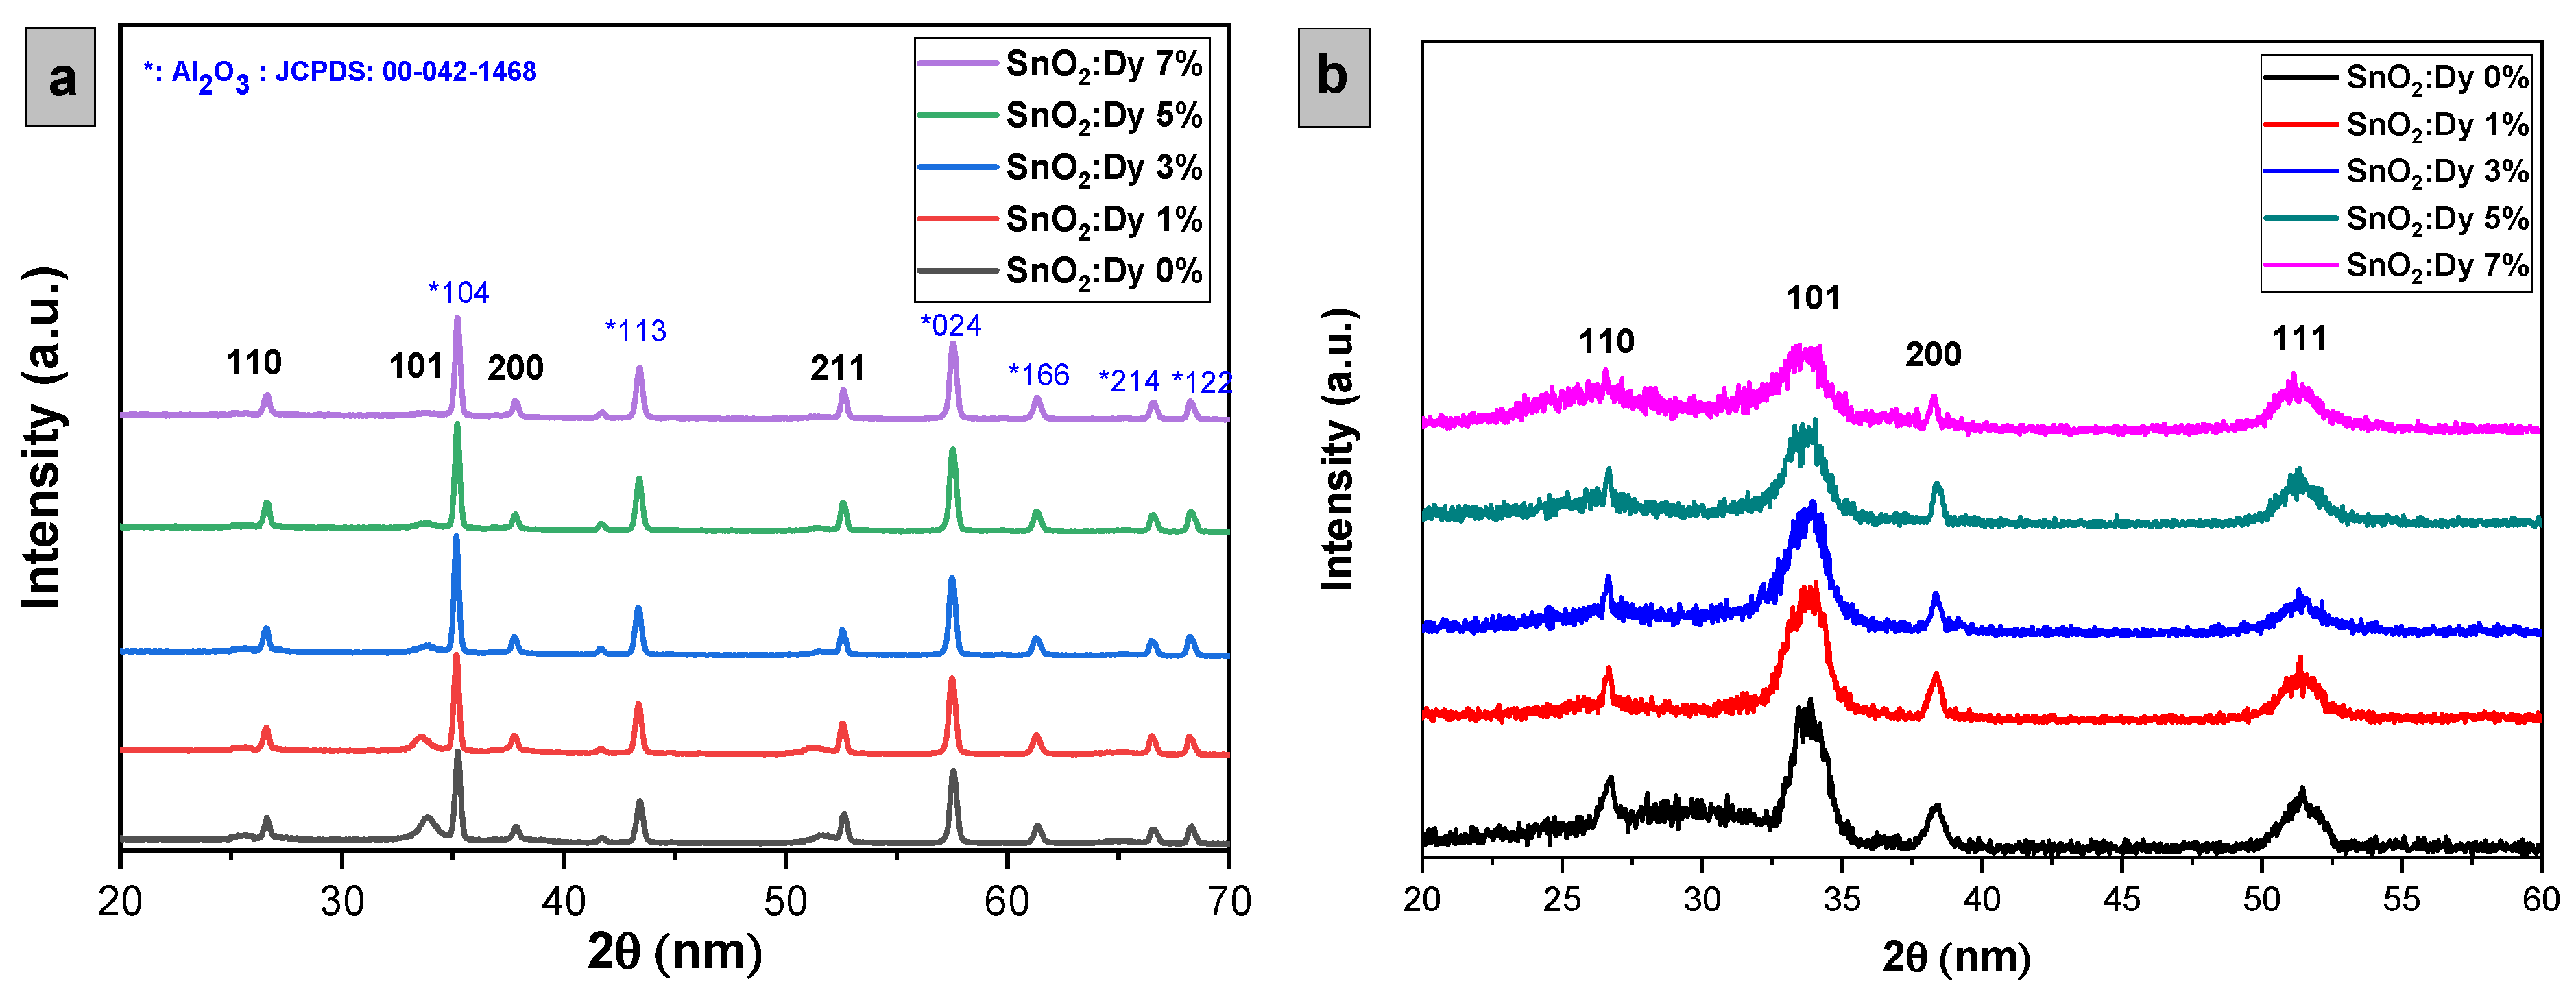
The X-ray diffraction (XRD) patterns illustrating both undoped and Dy-doped SnO2 thin films (at concentrations of 1%, 3%, 5%, and 7%) are depicted in Figure 3. Analyzing XRD patterns, we can see that these lattice structures validated the body-centered tetragonal arrangement (rutile phase) of SnO2 thin films, consistent with the JCPDS card No. 00-041-1445 for both types of substrates, with a preferential direction along the (110) plane, with well-identified peaks at 2θ angles of 26°, 34°, 38°, and 53°, corresponding to the (hkl) planes (110), (101), (200), and (211), respectively. For the thin films deposited on the glass substrate, it is evident that no peaks corresponding to glass elements are detected. However, it is noteworthy that peaks attributed to the alumina substrate, Al2O3, are observed. This occurrence can be attributed to the significantly larger volume of Al2O3 cells compared to SnO2 [26], which will be clearly elucidated by the FESEM (field emission scanning electron microscope) analysis later. Furthermore, the XRD analysis did not reveal the presence of any peaks associated with SnO2 impurities.
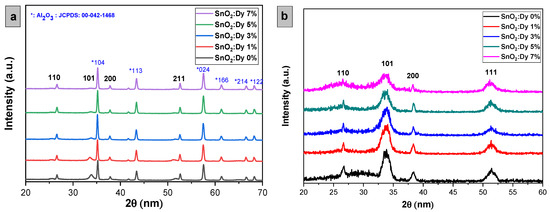
Figure 3.
X-ray diffraction patterns of sputtered undoped and Dy-doped [1, 3, 5, and 7% wt.] SnO2 thin films deposited on (a) alumina substrates and (b) glass substrates.
From the arrangement of the 2θ angle corresponding to the (101) peak for both alumina and glass substrates, a noticeable blue shift of the predominant peaks toward lower angles is observed with increasing dopant concentration, which is attributed to the integration of Dy ions into the SnO2 crystal structure [27]. While most peaks remain consistent, thin layers of SnO2:Dy 7% exhibit the disappearance of peaks at positions 2θ = (101), possibly due to the large presence of Dy3+ ions, initiating lattice structure disruptions in SnO2.
An analysis of lattice parameters reveals a slight increase with rising Dy dopant concentrations. Importantly, the absence of additional Dy peaks, such as Dy2O3, in any pattern confirms successful dopant particle incorporation into the SnO2 matrix.
The influence of doping was distinctly observable, as evidenced by the decreased peak intensity of the SnO2 film along the 101 plane. This reduction can likely be attributed to the incorporation of Dy3+ ions into the lattice structure of SnO2 even more, where their presence is likely inhibiting the crystal grain growth [28]. It is widely recognized that the ionic radius of Dy3+ is greater than that of Sn4+; consequently, Dy atoms predominantly occupy substitutional positions within the SnO2 lattice structure, leading to variations in the lattice parameters of SnO2 films as the Dy content is modified. Consequently, this integration led to lattice distortion and disruption, thereby impacting the average crystallite size. The decrease in XRD peak intensity could be attributed to the altered phase formation of Dy or the generation of localized defects within the lattice. Ausama I. Khudiar et al. achieved a similar behavior by doping SnO2 thin films with aluminum, leading to a distortion in SnO2 lattice, which was concluded by the XRD pattern analyses [29].
The lattice parameters a and c for the tetragonal structure have been identified using the following equation [30]:
where d is the inter-planar spacing and (h, k and l) are the Miller indices.
Structural parameters, including inter-lattice distances (dhkl) and lattice parameters (hkl), are calculated in Table 1. Scherrer’s equation [29] is employed to ascertain the crystalline sizes (D) of both the pure and Dy-doped SnO2 thin films:
where λ, β and 2θ are the wavelength of the X-ray diffraction, the full width at half maximum (FWHM) of peaks, and the maximum peak position, respectively.

Table 1.
Lattice constants, crystallite size (D), dislocation density (δ), and strain (ε) of SnO2:Dy thin films deposited on alumina substrates.
The crystallinity of the samples is slightly reduced, noting that those on alumina substrates are much bigger than thin films deposited on glass substrates, which suggests an enhanced crystalline quality.
Dislocation density (δ) and strain (ε) [31], calculated via Equations (4) and (5), are indicative of film quality and increases with increasing dopant concentrations. A similar result was observed for glass substrate samples (see Table 2); this indicates an increase in stress on the lattice due an increase in impurities by Dy doping. Besides the difference in size between the dopant atoms and the host lattice that generates localized stress zones, which leads to the formation of dislocations as the material adjusts to alleviate this stress of the substrate, we did have a good growth of the doped SnO2 thin films.

Table 2.
Lattice constants, crystallite size (D), dislocation density (δ), and strain (ε) of SnO2:Dy thin films deposited on glass substrates.
The introduction of Dy ions into the SnO2 matrix will cause the grain size to decrease, which is correlated to the inhibition of the nucleation growth mechanism (bad crystallinity), leading to lattice distortion [32]. SnO2 doping with Dy leads to a degradation of crystallinity, which is connected to an increase in the density of dislocation (δ). This means that there is a tensile microstrain embedded in the SnO2 lattice.
The formula for determining the texture coefficient (Tchkl), which assesses the relative level of preferential orientation of a plane (hkl), is as follows:
When considering the number of diffraction peaks as n, I0 represents the standard plane intensity (hkl) from JCPDS data, and I represents the observed plane intensity (hkl) in XRD diffractograms.
When Tc equals one, the crystallites exhibit random orientation, whereas Tc greater than one indicates an abundance of crystallites aligned along a specific plane. Conversely, when Tc falls between zero and one, it suggests a lack of crystallite orientation in that direction.
The texture coefficient for both the pristine and Dy-doped SnO2 deposited on glass substrates layers is less than one for the preferential direction; meanwhile, it registers values higher than one for the (101) plane direction, indicating a random orientation of crystals in all layers (see Table 2). While for the films deposited on alumina, we can note from the obtained values that we have a change of orientation as the Dy concentration increases.
3.2. Optical Properties
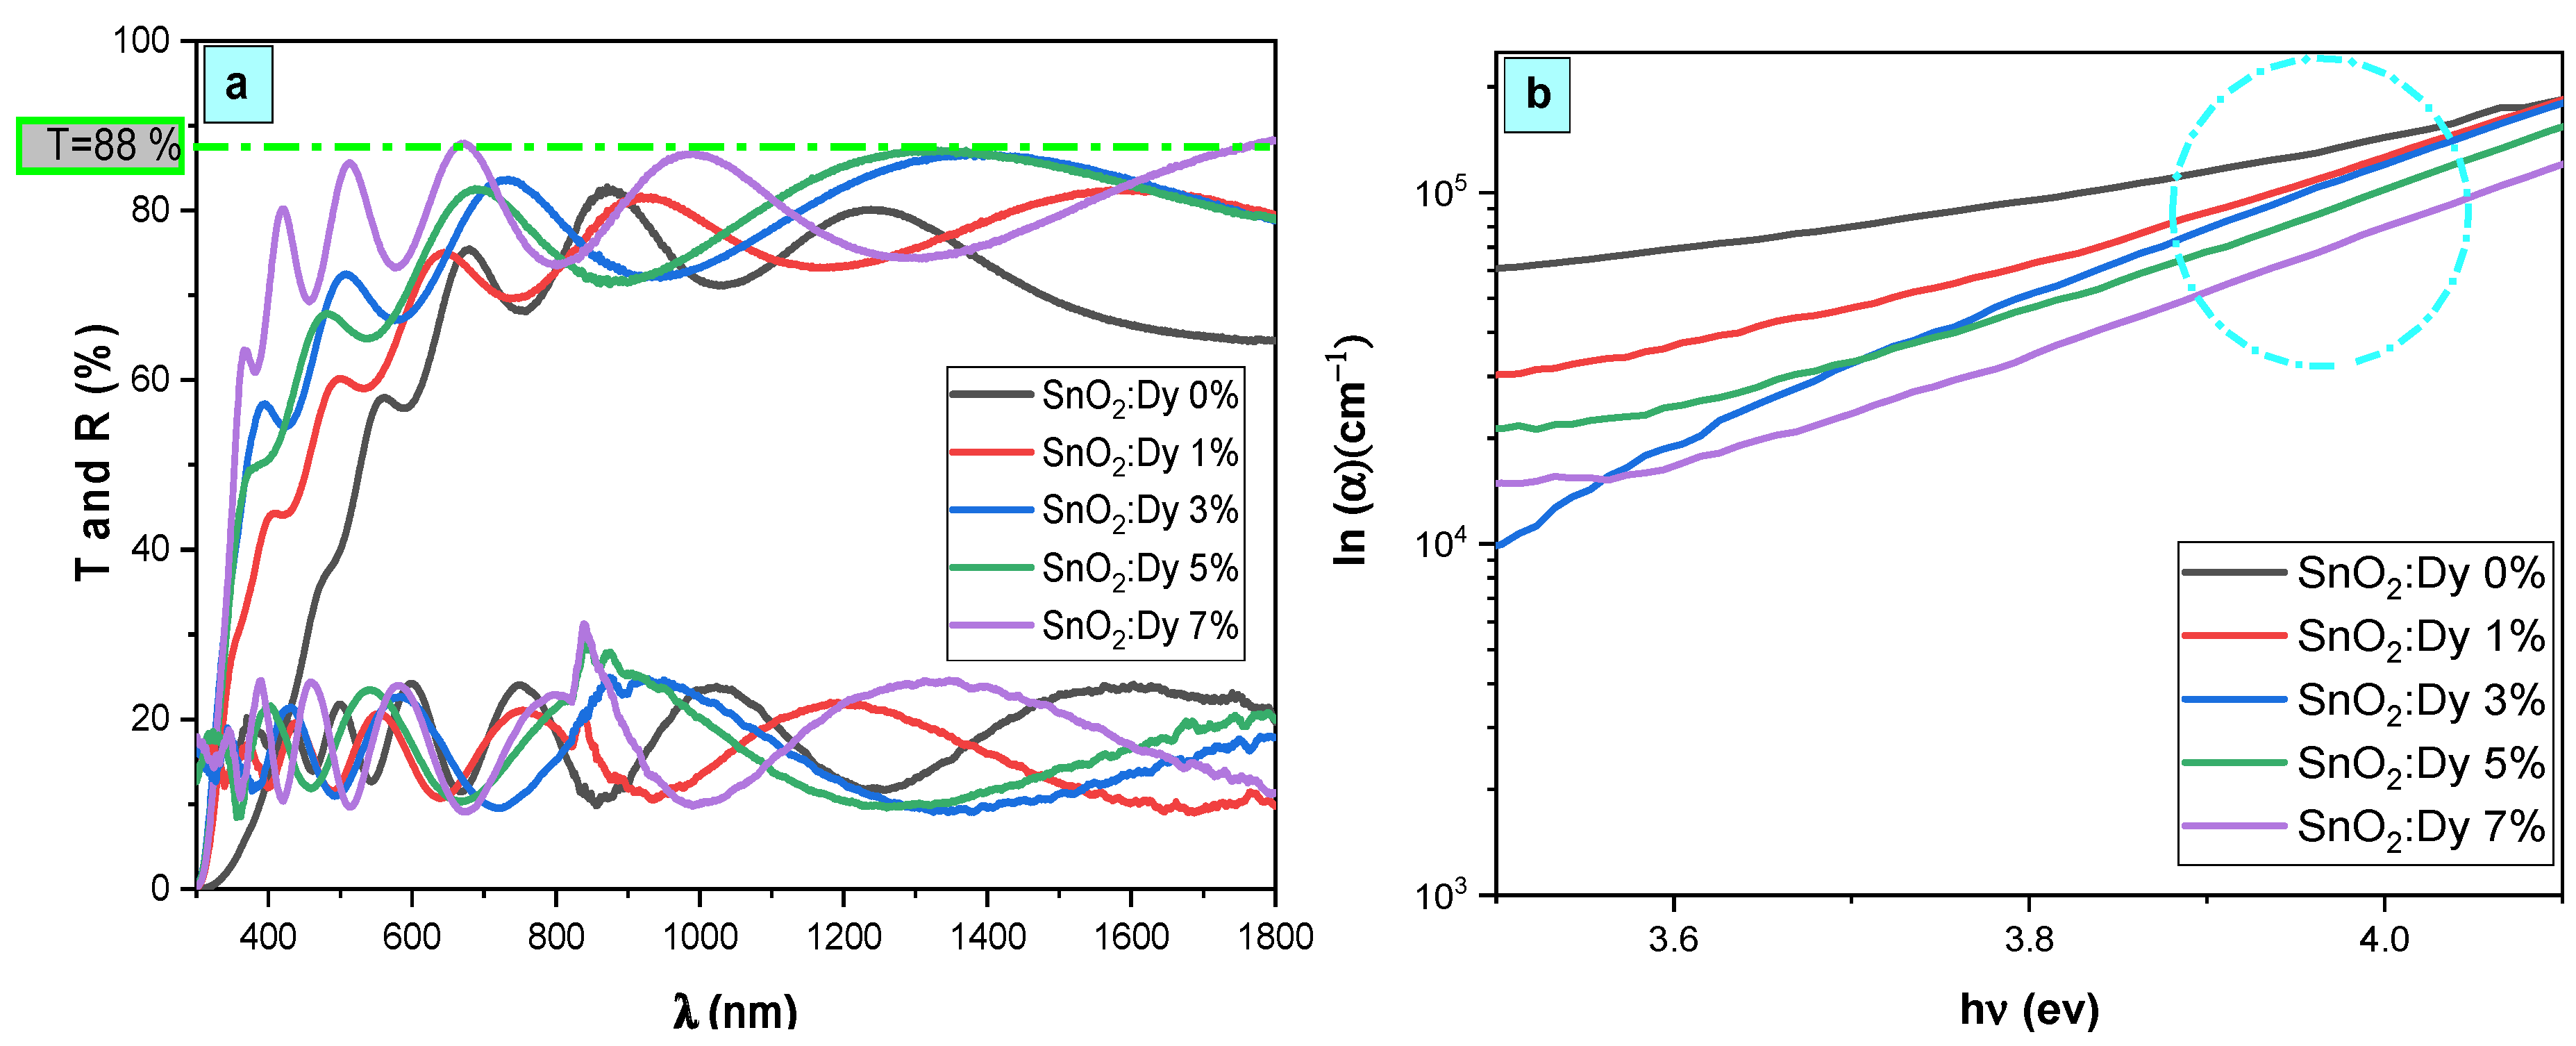
The spectra depicted in Figure 4 are the optical transmittance and reflectance spectra of both undoped and Dy-doped SnO2 thin films spanning the spectral range of 300–1800 nm. The observed fringes, arising from interference effects, serve as evidence of the optical uniformity and excellent surface quality of the deposited films. Across the visible range, all prepared films exhibit notable transparency, exceeding 80% and peaking at 88% for the SnO2:Dy 7% film. Furthermore, a distinct fundamental absorption edge emerges around 360 nm, indicating the suitability of these materials for use as transparent electrodes.
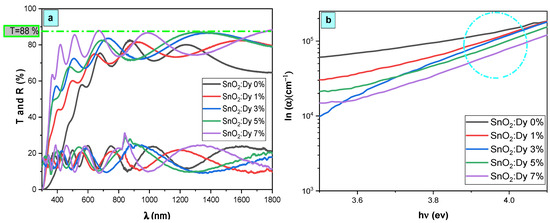
Figure 4.
(a) Transmission, reflection, and (b) absorption coefficient spectra of SnO2:Dy [0, 1, 3, 5, and 7% wt.] thin films.
Ordinarily, the average transmittance of thin films is affected by factors such as the film thickness, surface roughness, crystal defects, and grain size [33]. So, it can be influenced by factors such as the film thickness, surface roughness, grain size, and crystal defects [34]. In this research, the reduction in the transmittance of Dy-doped SnO2 thin films could potentially be linked to heightened structural disorder, particularly crystal imperfections. This is supported by the observed rise in dislocation density (δ) values, as presented in Table 1, upon Dy doping into the SnO2 lattice. Consequently, an increase in crystal imperfections and a decrease in crystallite size likely lead to amplified photon scattering.
The appearance of clearly defined interference fringe patterns within the optical transmittance spectra signifies the development of high-quality SnO2 thin films and their highly homogeneous surface. The thickness of thin films is a crucial factor that significantly affects their properties and performance. The thickness of the SnO2:Dy thin films can be determined utilizing a conventional method used in a previous work based on the positions of the interference reflectance minima and maxima [32]. The thickness of the thin films was determined by analyzing the interference fringes observed in the transmittance spectra, exploiting the periodic variations in light intensity caused by multiple reflections within the film. This method is based on the Heavens model, where the optical interference fringes in the transparent region enables a precise thickness estimation. This model is mainly applied in the study of materials with low absorption. To determine the thickness of the thin film, it is essential to first calculate the refractive index nc. The value of nc for a weakly absorbent thin layer deposited on a transparent substrate is derived from the UV-Vis reflectance spectrum measured in the region where the film exhibits minimal absorption [35]:
Here, ns represents the refractive index of the substrate, and Rmax corresponds to the maximum average reflectance of the layer. The thickness d of the thin film can then be determined using the following equation:
where m is the order of interference
λ2 is the wavelength of the maximum reflectance that succeeds that of λ1 by sweeping the wavelengths in the decreasing direction.
The spectral lines illustrated in Figure 4b display the absorption coefficient values of the synthesized thin films in relation to the photon energy. Introducing dysprosium doping led to a noticeable enhancement in optical absorption across all layers to attend values in the order of 105 in the UV region.
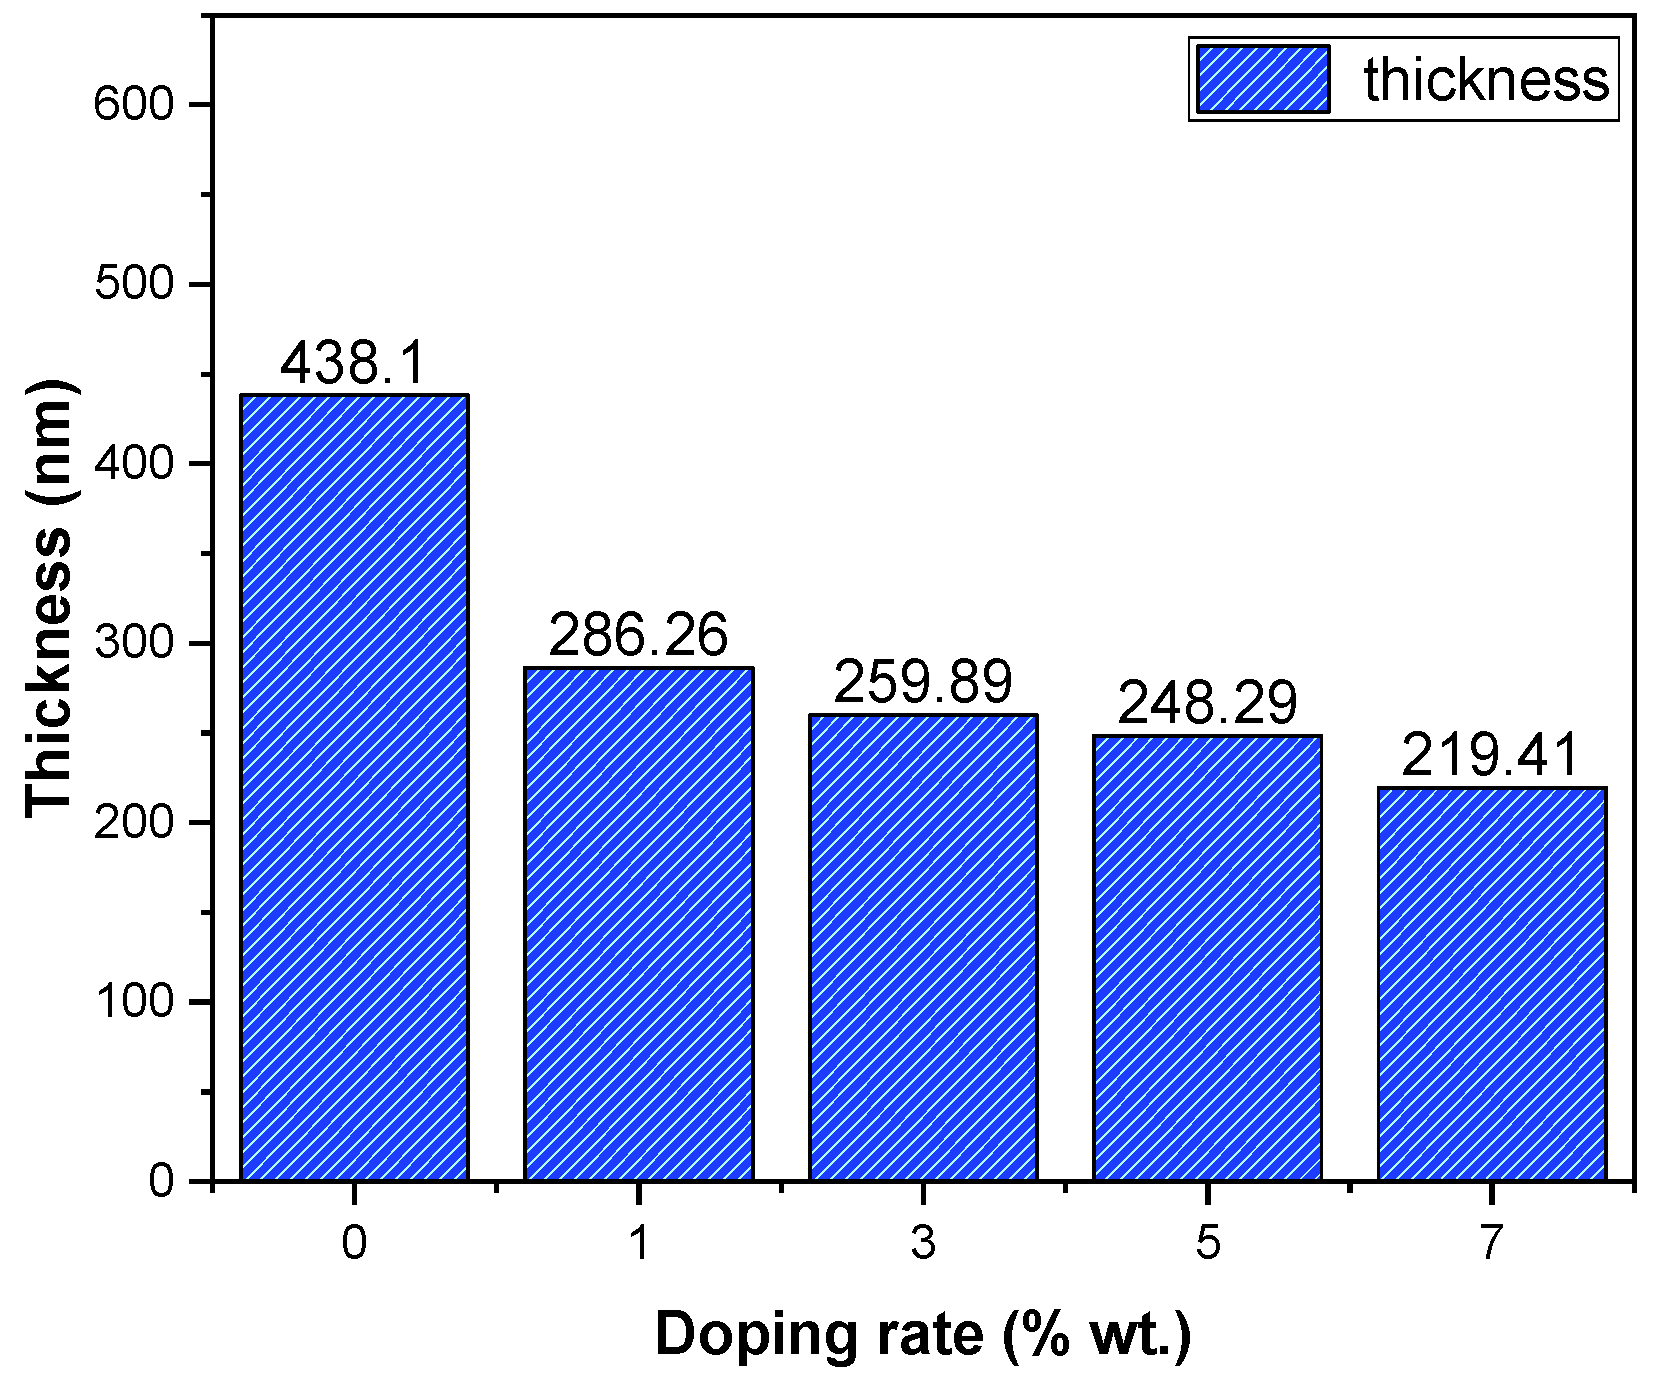
The thickness variation of the SnO2:Dy films is provided in Figure 5, revealing that the incorporation of Dy resulted a decrease in the thin film thickness. This effect is totally related to the technique of deposition, which is a physical technique, and the opposite variation is obtained in a previous work using the chemical technique “spray pyrolysis” [32]. It is evident from the data that the introduction of Dy doping brings about a notable alteration in the thickness of these thin layers. This observation emphasizes the interdependency between the thin film thickness and the incorporation of Dy, indicating a clear correlation between doping and the resulting film thickness. Understanding and managing this correlation is essential for fine-tuning the thin film’s characteristics to meet specific demands across various applications.
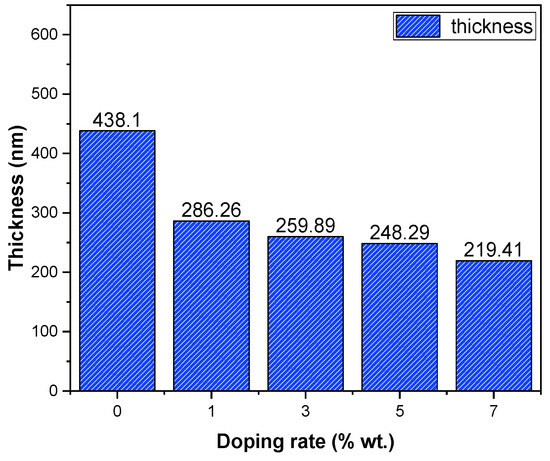
Figure 5.
Thickness variation of SnO2:Dy thin films.
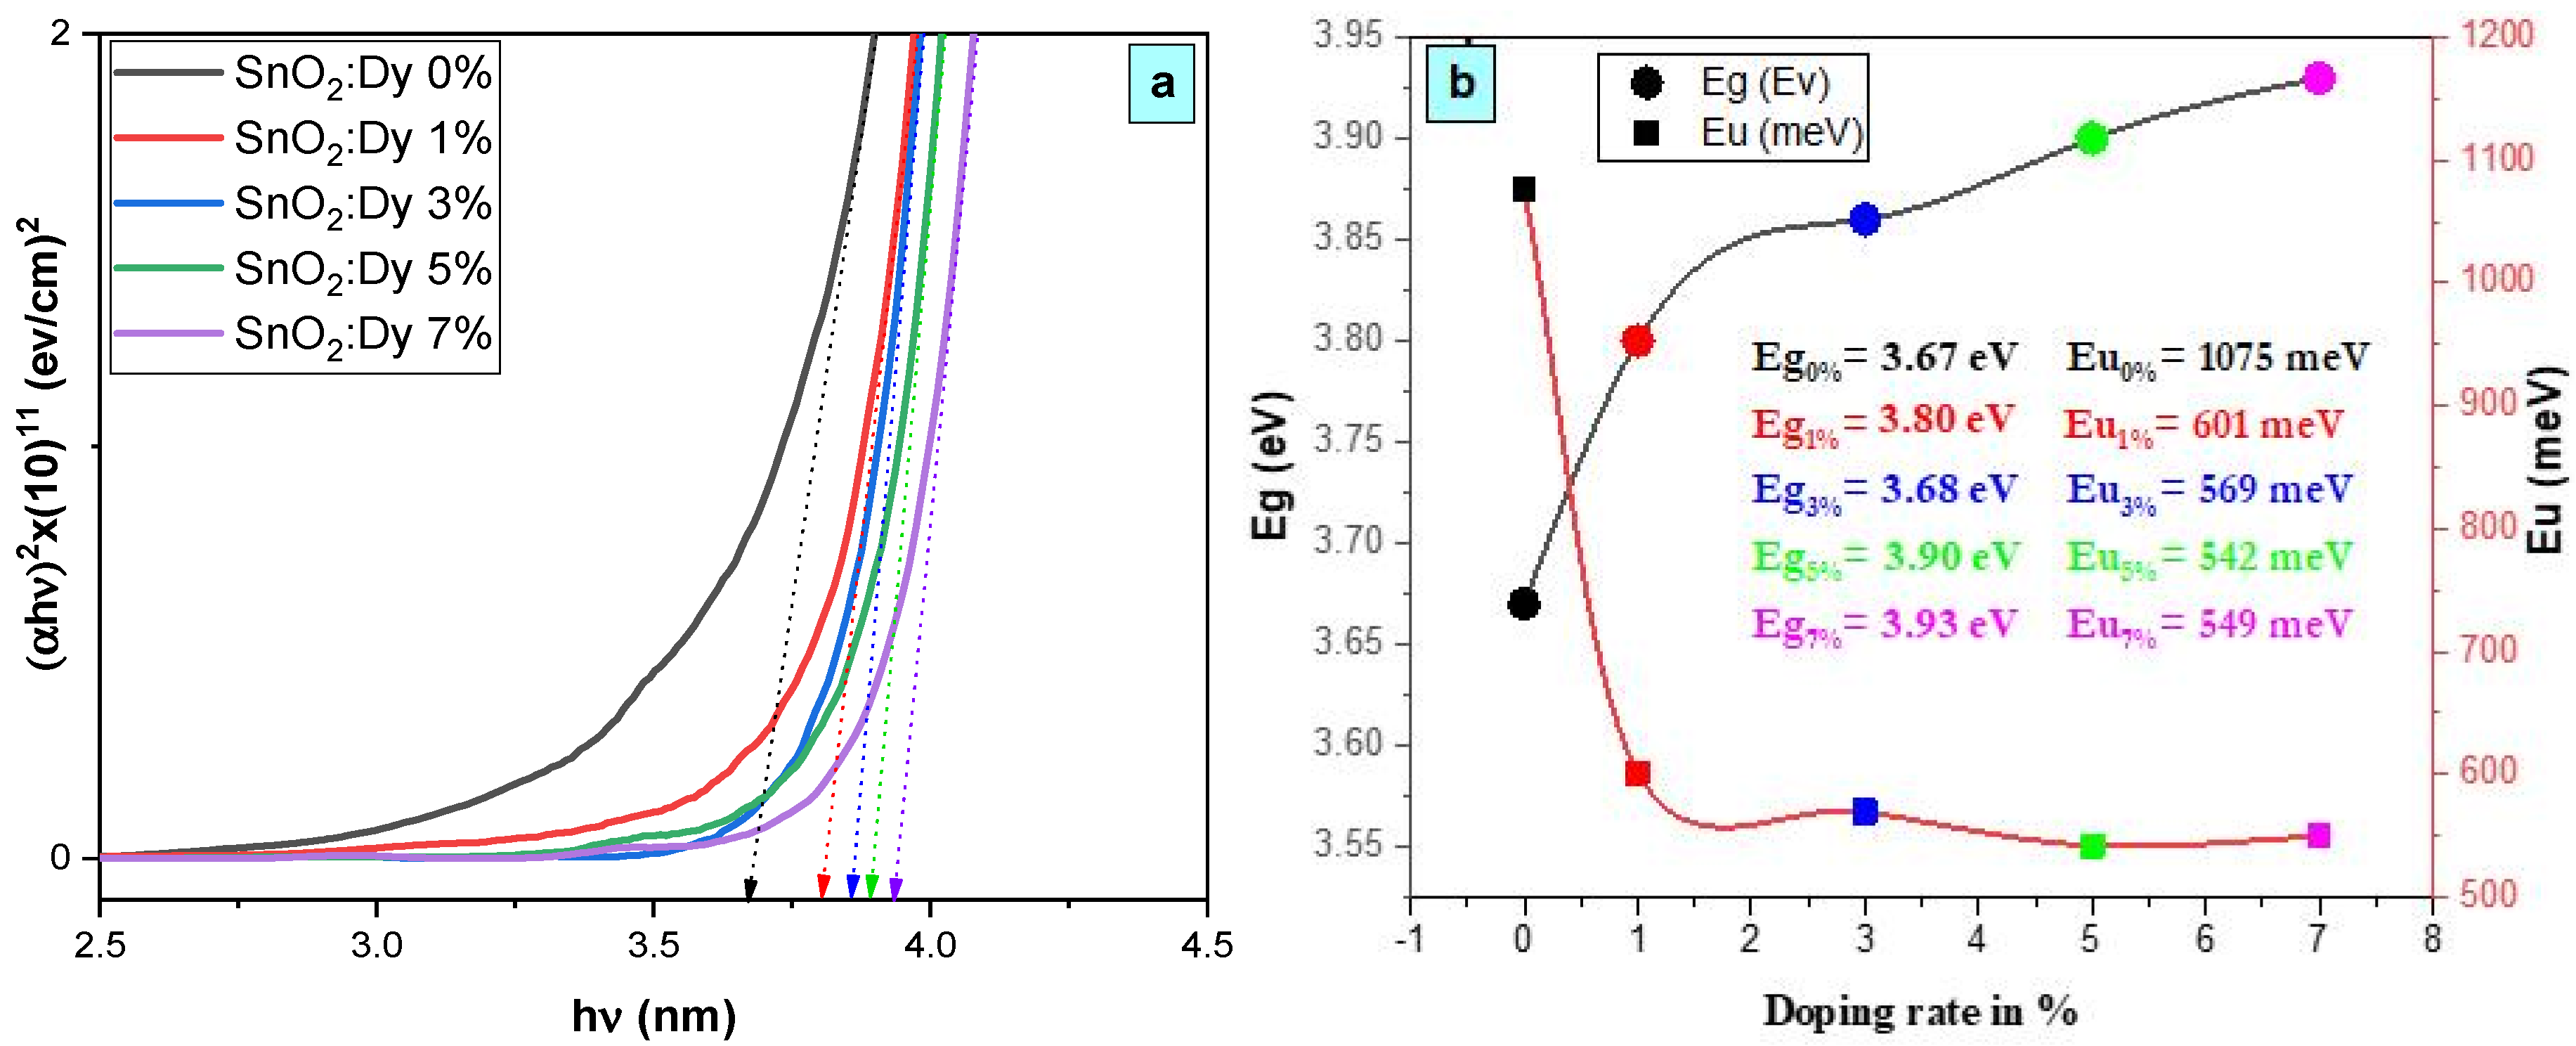
As depicted in Figure 6a, the existence of a linear segment within the band gap versus photon energy (hν) confirms the consistent behavior of our material as a direct gap semiconductor. The increase in band gap energy from 3.67 eV to 3.93 eV, observed with the increase in Dy doping percentage up to 7%, is primarily attributed to the integration of Dy ions into the SnO2 crystal structure.
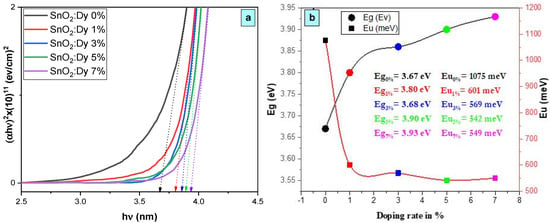
Figure 6.
(a) Plot of (ahν)2 versus (hν) for the undoped and Dy-doped SnO2 thin films, and (b) plots of the variations in Eg and Eu versus the variation in the doping rates of Dy.
By graphing (αhν)2 against (hν) and applying the Tauc model [36] outlined in Equation (7), we could readily determine the gap energy by extending the linear section of the plots of (αhν)2 versus hν to hν = 0. The Tauc model, as elucidated by the subsequent equations, guided this interpretation:
where ν represents the frequency of the incident photon, hν denotes the photon energy, B stands for a constant, α represents the absorption coefficient, and d signifies the thickness of the considered layers. Eg denotes the optical band gap energy, representing the minimum energy required to excite an electron from the valence band to the conduction band, while n denotes a fraction whose values are contingent upon the nature of the transition (1/2, 2, 3/2, and 3). In our scenario, n assumes a value of 1/2, aligning with directly allowed transitions [37].
(αhν) = B(hν − Eg)n
The upward trend in optical gap energy observed with the rising Dy composition, as depicted in Figure 6a, is primarily ascribed to the Burstein–Moss effect [38]. This effect stems from the escalation of the Fermi level, a consequence of the augmented presence of free carriers within degenerate semiconductors. The Dy composition increases with the doping level, which was already proven by the EDX analyses, leading to a higher concentration of free carriers and consequently pushing the Fermi level upward. This phenomenon significantly impacts the band structure, resulting in a discernible increase in the optical gap energy. Understanding the interplay between the composition and optical properties is pivotal for tailoring materials to meet specific requirements in optoelectronic devices and other technological applications, where precise control over the band gap energy is crucial for optimal performance.
In semiconductive materials, structural disorder induces localized states, termed band tails, proximate to the forbidden bands. These band tails are characterized by the Urbach energy, also referred to as the Urbach tail, which manifests as an exponentially rising absorption edge in proximity to the fundamental band gap [39]. These defect states within the optical band region are quantified by the Urbach energy, representing localized defect states within the band gap. These states give rise to absorption tails in the absorption spectra, identified as Urbach tails, with their associated energy termed Urbach energy. The extraction of Urbach energy from absorption spectra is achievable through specified relations, facilitating its quantitative determination:
where alpha is the absorption coefficient; α0 is a constant; E is the incident photon energy, which is equal to hν; and Eu is the Urbach energy. Eu is estimated from the ln alpha versus energy photon plot. The reciprocal of the slope obtained by fitting the linear part of the curves gives the value of the Urbach energy Eu.
It can be seen from Figure 6b that Eu values increase with an increase in the Dy concentration. It is proposed that the alteration of the EU values is attributed to the introduction of structural disorder through doping [40], which is proven by the increase in the intensity of the XRD peaks.
The decrease in Urbach energy values as the Dy doping concentration increases implies that the band gap structure of the thin films doped with Dy exhibits a higher level of defects compared to earlier levels.
3.3. Morphological Properties
3.3.1. AFM Characterization
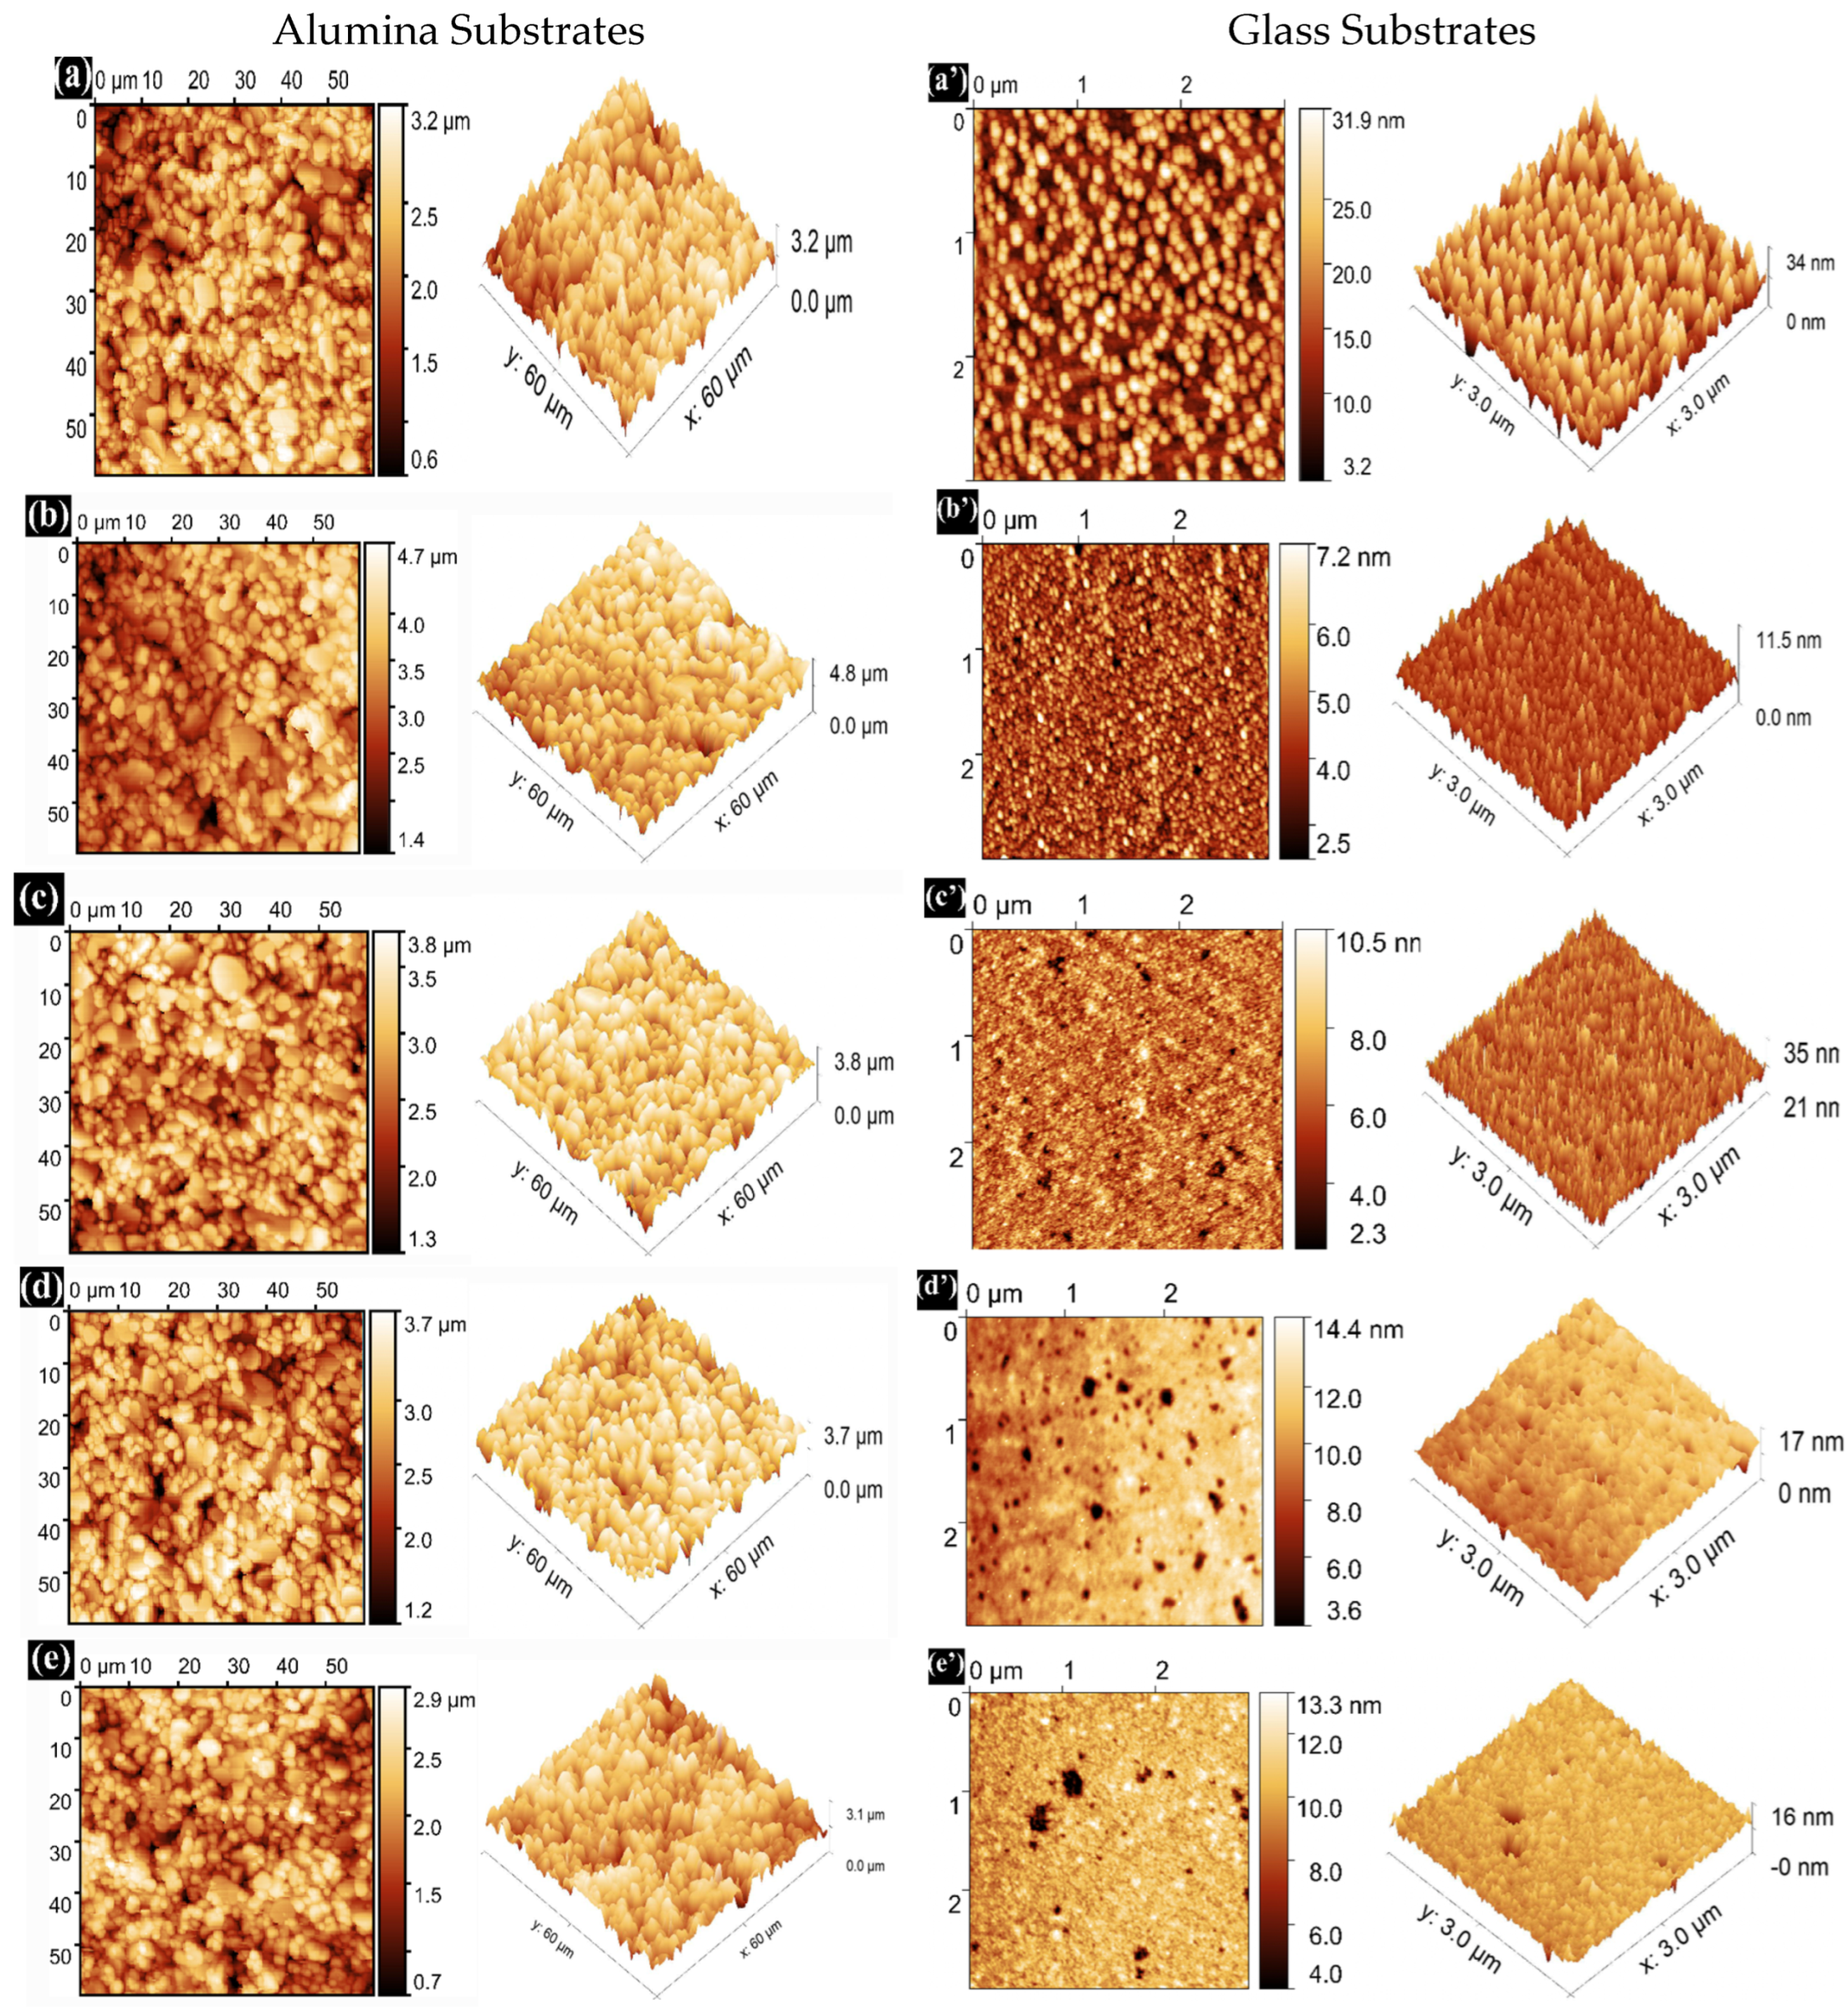
The surface morphology and roughness are critical factors influencing the optical and electrical characteristics of transparent conducting oxide thin films. Figure 7 illustrates AFM micrographs of pure SnO2 and Dy-doped (1, 3, 5, and 7 wt.%) SnO2 thin films across a scanning area of 3 μm × 3 μm. It is evident that the Dy concentration significantly influences the microstructure of the films. The grains in the pure SnO2 film, as seen in Figure 7a, appear less dense. However, in Dy-doped SnO2 films, the grains, as depicted in Figure 7b–d, are more and densely packed. All deposited films exhibit nearly small spherical grain shapes, with the grain size decreasing with increasing Dy doping in SnO2, consistent with the XRD results. Table 3 presents the measured roughness values for all films. The addition of Dy effectively hinders the excessive growth of SnO2 grains [39]. The average surface roughness (RMS) is crucial in the fabrication of optoelectronic devices. The RMS is determined from AFM scans over a film area of 3 μm × 3 μm for the glass substrates and 60 μm × 60 μm for the alumina substrates.
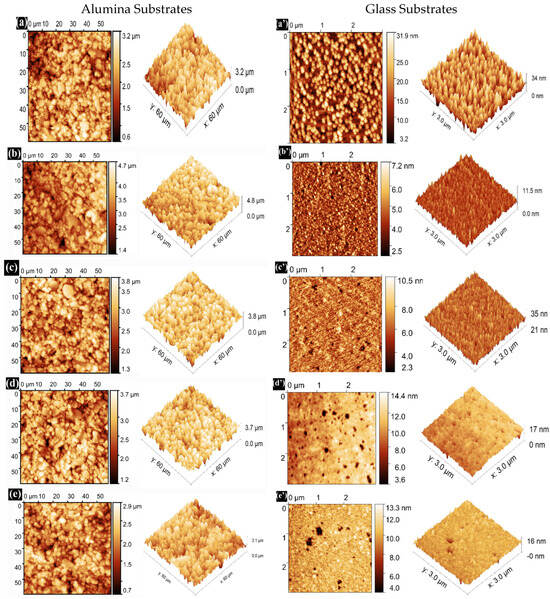
Figure 7.
AFM 2D and 3D images of (a) pure SnO2, (b) SnO2:Dy 1%, (c) SnO2:Dy 3%, (d) SnO2:Dy 5%, (e) SnO2:Dy 7%, (a’) pure SnO2, (b’) SnO2:Dy 1%, (c’) SnO2:Dy 3%, (d’) SnO2:Dy 5%, and (e’) SnO2:Dy 7% thin films deposited on alumina and glass substrates, respectively.

Table 3.
RMS values of undoped and Dy-doped SnO2 thin films deposited on alumina and glass substrates.
Figure 7 presents the AFM images of SnO2:Dy thin films deposited on two types of substrates (alumina and glass) with a uniform surface roughness.
Notably, it is found that the average surface roughness (RMS) decreased slightly with an increasing Dy content for both alumina and glass substrates, with significantly higher values of roughness for the thin films deposited on alumina that is normally attributed to the huge size of the alumina grains; the calculated values are listed in Table 3. Furthermore, no cracks were observed in any of the films, indicating that all the films were homogeneously grown on glass and alumina substrates using the sputtering technique.
3.3.2. FESEM Characterization
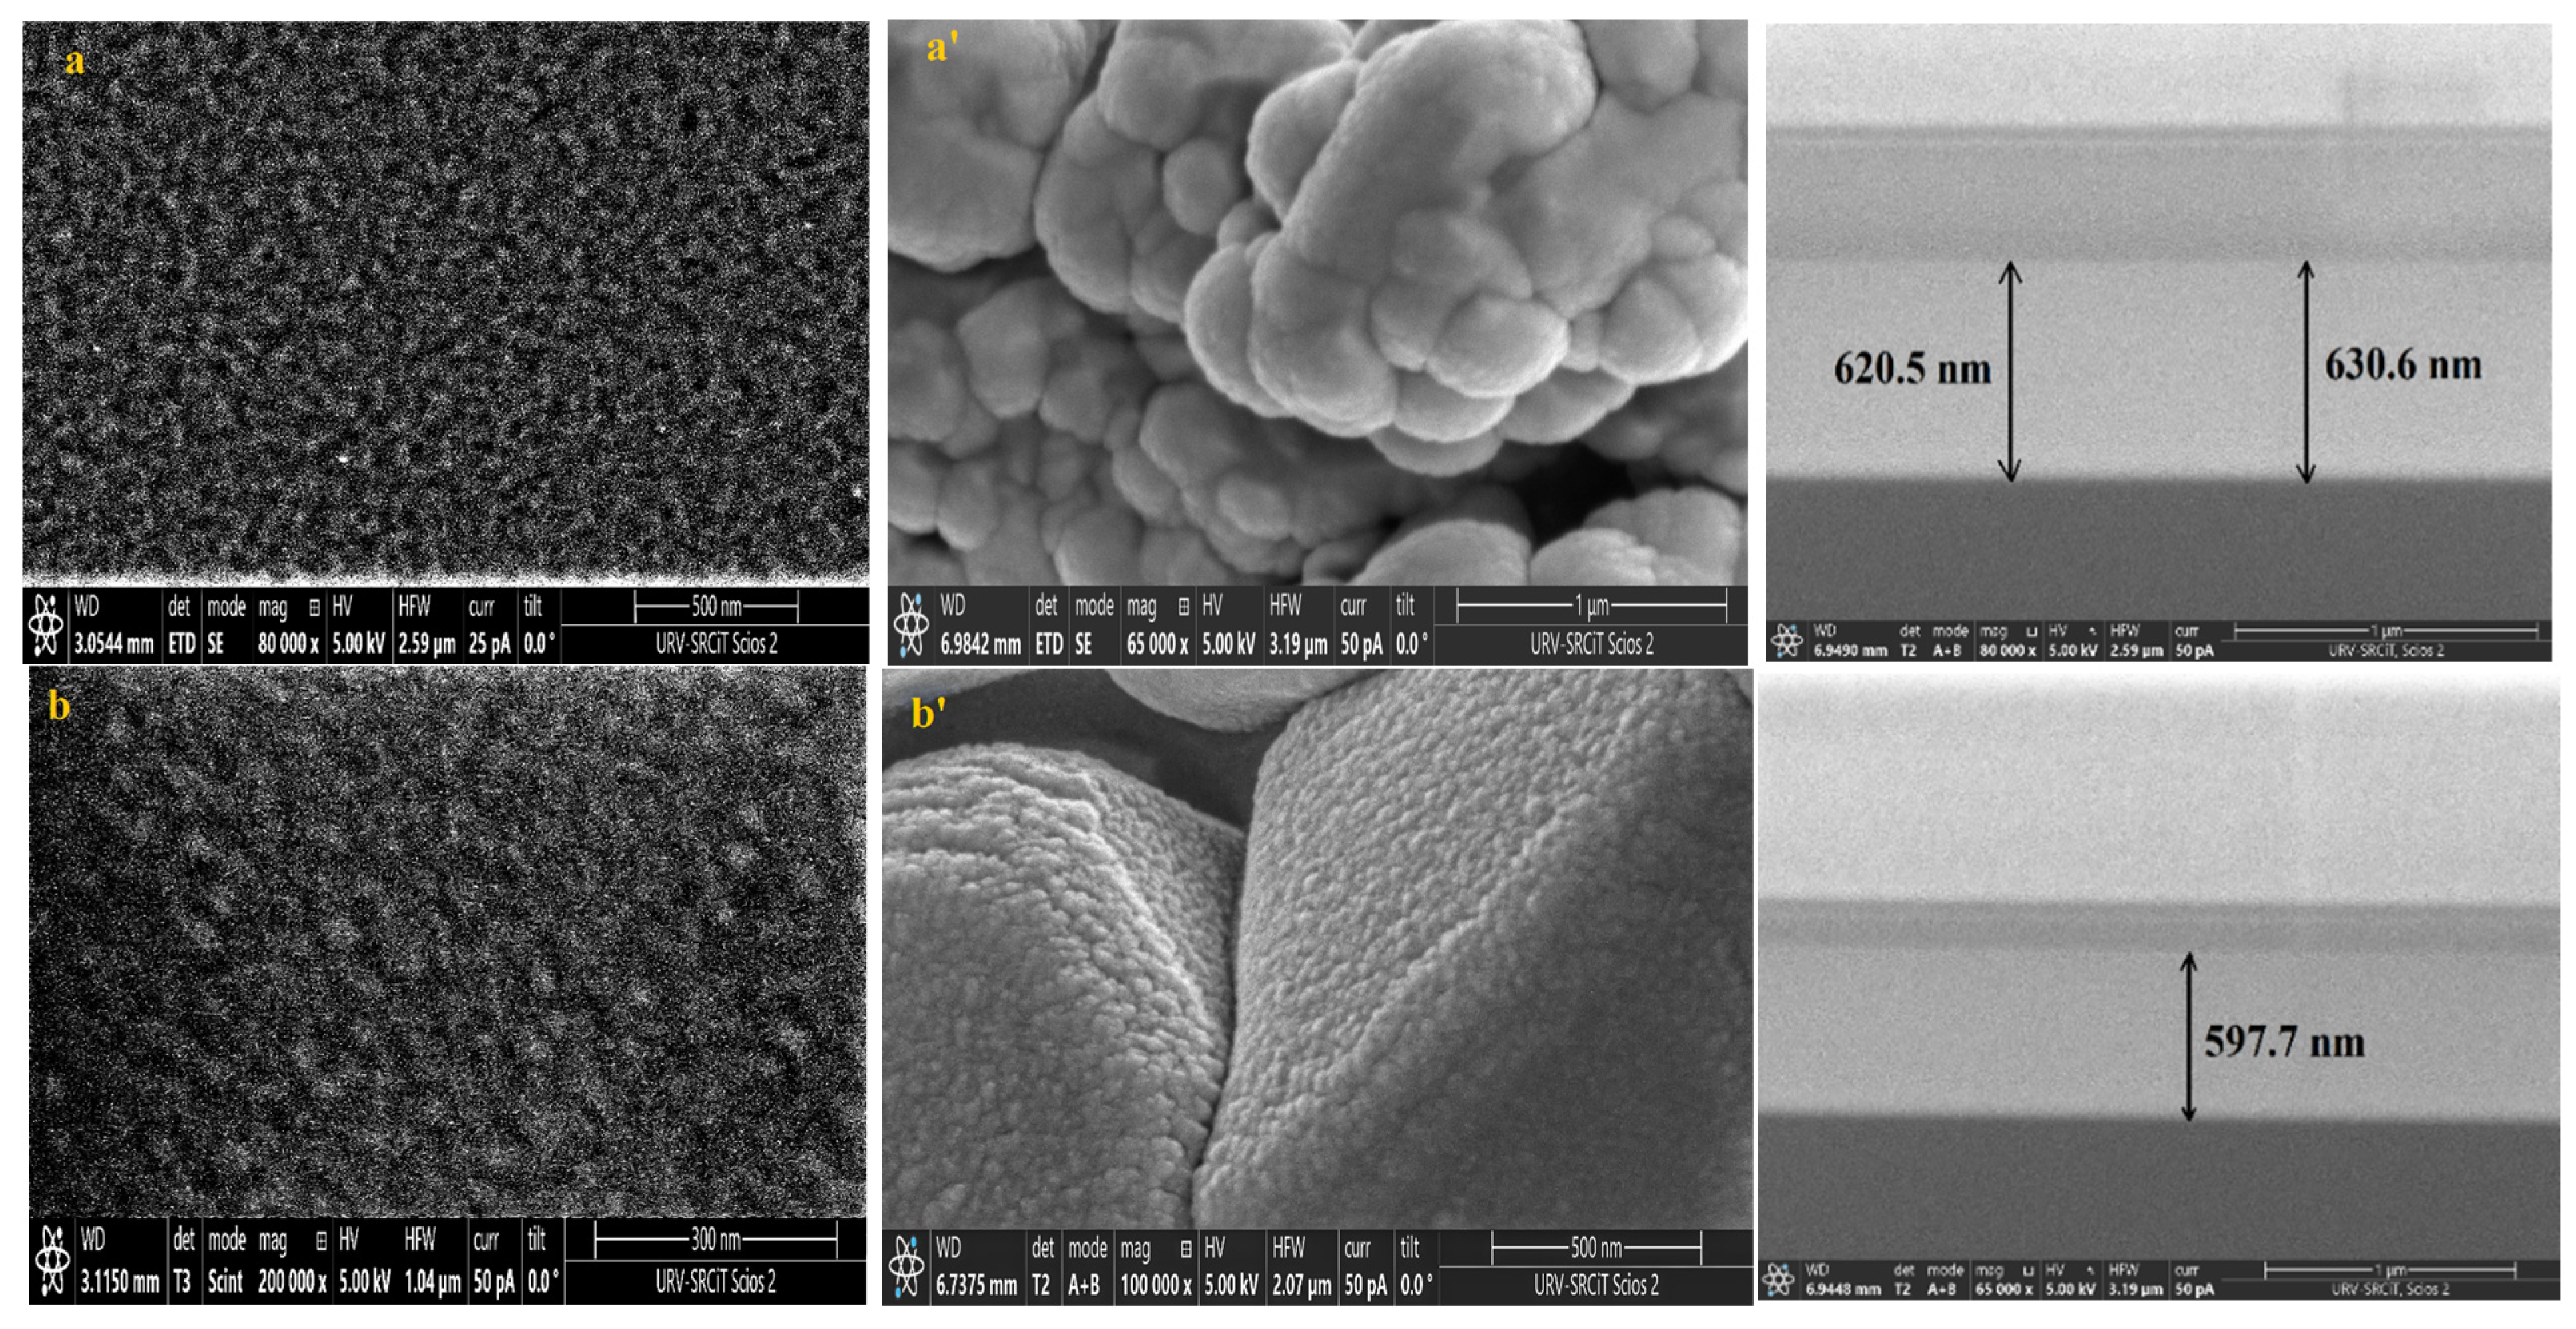
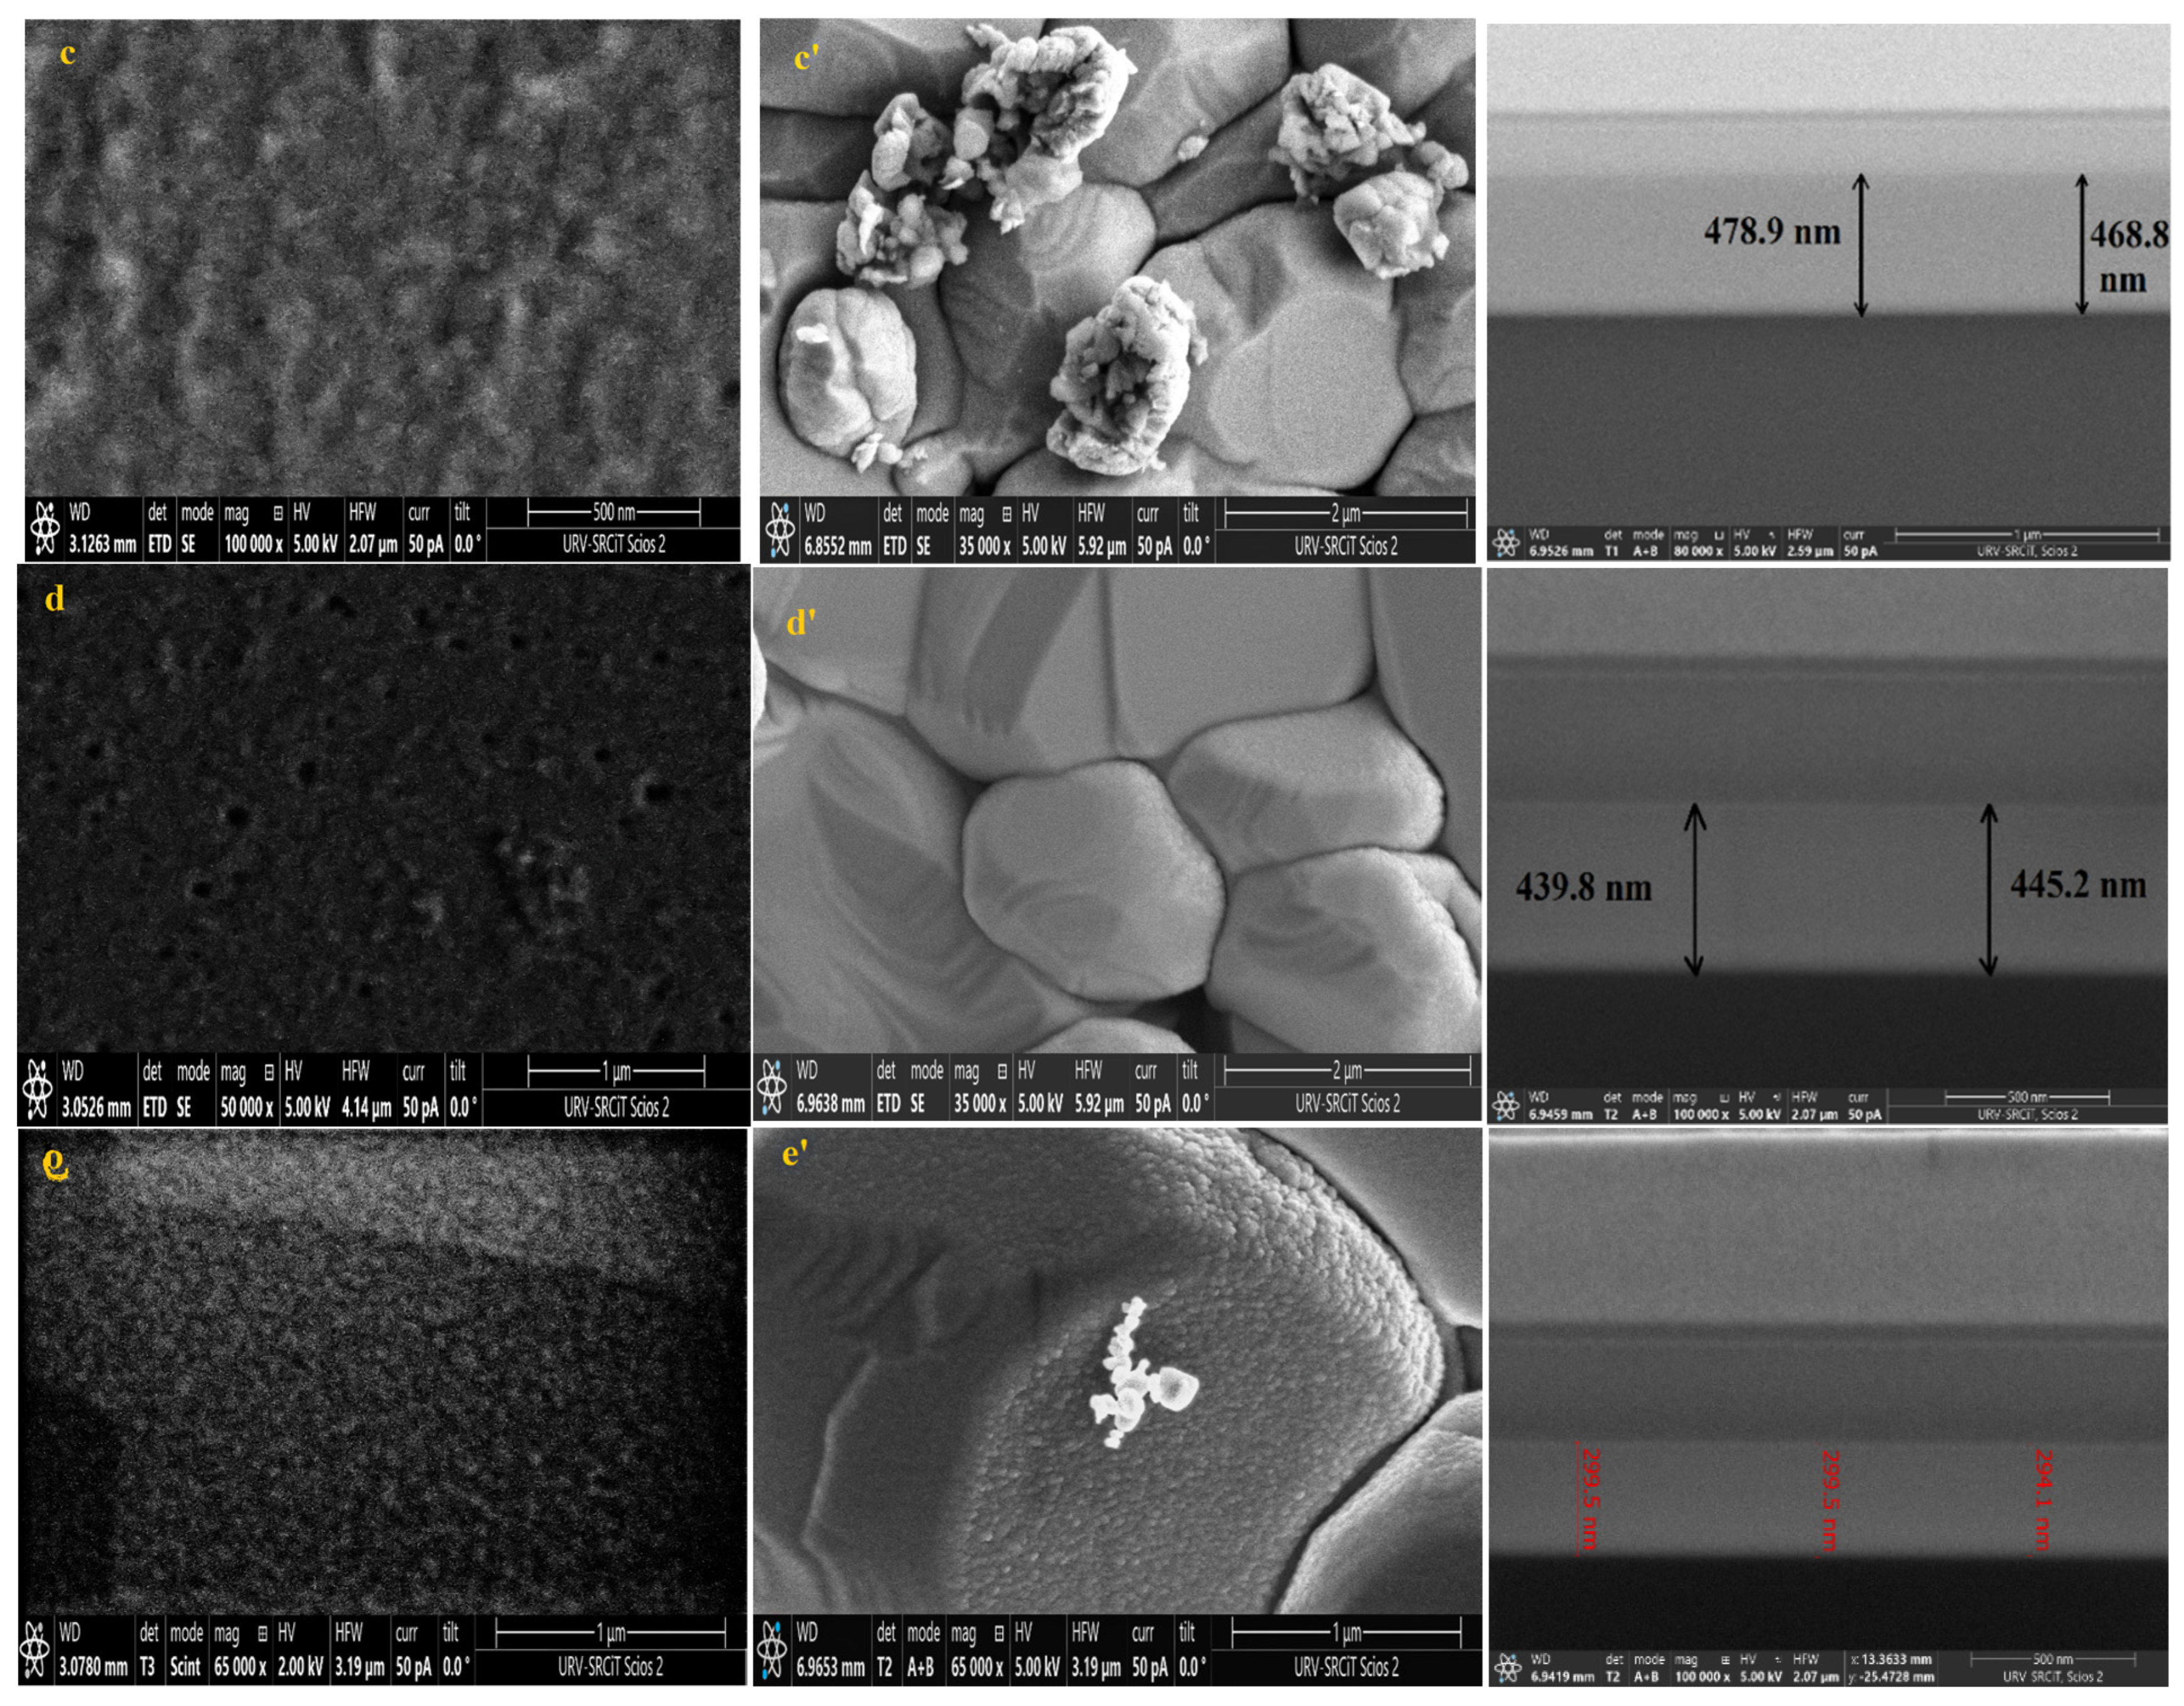
Knowing that the sensing layer surface morphology significantly impacts the performance of the sensor, FESEM was used to analyze the surface morphology of pure and Dy-doped SnO2 thin films deposited on alumina and glass substrates. The morphological modifications in the SnO2 thin film samples at various doping rates (0, 1, 3, 5, and 7% wt.) deposited on alumina and glass substrates are shown in Figure 8. These figures suggest that for SnO2 films on the glass substrate, the grains seemed to be tightly packed. Numerous microscopic grains multiplied and collected to create a grainy surface without any voids. However, for the films deposited on the alumina substrate, the surface of the films was covered with numerous microaggregates that together created a granular and dense surface covering the big alumina particles. In addition, small grains occurred between the aggregates to fill in the voids and condense the surface of the thin layer, indicating that the layer was well homogenized, which was also supported by the AFM data. The FESEM micrographs show that the aggregation of these particles was evenly distributed for all layers. As a result, charge carrier dispersion was reduced, increasing the electrical conductivity of films. Furthermore, the optical and structural results confirmed this enhancement.
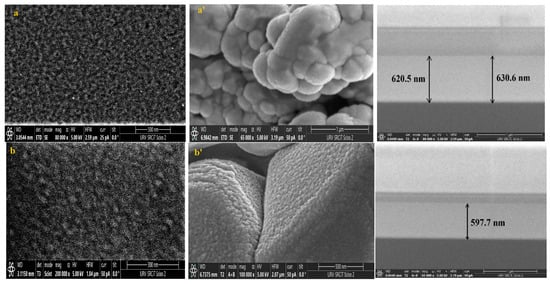
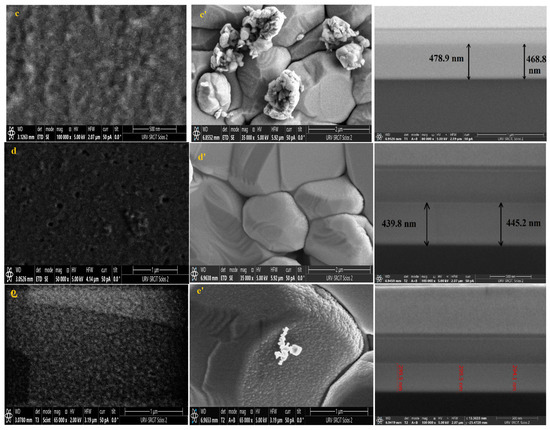
Figure 8.
FESEM, Cross-section images of (a) pure SnO2, (b) SnO2:Dy 1%, (c) SnO2:Dy 3%, (d) SnO2:Dy 5%, and (e) SnO2:Dy 7% thin film samples deposited on glass and (a’) pure SnO2, (b’) SnO2:Dy 1%, (c’) SnO2:Dy 3%, (d’) SnO2:Dy 5%, and (e’) SnO2:Dy 7% thin films deposited on the alumina substrate.
In addition, doped films were less closely-packed compared to the pure films. This indicated that the Sn4+ substitution did not cause significant lattice dislocation.
The thin film thickness is determined by measuring the width of the side surface in the cross-sectional view of a scanning electron microscopy (FESEM) image. Figure 6 presents the FESEM cross-section images for pure and doped SnO2 thin films for samples deposited on glass samples. Using this technique, we determined that the average thicknesses of the different SnO2 layers were 620, 579, 470, 442, 378, and 299 nm for the 0, 1, 3, 5, and 7% Dy-doped thin films, respectively. In addition, the images allowed us to clearly see the effect of Dy, as the thickness value decreased as the doping percentage increased. These results confirm those calculated by means of the interference fringes.
3.4. Elemental Characterization
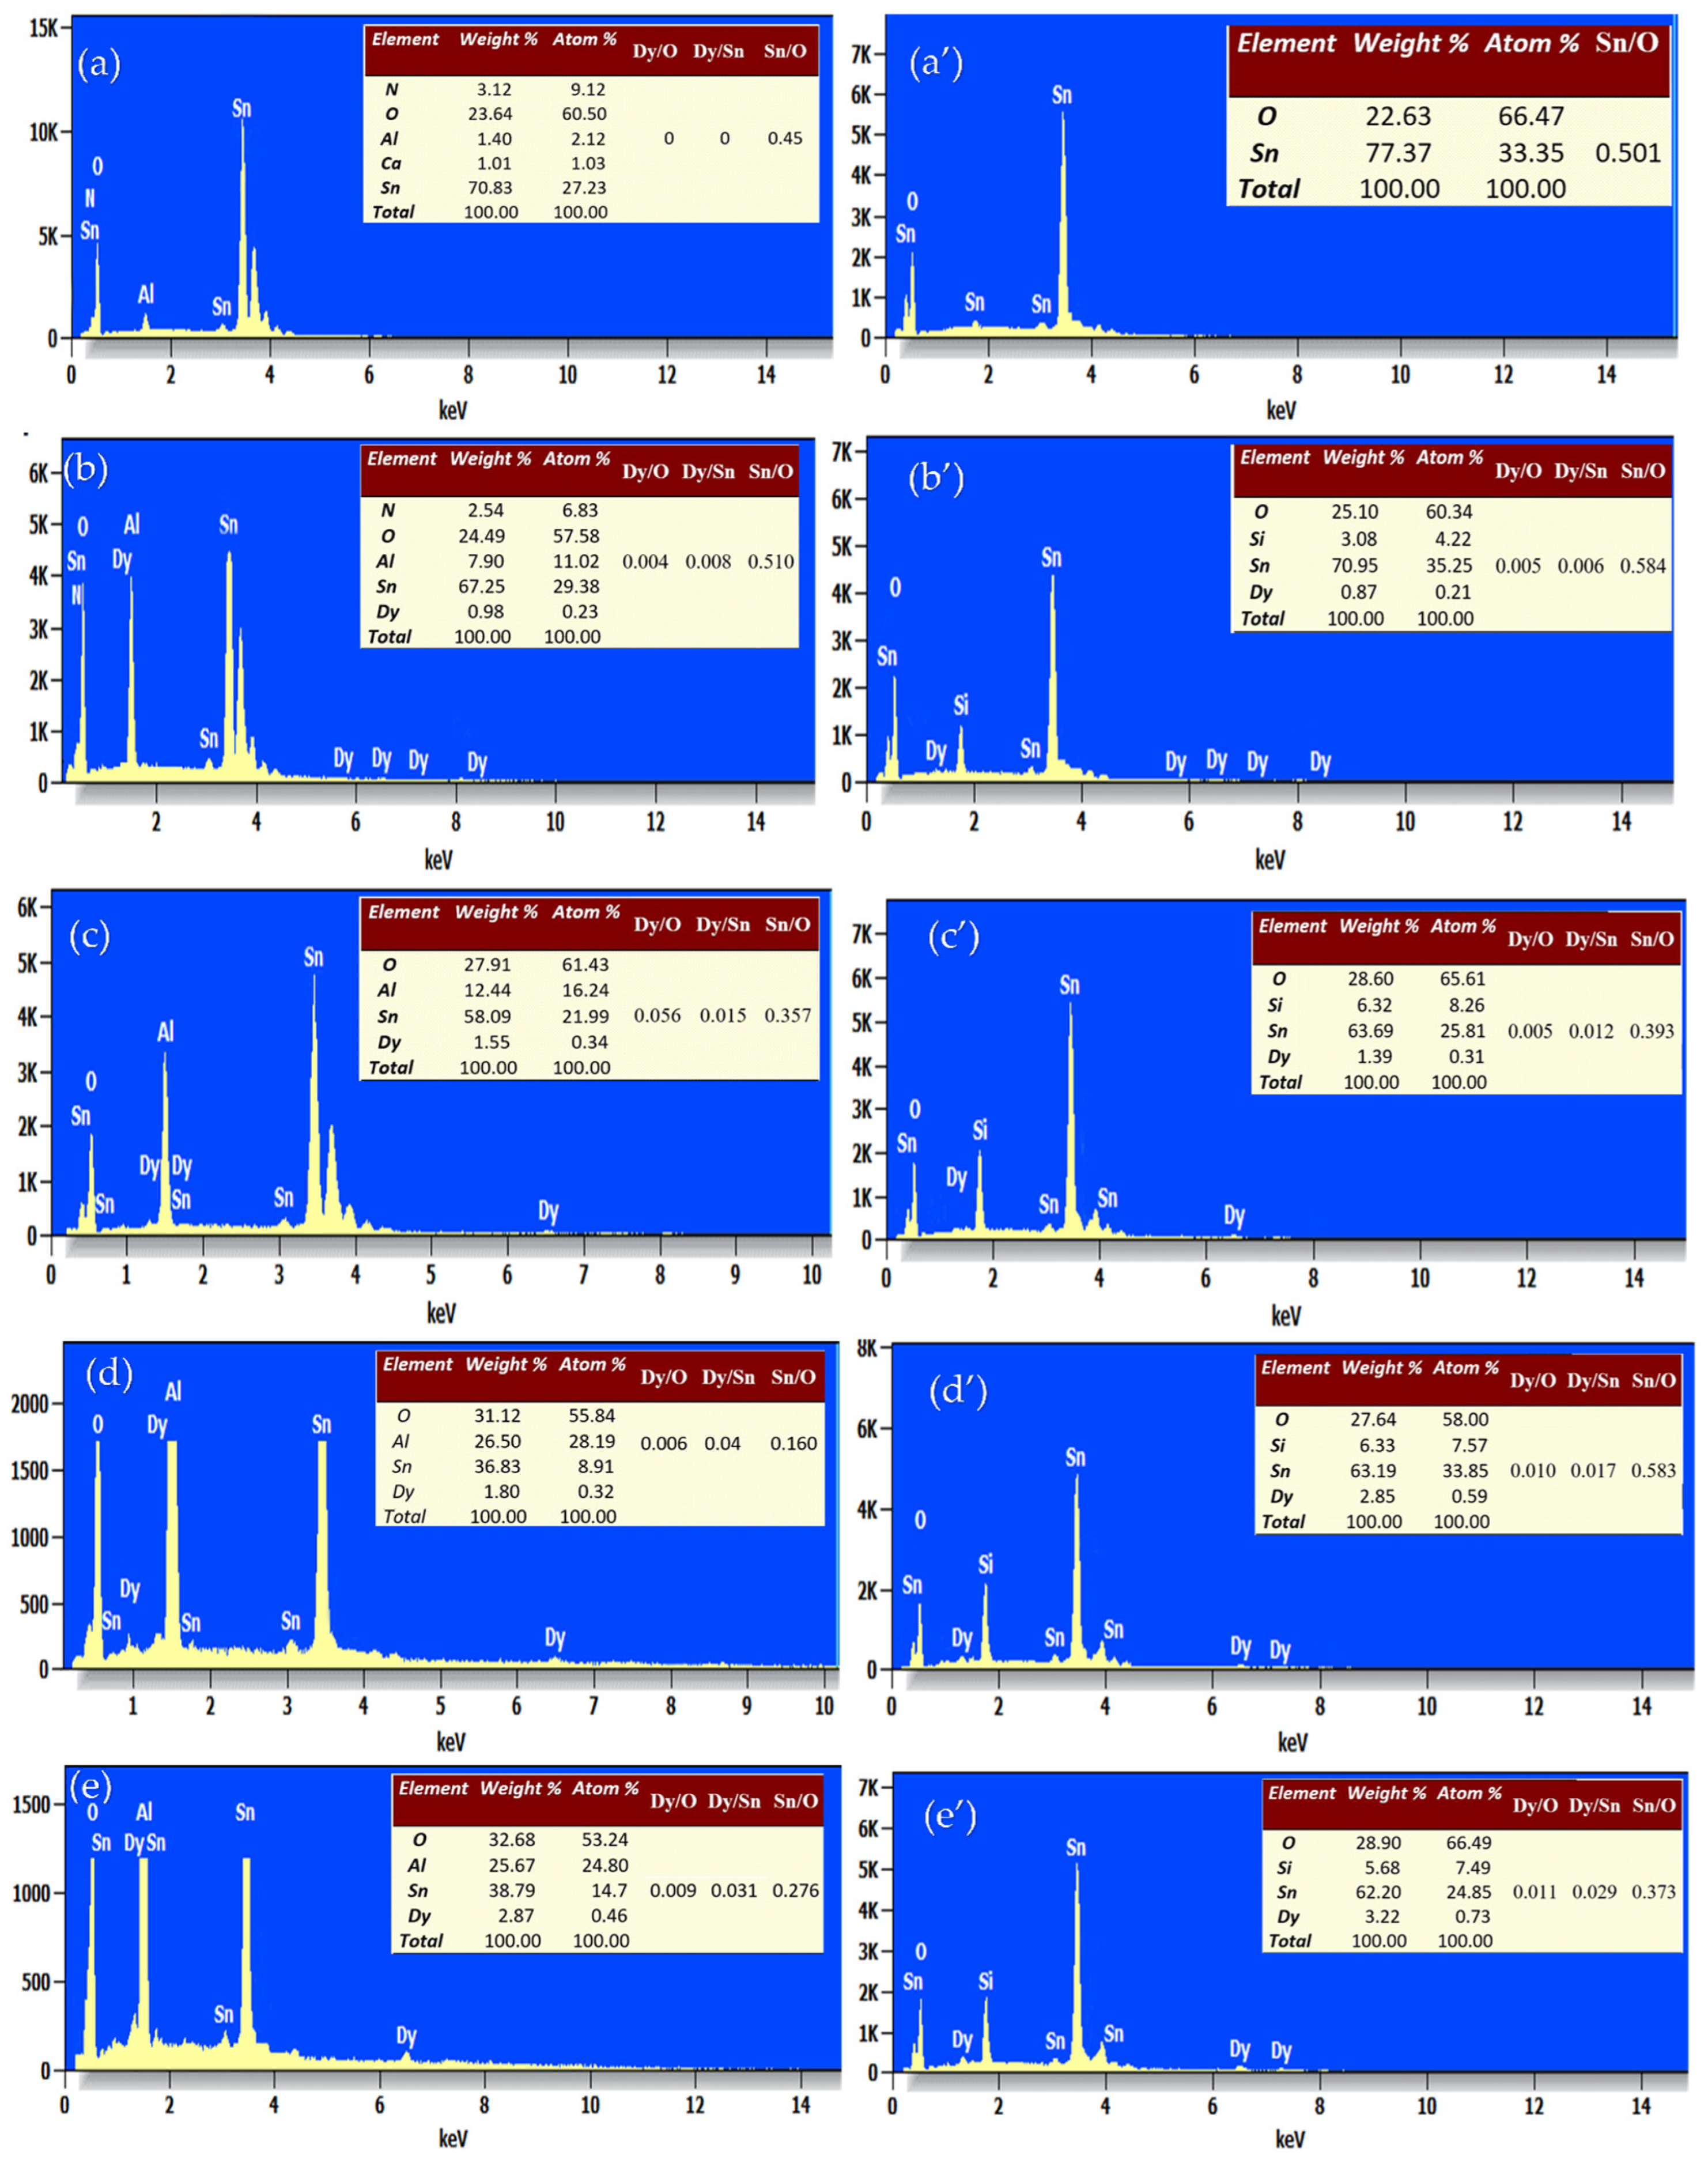
Energy-dispersive X-ray spectroscopy (EDS) was used to determine the chemical composition of the pure and Dy-doped SnO2 thin films. EDXS measurements were employed to explore the elemental compositions of the Dy-doped SnO2 thin films, each containing varying amounts of Dy. The EDXS spectrum in Figure 9 illustrates three distinct peaks corresponding to Sn and O in the undoped film.
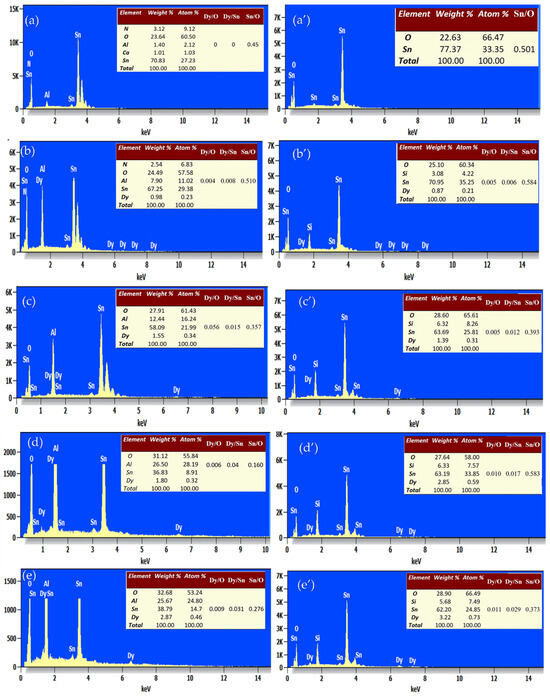
Figure 9.
EDS spectral analysis of the SnO2:Dy layers deposited by varying the atomic ratio of Dy. (a) SnO2:Dy (0 wt.%), (b) SnO2:Dy (1 wt.%), (c) SnO2:Dy (3 wt.%), (d) SnO2:Dy (5 wt.%), and (e) SnO2:Dy (7 wt.%) on the alumina substrate. (a’) SnO2:Dy (0 wt.%), (b’) SnO2:Dy (1 wt.%), (c’) SnO2:Dy (3 wt.%), (d’) SnO2:Dy (5 wt.%), and (e’) SnO2:Dy (7 wt.%) on the glass substrate, Atomic percentages of the different elements present in each sample are shown.
Conversely, the spectra of doped samples exhibit additional peaks attributable to Dy, indicating its incorporation into the SnO2 lattice. Particularly noteworthy is the increasing intensity of the Dy peak with higher Dy concentrations in the SnO2:Dy system.
An analysis of these data indicates the presence of the Dy, Sn, and O elements, aligning with the atomic ratios derived from the initial precursors for their respective samples. Additionally, silicon (Si) and aluminum (Al) are detected in both thin films deposited on glass and alumina substrates, respectively.
The quantitative analysis of atomic weight percentages, as provided in accompanying tables, reveals values closely aligned with the nominal stoichiometry, falling within the experimental error range. This consistency suggests the successful integration of Dy ions into the SnO2 lattice, effectively replacing Sn ions. Moreover, it is evident that the quantities of Dy and O increase with higher Dy doping, while the Sn content decreases, further confirming the substitution of Sn by Dy3+ ions.
It is been noted that the oxygen percentage is higher in the alumina substrate, since alumina (Al2O3) is an oxide and has a high affinity for oxygen; it creates a favorable chemical environment that encourages further incorporation of oxygen into deposited films. Glass, on the other hand, especially silicon, has a lower reactivity with oxygen, which means that films on glass incorporate less oxygen. Moreover, the increased surface energy of alumina facilitates oxygen atom adsorption during deposition, raising the film’s oxygen content. Alumina is subject to the influence of substrate-induced effects, whereby higher initial adhesion and bonding sites promote greater oxygen incorporation. Additionally, if the deposited material aligns well with the lattice of alumina, it may result in increased epitaxial growth, which in turn affects oxygen incorporation.
The tables in the EDS panel analysis reveal that the Sn/O ratio decreases as the Dy content increases, indicating that dysprosium incorporation alters the stoichiometry of SnO2, possibly by substituting Sn or affecting oxygen interactions. Simultaneously, the Dy/Sn and Dy/O ratios show a clear increasing trend, confirming the successful doping of Dy into the structure. This suggests that higher Dy concentrations influence the elemental distribution, potentially impacting the material’s structural and electronic properties.
3.5. Electrical Properties
Table 4 summarizes the details of the electrical properties for the different films studied. The Hall effect studies were performed for the thin films on glass and alumina substrates. From Table 4, we can conclude that an increase in the Dy concentration increases the resistivity values from 2.1 × 10⁻² to 2.8 × 101 Ω cm for the samples deposited on glass and from 2.4 × 10⁻³ to 1.81 × 10⁻¹ Ω cm for the samples on the alumina substrate.

Table 4.
Electrical properties of SnO2:Dy thin films deposited on glass and alumina substrates.
The resistivity of the SnO2 thin films increases with higher dysprosium loading, which is consistent with the observed trend in the measurements. While oxygen vacancies introduced by doping can act as donors, increasing the number of free carriers and potentially enhancing conductivity, the dominant effects of rare earth metal inclusion must also be considered. Dysprosium doping disturbs the crystal lattice of SnO2, leading to increased scattering of charge carriers, such as electrons or holes. This scattering reduces the mobility of charge carriers, thereby increasing the resistivity of the films. Additionally, the rare earth elements may influence the band structure of SnO2, further influencing its conductivity. This is proven by the optical results obtained, confirming the increase in the band gap with the increase in Dy doping levels. Although certain mechanisms, such as the generation of donor defects, could increase the resistivity, the dominant influences of carrier scattering and reduced mobility result in the overall increase in resistivity observed in the doped films [41,42].
4. Gas Sensing Measurements
4.1. NO2 Gas Detection: Analysis and Responses
For the gas sensing tests, only the samples on alumina substrates were used due to their structures, which are adapted toward the measurement of the film resistance and possibility to set their operating temperature. Figure 10 summarizes the structure of such sensing devices.

Figure 10.
Schematic drawing of the R.F.-sputtered SnO2:Dy thin film sensor structure deposited on alumina substrates.
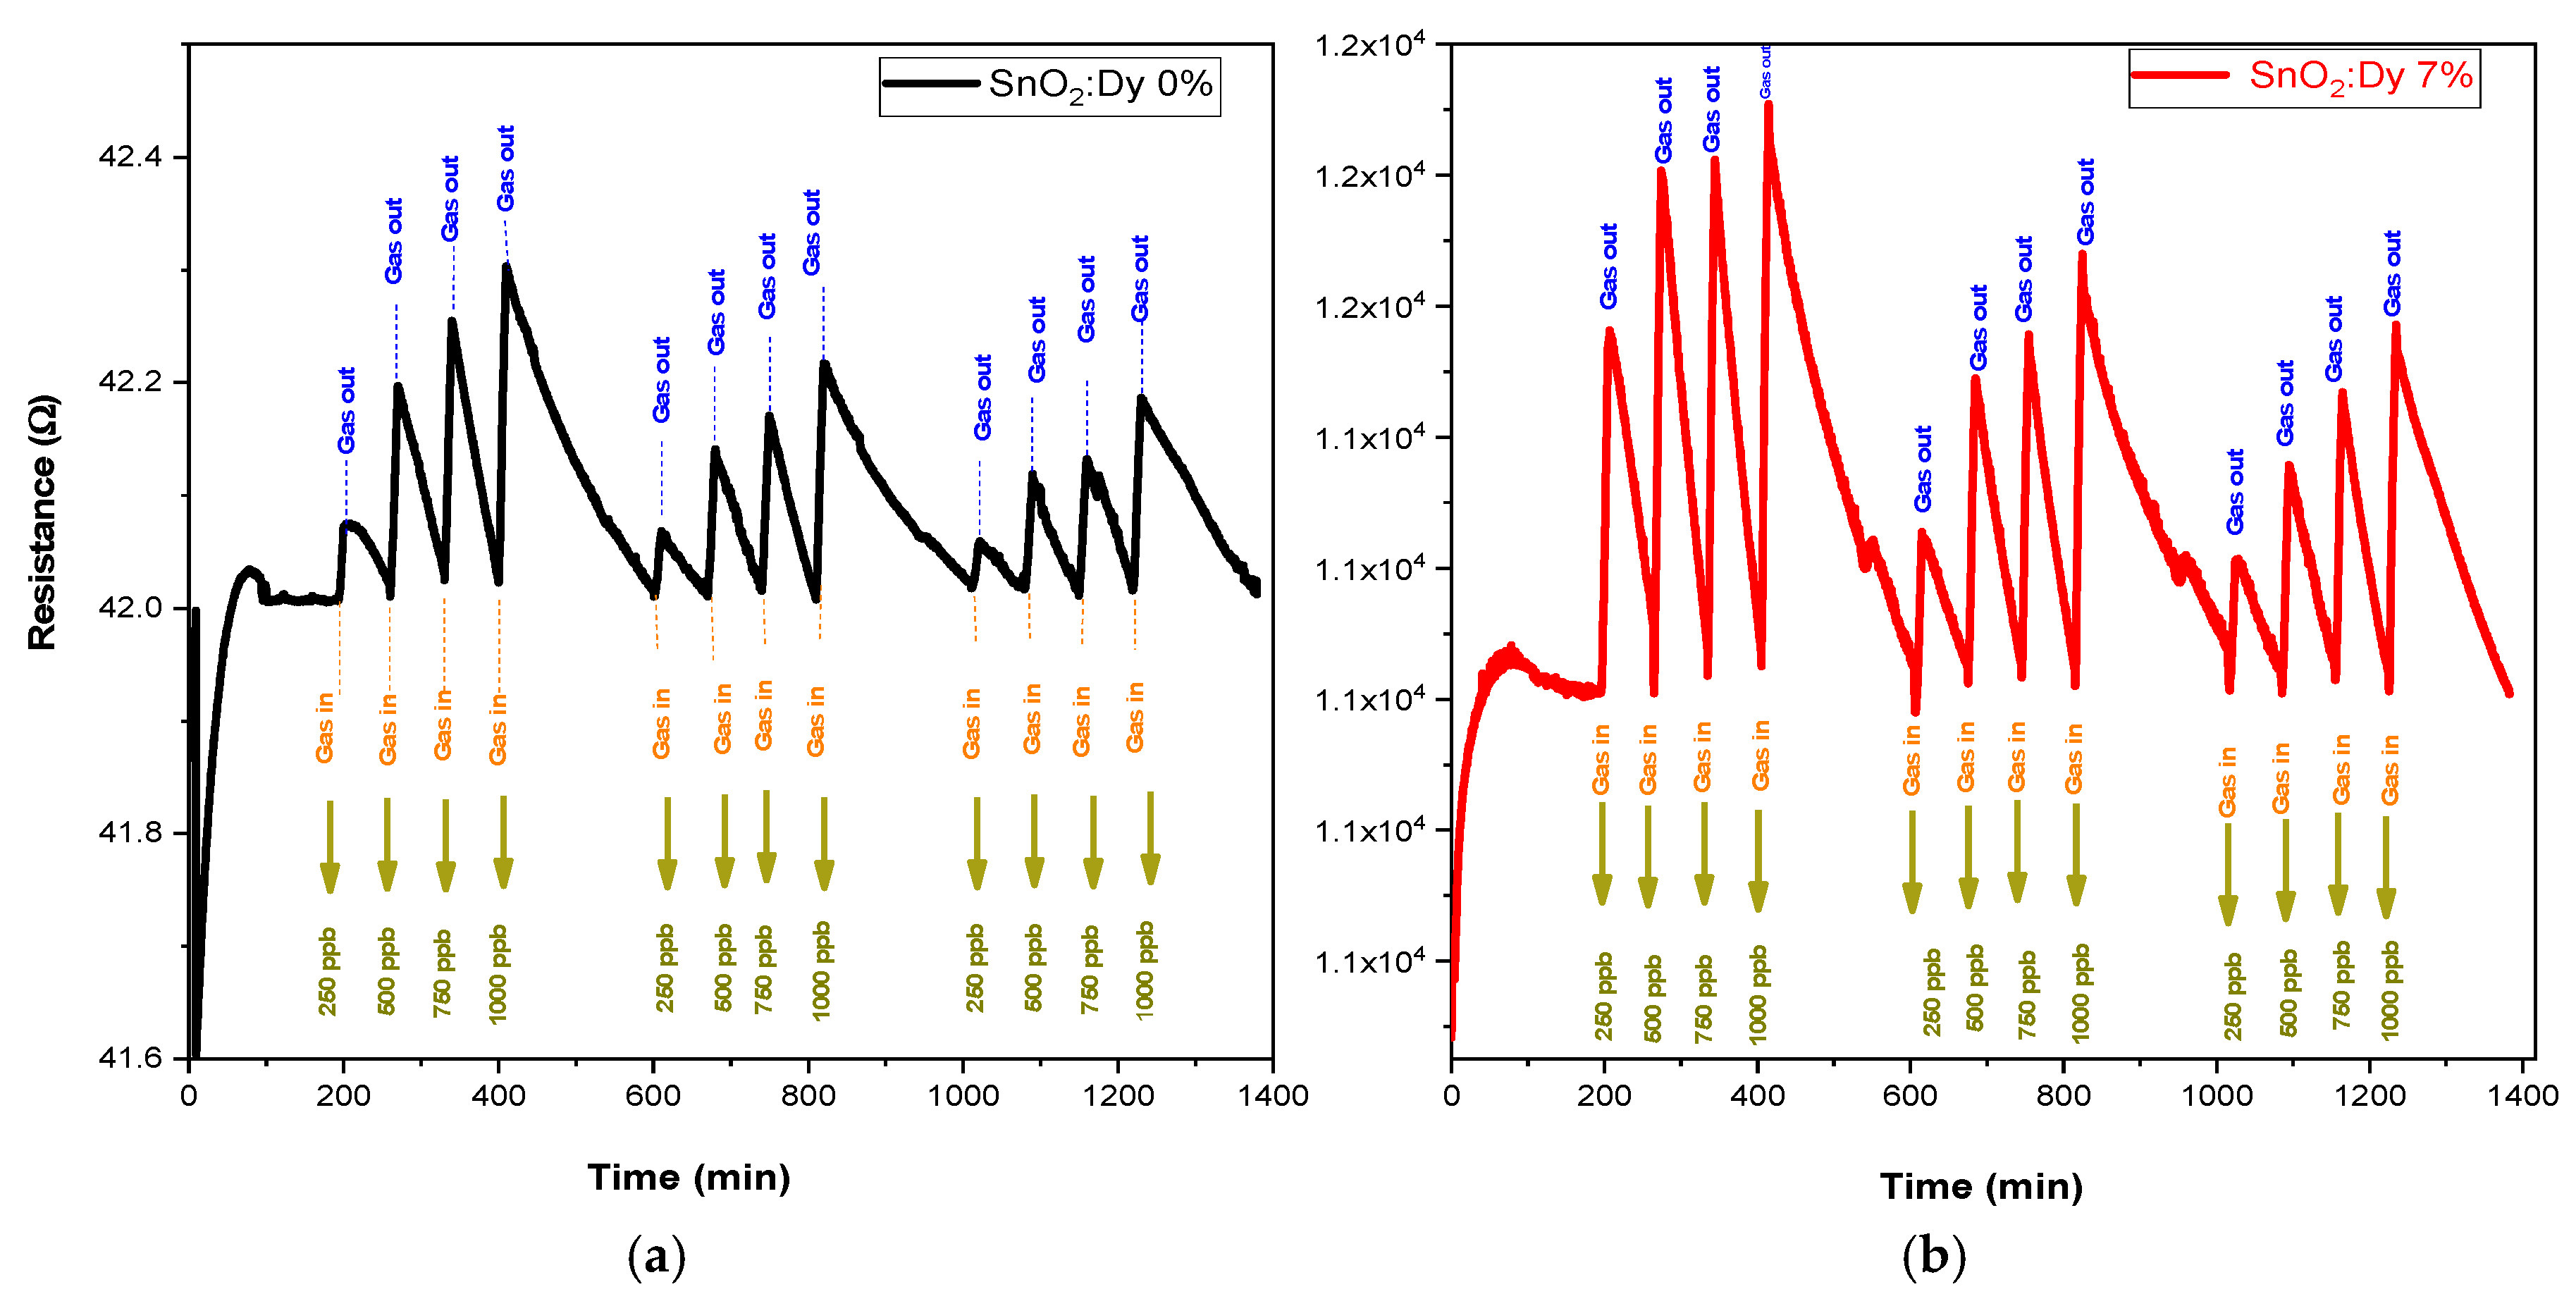
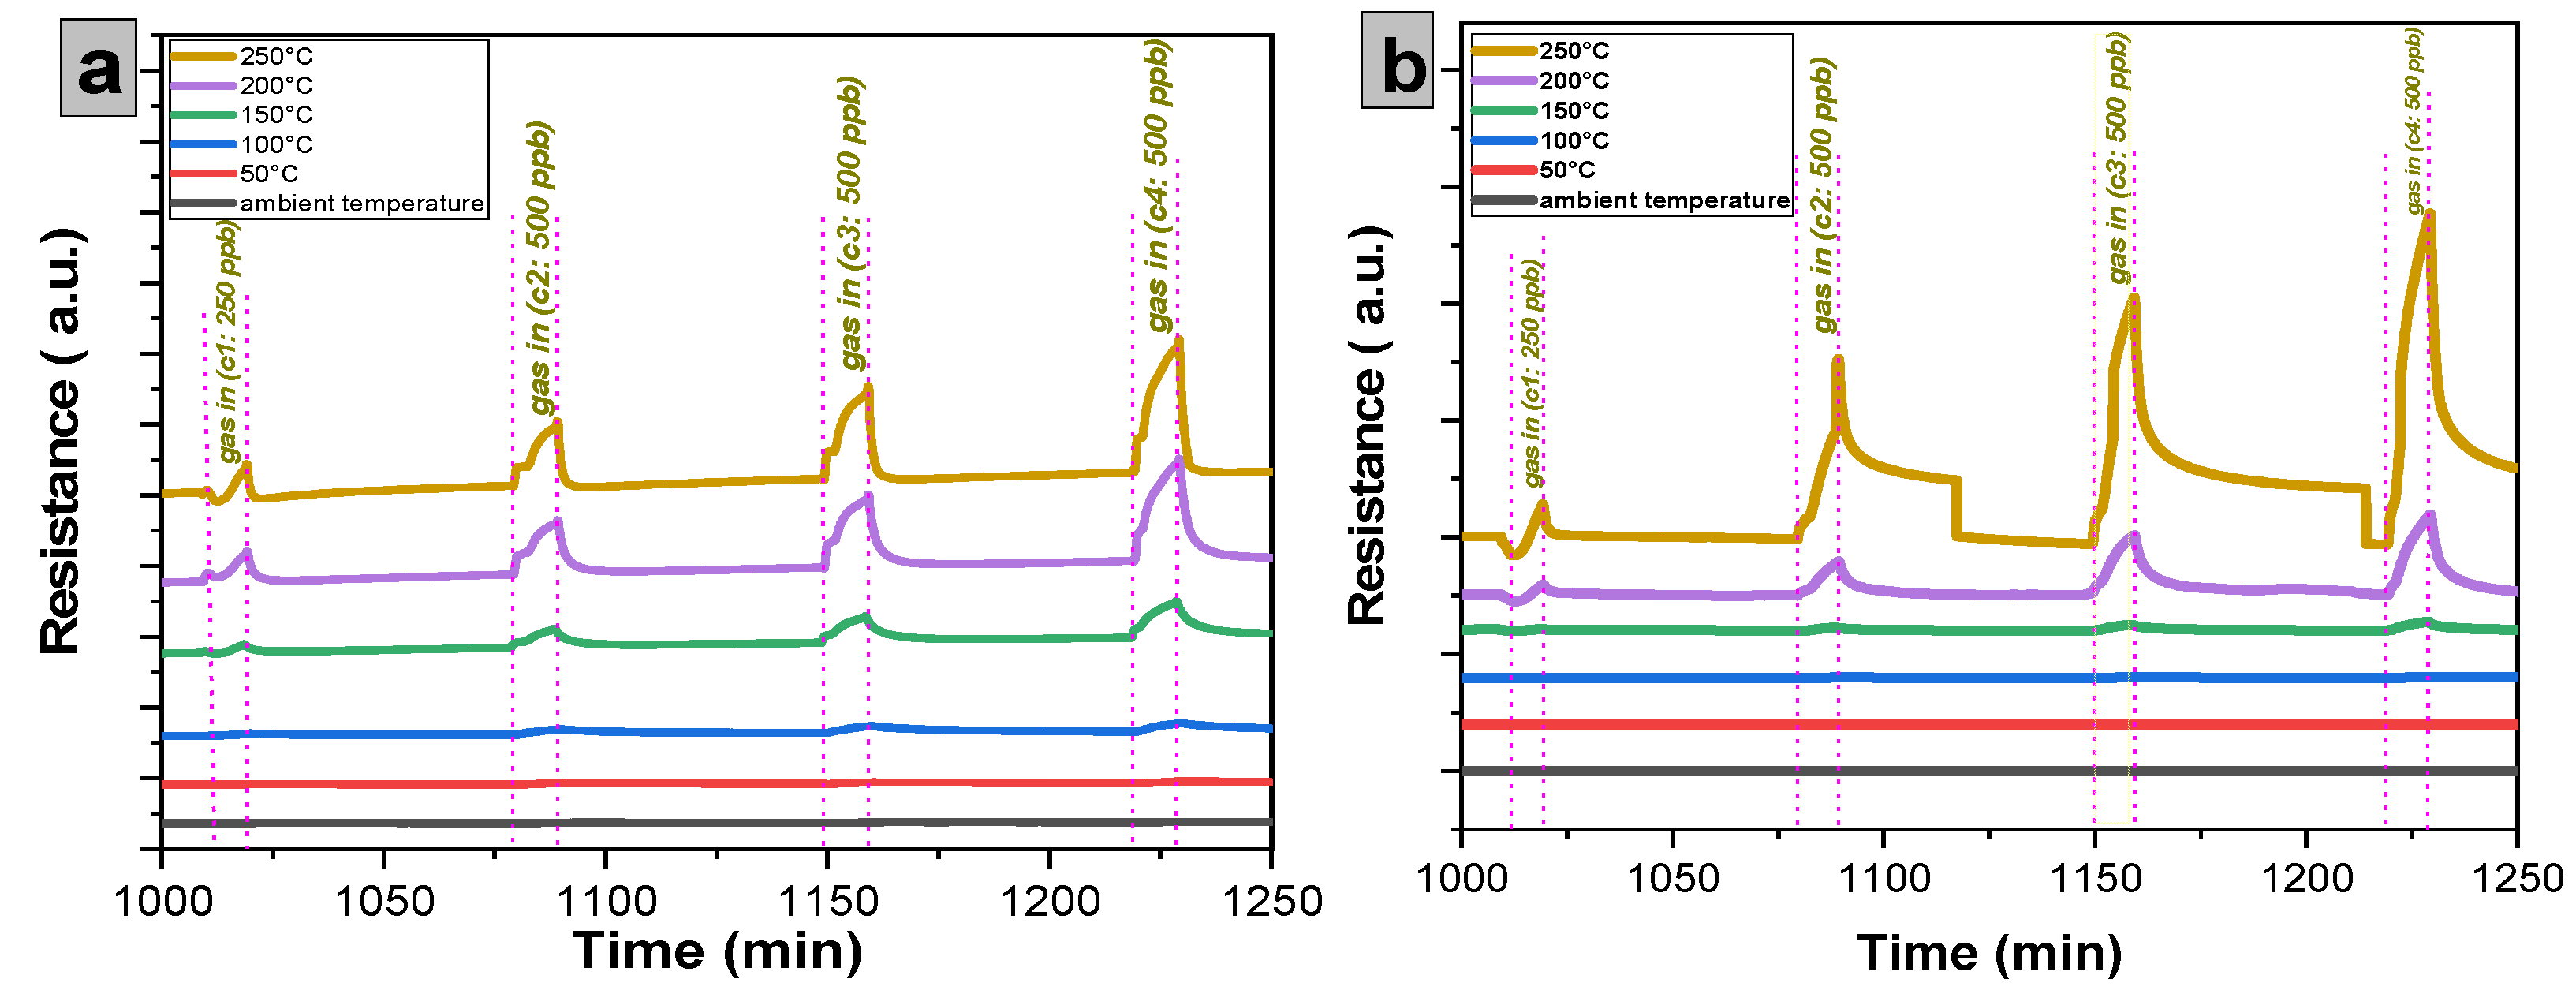
Gas sensing experiments were carried out across a range of operating temperatures (from room temperature, i.e., 25 °C, to 250 °C in 50 °C steps to identify the most effective operational temperature for sensors. This investigation encompassed various concentration levels for each target gas. In every instance of measurement, a 10 min injection of NO2 gas was followed by a 60 min purging phase with dry airflow. This process facilitated the restoration of the sensors’ initial baseline resistance. For NO2, very low concentrations of 250, 500, 750, and 1000 ppb were tested. Dry air served as the carrier gas throughout the gas sensing assessments. With rising operating temperature, there was a corresponding increase in the carrier count, leading to the decreased resistances observed for both pure SnO2 and SnO2:Dy thin films. This behavior aligns with semiconductive metal oxide characteristics. Although gas tests carried out at ambient temperature (see Figure 11) showed significant responses, these were far less stable than those recorded at higher operating temperatures (e.g., 250 °C).
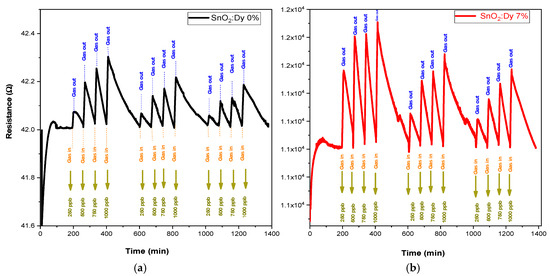
Figure 11.
The responses of the sensors: (a) undoped thin film and (b) doped 7% wt. thin film operated at room temperature.
The sensing performance of semiconductive metal oxide thin films might be negatively affected at low operating temperatures. The major factor here is the reduced charge carrier mobility in the material. With a drop in temperature, the energy available for these carriers decreases, which in turn hinders their movement and hence reduces the sensitivity of the sensor. At the same time, the adsorption, reaction, and desorption of gas molecules from the surface of the metal oxides are thermally activated processes, which can also decrease at low operating temperatures, resulting in lower sensitivity [43]. All these factors together make semiconductive metal oxide thin films have lower sensing performance under low operating temperature conditions. Anupriya et al. [44] have demonstrated that the optimum temperature to achieve the maximum response is ~300 °C for sensing various gases. In addition, we remark that the peak height gradually decreases over time for the same NO2 concentration, indicating a progressive instability of the sensors. This phenomenon is commonly observed in transparent conductive oxide (TCO)-based gas sensors operating at ambient temperature and can be attributed to several factors. Prolonged gas exposure may lead to surface modifications, affecting the adsorption–desorption equilibrium.
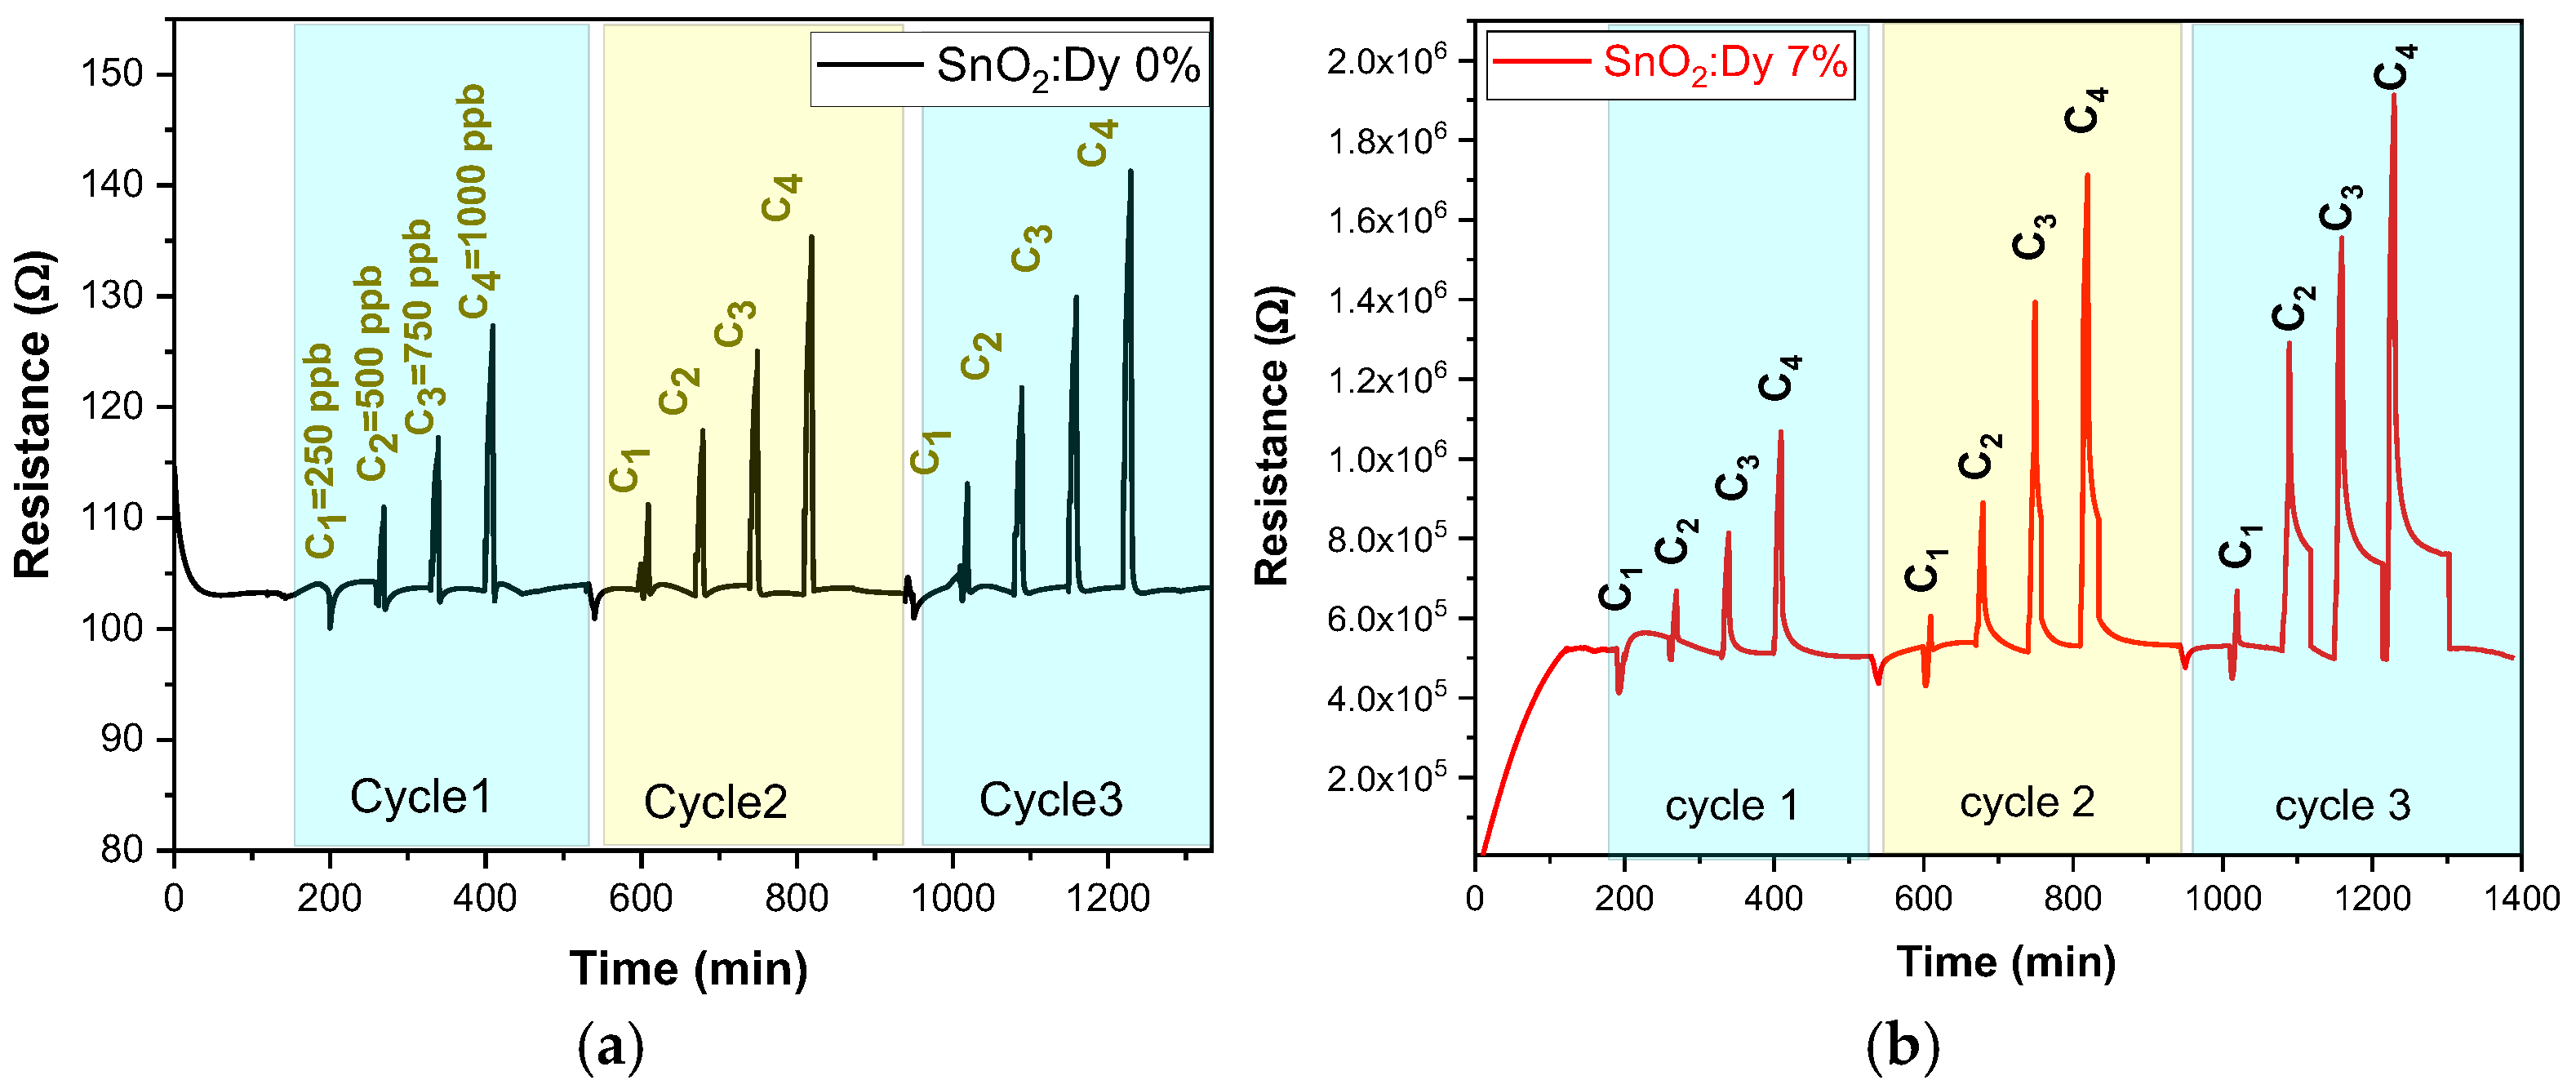
Having specified the optimum temperature for a certain number of cycles, the NO2 concentrations were set to be 250, 500, 750, and finally 1000 ppb. All sensors demonstrated good sensitivity, stability, and repeatability, which can be seen in Figure 12a,b for SnO2 and SnO2:Dy samples, respectively. On the other hand, from Figure 13a, it can be observed that the response of the SnO2:Dy 7% sample was higher by about a factor of two compared to bare SnO2.
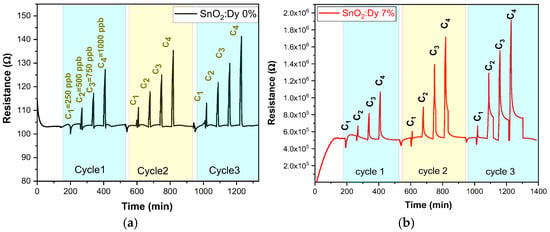
Figure 12.
Repeated response and recovery cycles for the sensors: (a) undoped thin film and (b) doped 7% wt. thin film as a function of the NO2 concentration. The operating temperature was set to 250 °C.
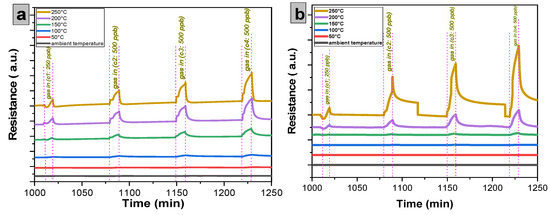
Figure 13.
Response of the sensors: (a) undoped thin film and (b) doped 7% wt. thin film as a function of the NO2 concentration for different operating temperatures.
Moreover, we remarked that at extremely low concentrations of NO2, an initial negative response may appear in metal oxide semiconductor sensors due to the inversion layer effect. This phenomenon occurs because, at such low gas levels, the adsorption of NO2 molecules can momentarily lead to an increase in the majority charge carriers instead of causing their depletion. Under standard gas sensing conditions, NO2 acts as an oxidizing agent that extracts electrons from the conduction band of n-type SnO2, thereby increasing the material’s electrical resistance. However, when the concentration is exceptionally low, surface interactions can induce a temporary local band bending effect. This results in a brief increase in the electron density before the expected depletion process takes over, leading to the conventional resistance increase. Consequently, this transient behavior manifests as an initial negative sensor response. Furthermore, this effect can make NO2 appear to exhibit reducing properties under specific conditions. At minimal surface coverage, the adsorption of NO2 molecules may alter surface states and modify ionosorption mechanisms differently than at higher concentrations, where its oxidizing nature prevails. Similar inversion behaviors have been documented in SnO2 and other metal oxide-based sensors, particularly when exposed to low gas concentrations [45].
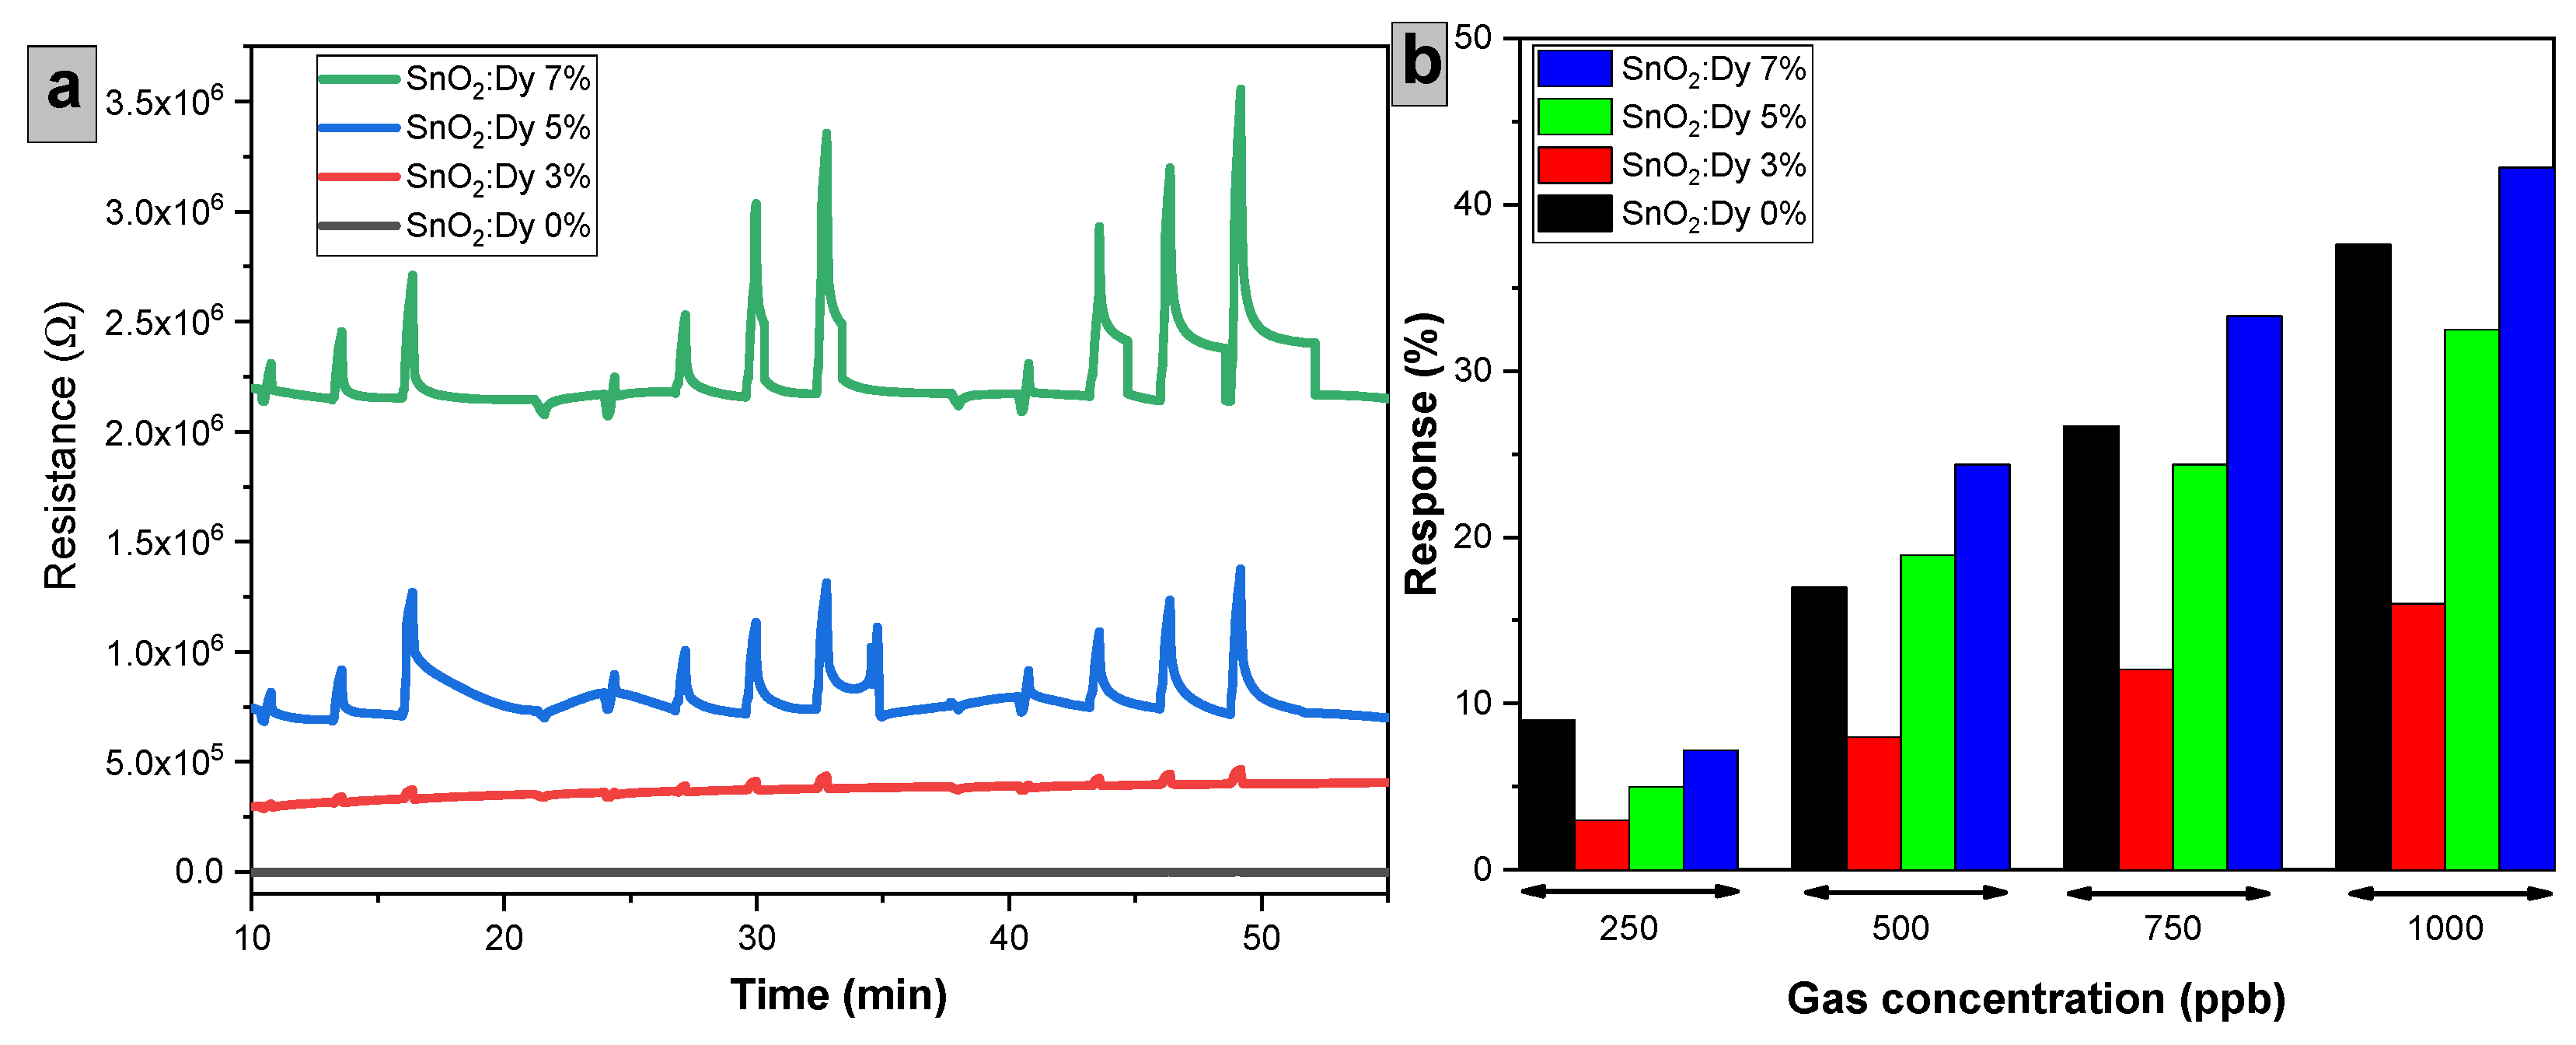
Figure 14 summarizes the dynamic responses toward NO2, dosed from 250 to 1000 ppb, for sensors comprising different doping levels of Dy and operated at 250 °C. These results clearly show that responses increase by increasing the Dy doping level. For the tested 250 to 1000 ppb concentration range, the response rises from 7.2% to 42.24% for the SnO2:Dy 7% sensor.
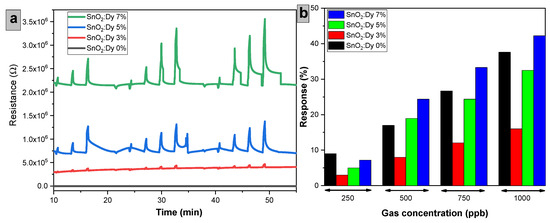
Figure 14.
(a) Variation of resistance over time for sensors with different Dy doping levels exposed to NO2, (b) Sensor response (%) as a function of NO2 concentration. Sensors were operated at 250 °C.
In general, replacing Sn ions with Dy atoms generates additional active sites for gas interaction, likely boosting the sensor responsiveness compared to undoped SnO2 [46]. Furthermore, as Dy typically exists in an X3+ oxidation state, its integration into the SnO2 lattice leads to an increase in free electrons, where the increased concentration of free electrons likely contributes to the effective interaction with electron-withdrawing gases like NO2 [47]. This is in agreement with the results reported by Gurpreet Singh et al., in which they obtained an enhanced response by doping SnO2 with 5% Dy [22]. Dysprosium doping favors the adsorption–desorption processes and associated change transfer linked to the sensor surface–gas interaction [44]. It is worth noting that the response intensity decreased for low Dy doping levels. The observed trend, where low Dy concentrations (3% and 5%) result in a weaker NO2 sensing response compared to pure SnO2 while a higher Dy concentration (7%) significantly improves the response, can be explained by several factors related to defect chemistry, electronic structure, and surface reactions. One key factor is the effect of Dy on oxygen vacancies. Dy3+ substitution in SnO2 influences the concentration of these vacancies, which are crucial for gas sensing. At low Dy concentrations, Dy incorporation may stabilize the crystal lattice, reducing oxygen vacancies and consequently decreasing the number of active sites for NO2 adsorption. In contrast, at higher Dy concentrations, excess Dy can act as a defect promoter, increasing the oxygen vacancy density and enhancing NO2 adsorption and charge transfer. Additionally, the influence of Dy on the charge carrier density plays an important role. Since SnO2 is an n-type semiconductor and NO2 is an electron-withdrawing gas, NO2 adsorption depletes free electrons, increasing the sensor’s resistance. At low Dy doping levels, Dy3+ introduces additional charge carriers, but this can lead to partial charge compensation, weakening the depletion region and reducing the sensor response. However, at higher Dy doping levels, Dy3+ modifies the band structure, leading to a stronger depletion layer, which enhances the resistance change upon NO2 adsorption and improves sensor performance.
This behavior is consistent with findings in similar studies where low dopant concentrations do not significantly enhance sensor performance, while higher concentrations lead to improvements, underscoring the importance of optimizing dopant levels in SnO2-based sensors. For instance, research by Feng et al. on Sb-doped SnO2 demonstrated that low Sb concentrations had little effect on sensor performance, whereas higher Sb levels improved NO2 sensitivity due to increased oxygen vacancies and modified electronic properties [48]. Furthermore, a study on Co-doped SnO2 films deposited by spray pyrolysis revealed that doping concentrations below 2–4% improved gas sensor parameters, whereas concentrations exceeding this range led to degradation of sensor operation characteristics [49]. This suggests that an optimal doping concentration exists for maximizing sensor performance and that exceeding this threshold, whether too low or too high, can lead to reduced sensitivity. These findings highlight the intricate role of the dopant concentration in SnO2-based sensors, emphasizing that while higher doping levels can enhance performance, surpassing an optimal limit may introduce defects or structural distortions that negatively impact gas sensing efficiency. The increasing intensity of resistance peaks over time in Dy-doped SnO2 gas sensors operated at 250 °C for the same gas concentration could be attributed to several interrelated factors. One key aspect is surface activation and aging effects, where the sensor’s active sites become more receptive to gas adsorption over repeated exposures. Initially, some adsorption sites may be inactive, but prolonged interaction with NO2 molecules can modify the surface, increasing the density of reactive sites and enhancing sensitivity [50]. Another contributing factor is gas trapping and residual adsorption, where incomplete desorption between cycles leads to a cumulative effect, progressively strengthening the sensor’s response [51]. Lastly, temperature-related effects, such as prolonged exposure at 250 °C, can influence the oxygen adsorption–desorption equilibrium, further amplifying the sensor’s response with each cycle [52]. These combined mechanisms explain the observed trend of increasing peak intensities in gas detection measurements.
Table 5 shows the response time (Rt) and recovery time (Rc) for pure and Dy-doped SnO2 sensors at ambient and 250 °C room temperatures. These results highlight the limitations of undoped SnO2 sensors, particularly at room temperature, where the response time (Rt) is relatively long (9.25 min) and the recovery time (Rc) is significantly high (116 min). This sluggish response indicates slow adsorption–desorption kinetics, restricting their applicability for rapid gas detection. Increasing the temperature to 250 °C enhances sensor performance, reducing Rc to 1 min, demonstrating that thermal activation facilitates faster gas desorption. The Dy-doped sensor (7% Dy) exhibits a slightly improved response time at room temperature (9 min) and a shorter recovery time (101 min), suggesting enhanced surface interactions. At 250 °C, while Rt remains nearly unchanged (9 min), Rc is significantly longer (5.55 min), indicating a stronger gas adsorption effect. These findings emphasize the necessity of thermal activation for optimizing response dynamics and highlight the influence of Dy doping on adsorption–desorption behaviors.

Table 5.
Response and recovery times and theoretical limits of detection of SnO2:Dy sensors at different temperatures.
To further evaluate sensor performance, we calculated the theoretical limit of detection (LOD) using the standard method [53]:
where σ represents the standard deviation of the baseline signal and Res is the sensor response sensitivity. Based on our experimental data, the estimated LOD for the undoped SnO2 sensor was found to be 198.77 ppb at ambient temperature, decreasing to 109.46 ppb at 250 °C. For the 7% Dy-doped SnO2 sensor, the LOD values were slightly lower, measuring 172.26 ppb at ambient temperature and 122.7 ppb at 250 °C.
These findings are consistent with results reported in the literature. For instance, Xu et al. developed sulfur-doped SnO2 sensors that exhibited ultra-high sensitivity to NO2, with a detection limit as low as 50 ppb and negligible cross-responses to other gases [54].
When comparing these values with the theoretical gas sensing limit of SnO2 for NO2 from recent studies, which is reported to be on the order of 500 ppb, and lower than 250 ppb for doped SnO2, both the undoped and Dy-doped SnO2 sensors in our study exhibit significantly lower LODs, indicating their enhanced detection capability. The reduction in the LOD with Dy doping suggests that the introduction of dysprosium enhances the sensor’s performance.
Furthermore, operating the sensor at an elevated temperature (250 °C) led to a decrease in the LOD for the undoped SnO2 sensor, indicating enhanced gas adsorption–desorption dynamics at higher temperatures. However, for the 7% Dy-doped SnO2 sensor, the LOD increased slightly at 250 °C compared to ambient conditions, suggesting that temperature effects on doped materials might introduce competing mechanisms affecting gas interaction dynamics.
These findings reinforce the potential of Dy doping in improving gas sensor selectivity and sensitivity while maintaining competitive detection limits compared to the literature values.
Table 6 compares the results achieved in this paper to the ones reported by earlier research, offering a perspective.

Table 6.
Comparison of the sensing properties of resistive gas sensors based on different dopant materials for SnO2 thin films.
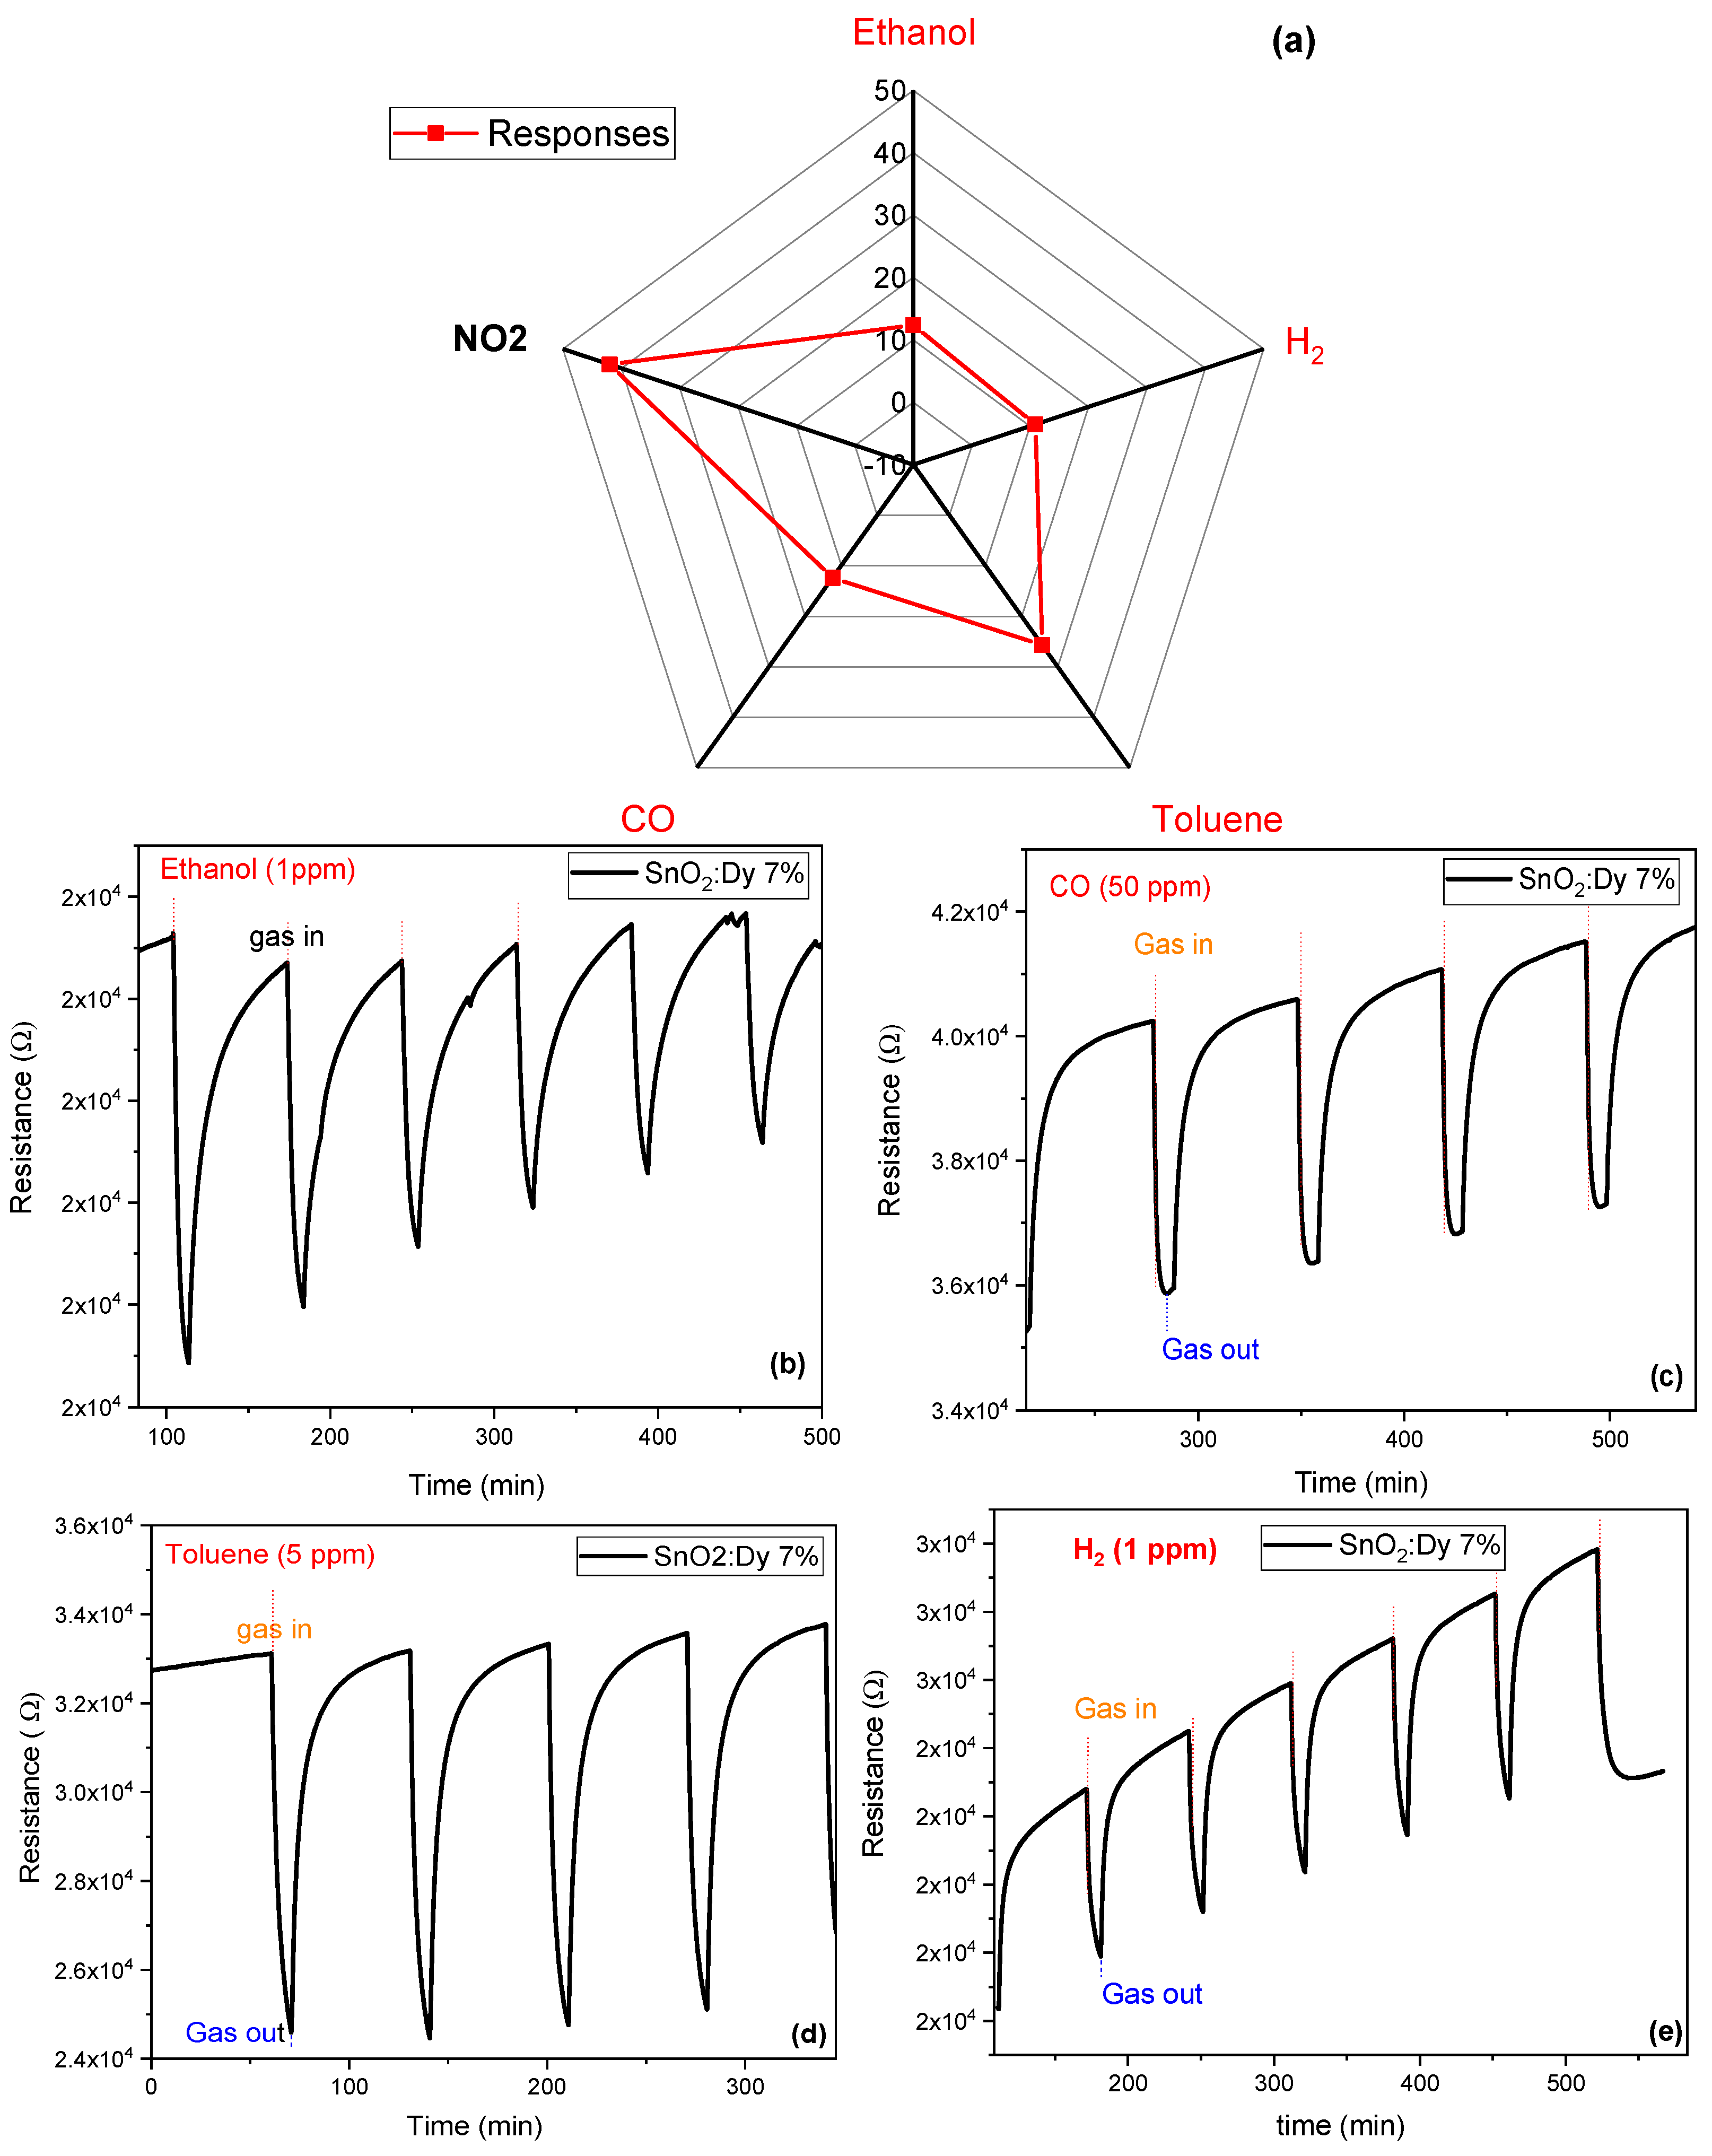
The responses of the optimized sensor to different gaseous species at an operating temperature of 250 °C were studied. These results are presented in Figure 15. The sensor exhibits relatively low responses to ethanol, carbon monoxide (CO), and hydrogen (H2), with values ranging between 10% and 13%. In the presence of toluene, a slightly higher response of approximately 25% is observed. In contrast, the sensor demonstrates a significantly higher response to NO2 at lower concentrations (1 ppm). This indicates that the Dy-doped SnO2 possesses good sensitivity to NO2 and to aromatic VOCs. Specifically, when Dy-doped SnO2 is employed for NO2 detection, it can lead to more dynamic adsorption–desorption cycles and notable changes in resistance. This behavior is primarily due to the low binding energy and the significant charge transfer associated with the interaction between the material and NO2. The choice of CO, H2, toluene, and ethanol as test gases was based on their relevance in environments where NO2 detection is essential, such as air pollution monitoring and industrial safety applications. CO and H2 are known reducing gases that can interact with the sensing material, potentially affecting NO2 detection. Toluene and ethanol, commonly found in both indoor and outdoor air, can also adsorb on the sensor’s surface, leading to possible cross-sensitivity effects. Investigating the response of SnO2:Dy to these gases provides insights into its selectivity and real-world applicability for NO2 sensing.
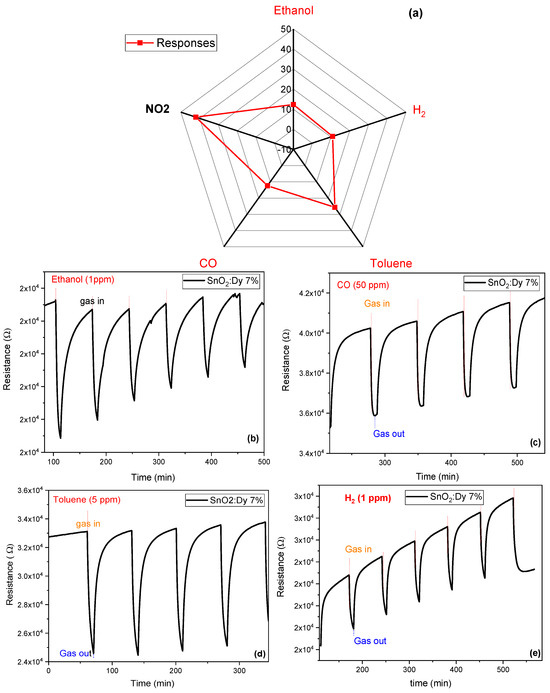
Figure 15.
(a) Radar plot with the responses of the SnO2:Dy 7% sensor to different concentrations of gaseous species: NO2 (1 ppm), ethanol (10 ppm), CO (50 ppm), toluene (5 ppm), and H2 (100 ppm). Repeated response and recovery cycles toward (b) ethanol at 10 ppm, (c) CO at 50 ppm, (d) toluene at 5 ppm, and (e) H2 at 100 ppm. The operating temperature of the sensor was kept at 250 °C.
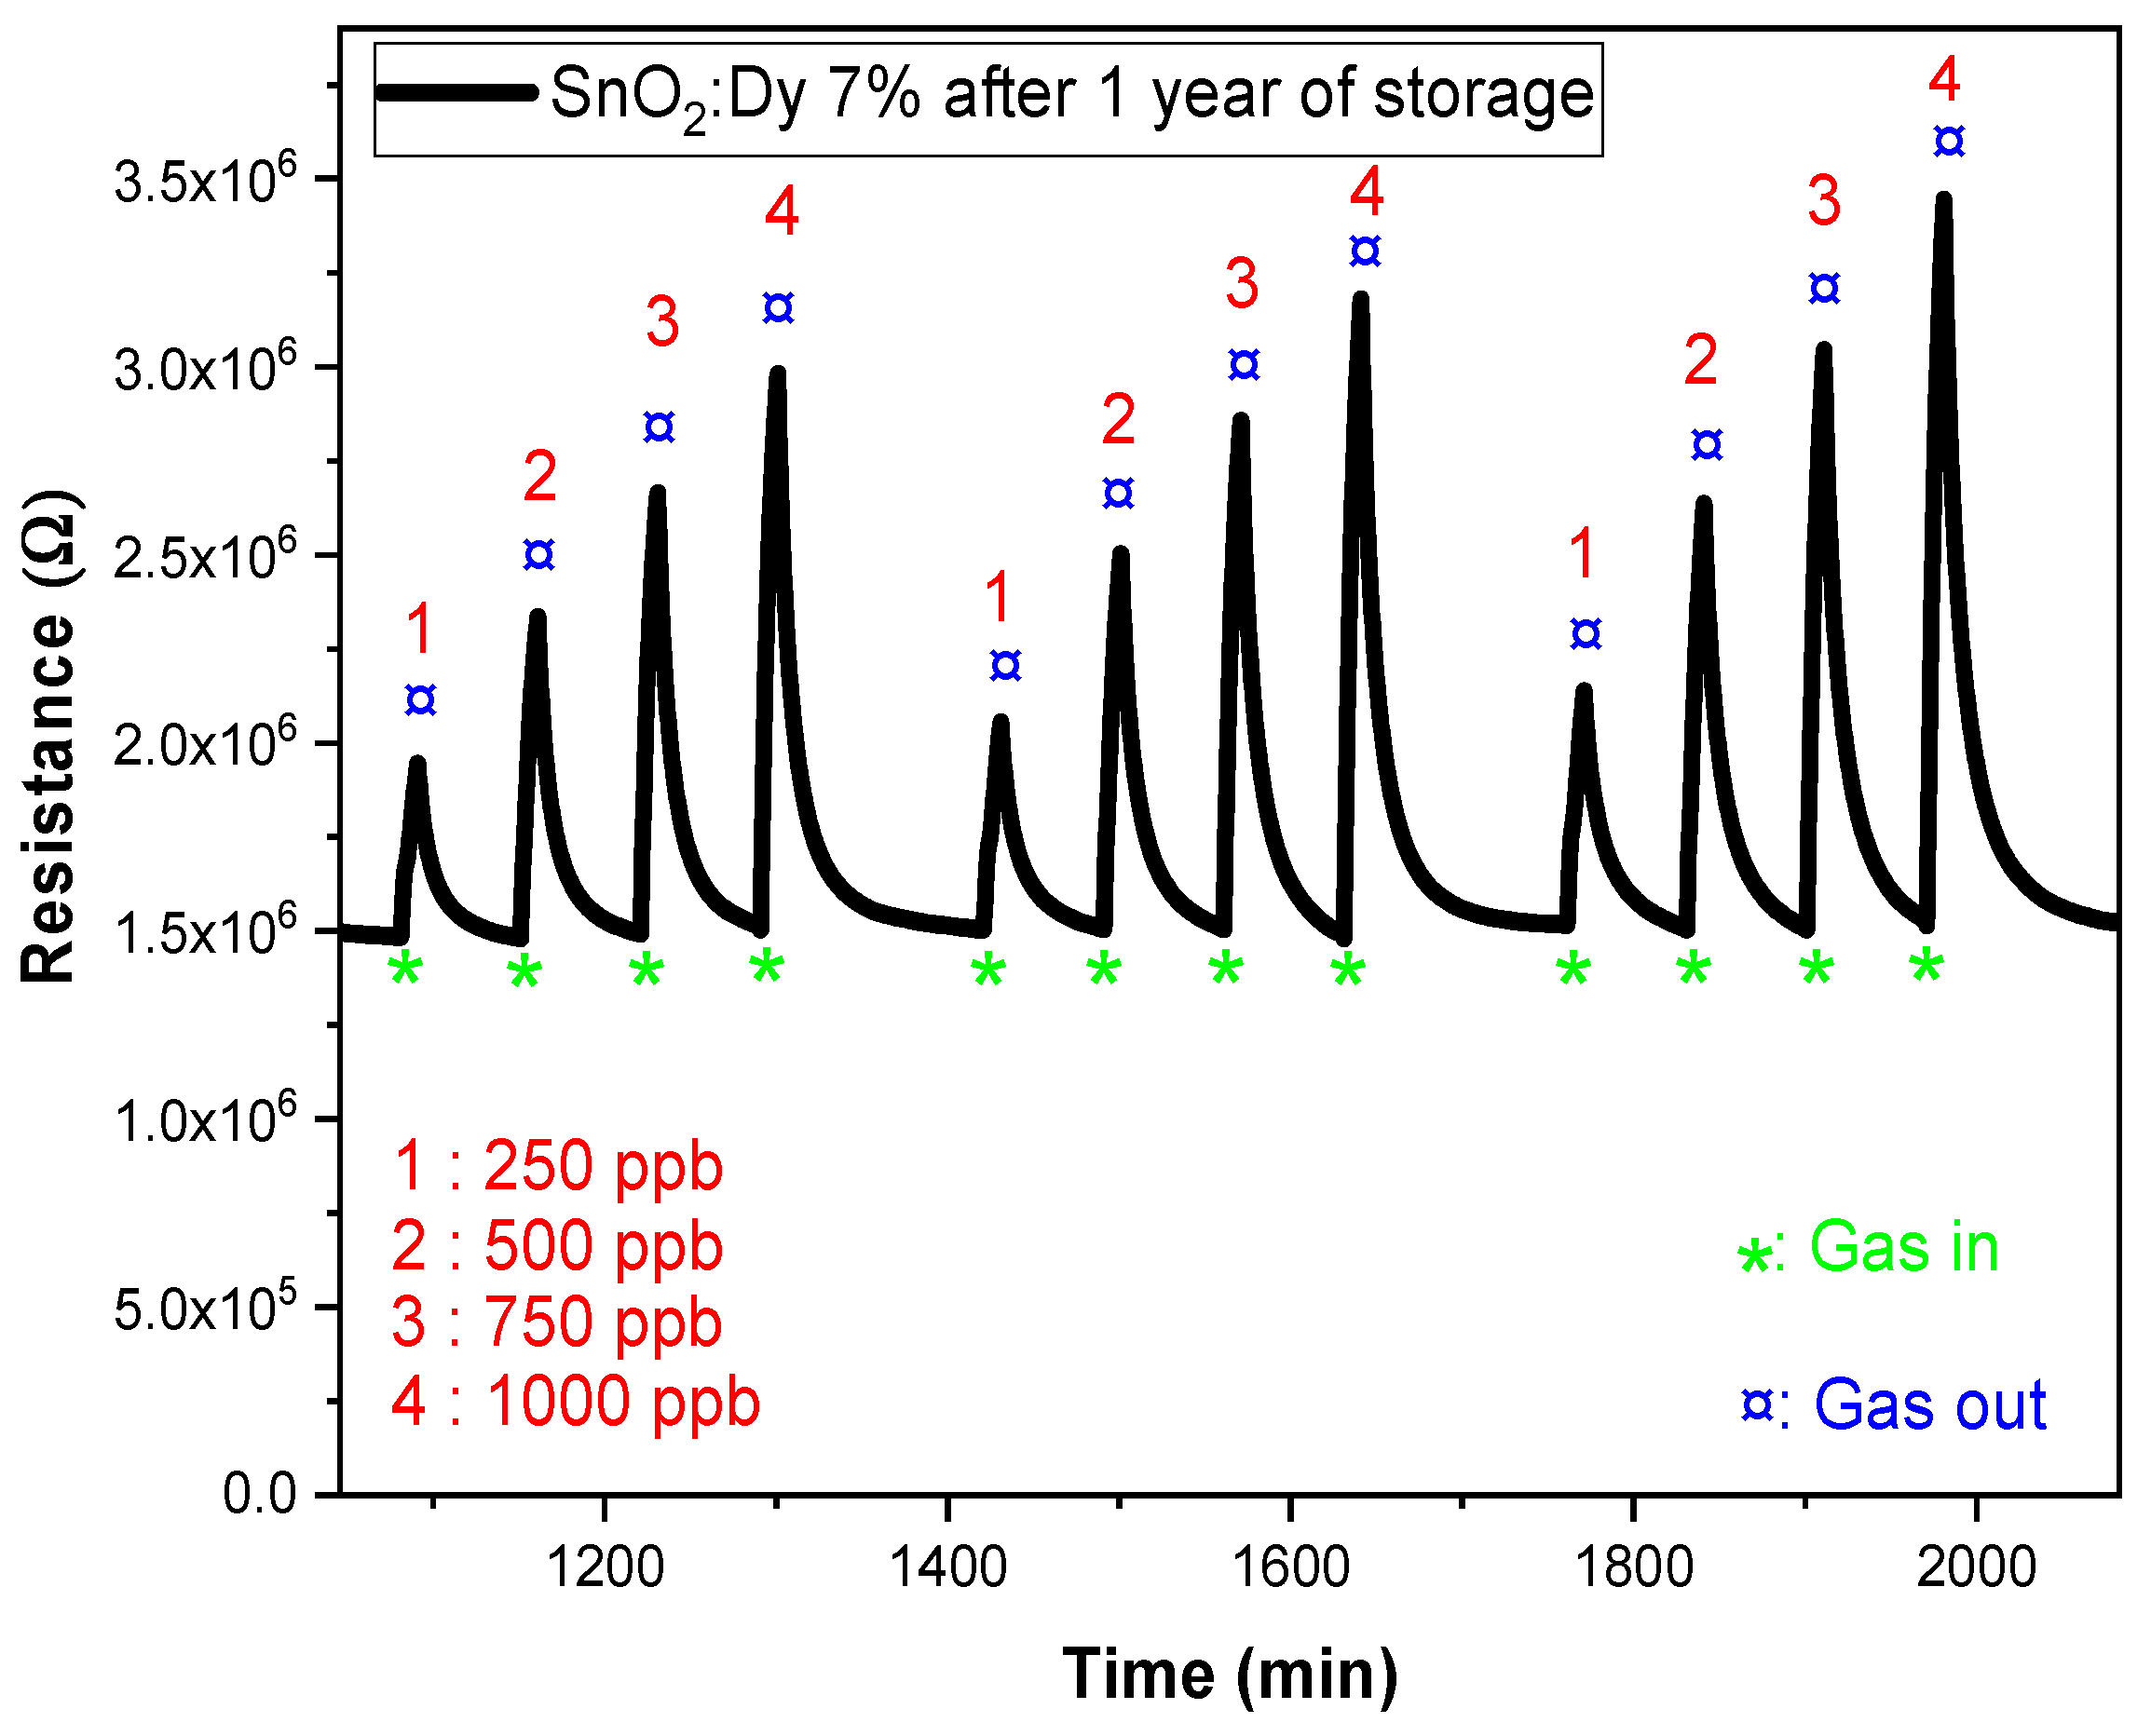
In this study, we conducted reproducibility tests on dysprosium-doped SnO2 (SnO2:Dy 7%) thin films fabricated via sputtering on alumina substrates (Figure 16). After a storage period of one year, we observed a significant increase in the sensitivity of these films, as represented in Figure 16, with the resistance response increasing from 42.3% to 63.6%. This improvement can be attributed to several factors associated with the aging process. One possible explanation is the progressive oxidation of the films over time, which may have altered their surface properties and enhanced their interaction with target gases. This phenomenon has been observed in similar studies, where aging in humid air led to increased oxygen adsorption on SnO2 surfaces, thereby improving the sensor response [61]. Additionally, changes in the distribution of surface defects, such as oxygen vacancies, can increase the number of active sites available for gas adsorption, leading to improved sensor performance. Research has shown that aging can influence the electrical and structural characteristics of SnO2-based sensors, affecting their sensitivity [62]. Furthermore, we observed an increase in the resistivity range, suggesting modifications in the electrical characteristics of the material during aging. This could be related to changes in potential barriers at grain boundaries, as the thickness and microstructure of SnO2 films have been shown to significantly affect their gas sensing properties [63]. Similar results have been found by N Kaur et al. who reported excellent sensor performance after prolonged storage. In their study, NiO nanowire-based NO2 sensors exhibited improved response characteristics after 200 days of storage under ambient conditions, making them highly suitable for long-term gas detection applications [64].
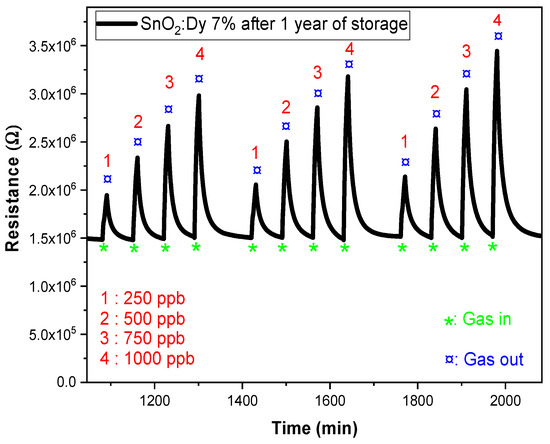
Figure 16.
Response of SnO2:Dy (7%) at 250 °C after one year of storage under low NO2 gas concentrations (250, 500, 750, and 1000 ppb).
4.2. Gas Sensing Mechanism
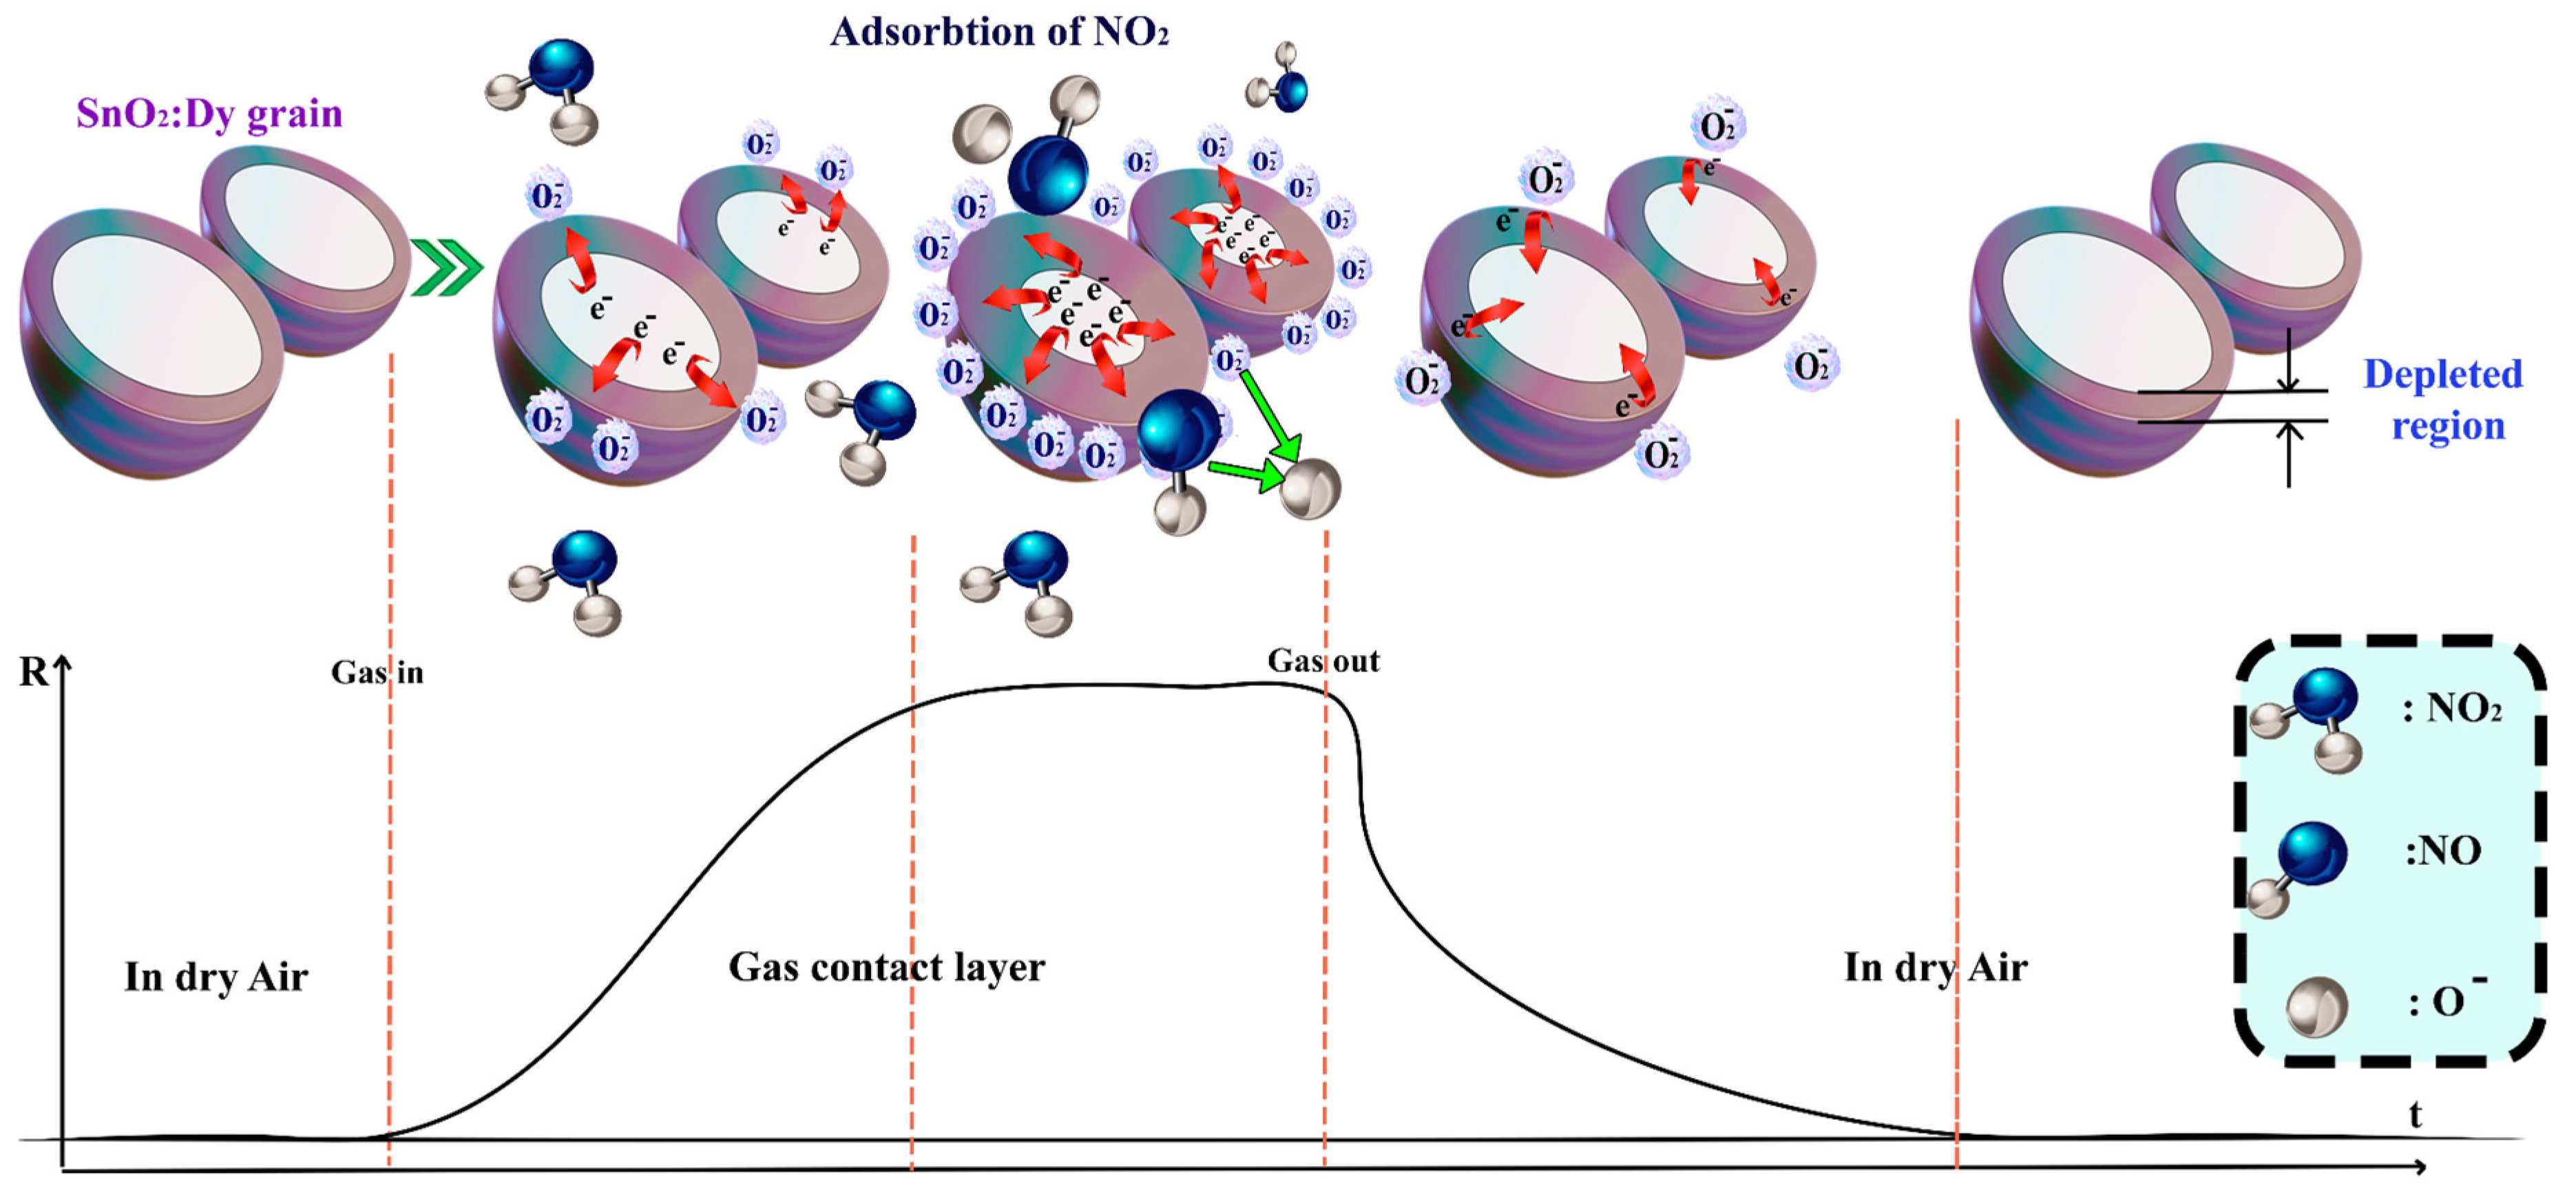
The sensing mechanism can be presented through two models: the Surface Adsorption Oxygen Control Model for an n-type semiconductor and the Surface Depletion Model, which is more pertinent in our case involving a semiconductive metal oxide doped with Dy [65]. When the surface of SnO2:Dy is exposed to air, it naturally comes into contact with oxygen molecules that are typically ionosorbed, thereby capturing electrons from the conductive band of the thin film. This results in the absorption of oxygen ions (O2−, O−, and O2−), depending on the operating temperature. O2− represents a negatively charged oxygen molecule adsorbed on the surface after capturing an electron, while O− and O2− are singly and doubly charged oxygen ions, respectively, formed through further electron capture. Notably, NO2 is a potent oxidizing gas that readily gets absorbed at oxygen vacancy sites on the surface of SnO2:Dy. Singly ionized oxygen vacancies , which are defects in the SnO2 lattice caused by a missing oxygen atom, leaving a site with a positive charge, are created as a result of Dy3+ doping, which introduces more in-plane oxygen vacancies to balance the charge. NO2 dissociates into NO and O−, with the 7% Dy-doped SnO2 yielding heightened responses due to the increased number of in-plane doubly ionized oxygen vacancies created from Dy3+ doping [66].
These defects are sites with two positive charges result from oxygen atom removal, facilitating enhanced adsorption and charge transfer.
The reactions governing these processes are as follows:
O2 (gas) → O2 (adsorbed)
Conversely, when the sensor encounters gases like NO2, molecules interact with the metal oxide surface, capturing electrons from the surface atoms and creating a depleted region near the surface. The NO2 molecules readily undergo oxidation on the sensing surface at oxygen vacancy sites , facilitated by the energy provided by these defect sites, allowing electrons to surpass the potential barrier. Consequently, there is a charge transfer between the surface and the adsorbed gas, leading to the expansion of the depleted region. This response is immediately translated into an increase in the sensor resistance, as depicted in Figure 17.
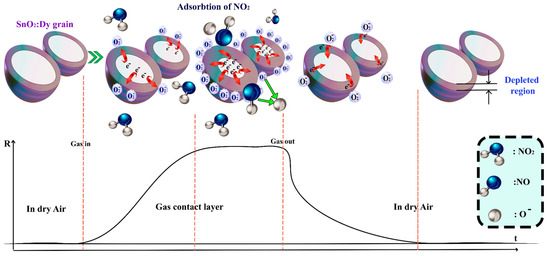
Figure 17.
The sensing mechanism of Dy-doped SnO2 thin films film in the presence of NO2 gas.
In this context, − O− (adsorbed)) represents an intermediate species where an oxygen vacancy traps an adsorbed oxygen ion, stabilizing the reaction process.
In contrast, when exposed to air, the defective SnO2 thin film surface becomes coated with oxygen molecules through physisorption or chemisorption at room temperature.
The gas sensing efficiency is improved by doping SnO2 with dysprosium (Dy), which raises the concentration of oxygen vacancies. When Sn atoms are substituted with Dy, the lattice distortions caused by its larger ionic radius result in defects such as oxygen vacancies. For gas detection, these vacancies serve as active sites for the adsorption and ionization of oxygen species. When interacting with target gases, the improved adsorption enhances charge transfer processes, boosting response and sensitivity. As a result, Dy doping enhances charge transfer and oxygen vacancy formation, greatly enhancing the sensing capabilities of SnO2.
The mechanism is illustrated in Figure 17.
During this study, we explored the detection of NO2 gas using SnO2 film sensors. Figure 13 shows response patterns of the sensor, highlighting a difference between undoped and Dy-doped thin films. Furthermore, we noticed that SnO2 films displayed greater sensitivity and faster response times when exposed to Dy doping at a 7% level. This improved performance could be linked to the surface characteristics of Dy-doped SnO2 films, which had an increased surface area that helped in moving molecules more easily and enhancing their chemical sensing abilities.
Numerous authors have proven a connection between the density of surface states generated and size-dependent gas sensing properties. The oxygen species that is chemisorbed results in a reduced Fermi level setting. As a result, the Fermi level pinning is reduced, suggesting a greater variance in the sensor’s sensitivity and surface barriers. This contributes to the enhanced sensitivity of SnO2 sensing instruments produced using monocrystalline thin film technology. One of the key elements influencing gas sensors performance is a depleted stratum. The thick space-charge layer raises the potential barrier. The extent of this possible impediment to electrical conduction strongly varies according to the proportion of crystallite size (D) to the thickness of the space-charge layer (depletion zone) (L). Numerous investigators have made clear the relation between D and depletion [67,68].
5. Conclusions
This study aims to enhance SnO2 thin films by doping them with dysprosium for NO2 gas sensing. To achieve this, SnO2:Dy films were successfully deposited on alumina and glass substrates using the RF sputtering technique. XRD patterns of the elaborated films present the tetragonal rutile structure with an oriented direction. Morphological characterization underscores the high uniformity of these thin layers. The analysis of the optical characteristics showed high transmittance levels exceeding 80%, along with a variation in the band gap, where its values increased with a higher Dy doping ratio. Introducing dysprosium doping into SnO2 enhances sensing responses and mitigates issues encountered by sensors at ambient temperatures. Notably, the highest responses are achieved with a higher doping ratio, particularly at a room temperature of 250 °C. By optimizing different conditions, we have succeeded in achieving highly sensitive and stable sensors that show remarkable responses to low concentrations of NO2, even if operated at room temperature. This approach yields new results in elucidating the gas sensing mechanism in rare earth metal-doped transparent conducting oxides (TCOs) compared to previous studies. As a perspective, testing under humid conditions is important for evaluating gas-sensing materials, as humidity can impact sensor sensitivity and response time. Water vapor, typically ranging from 30% to 90%, can affect gas molecule adsorption, altering sensor performance. As a future direction, this work will include tests conducted with varying humidity levels to better simulate real-world conditions and ensure the reliability of gas sensors in humid environments.
Author Contributions
Conceptualization, N.B. and E.L.; methodology, M.M.; validation, M.M., N.B. and E.L.; formal analysis and investigation, M.M.; resources, I.R. and F.C.; data curation, M.M.; writing—original draft preparation, M.M.; review and editing, N.B. and E.L.; visualization, M.M.; supervision and administration, N.B. and E.L.; funding acquisition, E.L. All authors have read and agreed to the published version of the manuscript.
Funding
E.L. is supported by the Catalan Institution for Research and Advanced Studies via the 2023 Edition of the ICREA Academia Award.
Institutional Review Board Statement
Not applicable.
Informed Consent Statement
Not applicable.
Data Availability Statement
The data used in this paper are available upon request.
Conflicts of Interest
The authors declare no conflicts of interest.
References
- Sung, H.; Ferlay, J.; Siegel, R.L.; Laversanne, M.; Soerjomataram, I.; Jemal, A.; Bray, F. Global cancer statistics 2020: GLOBOCAN estimates of incidence and mortality worldwide for 36 cancers in 185 countries. CA Cancer J. Clin. 2021, 71, 209–249. [Google Scholar] [CrossRef] [PubMed]
- Mele, M.; Magazzino, C.; Schneider, N.; Strezov, V. NO2 levels as a contributing factor to COVID-19 deaths: The first empirical estimate of threshold values. Environ. Res. 2021, 194, 110663. [Google Scholar] [CrossRef]
- Shao, M.; Wang, W.; Yuan, B.; Parrish, D.D.; Li, X.; Lu, K.; Wu, L.; Wang, X.; Mo, Z.; Yang, S.; et al. Quantifying the role of PM2. 5 dropping in variations of ground-level ozone: Inter-comparison between Beijing and Los Angeles. Sci. Total Environ. 2021, 788, 147712. [Google Scholar] [CrossRef] [PubMed]
- Erickson, L.E.; Newmark, G.L.; Higgins, M.J.; Wang, Z. Nitrogen Oxides and Ozone in Urban Air: A Review of 50 Plus Years of Progress. Environ. Prog. Sustain. Energy 2020, 39, e13484. [Google Scholar] [CrossRef]
- Bhandari, S.; Rushi, A. (Eds.) Materials for Chemical Sensors; CRC Press: Boca Raton, FL, USA, 2023. [Google Scholar] [CrossRef]
- Al-Okby, M.F.R.; Neubert, S.; Roddelkopf, T.; Thurow, K. Mobile detection and alarming systems for hazardous gases and volatile chemicals in laboratories and industrial locations. Sensors 2021, 21, 8128. [Google Scholar] [CrossRef]
- McHugh, E.G.; Grady, S.T.; Collins, C.M.; Moy, M.L.; Hart, J.E.; Coull, B.A.; Schwartz, J.D.; Koutrakis, P.; Zhang, J.; Garshick, E. Pulmonary, inflammatory, and oxidative effects of indoor nitrogen dioxide in patients with COPD. Environ. Epidemiol. 2023, 7, e271. [Google Scholar]
- Karimi, A.; Shirmardi, M.; Hadei, M.; Birgani, Y.T.; Neisi, A.; Takdastan, A.; Goudarzi, G. Concentrations and health effects of short-and long-term exposure to PM2.5, NO2, and O3 in ambient air of Ahvaz city, Iran (2014–2017). Ecotoxicol. Environ. Saf. 2019, 180, 542–548. [Google Scholar]
- Finkel, A.M.; Johns, D.O.; Whittaker, C. Occupational Risk Assessment. In Risk Assessment for Environmental Health; CRC Press: Boca Raton, FL, USA, 2022; pp. 225–265. [Google Scholar]
- Rhee, M.S.; Lindquist, C.D.; Silvestrini, M.T.; Chan, A.C.; Ong, J.J.; Sharma, V.K. Carbon dioxide increases with face masks but remains below short-term NIOSH limits. BMC Infect. Dis. 2021, 21, 354. [Google Scholar]
- Lin, J.; Kilani, M.; Mao, G. Recent advances in integrating 1D nanomaterials into chemiresistive gas sensor devices. Adv. Mater. Technol. 2023, 8, 2202038. [Google Scholar] [CrossRef]
- Zhao, J.; Wang, H.; Cai, Y.; Zhao, J.; Gao, Z.; Song, Y.Y. The challenges and opportunities for TiO2 nanostructures in gas sensing. ACS Sens. 2024, 9, 1644–1655. [Google Scholar] [CrossRef]
- Umar, A.; Akbar, S.; Kumar, R.; Amu-Darko, J.N.O.; Hussain, S.; Ibrahim, A.A.; Alhamami, M.A.; Almehbad, N.; Almas, T.; Seliem, A.F. Ce-doped ZnO nanostructures: A promising platform for NO2 gas sensing. Chemosphere 2024, 349, 140838. [Google Scholar] [CrossRef] [PubMed]
- Li, X.; Fu, L.; Karimi-Maleh, H.; Chen, F.; Zhao, S. Innovations in WO3 gas sensors: Nanostructure engineering, functionalization, and future perspectives. Heliyon 2024, 10, e27740. [Google Scholar] [CrossRef] [PubMed]
- Amudhavalli, B.; Mariappan, R.; Prasath, M.; Jayaprakash, R.N. Fabrication and characterization of thin film CdO nanoparticles for gas sensing applications. J. Mater. Sci. Mater. Electron. 2024, 35, 547. [Google Scholar] [CrossRef]
- Toloman, D.; Popa, A.; Stefan, M.; Silipas, T.D.; Suciu, R.C.; Barbu-Tudoran, L.; Pana, O. Enhanced photocatalytic activity of Co doped SnO2 nanoparticles by controlling the oxygen vacancy states. Opt. Mater. 2020, 110, 110472. [Google Scholar] [CrossRef]
- Rahal, A.; Benramache, S.; Benhaoua, B. The effect of the film thickness and doping content of SnO2:F thin films prepared by the ultrasonic spray method. J. Semicond. 2013, 34, 093003. [Google Scholar] [CrossRef]
- da Rocha, J.D.G.; Cechinel, M.A.P.; Rocha, L.F.; Riella, H.G.; Padoin, N.; Soares, C. Exploring the Potential of Rare Earth Doped Carbon Dots: Concepts and Applications. Chem. Eng. J. Adv. 2024, 17, 100583. [Google Scholar] [CrossRef]
- Kumari, H.; Sonia Chahal, S.; Suman Kumar, P.; Kumar, A.; Parmar, R. Sol–gel synthesis and characterization of Gd-doped SnO2 nanoparticles for water treatment and spintronic applications. J. Mater. Sci. Mater. Electron. 2024, 35, 212. [Google Scholar] [CrossRef]
- Maheswari, S.; Karunakaran, M.; Kasirajan, K.; Bruno Chandrasekar, L.; Boomi, P. Yttrium-substituted SnO2 thin films and its gas sensing activity against NH3 gas: Characterization and sensitivity evaluation. Sens. Actuators A Phys. 2020, 315, 112303. [Google Scholar] [CrossRef]
- Bhatia, S.; Verma, N.; Kumar, R. Morphologically-dependent photocatalytic and gas sensing application of Dy-doped ZnO nanoparticles. J. Alloys Compd. 2017, 726, 1274–1285. [Google Scholar] [CrossRef]
- Singh, G.; Kaur, M.; Arora, B.; Singh, R.C. Investigation of ethanol gas sensing properties of Dy-doped SnO2 nanostructures. J. Mater. Sci. Mater. Electron. 2017, 29, 867–875. [Google Scholar] [CrossRef]
- Shaikh, F.I.; Chikhale, L.P.; Nadargi, D.Y.; Mulla, I.S.; Suryavanshi, S.S. Structural, Optical and Ethanol Sensing Properties of Dy-Doped SnO2 Nanoparticles. J. Electron. Mater. 2018, 47, 3817–3828. [Google Scholar] [CrossRef]
- Michel, C.R.; Martínez-Preciado, A.H.; Lopez-Alvarez, M.A.; Bernhardt, G.P.; Rivera-Mayorga, J.A. Novel CO and CO2 Sensor Based on Nanostructured Dy2O3 Microspheres Synthesized by the Coprecipitation Method. In Functional Nanomaterials: Advances in Gas Sensing Technologies; Springer: Singapore, 2020; pp. 95–116. [Google Scholar] [CrossRef]
- Alagh, A.; Annanouch, F.E.; Umek, P.; Bittencourt, C.; Sierra-Castillo, A.; Haye, E.; Colomer, J.F.; Llobet, E. CVD growth of self-assembled 2D and 1D WS2 nanomaterials for the ultrasensitive detection of NO2. Sens. Actuators B Chem. 2020, 326, 128813. [Google Scholar] [CrossRef]
- Qiang, Y.; Xie, Y.; Qi, Y.; Wei, P.; Shi, H.; Geng, C.; Liu, H. Enhanced performance of carbon-based perovskite solar cells with a Li+-doped SnO2 electron transport layer and Al2O3 scaffold layer. Sol. Energy 2020, 201, 523–529. [Google Scholar] [CrossRef]
- Sharma, D.; Tripathi, S.; Panwar, R.S.; Dhillon, G.; Bhatia, A.K.; Vashisht, D.; Mehta, S.K.; Kumar, N. Crystal chemistry and physicochemical investigation of aliovalent substituted SnO2 nanoparticles. Vacuum 2021, 184, 109925. [Google Scholar] [CrossRef]
- Habte, A.G.; Hone, F.G.; Dejene, F.B. Zn doping effect on the properties of SnO2 nanostructure by co-precipitation technique. Appl. Phys. A 2019, 125, 402. [Google Scholar] [CrossRef]
- Khudiar, A.I.; Oufi, A.M. Influence of the aluminium doping on the physical and gas sensing properties of SnO2 for H2 gas detection. Sens. Actuators B Chem. 2021, 340, 129633. [Google Scholar] [CrossRef]
- Ramarajan, R.; Kovendhan, M.; Thangaraju, K.; Joseph, D.P.; Babu, R.R.; Elumalai, V. Enhanced optical transparency and electrical conductivity of Ba and Sb co-doped SnO2 thin films. J. Alloys Compd. 2020, 823, 153709. [Google Scholar] [CrossRef]
- Hemmedi, I.; Bitri, N.; Harrathi, F.; Ly, I. Influence of dysprosium-doped nanoparticles on the physico-chemical properties of spray-deposited CuO thin films for photocatalytic degradation of methylene blue. J. Mater. Sci. Mater. Electron. 2023, 34, 2306. [Google Scholar] [CrossRef]
- Mezyen, M.; El Fidha, G.; Bitri, N.; Harrathi, F.; Ly, I.; Llobet, E. Visible light activated SnO2: Dy thin films for the photocatalytic degradation of methylene blue. RSC Adv. 2023, 13, 31151–31166. [Google Scholar] [CrossRef]
- Ahmed, N.M.; Sabah, F.A.; Abdulgafour, H.I.; Alsadig, A.; Sulieman, A.; Alkhoaryef, M. The effect of post annealing temperature on grain size of indium-tin-oxide for optical and electrical properties improvement. Results Phys. 2019, 13, 102159. [Google Scholar] [CrossRef]
- Prathap, P.; Revathi, N.; Venkata Subbaiah, Y.P.; Ramakrishna Reddy, K.T. Thickness effect on the microstructure, morphology and optoelectronic properties of ZnS films. J. Phys. Condens. Matter 2007, 20, 035205. [Google Scholar] [CrossRef]
- Karoui, M.B.; Kaddachi, Z.; Gharbi, R. Optical properties of nanostructured TiO2 thin films. J. Phys. Conf. Ser. 2015, 596, 012012. [Google Scholar]
- Harrathi, F.; Aubry, E.; Dridi, S.; Briois, P.; Bitri, N. Effect of the substrate temperature on the synthesis of the Cu2CoSnS4 thin films by spray pyrolysis for solar cells devices. J. Mater. Sci. Mater. Electron. 2023, 34, 304. [Google Scholar] [CrossRef]
- Balakarthikeyan, R.; Santhanam, A.; Khan, A.; El-Toni, A.M.; Ansari, A.A.; Imran, A.; Shkir, M.; AlFaify, S. Performance analysis of SnS thin films fabricated using thermal evaporation technique for photodetector applications. Optik 2021, 244, 167460. [Google Scholar] [CrossRef]
- So, H.S.; Park, J.-W.; Jung, D.H.; Ko, K.H.; Lee, H. Optical properties of amorphous and crystalline Sb-doped SnO2 thin films studied with spectroscopic ellipsometry: Optical gap energy and effective mass. J. Appl. Phys. 2015, 118, 085303. [Google Scholar] [CrossRef]
- Rambadey, O.V.; Kumar, A.; Sagdeo, P.R. Investigating the correlation between the Urbach energy and asymmetry parameter of the Raman mode in semiconductors. Phys. Rev. B 2021, 104, 245205. [Google Scholar] [CrossRef]
- Boucherka, T.; Brihi, N.; Berbadj, A.; Touati, M. Effect of indium doping on the UV photoluminescence emission, structural, electrical and optical properties of spin-coating deposited SnO2 thin films. Optik 2020, 209, 164586. [Google Scholar] [CrossRef]
- Shah, U.A.; Wang, A.; Irfan Ullah, M.; Ishaq, M.; Shah, I.A.; Zeng, Y.; Abbasi, M.S.; Umair, M.A.; Farooq, U.; Liang, G.X.; et al. A deep dive into Cu2ZnSnS4 (CZTS) solar cells: A review of exploring roadblocks, breakthroughs, and shaping the future. Small 2024, 20, 2310584. [Google Scholar] [CrossRef] [PubMed]
- Senthilkumar, P.; Raja, S.; Ramesh Babu, R.; Kavinkumar, V.; Jothivenkatachalam, K.; Vasuki, G. Impact of Ta doping on the optoelectronic and catalytic properties of SnO2 thin films. Appl. Phys. A 2023, 129, 675. [Google Scholar] [CrossRef]
- Kwon, Y.M.; Purbia, R.; Kim, H.-D.; Lee, Y.S.; Shin, H.; Baik, J.M. Zero-dimensional Heterostructures: N-Doped Graphene Dots/SnO2 for Ultrasensitive and Selective NO2 Gas Sensing at Low Temperatures. J. Mater. Chem. A 2020, 8, 11734–11742. [Google Scholar] [CrossRef]
- Anupriya, J.; Rajakumaran, R.; Chen, S.M.; Karthik, R.; Kumar, J.V.; Shim, J.J.; Shafi, P.M.; Lee, J.W. Raspberry-like CuWO4 hollow spheres anchored on sulfur-doped g-C3N4 composite: An efficient electrocatalyst for selective electrochemical detection of antibiotic drug nitrofurazone. Chemosphere 2022, 296, 133997. [Google Scholar] [CrossRef]
- Sharma, R.; Patel, M.; Kumar, A. Inversion layer formation in SnO2 gas sensors: A low-concentration response study. Sens. Actuators B Chem. 2019, 283, 789–798. [Google Scholar]
- El Fidha, G.; Bitri, N.; Mahjoubi, S.; Chaabouni, F.; Llobet, E.; Casanova-Chafer, J. Dysprosium doped zinc oxide for NO2 Gas sensing. Sensors 2022, 22, 5173. [Google Scholar] [CrossRef] [PubMed]
- Jansi Santhosam, A.; Ravichandran, K.; Ahamad, T. Donated free electrons induced enhancement in the NH3 sensing ability of ZnO thin films-Effect of terbium loading. Sens. Actuators A Phys. 2020, 316, 112376. [Google Scholar] [CrossRef]
- Feng, Z.; Gorrasi, G.; Sorrentino, A.; Vittoria, V.; Milone, C. Investigation on Sensing Performance of Highly Doped Sb/SnO2. Sensors 2022, 22, 1233. [Google Scholar] [CrossRef]
- Korotcenkov, G.; Boris, I.; Brinzari, V.; Han, S.H.; Cho, B.K. The role of doping effect on the response of SnO2-based thin film gas sensors: Analysis based on the results obtained for Co-doped SnO2 films deposited by spray pyrolysis. Sens. Actuators B Chem. 2013, 182, 112–124. [Google Scholar] [CrossRef]
- Tournier, G.; Pijolat, C.; Pijolat, M. Influence of sensor aging on the gas response of SnO2-based gas sensors. Sensors 2018, 18, 254. [Google Scholar]
- Righettoni, M.; Amann, A.; Pratsinis, S.E. Breath analysis by nanostructured metal oxides as chemo-resistive gas sensors. Angew. Chem. Int. Ed. 2010, 49, 4468–4481. [Google Scholar] [CrossRef]
- Siciliano, P.; Capone, S.; Forleo, A.; Francioso, L. Metal oxide gas sensors: Fundamentals and applications in medical diagnostics. J. Mater. Chem. C 2022, 10, 1234–1249. [Google Scholar]
- Deb, M.; Lu, C.J.; Zan, H.W. Achieving room-temperature ppb-level H2S detection in a Au-SnO2 sensor with low voltage enhancement effect. ACS Sens. 2024, 9, 4568–4577. [Google Scholar] [CrossRef]
- Xu, K.; Tian, S.; Zhu, J.; Yang, Y.; Shi, J.; Yu, T.; Yuan, C. High selectivity of sulfur-doped SnO2 in NO2 detection at lower operating temperatures. Nanoscale 2018, 10, 20761–20771. [Google Scholar] [PubMed]
- Matakgane, M.; Mokoena, T.P.; Mhlongo, M.R. Recent trends of oxides heterostructures based upconversion phosphors for improving power efficiencies of solar cells: A review. Inorg. Chem. Commun. 2023, 156, 111202. [Google Scholar] [CrossRef]
- Sohal, M.K.; Mahajan, A.; Gasso, S.; Nahirniak, S.V.; Dontsova, T.A.; Singh, R.C. Modification of SnO2 surface oxygen vacancies through Er doping for ultralow NO2 detection. Mater. Res. Bull. 2020, 133, 111051. [Google Scholar] [CrossRef]
- Zhang, Z.; Gao, Z.; Fang, R.; Li, H.; He, W.; Du, C. UV-assisted room temperature NO2 sensor using monolayer graphene decorated with SnO2 nanoparticles. Ceram. Int. 2019, 46, 2255–2260. [Google Scholar] [CrossRef]
- Yan, W.; Zhu, K.; Cui, Y.; Li, Y.; Dai, T.; Cui, S.; Shen, X. NO2 detection and redox capacitance reaction of Ag doped SnO2/rGO aerogel at room temperature. J. Alloys Compd. 2021, 886, 161287. [Google Scholar] [CrossRef]
- Gattu, K.P.; Ghule, K.; Kashale, A.A.; Patil, V.B.; Phase, D.M.; Mane, R.S.; Han, S.H.; Sharma, R.; Ghule, A.V. Bio-green synthesis of Ni-doped tin oxide nanoparticles and its influence on gas sensing properties. RSC Adv. 2015, 5, 72849–72856. [Google Scholar] [CrossRef]
- Verma, M.; Bahuguna, G.; Shukla, S.; Gupta, R. SnO2 Nanoparticle-Reduced Graphene Oxide Hybrids for Highly Selective and Sensitive NO2 Sensors Fabricated Using a Component Combinatorial Approach. ACS Appl. Nano Mater. 2022, 5, 19053–19061. [Google Scholar]
- Zhang, S.; Xing, M.; Zheng, Y.; Zhang, B.; Luo, N.; Wang, Y.; Zhang, Z. Humidity-independent gas sensor based on Pt/SnO2/NiO with advanced CO sensing capabilities. J. Alloys Compd. 2025, 1010, 177712. [Google Scholar]
- Wang, C.; Yin, L.; Zhang, L.; Xiang, D.; Gao, R. Metal oxide gas sensors: Sensitivity and influencing factors. Sensors 2000, 10, 2088–2106. [Google Scholar]
- Kumar, A.; Singh, R.; Sharma, G. Influence of film thickness and microstructure on the gas sensing properties of SnO2 thin films. SN Appl. Sci. 2025, 7, 254–263. [Google Scholar]
- Kaur, N.; Zappa, D.; Comini, E. Shelf life study of NiO nanowire sensors for NO2 detection. Electron. Mater. Lett. 2019, 15, 743–749. [Google Scholar] [CrossRef]
- Hild, F.; Eichenberger, L.; Bouché, A.; Devaux, X.; Stoffel, M.; Rinnert, H.; Vergnat, M. Structural and Photoluminescence Properties of Evaporated SnO2 Thin Films Doped with Rare Earths. Energy Procedia 2015, 84, 141–148. [Google Scholar] [CrossRef]
- Bose, K.; Kesavan, R.; Deepa, S. Effect of dysprosium doping on the structural and gas sensing properties of SnO2 thin films. AIP Conf. Proc. 2020, 2263, 040001. [Google Scholar] [CrossRef]
- Speckbacher, M.; Treu, J.; Whittles, T.J.; Linhart, W.M.; Xu, X.; Saller, K.; Dhanak, V.R.; Abstreiter, G.; Finley, J.J.; Veal, T.D.; et al. Direct Measurements of Fermi Level Pinning at the Surface of Intrinsically n-Type InGaAs Nanowires. Nano Lett. 2016, 16, 5135–5142. [Google Scholar] [CrossRef]
- Janicki, Ł.; Misiewicz, J.; Siekacz, M.; Turski, H.; Moneta, J.; Gorantla, S.; Skierbiszewski, C.; Kudrawiec, R. Sensitivity of N-polar GaN surface barrier to ambient gases. Sens. Actuators B Chem. 2019, 281, 561–567. [Google Scholar] [CrossRef]
Disclaimer/Publisher’s Note: The statements, opinions and data contained in all publications are solely those of the individual author(s) and contributor(s) and not of MDPI and/or the editor(s). MDPI and/or the editor(s) disclaim responsibility for any injury to people or property resulting from any ideas, methods, instructions or products referred to in the content. |
© 2025 by the authors. Licensee MDPI, Basel, Switzerland. This article is an open access article distributed under the terms and conditions of the Creative Commons Attribution (CC BY) license (https://creativecommons.org/licenses/by/4.0/).

