Article

Sodium Alginate Cross-Linkable Planar 1D Photonic Crystals as a Promising Tool for Pb2+ Detection in Water

Dipartimento di Chimica e Chimica Industriale, Università degli Studi di Genova, via Dodecaneso 31, 16146 Genova, Italy
*
Author to whom correspondence should be addressed.
Chemosensors 2020, 8(2), 37; https://doi.org/10.3390/chemosensors8020037
Submission received: 10 March 2020 / Revised: 22 May 2020 / Accepted: 3 June 2020 / Published: 4 June 2020

Abstract

:
Due to its high toxicity, Pb2+ pollution is a serious threat for human health and environments. However, in situ real-time detection of Pb2+ pollution is difficult and laboratory instruments are usually required. Then, the possibility to monitor water quality without laboratory instruments could lead to the extensive assessment of polluted water sources, especially in rural environments and developing countries where large lead concentrations are often found in surface water. Consequently, new simple colorimetric sensors are highly interesting in the field. In this work we report for the first time disposable polymer planar 1D photonic crystals made of poly (N-vinylcarbazole) as high refractive index medium and sodium alginate as low refractive index and active medium for the detection of Pb2+ in water. The detection relies on the ionic exchange occurring into the alginate matrix. This process effectively induces a physical cross-linking phenomenon, which inhibits water solubilization of the polymer. In turn, this affects the spectral response of the planar 1D photonic crystals modifying its color.

1. Introduction

Lead is a toxic poisonous substance for humans and animals. In recent years, several Pb2+ leaches from water piping to drinking water made it an important health threat, especially for elder people and infants [1,2]. Indeed, Pb2+ exposure causes blood and nervous disorders [3], as it is easily complexed by biomolecules containing oxygen, nitrogen and sulfur. This complexation can affect protein structures and enzymatic processes [4]. In addition, lead is a great threat also for animal and plant life [5,6]. Nowadays, national regulations limit the content of heavy metals in drinking water. According to European and United States drinking water directive, the maximum amount of lead allowed in water for human consumption is 10 μg/L in the European Union [7] and 15 μg/L in the United States. In developing countries, these limits are hardly respected due to a wide series of industrial/social reasons. In this regard, several recent works showed that lead concentration in waste water [8,9], natural rivers [10,11] and even drinking water [12] reaches maximum values of milligrams per liter, well above the limits and not compatible with human and animal life. For example, Pb2+ concentration in the Ganges river in India can approach 27 mg/L (10−4 M), depending on the investigation site and season [13]. Consequently, the possibility to semi-quantitively detect lead with a fast, simple and cost-effective sensor represents an important milestone. Unfortunately, sampling is often not representative, especially for different timeframes. Moreover, costly and time demanding laboratory analyses makes real time monitoring of pollution nearly impossible [14,15]. These data makes it clear we need an effective approach to perform preliminary, yet extensive screening of lead concentration in a wide variety of situations—eventually performing other characterizations in the case of anomaly detection. So far, extensive monitoring was employed for oxygen detection and assessment of turbidity in water distribution plants [16] but fast, low cost and continuous detection of hazardous pollutants still remains an open issue. In this regard, several detection systems based on surface plasmon resonance [17,18,19], fluorescent molecules or nanocrystals [20,21,22], chemical receptors [23], as well as electrochemical [24,25,26,27,28], liquid crystals [29], colloidal PhCs [30] or sophisticated structures [31] showed low detection limits ranging from 10−4 to 10−12 M (101–10−7 mg/L) to Pb2+. Among systems for real time sensing, polymers and mesoporous inorganic planar 1D photonic crystals, namely distributed Bragg reflectors (DBRs), are interesting tools for continuous colorimetric detection [32]. DBRs are made of thin films of materials with different refractive index alternated with defined periodicity to form submicrometric lattices [32]. When the periodicity is comparable with the wavelength of visible light, its interaction with these lattices generates diffraction patterns like that observed for atomic and molecular crystals, but spectrally overlapped to the visible range. These diffraction patterns are characterized by intense reflectance peaks that correspond to the photonic band gaps (PBG), which are frequency regions where photons cannot propagate within the lattice and, as mentioned above, are diffracted backward. These characteristics may allow naked eye detection of the DBR response as brilliant iridescent colors and makes it detectable by simple means of reflectance and transmittance UV-Vis spectroscopy [33].
Since the first reports on DBRs, bulky inorganic structures have been exploited in fields related to light control [34,35,36]. It was only recently, when easy processing and low fabrication costs made polymers highly appealing in several fields [37,38,39], that the interest in polymer DBRs [40,41] and other polymeric photonic structures such as responsive opals [42] and infiltrated opals [43,44,45,46], block copolymer systems [47,48] and imprinted structures [49], increased and allowed highly responsive colorimetric sensors. Indeed, oppositely to inorganic media, when a polymer DBR lattice is subjected to an external stimulus [50,51], the light optical path within the multilayer, and in turn the optical response, can be affected owing to both thickness and refractive index variations. This principle has been largely used for the measurement of pH, temperature, pressure and chemical specie in the vapor phase [52,53,54]. Concerning water pollution instead, early reports demonstrated the use of block copolymer DBRs for the detection of anions [48,55]. These self-assembled lattices can detect and distinguish several anions. On the other hand, their synthesis is highly costly, and self-assembling into periodical nanostructures is rather complex. These issues can be overcome employing spun-cast [56] or melt-processed [57,58,59,60,61] DBRs made of amorphous or semicrystalline polymers. To this extent, polymer DBRs demonstrated high sensitivity to a variety of vapor phase analytes, including alcohols [53], aryl and halogenated hydrocarbons [56] and even perfluorinated compounds [62]. However, besides these capabilities, detection in liquid environment is an issue for these structures. Indeed, sensitivity to an analyte requires large interaction between the polymer constituting the DBR and the liquid analyte itself, thus making sensor dissolution in the liquid highly probable. To avoid the complete dissolution in water yet allowing the polymer DBR responsivity to Pb2+, we engineered a multilayered structure alternating layers of poly (N-vinylcarbazole) (PVK) and sodium alginate (SA). PVK is a common high refractive index medium used in polymer DBRs, while SA is a natural biodegradable linear polysaccharide mainly extracted from the cell wall of brown algae and widely used for biomedical, food and technological applications [63,64,65,66,67,68,69,70].
Polysaccharide-based hydrogels, whose properties can be tuned simply changing the cross-linking conditions [71,72,73] are structures able to adsorb big quantities of water, making them extremely promising products for water quality investigation [74,75,76,77,78]. Their ability to absorb water is related to the hydrophilic functional groups attached to the polymer backbone, whereas their dissolution resistance is due to the cross-linking points between the macromolecules [79]. With this in mind, hydrogel-based sensors represent an alternative and promising approach for the detection of water contamination. In particular, sodium alginate, beside its large solubility in water, undergoes a fast physical cross-linking when in contact with bivalent and trivalent ions such as Pb2+ according to the so-called “egg-box” model [80,81,82,83]. The SA structure and the cross-linking egg-box model are represented in Figure 1. There, the guluronic acid residues of the polymer are directly coordinated by Pb2+ to form a water insoluble, permanent 3D-network [83,84,85,86]. Owing to the low amount of ions required for the cross-linking reaction, such phenomenon can be exploited to assess the presence of Pb2+ in water [71,72,73].
In this work we employ SA in spun-cast polymer DBRs for the detection of Pb2+ ions in water in a concentration range commonly found in polluted surface water. In details, we demonstrate the use of SA together with poly(N-vinylcarbazole) as DBR building block for the first time. After the optical characterization of the new planar 1D photonic crystal, we test and analyze its dynamic behavior in water polluted with Pb2+ with different concentrations. All the characterizations are repeated for two DBR structures with different number of periods to confirm the optical behavior of the system.

2. Materials and Methods

DBRs were fabricated by the alternating spin-coating of SA (Sigma Aldrich, MV = 400 kDa, M/G 1.5) solution in deionized water with a concentration of 15 mg/mL (containing Triton X-100 with a concentration of 0.1% v/v to reduce the solution surface tension and increase the processability) and of PVK (Acros Organics, Mw = 40,000 kDa) solution in toluene with a concentration of 30 mg/mL. In a typical experiment, 100 μL of each solution were alternatively casted on a glass substrate and dried for 120 s at a rotation speed of 140 round per second to obtain 6.5 or 10.5 bilayers; first and last layers are always made of PVK. Once fabricated, the samples were baked for 120 s at 60 °C on a hotplate to remove any residual solvent. The samples were cut into portion and exposed to Pb2+ solutions (PbBr2, Sigma Aldrich) in deionized water with concentration ranging from 1 × 10⁻⁵ M to 1 × 10⁻² M in an aluminum cell connected to a reflectance fiber probe. The optical response of the DBRs was evaluated comparing the reflectance spectra collected after the first thermal annealing and after the desorption. Both the measurements were performed at room temperature. The optical response of the sensors was sampled at set intervals along the entire cation exposure using a halogen–deuterium DH-BAL-2000 light source and an CMOS spectrometer Avantes-2048-Evo for the detection. Steady state response was finally investigated after drying the sample in air at 60 °C. The reflectance spectra of the DBR structure were modeled using a transfer matrix method formalism as described in Ref. [32] using the refractive index dispersion of SA and PVK, which were retrieved from literature as input (nPVK,500 nm = 1.68, nSA, 500 nm = 1.51, Ref. [87,88,89]) and the geometric thickness of the layers as fitting parameters. The layer thicknesses were retrieved for the sample made of 10.5 periods and employed for the modeling of the structure made of 6.5 bilayers fabricated using the same conditions.

3. Results and Discussion

3.1. 10.5 Period DBRs

Figure 2a schematizes the DBRs fabricated in this work. There, thin films of SA and PVK are alternated to form a lattice. Figure 2b displays the normal incidence reflectance spectra collected over 9 different spots of the sample surface for the DBR made of 10.5 bilayers (see next paragraph for the same characterization for the sample made of 6.5 bilayers). All the spectra show two main features: first, an intense reflectance peak at about 510 nm with maximum value above 80%. This signal is assigned to the DBR PBG. The second feature is an oscillating pattern in the background of all the spectra. This pattern takes the name of Fabry–Pérot pattern and arises from the interference of beams partially reflected at the top and bottom interfaces of the photonic structure [32]. The presence of these two characteristics demonstrates that the DBRs possess good optical quality [90]. Moreover, the superimposition of the nine spectra proves the rather good homogeneity of the DBR structure. To the best of our knowledge, so far this is the first planar 1D photonic crystals containing SA reported in the literature.
To further confirm the PBG assignment, we also measured the angular resolved transmittance spectra of the photonic structure. The spectra are reported in Figure 2c for s-polarized light and in Figure 2d for p-polarized light (see Ref. [32] for further details regarding the measurement). The spectra are reported as contour-plot where the light wavelength is reported on the ordinate axis while the light incidence angle as the abscissa axis. The transmittance intensity is instead reported as a color scale such that low intensities are in blue shades and high intensity values in red shades. When illuminated with s-polarized light, the spectral position of the PBG, which was visible in blue tones in panel c of the Figure, moves to the blue wavelength side of the spectrum increasing the angle and its spectral width remains unchanged, although its relative intensity increases. Concerning p-polarization instead, the spectral position of the PBG follows the same pattern just observed. Conversely, its intensity and spectral width decreases with the angle till the feature almost disappears slightly above 60°, where the incident light approaches the Brewster angle for the structure. This behavior was in full agreement with previous reports for planar 1D photonic crystals [91] and with the photonic band structure predicted from theory [32,90]. The collected spectra were indeed in agreement with the modeled one for a structure having PVK and SA geometric thickness dPVK = 75 nm and dSA = 81 nm, respectively.
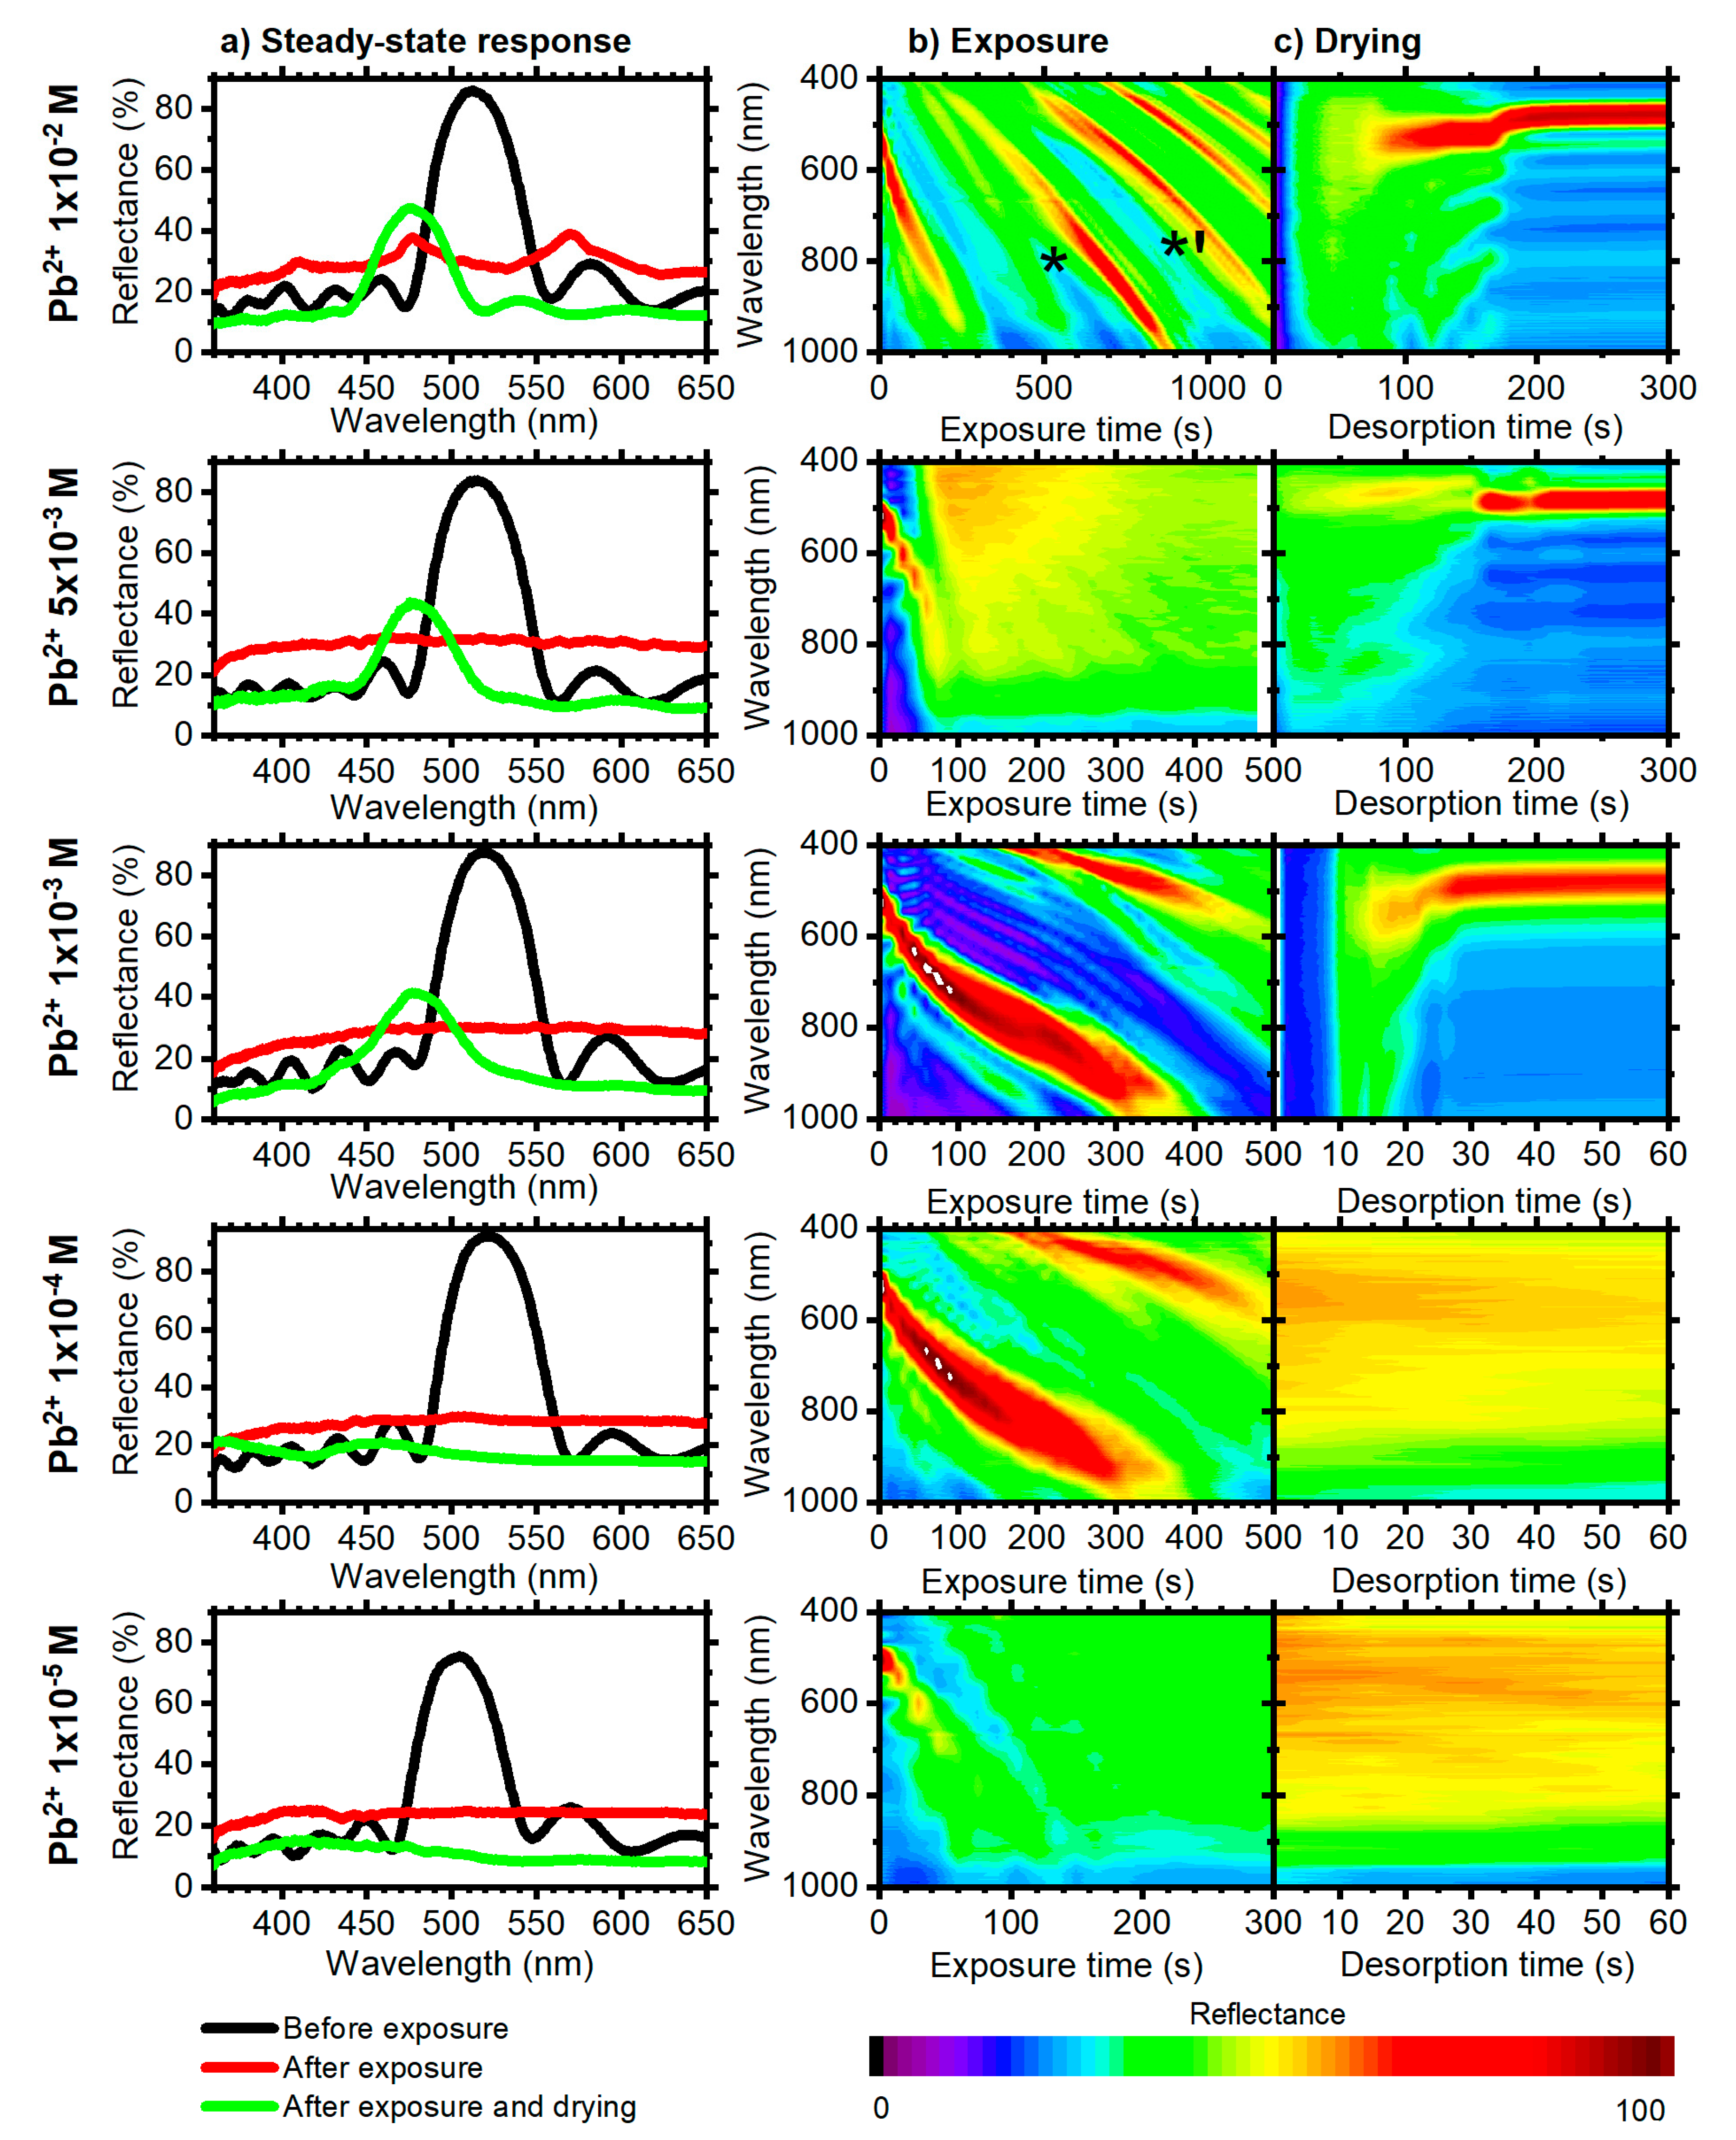
The sensitivity of the system to Pb2+ was tested immersing the DBR into water solution of Pb2+ ion with concentration of 1 × 10⁻² M. The top panels of Figure 3a show the normal incidence reflectance spectrum of the DBR before (black line) and after (red line) the sample swelling. Before the exposure, the sample show a clear signature of the PBG at about 510 nm and the spectrum background displays an interference pattern (black line). After the exposure, these features were slightly visible, and the reflectance was rather flat in the range between 25% and 35% (red line). This effect can be attributed to the severe swelling of the SA layers in water. Such phenomenon can indeed worse the lattice periodicity that generates the PBG and the surface optical quality that permits the interference pattern [53]. Removing the sample from the water environment and drying the structure at 60°C, the two spectral features were again visible (green line). Nevertheless, the spectral position of the PBG results blue-shifted to about 475 nm, about 39 nm lower with respect to its initial value. This phenomenon can be explained considering the shrinkage of SA layers after cross-linking; indeed, the physical “bridges” created by Pb2+ ions between alginate chains force the formed 3D-network to assume a more compact structure, which reduces the thickness of the DBR layers [92,93,94,95].
To better explain the phenomena occurring in the sensor, we monitored the entire spectral response during the swelling process reported in Figure 3b as a contour plot having the wavelength on the y-scale and the time on the x-scale. In figure we see that the PBG shifts to more than 100 nm within 5 min (300 s). At this time, notwithstanding the PBG was not detectable in the spectrum anymore, its higher order replicas were visible at about one half (marked with * in Figure 3b) and one third (marked with *’ in Figure 3b) of its wavelength. These higher diffraction orders continue red-shifting until up to the sixth order of diffraction was detected in the spectral range investigated at about 410 nm. This effect owes to the severe swelling of the structure that, on the other hand, maintains the periodicity. We can then infer that this large structure swelling was provided by a great water intake, while SA cross-linking reaction prevents the dissolution of the structure. Under this assumption we can estimate an increase of optical thickness (n times d) for the SA layers much larger than 100% with respect to the initial value. Indeed, the swelling degree of SA hydrogels can be larger than 1000%. Then, we can estimate a refractive index variation for the fully swollen structure up to ΔnSA = −11%. The refractive index variation for swelling processes was indeed often considered negligible with respect to the thickness variation [32,53,96].
The cross-linking was confirmed by the spectral behavior of the DBR during the drying process (Figure 3c, top panel) where the PBG was not detectable as soon as the water environment was removed. It becomes instead increasing evident from 80 s of drying, where the feature becomes clear in red shades. At this time, the spectral feature shifts to the blue side of the spectrum until it reaches about 475 nm—well below its initial position. As mentioned above, the smaller wavelength of the PBG testifies a reduction of the light optical path (refractive index times the thickness) within the structure. In details, the spectral position of the peak results blue-shifted by ~40 nm. It is known that the cross-linking process provides a volume reduction in SA up to 100% with respect to its initial value while refractive index variations can approach 4%–5% [88]. Then, in first approximation and in agreement with the literature, the refractive index variation can be again neglected with respect to thickness variation [97]. The spectral shift can then be related to a shrinking of the SA layers by −20% with respect to its initial value. Furthermore, the restoration of both PBG and interference pattern testifies that alginate did not dissolve under the experiment condition.
Notice that the large hysteresis in the sorption-desorption process, together with the non-reversible response that characterizes cross-linked polymers makes these systems unsuitable for repeated used. The hysteresis can be assigned to the very diverse conditions for swelling and desorption processes. Indeed, the first occurs in water environment while the second through water evaporation. As mentioned above, the lack of signal attributed to the PBG during the first stages of drying arises from different swelling degree of the DBR components and has been widely described in literature [54,97,98]. As previously reported [32], polymer multilayer sensors can be as small as few squared millimeters. The reduced size, together with the possibility to fabricate these structures on the very large area by industrial processes [59,60,61,99] makes them interesting low-cost disposable sensor.
The samples were then exposed to different concentrations of Pb2+ ions to test whether the optical response can be used to retrieve this parameter and the lower detection limit of the system. The bottom panels of Figure 3 report the full optical response of the DBR to concentrations of Pb2+ ranging between 5 × 10⁻³ to 1 × 10⁻⁵ M (the concentration value is reported at the left side of the y-axis). Again, panels a show the steady state response, while panels b and c show the full dynamic spectral evolution of the DBRs during exposure and desorption, respectively. As observed before, the PBG undergoes a blue-shift and a decrease in intensity upon exposure and drying (compare green and black lines in panels a). The responses appear rather similar to the one just observed, but with faster kinetics for decreasing concentrations (panels b and c). Moreover, the PBG intensity and spectral position collected after the drying decrease upon decreasing Pb2+ concentration. Indeed, low lead concentrations induce low cross-linking effect and then facile solubilization of the alginate layers in the swollen structure. The solubilization of the swollen alginate layers affects the periodicity of the dried samples that result thinner. With decreasing lead concentration, the PBG blue-shift increases and its profile were increasingly inhomogeneously broadened (compare green lines in Figure 3a). These were clear symptoms of thinner layers in the lattice and of disorder, respectively.
To confirm the presence of the PBG after exposure, Figure 4 shows the angular dispersion of the PBG after exposure and drying for the samples exposed to concentration down to 10−4 M. It was not possible to measure the spectra for the lower concentration (10−5 M) as the PBG spectral position ranges between 350 and 525 nm, close to the absorption inset of the glass substrate. Then, we can only infer than the broad feature detected in the bottom panel of Figure 3a was assigned to a PBG. Nevertheless, its intensity and spectral position follows the observed trend for ion concentration observed for the other samples. For concentration ranging from 10−2 to 10−3 the PBG dispersions reported as contour-plot fully resemble the data observed in Figure 2 for the unexposed structure. For the concentration 10−4 M, the low intensity of the PBG makes it hardly detectable in the contour plot then we also reported the pristine spectra collected for the sample. The bottom panels of Figure 4 display that for both polarizations the spectral position of the broad peak moves to the short wavelength side of the spectrum confirming its nature.

3.2. 6.5 Period DBRs

To confirm the behavior observed, we repeated the characterization for a DBR made of 6.5 bilayers. Figure 5a displays the normal incidence reflectance spectra collected over 9 different spots of the sample surface. All the spectra show an intense reflectance peak assigned to the PBG at about 510 nm with reflectance value above 60% and a Fabry–Pérot pattern. The superimposition of the nine spectra, demonstrates the rather good homogeneity of the DBR. The angular resolved transmittance spectra are reported in Figure 5b,c for p-polarized and s-polarized light, respectively. When illuminated with p-polarized light, the spectral position of the PBG, which was visible in blue tones in panel b, moves to the short wavelengths increasing the angle, and its spectral width decreases approaching the Brewster angle. Concerning s-polarization, the PBG position follows the same trend, while its intensity slightly changes. This behavior agrees with the data collected for the 10.5 bilayer sample. The lower intensity of the peaks assigned to PBG owes to the lower number of periods composing the structure. The collected spectra were indeed well-superimposed on the modeled one (black dotted line) using the geometric thickness retrieved from the fitting of the spectra of the sample made of 10.5 bilayers.
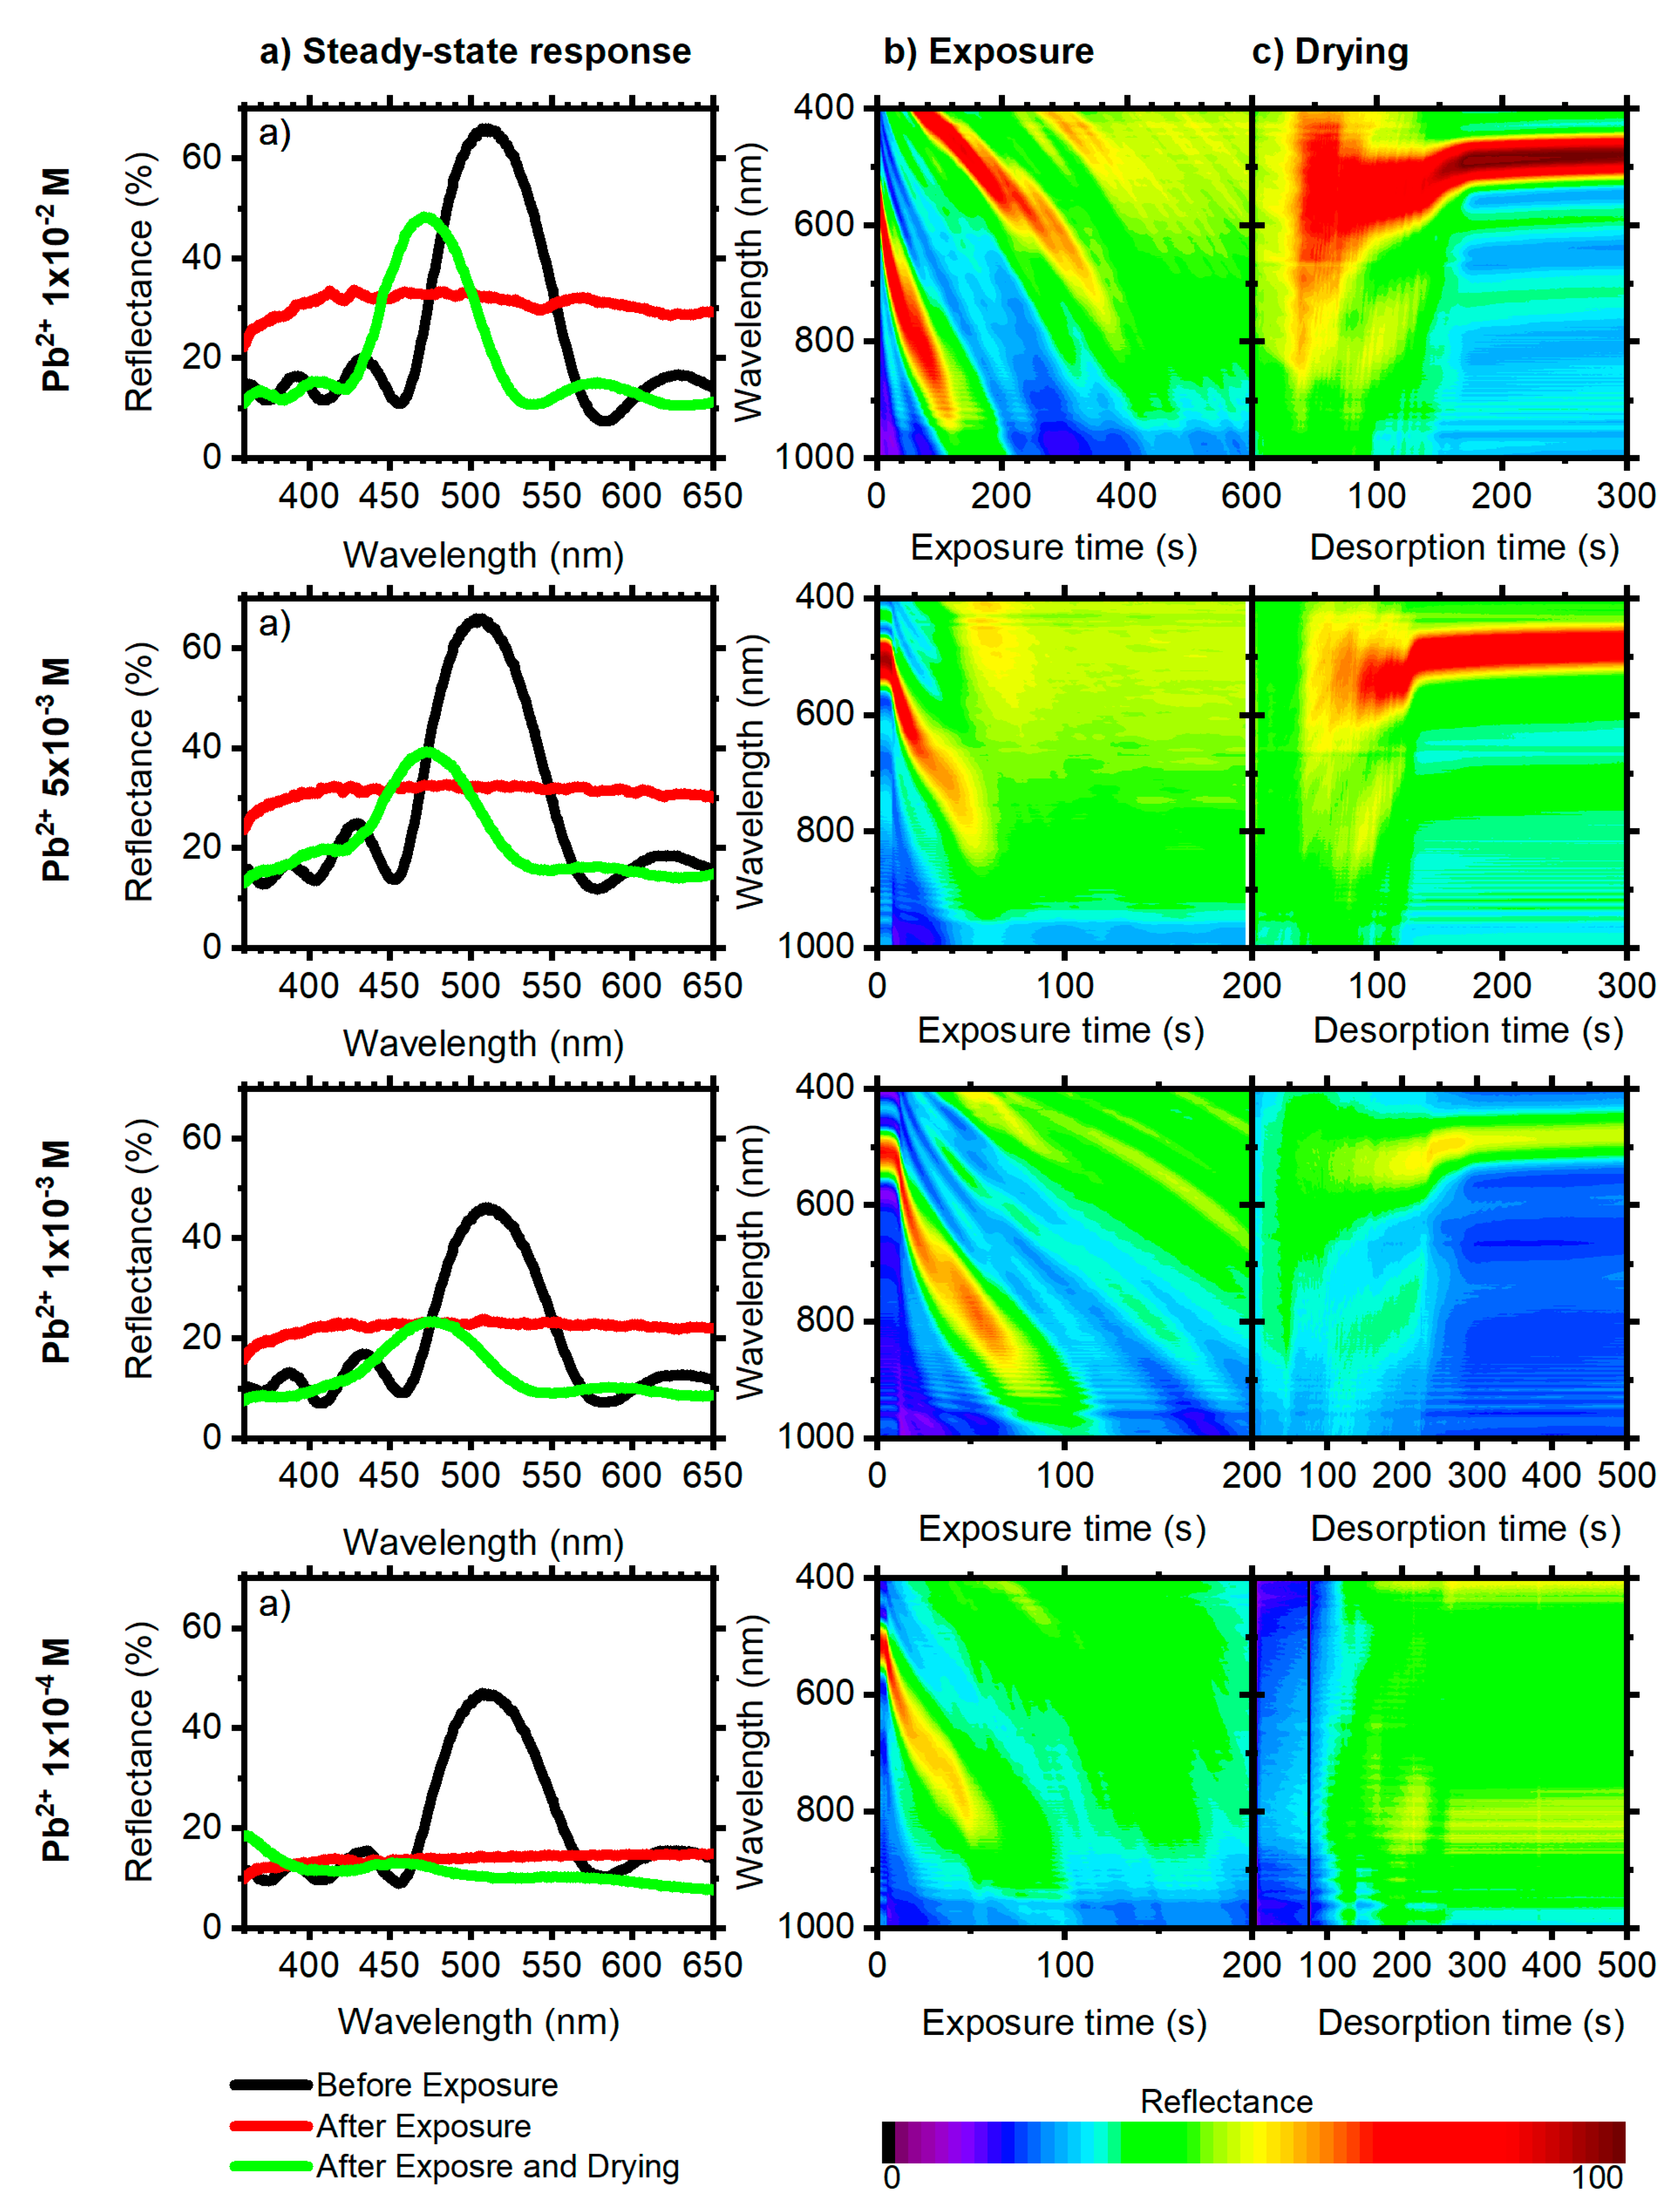
The DBR was then portioned and exposed to Pb2+ solutions with concentration ranging from 1 × 10⁻² to 1 × 10⁻⁴ M. The low number of periods allows faster sorption kinetics and makes improbable the possibility to detect concentrations lower than 10−4 M. Figure 6 reports the exposure data collected for Pb2+ concentrations of 1 × 10⁻², 5 × 10⁻³, 1 × 10⁻³ and 1 × 10⁻⁴ M, from top to bottom. In full agreement with the behavior observed in Figure 3, after the exposure the PBG blue-shifts and its intensity decreases for decreasing concentration (green lines in Figure 6a). Regarding the swelling kinetics it was faster than for the DBR with larger number of layers (Figure 6b). In agreement with theory, the diffusivity of small molecules into a slab, was indeed a function of its thickness for thin films [100]. For the largest Pb2+ concentration (10−2 M), all the features assigned to the PBGs fade at about 400 s of exposure. Then, the lower number of layers appears to facilitate the introduction of disorder in the structure. The behavior during desorption was analogous to that observed before, as no major differences were expected at the working temperature for thin films of comparable thickness (~1 μm for the 6.5 period DBR and ~1.6 μm for the 10.5 period). Overall, the very similar behavior observed for the two DBRS, together with the faster swelling and larger disorder of the 6.5 period one confirms the behavior of the sensor, whose response was ruled by antagonist cross-linking and dissolution phenomena.
To confirm that dissolution plays a fundamental role in the DBR response, we report its spectral behavior in deionized water (Figure 7). In this case, the SA layers easily dissolve and the PBG cannot be restored anymore. In Figure 7a, the DBR initially shows a PBG at about 490 nm. During the swelling all the structures fades in about 400 s (Figure 7b). Conversely to what observed for Pb2+ solutions, the spectral features cannot be restored anymore by the drying process (Figure 7c) and the resulting spectrum was a flat line (green line in Figure 7a).

3.3. Quantitative DBR Response

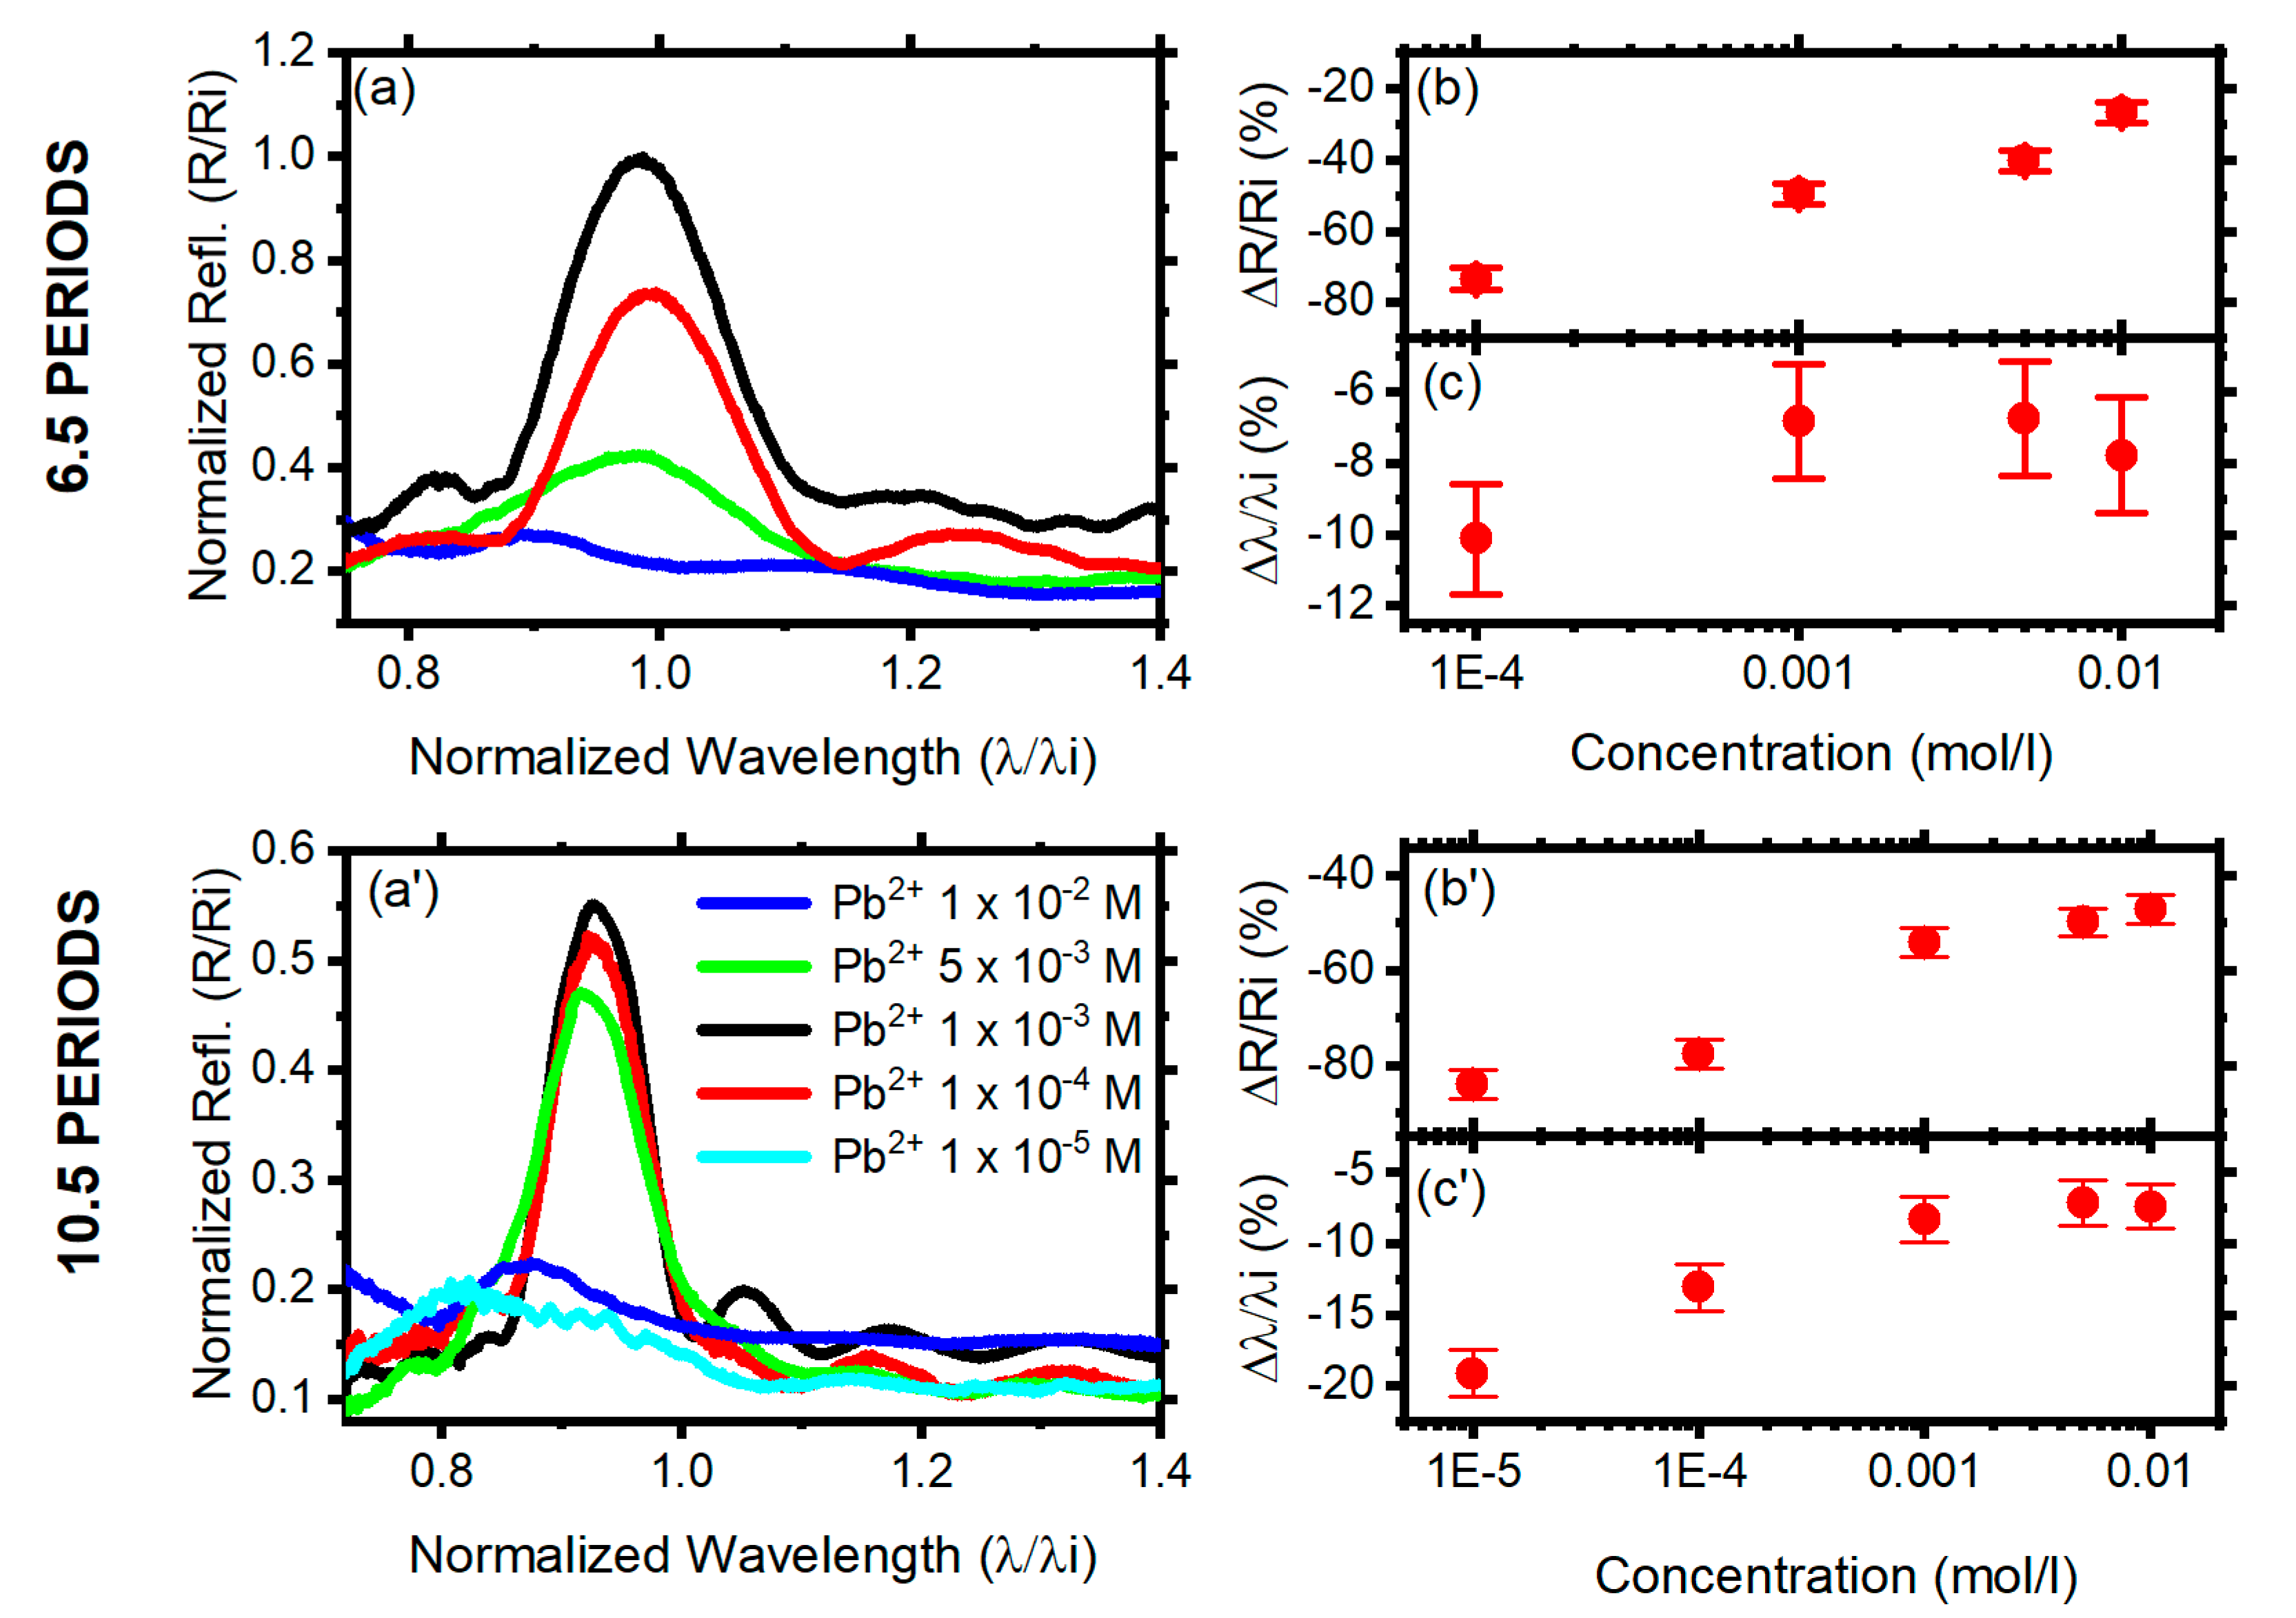
Due to small inhomogeneity of the DBR spectra (see Figure 2 and Figure 5), it was hard to quantify the spectral variations from the absolute PBG spectral positions and intensities measured before and after exposure and drying. Then, Figure 8 summarized the data relative to the initial spectral position and reflectance values for each sample for both the 6.5 (panel a–c) and 10.5 (panel a’–c’) period DBRs. The spectra of Figure 8a,a’ show that both PBG reflectance intensity and spectral position decrease with decreasing Pb2+ concentration for both the DBRs. Figure 8b,b’,c,c’ show the PBG spectral position and reflectance variation in percent, measured after sample swelling and drying. Both the variations increase for decreasing Pb2+ concentration. As discussed previously, this behavior can be explained considering competitive effects of SA dissolution and cross-linking. At large concentrations the alginate cross-links and shrinks. The reticulation was indeed well known to make the alginate insoluble in water solutions. At lower concentrations of divalent ions, the cross-linking was less efficient implying a partial solubilization of the polymer. This behavior was in full agreement with the data reported in Figure 3, Figure 6 and Figure 7. The partial solubilization of the alginate layers can indeed lead to its thinning and thus to the blue-shift of the PBG spectral feature. Concerning the reflectance value, such partial solubilization can introduce disorder in the DBR, reducing the reflectance intensity and introducing inhomogeneous broadening of the PBG spectral signature. Indeed, for decreasing lead concentration the PBG intensity decreases and its line–shape becomes asymmetrical [97]. Panels b and b’ show an exponential dependence between the reflectance reduction and the lead ion concentration in solution. In both cases it was possible to distinguish the investigated concentration values. Concerning the spectral shift instead, there was not a clear correlation for the 6.5 bilayers when exposed to the highest lead concentrations, while for smaller value the variation increases. For the 10.5-period instead, there was a clear exponential dependence between concentration and reflectance variation in the entire range (Figure 8b’). Concerning the spectral position variation, it decreases exponentially for concentrations from 1 × 10⁻³ to 1 × 10⁻⁵ M, while for larger values the variations reach a plateau. Then, we can reasonably assume that increasing the number of layers allows better sensitivity, especially for low lead concentrations and lower detection limit. This was probably due to the larger resistance of the structure having 10.5 bilayers with respect to the other one, as observed in Figure 3 and Figure 6.
Regarding a possible use of the proposed sensor in the real environment, effects of parameters like the presence of other divalent cations and the effect of pH should also be considered. In these regards, several studies proved that alginate-based hydrogels show a considerable selectivity in the adsorption of divalent ions from aqueous solutions and that the largest affinity with Pb2+ allow preferable cross-linking with the latter. For example, An et al. performed batch and column tests to evaluate the competitive sorption within alginate beads observing an affinity of the type of Pb2+ >> Cu2+ >> Ni2+ > Ca2+, with the adsorption behavior of Pb not influenced by the medium pH [101]. Similarly, Papageorgiou et al. obtained that the maximum metal adsorption capacities of alginate hydrogels followed the order Pb2+ > Cu2+ > Cd2+ [102], whereas Fatin-Rouge et al. showed that metal ions had the following affinity for Pb2+ >> Cu2+ > Zn2+ > Ni2+ with very good retentions obtained for Pb2+, Cu2+ and Zn2+ [103]. Yet, Sone et al. developed composite alginate-based foams for the selective elimination of Pb2+ from contaminated water [104]. Moreover, the literature show that the investigation of DBR sensor response kinetics during analytes intercalation or multivariate analysis provide the sensor with selectivity even among very similar analytes such as benzene and toluene [32,53] based on different weak interactions and diffusivity of the specie within the DBRs. Nevertheless, the selectivity of the system and thus its response to other contaminants is still to be investigated.

4. Conclusions

In conclusion, we demonstrated new all-polymer planar 1D photonic crystals processable by spin-coating deposition made of sodium alginate and poly (N-vinylcarbazole). The new structures possess high optical quality and optical behavior in agreement with theory. The new photonic system shows large swelling in water and sensitivity to Pb2+ ions owing to their ability to induce reticulation of alginate. The DBR demonstrated detection limit as low as 10−5 M and is promising for the development of Pb2+ sensing devices. Although, more analyses are needed to establish selectivity, enhance sensitivity and detection limit of the sensor, these results pave the way for the development of disposable chromatic sensors to be used in situ even by nonspecialized people.

Author Contributions

Conceptualization, A.D., P.L., M.C., D.C., S.V.; methodology, P.L.; validation, A.D.; formal analysis, A.D., P.L.; investigation, A.D., P.L.; resources, D.C., M.C.; writing—original draft preparation, P.L.; writing—review and editing, A.D., P.L., M.C., D.C., S.V.; supervision, D.C., M.C. All authors have read and agreed to the published version of the manuscript.

Funding

This research received no external funding.

Conflicts of Interest

The authors declare no conflict of interest.

References

  1. Halim, C.E.; Scott, J.A.; Natawardaya, H.; Amal, R.; Beydoun, D.; Low, G. Comparison Between Acetic Acid and Landfill Leachates for the Leaching of Pb(II), Cd(II), As(V), And Cr(VI) from Cementitious Wastes. Environ. Sci. Technol. 2004, 38, 3977–3983. [Google Scholar] [CrossRef] [PubMed]
  2. Mason, S.E.; Trainor, T.P.; Chaka, A.M. Hybridization-reactivity Relationship in Pb(II) Adsorption on α-Al2O3-water Interfaces: A DFT Study. J. Phys. Chem. C 2011, 115, 4008–4021. [Google Scholar] [CrossRef]
  3. Shukla, G.S.; Singhal, R.L. The Present Status of Biological Effects of Toxic Metals in the Environment: Lead, Cadmium, and Manganese. Can. J. Physiol. Pharmacol. 1984, 62, 1015–1031. [Google Scholar] [CrossRef] [PubMed]
  4. Aragay, G.; Pons, J.; Merkoçi, A. Recent Trends in Macro-, Micro-, and Nanomaterial-Based Tools and Strategies for Heavy-Metal Detection. Chem. Rev. 2011, 111, 3433–3458. [Google Scholar] [CrossRef]
  5. Taylor, D.H.; Steele, C.W.; Strickler-Shaw, S. Responses of green frog (Rana Clamitans) tadpoles to lead-polluted water. Environ. Toxicol. Chem. 1990, 9, 87–93. [Google Scholar] [CrossRef]
  6. Li, D. Effects of lead polluted water on activities of superoxide dismutase, peroxidase and ultrastructure in leaves of Trapa bicornis seedlings. China Environ. Sci. 2009, 29, 136–141. [Google Scholar]
  7. Scientific Committee on Health and Environmental Risks (SCHER). Lead Standard in Drinking Water. Available online: https://ec.europa.eu/health/scientific_committees/environmental_risks/docs/scher_o_128.pdf (accessed on 28 April 2020).
  8. Ullah, Z.; Khan, H.; Waseem, A.; Mahmood, Q.; Farooq, U. Water quality assessment of the River Kabul at Peshawar, Pakistan: Industrial and urban wastewater impacts. J. Water Chem. Technol. 2013, 35, 170–176. [Google Scholar] [CrossRef] [Green Version]
  9. Khan, S.; Ahmad, I.; Shah, M.T.; Rehman, S.; Khaliq, A. Use of constructed wetland for the removal of heavy metals from industrial wastewater. J. Environ. Manag. 2009, 90, 3451–3457. [Google Scholar] [CrossRef]
  10. Tariq, S.R.; Shah, M.H.; Shaheen, N.; Khalique, A.; Manzoor, S.; Jaffar, M. Multivariate analysis of trace metal levels in tannery effluents in relation to soil and water: A case study from Peshawar, Pakistan. J. Environ. Manag. 2006, 79, 20–29. [Google Scholar] [CrossRef]
  11. Krishna, A.K.; Mohan, K.R. Risk assessment of heavy metals and their source distribution in waters of a contaminated industrial site. Environ. Sci. Pollut. Res. 2014, 21, 3653–3669. [Google Scholar] [CrossRef]
  12. Javaid, S.; Shah, S.G.S.; Chaudhary, A.J.; Khan, M.H. Assessment of Trace Metal Contamination of Drinking Water in the Pearl Valley, Azad Jammu and Kashmir. CLEAN–Soil Air Water 2008, 36, 216–221. [Google Scholar] [CrossRef]
  13. Paul, D. Research on heavy metal pollution of river Ganga: A review. Ann. Agrar. Sci. 2017, 15, 278–286. [Google Scholar] [CrossRef]
  14. Besmer, M.D.; Hammes, F. Short-term microbial dynamics in a drinking water plant treating groundwater with occasional high microbial loads. Water Res. 2016, 107, 11–18. [Google Scholar] [CrossRef] [PubMed]
  15. Højris, B.; Kornholt, S.N.; Christensen, S.C.B.; Albrechtsen, H.-J.; Olesen, L.S. Detection of Drinking Water Contamination by an Optical Real-Time Bacteria Sensor. H2Open J. 2018, 1, 160–168. [Google Scholar] [CrossRef] [Green Version]
  16. Banna, M.H.; Imran, S.; Francisque, A.; Najjaran, H.; Sadiq, R.; Rodriguez, M.; Hoorfar, M. Online Drinking Water Quality Monitoring: Review on Available and Emerging Technologies. Crit. Rev. Environ. Sci. Technol. 2014, 44, 1370–1421. [Google Scholar] [CrossRef]
  17. Daware, K.; Kasture, M.; Kalubarme, R.; Shinde, R.; Patil, K.; Suzuki, N.; Terashima, C.; Gosavi, S.; Fujishima, A. Detection of Toxic Metal Ions Pb2+ in Water Using SiO2@Au Core-Shell Nanostructures: A Simple Technique for Water Quality Monitoring. Chem. Phys. Lett. 2019, 732, 136635. [Google Scholar] [CrossRef]
  18. Chai, F.; Wang, C.; Wang, T.; Li, L.; Su, Z. Colorimetric Detection of Pb2+ Using Glutathione Functionalized Gold Nanoparticles. ACS Appl. Mater. Interfaces 2010, 2, 1466–1470. [Google Scholar] [CrossRef]
  19. Repetto, D.; Giordano, M.C.; Foti, A.; Gucciardi, P.G.; Mennucci, C.; Buatier de Mongeot, F. SERS amplification by ultra-dense plasmonic arrays on self-organized PDMS templates. Appl. Surf. Sci. 2018, 446, 83–91. [Google Scholar] [CrossRef]
  20. Li, M.; Zhou, X.; Guo, S.; Wu, N. Detection of Lead (Ii) with a “Turn-On” Fluorescent Biosensor Based on Energy Transfer from CdSe/ZnS Quantum Dots to Graphene Oxide. Biosens. Bioelectron. 2013, 43, 69–74. [Google Scholar] [CrossRef]
  21. Li, J.; Lu, Y. A Highly Sensitive and Selective Catalytic DNA Biosensor for Lead Ions. JACS 2000, 122, 10466–10467. [Google Scholar] [CrossRef]
  22. Ju, H.; Lee, M.H.; Kim, J.; Kim, J.S.; Kim, J. Rhodamine-Based Chemosensing Monolayers on Glass as a Facile Fluorescent “Turn-On” Sensing Film for Selective Detection Of Pb2+. Talanta 2011, 83, 1359–1363. [Google Scholar] [CrossRef] [PubMed]
  23. Jain, A.K.; Gupta, V.K.; Singh, L.P.; Raisoni, J.R. A Comparative Study of Pb2+ Selective Sensors Based on Derivatized Tetrapyrazole and Calix[4]Arene Receptors. Electrochim. Acta 2006, 51, 2547–2553. [Google Scholar] [CrossRef]
  24. Gao, C.; Yu, X.-Y.; Xu, R.-X.; Liu, J.-H.; Huang, X.-J. AlOOH-Reduced Graphene Oxide Nanocomposites: One-Pot Hydrothermal Synthesis and Their Enhanced Electrochemical Activity for Heavy Metal Ions. ACS Appl. Mater. Interfaces 2012, 4, 4672–4682. [Google Scholar] [CrossRef] [PubMed]
  25. Georgakilas, V.; Otyepka, M.; Bourlinos, A.B.; Chandra, V.; Kim, N.; Kemp, K.C.; Hobza, P.; Zboril, R.; Kim, K.S. Functionalization of Graphene: Covalent and Non-Covalent Approaches, Derivatives and Applications. Chem. Rev. 2012, 112, 6156–6214. [Google Scholar] [CrossRef]
  26. Willemse, C.M.; Tlhomelang, K.; Jahed, N.; Baker, P.G.; Iwuoha, E.I. Metallo-Graphene Nanocomposite Electrocatalytic Platform for the Determination of Toxic Metal Ions. Sensors 2011, 11, 3970–3987. [Google Scholar] [CrossRef]
  27. Wen, Y.; Li, F.Y.; Dong, X.; Zhang, J.; Xiong, Q.; Chen, P. The Electrical Detection of Lead Ions Using Gold-Nanoparticle- and DNAzyme-Functionalized Graphene Device. Adv. Healthc. Mater. 2013, 2, 271–274. [Google Scholar] [CrossRef]
  28. Zhou, G.; Chang, J.; Cui, S.; Pu, H.; Wen, Z.; Chen, J. Real-Time, Selective Detection of Pb2+ in Water Using a Reduced Graphene Oxide/Gold Nanoparticle Field-Effect Transistor Device. ACS Appl. Mater. Interfaces 2014, 6, 19235–19241. [Google Scholar] [CrossRef]
  29. Niu, X.; Liu, Y.; Wang, F.; Luo, D. Highly sensitive and selective optical sensor for lead ion detection based on liquid crystal decorated with DNAzyme. Opt. Express 2019, 27, 30421–30428. [Google Scholar] [CrossRef]
  30. Reese, C.E.; Asher, S.A. Photonic Crystal Optrode Sensor for Detection of Pb2+ in High Ionic Strength Environments. Anal. Chem. 2003, 75, 3915–3918. [Google Scholar] [CrossRef]
  31. Yin, Y.; Li, S.; Wang, S.; Jia, S.; Ren, J.; Farrell, G.; Lewis, E.; Wang, P. Ultra-high-resolution detection of Pb 2+ ions using a black phosphorus functionalized microfiber coil resonator. Photonics Res. 2019, 7, 622–629. [Google Scholar] [CrossRef]
  32. Lova, P.; Manfredi, G.; Comoretto, D. Advances in Functional Solution Processed Planar One-Dimensional Photonic Crystals. Adv. Opt. Mater. 2018, 6, 1800730. [Google Scholar] [CrossRef]
  33. Lova, P.; Giusto, P.; Stasio, F.D.; Manfredi, G.; Paternò, G.M.; Cortecchia, D.; Soci, C.; Comoretto, D. All-Polymer Methylammonium Lead Iodide Perovskite Microcavity. Nanoscale 2019, 11, 8978–8983. [Google Scholar] [CrossRef] [PubMed]
  34. Robbiano, V.; Paternò, G.M.; La Mattina, A.A.; Motti, S.G.; Lanzani, G.; Scotognella, F.; Barillaro, G. Room-temperature low-Threshold Lasing from Monolithically Integrated Nanostructured Porous Silicon Hybrid Microcavities. ACS Nano 2018, 12, 4536–4544. [Google Scholar] [CrossRef] [PubMed]
  35. Paternò, G.M.; Iseppon, C.; D’Altri, A.; Fasanotti, C.; Merati, G.; Randi, M.; Desii, A.; Pogna, E.A.A.; Viola, D.; Cerullo, G.; et al. Solution Processable and Optically Switchable 1D Photonic Structures. Sci. Rep. 2018, 8, 3517. [Google Scholar] [CrossRef] [PubMed]
  36. Paternò, G.M.; Moscardi, L.; Kriegel, I.; Scotognella, F.; Lanzani, G. Electro-Optic and Magneto-Optic Photonic Devices Based on Multilayer Photonic Structures. SPIE Proc. 2018, 8, 1–8. [Google Scholar] [CrossRef]
  37. Yin, J.; Migas, D.B.; Panahandeh-Fard, M.; Chen, S.; Wang, Z.; Lova, P.; Soci, C. Charge Redistribution at GaAs/P3HT Heterointerfaces with Different Surface Polarity. J. Phys. Chem. Lett. 2013, 4, 3303–3309. [Google Scholar] [CrossRef]
  38. Sprengard, R.; Bonrad, K.; Daeubler, T.K.; Frank, T.; Hagemann, V.; Köhler, I.; Pommerehne, J.; Ottermann, C.R.; Voges, F.; Vingerling, B. OLED Devices for Signage Applications: A Review of Recent Advances and Remaining Challenges. In Proceedings of the Organic Light-Emitting Materials and Devices VIII, Denver, CO, USA, 2–4 August 2004; pp. 173–183. [Google Scholar]
  39. Torsi, L.; Magliulo, M.; Manoli, K.; Palazzo, G. Organic Field-Effect Transistor Sensors: A Tutorial Review. Chem. Soc. Rev. 2013, 42, 8612–8628. [Google Scholar] [CrossRef]
  40. Iasilli, G.; Francischello, R.; Lova, P.; Silvano, S.; Surace, A.; Pesce, G.; Alloisio, M.; Patrini, M.; Shimizu, M.; Comoretto, D.; et al. Luminescent Solar Concentrators: Boosted Optical Efficiency by Polymer Dielectric Mirrors. Mater. Chem. Front. 2019, 3, 429–436. [Google Scholar] [CrossRef]
  41. Manfredi, G.; Lova, P.; Di Stasio, F.; Rastogi, P.; Krahne, R.; Comoretto, D. Lasing From Dot-In-Rod Nanocrystals in Planar Polymer Microcavities. RSC Adv. 2018, 8, 13026–13033. [Google Scholar] [CrossRef] [Green Version]
  42. Yang, H.; Pan, L.; Han, Y.; Ma, L.; Li, Y.; Xu, H.; Zhao, J. A visual water vapor photonic crystal sensor with PVA/SiO2 opal structure. App. Surf. Sci. 2017, 423, 421–425. [Google Scholar] [CrossRef]
  43. Schauer, S.; Baumberg, J.J.; Hölscher, H.; Smoukov, S.K. Tuning of Structural Colors Like a Chameleon Enabled by Shape-Memory Polymers. Macromol. Rapid Commun. 2018, 39, 1800518. [Google Scholar] [CrossRef] [PubMed]
  44. Xu, H.; Lu, Y.F.; Xiang, J.X.; Zhang, M.K.; Zhao, Y.J.; Xie, Z.Y.; Gu, Z.Z. A multifunctional wearable sensor based on a graphene/inverse opal cellulose film for simultaneous, in situ monitoring of human motion and sweat. Nanoscale 2018, 10, 2090–2098. [Google Scholar] [CrossRef] [PubMed]
  45. Fenzl, C.; Kirchinger, M.; Hirsch, T.; Wolfbeis, O. Photonic crystal-based sensing and imaging of potassium ions. Chemosensors 2014, 2, 207–218. [Google Scholar] [CrossRef]
  46. Fenzl, C.; Hirsch, T.; Wolfbeis, O. Photonic Crystal Based Sensor for Organic Solvents and for Solvent-Water Mixtures. Sensors 2012, 12, 16954–16963. [Google Scholar] [CrossRef] [PubMed] [Green Version]
  47. Dolan, J.A.; Korzeb, K.; Dehmel, R.; Gödel, K.C.; Stefik, M.; Wiesner, U.; Wilkinson, T.D.; Baumberg, J.J.; Wilts, B.D.; Steiner, U.; et al. Controlling Self-Assembly in Gyroid Terpolymer Films By Solvent Vapor Annealing. Small 2018, 14, 1802401. [Google Scholar] [CrossRef] [Green Version]
  48. Lee, J.-H.; Koh, C.Y.; Singer, J.P.; Jeon, S.-J.; Maldovan, M.; Stein, O.; Thomas, E.L. 25th Anniversary Article: Ordered Polymer Structures for the Engineering of Photons and Phonons. Adv. Mater. 2013, 26, 532–569. [Google Scholar] [CrossRef] [Green Version]
  49. Lova, P.; Soci, C. Nanoimprint Lithography: Toward Polymer Photonic Crystals. In Organic and Hybrid Photonic Crystals, 1st ed.; Comoretto, D., Ed.; Springer: Cham, Switzerland, 2015; Volume 1, p. 493. [Google Scholar]
  50. Yan, X.; Li, B.; Cheng, T.; Li, S. Analysis of High Sensitivity Photonic Crystal Fiber Sensor Based on Surface Plasmon Resonance of Refractive Indexes of Liquids. Sensors 2018, 18, 2922. [Google Scholar] [CrossRef] [Green Version]
  51. Bing, P.; Huang, S.; Sui, J.; Wang, H.; Wang, Z. Analysis and Improvement of a Dual-Core Photonic Crystal Fiber Sensor. Sensors 2018, 18, 2051. [Google Scholar] [CrossRef] [Green Version]
  52. Lova, P.; Megahd, H.; Comoretto, D. Thin Polymer Films: Simple Optical Determination of Molecular Diffusion Coefficients. ACS Appl. Mater. Interfaces 2020, 2, 563–568. [Google Scholar] [CrossRef]
  53. Lova, P.; Manfredi, G.; Bastianini, C.; Mennucci, C.; Buatier de Mongeot, F.; Servida, A.; Comoretto, D. Flory-Huggins Photonic Sensors for the Optical Assessment of Molecular Diffusion Coefficients in Polymers. ACS Appl. Mater. Interfaces 2019, 11, 16872–16880. [Google Scholar] [CrossRef]
  54. Gao, S.; Tang, X.; Langner, S.; Osvet, A.; Harreiβ, C.; Barr, M.; Spiecker, E.; Bachmann, J.; Brabec, C.J.; Forberich, K. Time-Resolved Analysis of Dielectric Mirrors for Vapor Sensing. ACS Appl. Mater. Interfaces 2018, 10, 36398–36406. [Google Scholar] [CrossRef]
  55. Lim, H.S.; Lee, J.-H.; Walish, J.J.; Thomas, E.L. Dynamic Swelling of Tunable Full-Color Block Copolymer Photonic Gels via Counterion Exchange. ACS Nano 2012, 6, 8933–8939. [Google Scholar] [CrossRef]
  56. Lova, P. Selective Polymer Distributed Bragg Reflector Vapor Sensors. Polymers 2018, 10, 1161. [Google Scholar] [CrossRef] [PubMed] [Green Version]
  57. Song, H.; Singer, K.; Wu, Y.; Zhou, J.; Lott, J.; Andrews, J.; Hiltner, A.; Baer, E.; Weder, C.; Bunch, R.; et al. Layered Polymeric Optical Systems Using Continuous Coextrusion. Proc. SPIE 2009, 7467, 74670A. [Google Scholar]
  58. Singer, K.D.; Kazmierczak, T.; Lott, J.; Song, H.; Wu, Y.; Andrews, J.; Baer, E.; Hiltner, A.; Weder, C. Melt-processed All-polymer Distributed Bragg Reflector Laser. Opt. Express 2008, 16, 10358–10363. [Google Scholar] [CrossRef] [PubMed]
  59. Kazmierczak, T.; Song, H.; Hiltner, A.; Baer, E. Polymeric One-Dimensional Photonic Crystals by Continuous Coextrusion. Macromol. Rapid Commun. 2007, 28, 2210–2216. [Google Scholar] [CrossRef]
  60. 3M DICHROIC. Available online: https://www.3m.com/3M/en_US/company-us/all-3m-products/~/3M-Dichroic-Films-for-Architectural-Laminated-Glass/?N=5002385+3291680356&rt=rud (accessed on 27 January 2020).
  61. TORAY. Available online: http://www.toray.com/ (accessed on 27 January 2020).
  62. Giusto, P.; Lova, P.; Manfredi, G.; Gazzo, S.; Srinivasan, B.; Radice, S.V.; Comoretto, D. Colorimetric Detection of Perfluorinated Compounds by All-Polymer Photonic Transducers. ACS Omega 2018, 3, 7517–7522. [Google Scholar] [CrossRef]
  63. Dodero, A.; Vicini, S.; Alloisio, M.; Castellano, M. Sodium alginate solutions: Correlation between rheological properties and spinnability. J. Mater. Sci. 2019, 54, 8034–8046. [Google Scholar] [CrossRef]
  64. Dodero, A.; Alloisio, M.; Vicini, S.; Castellano, M. Preparation of Composite Alginate-Based Electrospun Membranes Loaded with Zno Nanoparticles. Carbohydr. Polym. 2020, 227, 115371. [Google Scholar] [CrossRef]
  65. Dodero, A.; Scarfi, S.; Pozzolini, M.; Vicini, S.; Alloisio, M.; Castellano, M. Alginate-Based Electrospun Membranes Containing ZnO Nanoparticles as Potential Wound Healing Patches: Biological, Mechanical, and Physicochemical Characterization. ACS Appl. Mater. Interfaces 2020, 12, 3371–3381. [Google Scholar] [CrossRef]
  66. Castellano, M.; Alloisio, M.; Darawish, R.; Dodero, A.; Vicini, S. Electrospun Composite Mats of Alginate with Embedded Silver Nanoparticles. J. Therm. Anal. Calorim. 2019, 137, 767–778. [Google Scholar] [CrossRef]
  67. Holdt, S.L.; Kraan, S. Bioactive Compounds in Seaweed: Functional Food Applications and Legislation. J. Appl. Phycol. 2011, 23, 543–597. [Google Scholar] [CrossRef]
  68. Liu, L.S.; Kost, J.; Yan, F.; Spiro, R.C. Hydrogels from Biopolymer Hybrid for Biomedical, Food, and Functional Food Applications. Polymers 2012, 4, 997–1011. [Google Scholar] [CrossRef]
  69. Zia, K.M.; Zia, F.; Zuber, M.; Rehman, S.; Ahmad, M.N. Alginate Based Polyurethanes: A Review of Recent Advances and Perspective. Int. J. Biol. Macromol. 2015, 79, 377–387. [Google Scholar] [CrossRef] [PubMed]
  70. Dodero, A.; Vicini, S.; Alloisio, M.; Castellano, M. Rheological properties of sodium alginate solutions in the presence of added salt: An application of Kulicke equation. Rheol. Acta 2020, 59, 365–374. [Google Scholar] [CrossRef]
  71. Bertasa, M.; Dodero, A.; Alloisio, M.; Vicini, S.; Riedo, C.; Sansonetti, A.; Scalarone, D.; Castellano, M. Agar Gel Strength: A Correlation Study Between Chemical Composition and Rheological Properties. Eur. Polym. J. 2020, 123, 109442. [Google Scholar] [CrossRef]
  72. Dodero, A.; Williams, R.; Gagliardi, S.; Vicini, S.; Alloisio, M.; Castellano, M. A Micro-Rheological and Rheological Study of Biopolymers Solutions: Hyaluronic Acid. Carbohydr. Polym. 2019, 203, 349–355. [Google Scholar] [CrossRef]
  73. Dodero, A.; Pianella, L.; Vicini, S.; Alloisio, M.; Ottonelli, M.; Castellano, M. Alginate-Based Hydrogels Prepared via Ionic Gelation: An Experimental Design Approach to Predict the Crosslinking Degree. Eur. Polym. J. 2019, 118, 586–594. [Google Scholar] [CrossRef]
  74. Salzano de Luna, M.; Castaldo, R.; Altobelli, R.; Gioiella, L.; Filippone, G.; Gentile, G.; Ambrogi, V. Chitosan Hydrogels Embedding Hyper-Crosslinked Polymer Particles as Reusable Broad-Spectrum Adsorbents for Dye Removal. Carbohydr. Polym. 2017, 177, 347–354. [Google Scholar] [CrossRef]
  75. Ullah, F.; Othman, M.B.H.; Javed, F.; Ahmad, Z.; Akil, H.M. Classification, Processing and Application of Hydrogels: A Review. Mater. Sci. Eng. C 2015, 57, 414–433. [Google Scholar] [CrossRef]
  76. Blackburn, R.S. Natural Polysaccharides and Their Interactions with Dye Molecules: Applications in Effluent Treatment. Environ. Sci. Technol. 2004, 38, 4905–4909. [Google Scholar] [CrossRef] [PubMed]
  77. Mittal, H.; Ray, S.S.; Okamoto, M. Recent Progress on the Design and Applications of Polysaccharide-Based Graft Copolymer Hydrogels as Adsorbents for Wastewater Purification. Macromol. Mater. Eng. 2016, 301, 496–522. [Google Scholar] [CrossRef]
  78. Guilherme, M.R.; Aouada, F.A.; Fajardo, A.R.; Martins, A.F.; Paulino, A.T.; Davi, M.F.T.; Rubira, A.F.; Muniz, E.C. Superabsorbent hydrogels based on polysaccharides for application in agriculture as soil conditioner and nutrient carrier: A review. Eur. Polym. J. 2015, 72, 365–385. [Google Scholar] [CrossRef] [Green Version]
  79. Okay, O. General Properties of Hydrogels. In Hydrogel Sensors and Actuators: Engineering and Technology; Gerlach, G., Arndt, K.-F., Eds.; Springer: Berlin/Heidelberg, Germany, 2010; pp. 1–14. [Google Scholar] [CrossRef]
  80. Braccini, I.; Pérez, S. Molecular Basis of Ca2+-Induced Gelation in Alginates and Pectins: The Egg-Box Model Revisited. Biomacromolecules 2001, 2, 1089–1096. [Google Scholar] [CrossRef] [PubMed]
  81. Li, L.; Fang, Y.; Vreeker, R.; Appelqvist, I.; Mendes, E. Reexamining the Egg-Box Model in Calcium−Alginate Gels with X-ray Diffraction. Biomacromolecules 2007, 8, 464–468. [Google Scholar] [CrossRef]
  82. Sikorski, P.; Mo, F.; Skjåk-Bræk, G.; Stokke, B.T. Evidence for Egg-Box-Compatible Interactions in Calcium−Alginate Gels from Fiber X-ray Diffraction. Biomacromolecules 2007, 8, 2098–2103. [Google Scholar] [CrossRef]
  83. Borgogna, M.; Skjåk-Bræk, G.; Paoletti, S.; Donati, I. On the Initial Binding of Alginate by Calcium Ions. The Tilted Egg-Box Hypothesis. J. Phys. Chem. B 2013, 117, 7277–7282. [Google Scholar] [CrossRef]
  84. Plazinski, W.; Rudzinski, W. Molecular Modeling of Ca2+-oligo(α-l-guluronate) Complexes: Toward the Understanding of the Junction Zone Structure in Calcium Alginate Gels. Struct. Chem. 2012, 23, 1409–1415. [Google Scholar] [CrossRef]
  85. Liao, H.; Ai, W.; Zhang, K.; Nakauma, M.; Funami, T.; Fang, Y.; Nishinari, K.; Draget, K.I.; Phillips, G.O. Mechanisms of Oligoguluronate Modulating the Calcium-Induced Gelation of Alginate. Polymer 2015, 74, 166–175. [Google Scholar] [CrossRef]
  86. Agulhon, P.; Robitzer, M.; Habas, J.-P.; Quignard, F. Influence of Both Cation and Alginate Nature on The Rheological Behavior of Transition Metal Alginate Gels. Carbohydr. Polym. 2014, 112, 525–531. [Google Scholar] [CrossRef]
  87. Lova, P.; Grande, V.; Manfredi, G.; Patrin, M.; Herbst, S.; Würthner, F.; Comoretto, D. All-Polymer Photonic Microcavities Doped with Perylene Bisimide J-Aggregates. Adv. Opt. Mater. 2017, 5, 1700523–1700528. [Google Scholar] [CrossRef]
  88. Cathell, M.D.; Schauer, C.L. Structurally Colored Thin Films of Ca2+-Cross-Linked Alginate. Biomacromolecules 2007, 8, 33–41. [Google Scholar] [CrossRef] [PubMed]
  89. Huang, J.; Zajforoushan Moghaddam, S.; Thormann, E. Structural Investigation of a Self-Cross-Linked Chitosan/Alginate Dialdehyde Multilayered Film with in Situ QCM-D and Spectroscopic Ellipsometry. ACS Omega 2019, 4, 2019–2029. [Google Scholar] [CrossRef] [PubMed]
  90. Comoretto, D. Organic and Hybrid Photonic Crystals; Springer: Cham, Switzerland, 2015. [Google Scholar]
  91. Tavella, C.; Lova, P.; Marsotto, M.; Luciano, G.; Patrini, M.; Stagnaro, P.; Comoretto, D. High Refractive Index Inverse Vulcanized Polymers for Organic Photonic Crystals. Crystals 2020, 10, 154. [Google Scholar] [CrossRef] [Green Version]
  92. Zhang, W.; Kim, J.H.; Franco, C.M.M.; Middelberg, A.P.J. Characterisation of the Shrinkage of Calcium Alginate Gel Membrane with Immobilised Lactobacillus Rhamnosus. Appl. Microbiol. Biotechnol. 2000, 54, 28–32. [Google Scholar] [CrossRef]
  93. Guo, L.; Zheng, D.; Xu, J.; Guo, X.; Fu, X.; Zhang, Q. Effects of Ionic Crosslinking on Physical and Mechanical Properties of Alginate Mulching Films. Carbohydr. Polym. 2016, 136, 259–265. [Google Scholar]
  94. Mammarella, E.J.; Rubiolo, A.C. Crosslinking Kinetics of Cation-Hydrocolloid Gels. Chem. Eng. J. 2003, 94, 73–77. [Google Scholar] [CrossRef]
  95. Vargas, P.O.; Pereira, N.R.; Guimarães, A.O.; Waldman, W.R.; Pereira, V.R. Shrinkage and deformation during convective drying of calcium alginate. LWT-Food Sci. Technol. 2018, 97, 213–222. [Google Scholar] [CrossRef]
  96. Ogieglo, W.; Wormeester, H.; Eichhorn, K.-J.; Wessling, M.; Benes, N.E. In situ ellipsometry studies on swelling of thin polymer films: A review. Prog. Polym. Sci. 2015, 42, 42–78. [Google Scholar] [CrossRef]
  97. Lova, P.; Bastianini, C.; Giusto, P.; Patrini, M.; Rizzo, P.; Guerra, G.; Iodice, M.; Soci, C.; Comoretto, D. Label-free Vapor Selectivity in Poly(p-phenylene oxide) Photonic Crystal Sensors. ACS Appl. Mater. Interfaces 2016, 8, 31941–31950. [Google Scholar] [CrossRef] [Green Version]
  98. Lova, P.; Manfredi, G.; Boarino, L.; Comite, A.; Laus, M.; Patrini, M.; Marabelli, F.; Soci, C.; Comoretto, D. Polymer Distributed Bragg Reflectors for Vapor Sensing. ACS Photonics 2015, 2, 537–543. [Google Scholar] [CrossRef]
  99. Chamaleonlab. Available online: http://chameleonlab.nl/ (accessed on 11 December 2019).
  100. Buss, F.; Göcke, J.; Scharfer, P.; Schabel, W. From Micro to Nano Thin Polymer Layers: Thickness and Concentration Dependence of Sorption and the Solvent Diffusion Coefficient. Macromolecules 2015, 48, 8285–8293. [Google Scholar] [CrossRef]
  101. An, B.; Lee, H.; Lee, S.; Lee, S.-H.; Choi, J.-W. Determining the selectivity of divalent metal cations for the carboxyl group of alginate hydrogel beads during competitive sorption. J. Hazard. Mater. 2015, 298, 11–18. [Google Scholar] [CrossRef] [PubMed]
  102. Papageorgiou, S.K.; Katsaros, F.K.; Kouvelos, E.P.; Nolan, J.W.; Le Deit, H.; Kanellopoulos, N.K. Heavy metal sorption by calcium alginate beads from Laminaria digitata. J. Hazard. Mater. 2006, 137, 1765–1772. [Google Scholar] [CrossRef] [PubMed]
  103. Fatin-Rouge, N.; Dupont, A.; Vidonne, A.; Dejeu, J.; Fievet, P.; Foissy, A. Removal of some divalent cations from water by membrane-filtration assisted with alginate. Water Res. 2006, 40, 1303–1309. [Google Scholar] [CrossRef]
  104. Sone, H.; Fugetsu, B.; Tanaka, S. Selective elimination of lead(II) ions by alginate/polyurethane composite foams. J. Hazard. Mater. 2009, 162, 423–429. [Google Scholar] [CrossRef]
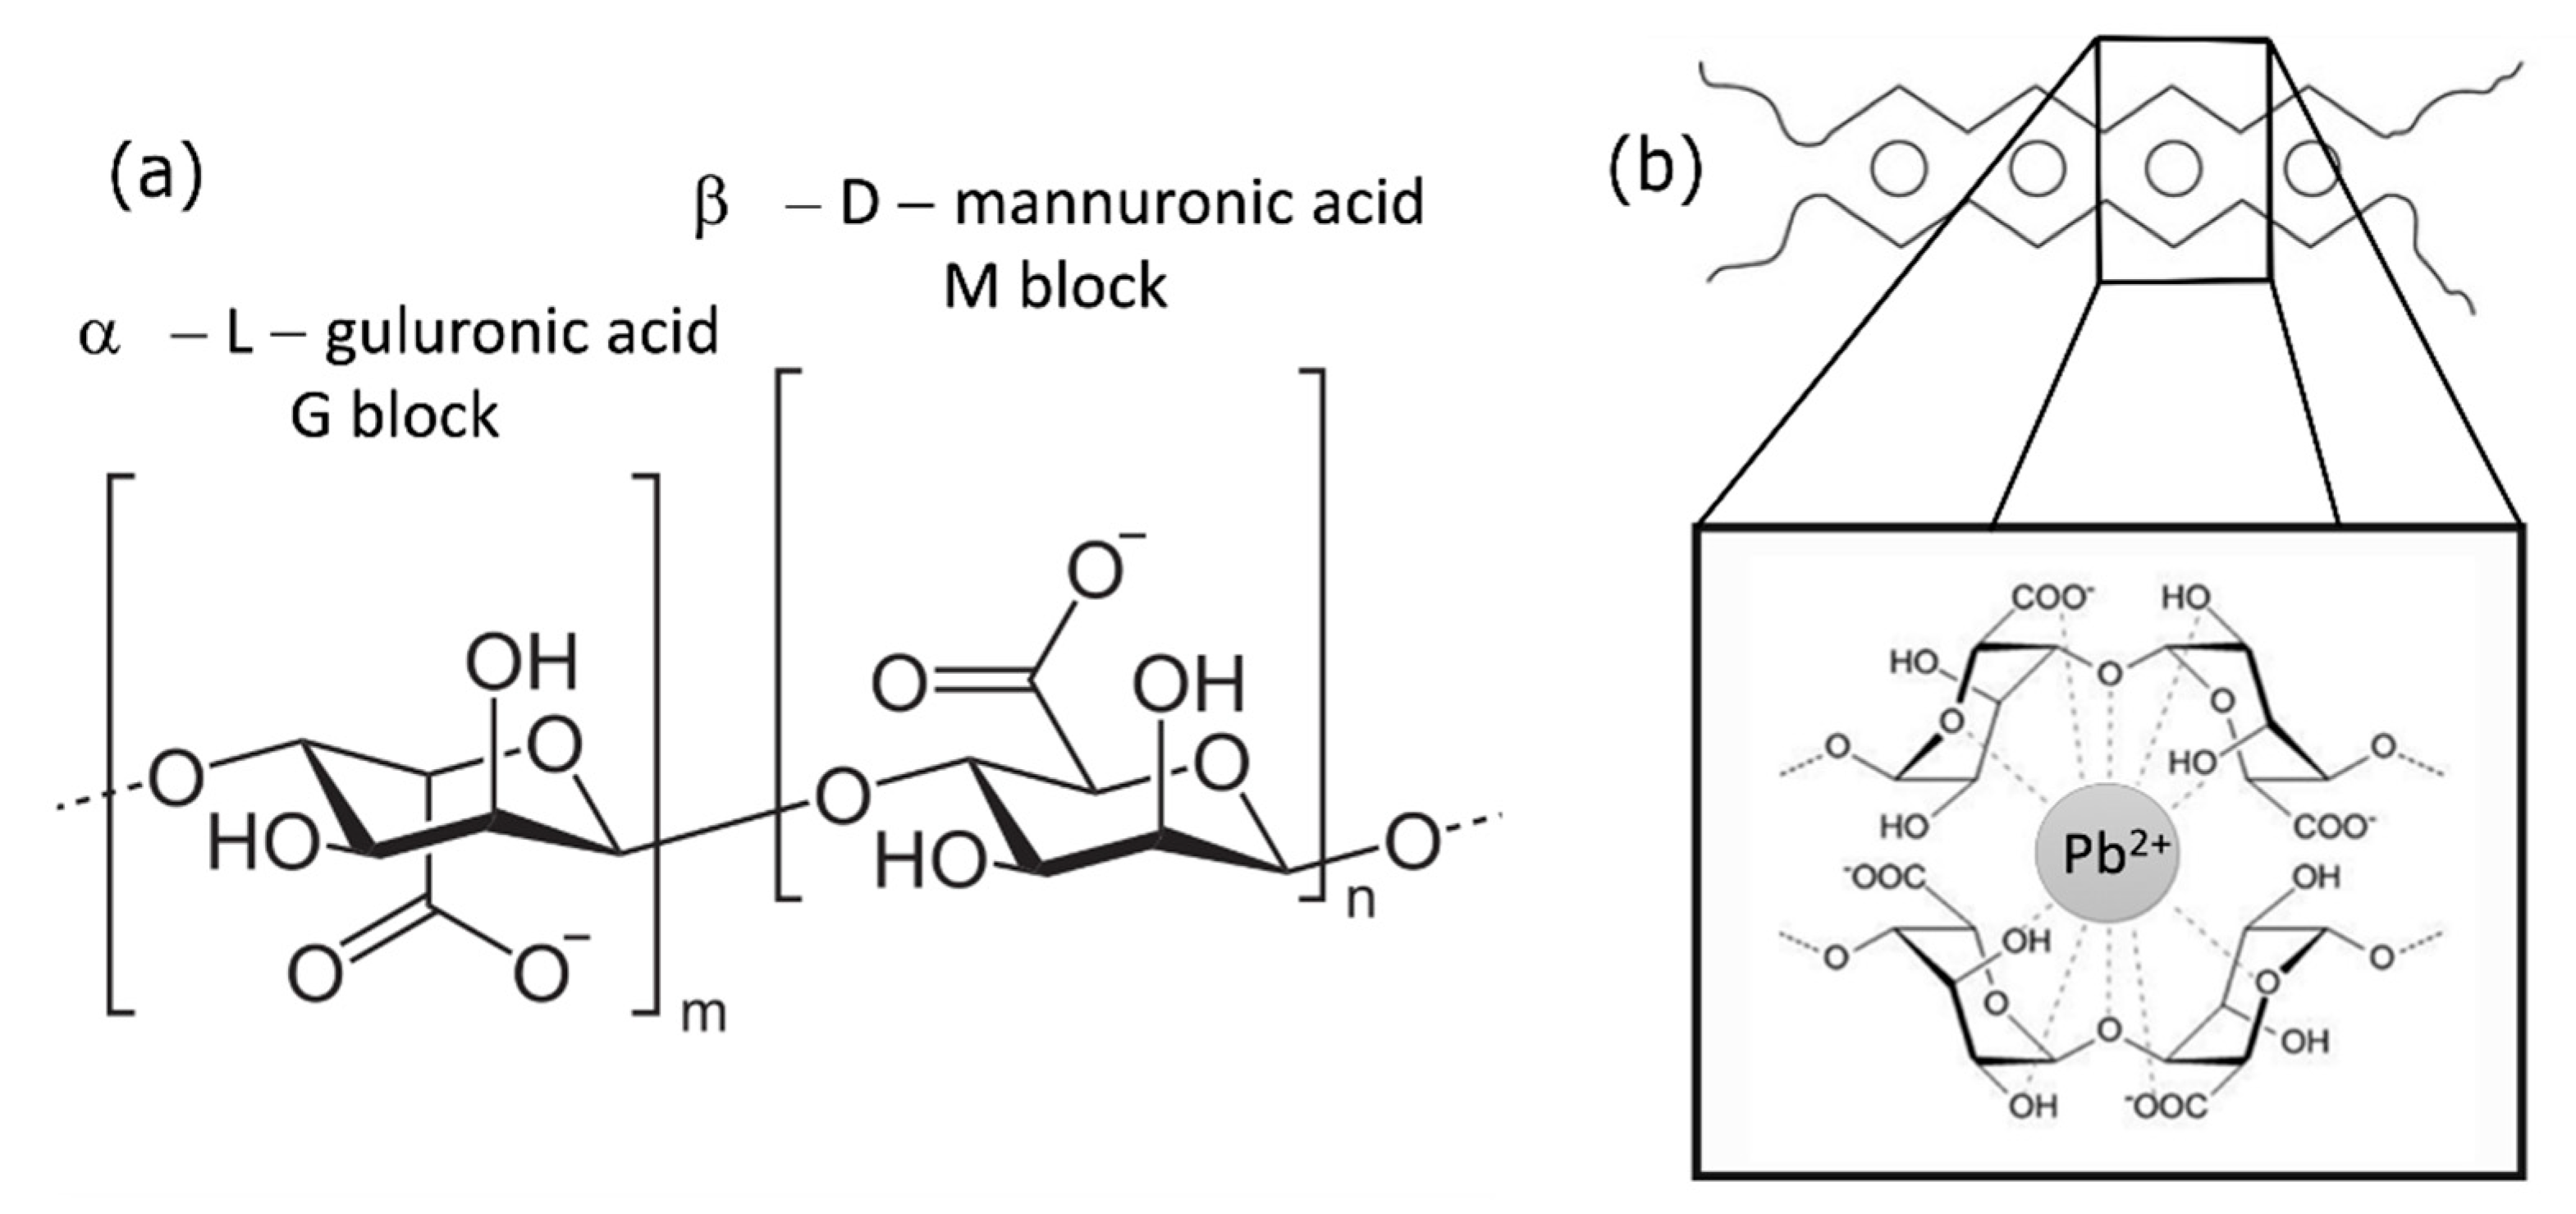
Figure 1. (a) Sodium alginate (SA) chemical structure and (b) egg-box model for SA cross-linking.
Chemosensors 08 00037 g001
Figure 2. (a) Schematic and (b) experimental reflectance spectra collected in 9 different points of the sample surface for a poly (N-vinylcarbazole) (PVK): SA multilayer made of 10.5 bilayers (full lines) and calculated spectrum for the structure (dotted line); (c,d) angular resolved transmittance spectra collected for (c) s-polarized and (d) p-polarized incident light.
Chemosensors 08 00037 g002
Figure 3. Full spectral response for the 10.5-periods distributed Bragg reflectors (DBRs) to Pb2+ solutions with concentrations of (from top to bottom) 1 × 10⁻², 5 × 10⁻³, 1 × 10⁻³, 1 × 10⁻⁴ and 1 × 10⁻⁵ M. (a) Normal incidence reflectance spectra before (black line) and after (red line) exposure to Pb2+ water solution and spectra after drying (green line). Full dynamic spectral response of the (b) swelling and (c) drying processes.
Chemosensors 08 00037 g003
Figure 4. Angular resolved transmittance spectra collected for p-polarized and s-polarized incident light for samples exposed to (from top to bottom) 1 × 10⁻², 5 × 10⁻³, 1 × 10⁻³, 1 × 10⁻⁴ M. The bottom panel also show the spectra collected for concentration 1 × 10⁻⁴ M.
Chemosensors 08 00037 g004
Figure 5. (a) Reflectance spectra collected in 9 different points of the sample surface for a PVK:SA DBR made of 6.5 bilayers (full lines) and calculated spectrum for the structure (dotted line); (b,c) Angular resolved transmittance spectra collected for (b) p-polarized and (c) s-polarized incident light.
Chemosensors 08 00037 g005
Figure 6. Full spectral response for the 6.5 periods DBR to Pb2+ solutions with concentrations of (from top to bottom) 1 × 10⁻², 5 × 10⁻³, 1 × 10⁻³ and 1 × 10⁻⁴ M. (a) Normal incidence reflectance spectra before (black line) and after (red line) exposure to Pb2+ water solution and spectra after drying. Full dynamic spectral response of the swelling (b) and drying (c) processes.
Chemosensors 08 00037 g006
Figure 7. (a) Normal incidence reflectance spectrum of a DBR sensor made of 6.5 bilayers before (black line) and after (red line) exposure to water and spectrum after drying at 60 °C. Full dynamic spectral response of the (b) swelling and (c) drying process.
Chemosensors 08 00037 g007
Figure 8. Optical response of (a) 6.5 and (a’) 10.5 periods PVK:SA DBRs after exposure to Pb2+ solutions with different concentration and drying. The spectra are normalized by the initial reflectance intensity (Ri) and spectral position (λi) to account for small inhomogeneity of the samples. Percent variation of PBG reflectance ((b) for 6.5 bilayers and (b’) for 10.5 bilayers) and spectral position ((c) for 6.5 bilayers and (c’) for 10.5 bilayers) after the exposure to Pb2+ solutions.
Chemosensors 08 00037 g008