Abstract
A dibenzo[b,j][1,10]phenanthroline (DBPhen) scaffold as a novel colorimetric Cu2+ sensor was proposed and prepared in this study. The optical properties of DBPhen were measured utilizing UV light, UV-VIS spectroscopy, and fluorescence spectroscopy. The findings denote that DBPhen exhibited a particular selectivity and great sensitivity to Cu2+ compared with other metal ions. The addition of Cu2+ in the DBPhen solution induced the color change from yellow to purple, and a new peak in the visible range (~545 nm) was observed. The detection limit of Cu2+ in the aqueous solution was calculated to be as low as 0.14 μM. Besides, the color change of the DBPhen/Cu2+ complex could be reversibly restored by adding CN−. Therefore, DBPhen could have a prospective implementation as a practical colorimetric sensor to detect Cu2+ ions in environmental fields.
1. Introduction
The detection of heavy metals in environments, biological systems, and foods is highly significant for human health and life safety []. The recognition of biologically and chemically notable metal ions and their harmful impacts on the human body and the ecosystem has remained much a research concern []. Copper (Cu) is an essential trace element in life and plays a significant role in chemical, biological, and environmental areas []. A specific level of copper ions (Cu2+) in the human body can provide the energy required for catalytic reaction and assist in keeping and improving the function of artery and heart tissues []. However, an extra Cu2+ level in the human body may induce severe neurodegenerative diseases, including Parkinson’s disease, Alzheimer’s disease, Menkes syndrome, and Wilson disease [,,]. Besides, Cu2+ ions are nonbiodegradable and naturally accumulate in the food chain, which poses a critical threat to the environment and human health. Hence, the detection of Cu2+ is still a necessary topic in environmental and biological analyses.
Till now, several analytical techniques for detecting Cu2+ ions are being used, such as atomic absorption spectrometry (AAS) [], fluorescence spectroscopy [], inductively coupled plasma atomic emission spectrometry (ICP-AES) [], thin layer chromatography [], IR spectroscopy [], and SERS spectroscopy []. Compared with the aforementioned analytical techniques, colorimetric sensing methods have more benefits, such as being simple to operate and on-site sensing. The colorimetric sensor is a fascinating method since it can be monitored with the naked eye or a simplified instrumentation. Given the pivotal role of the colorimetric sensor in ionic detection, the improvement of detection methods is always challenging. Colorimetric probes also have distinct advantages in terms of fast response, selectivity, and sensitivity. Although these selective and sensitive colorimetric sensors for detecting Cu2+ have been reported continually [,,,], the synthetic steps and detection procedures are mostly complicated, and some of them are not very clear. Therefore, a new colorimetric Cu2+ sensor with easy and sustainable synthesis steps, rapid response, and simple detection procedures is still needed. Additionally, a selectivity and sensitivity study is required to improve the detection capability.
1,10-Phenanthroline (phen) is a crescent-shaped polyheterocyclic compound stuck with two nitrogen atoms at different places, playing a vital role in the ligand cluster [,]. Phen is a classic bidentate chelating ligand for metal ions with a pivotal role in coordination chemistry []. It is still used as a multipurpose precursor in inorganic, organic, and supramolecular chemistry []. It is a hydrophobic, rigid planar, and electron-poor heteroaromatic network where nitrogen elements are elegantly positioned to play cooperatively in ionic interaction. These structural characteristics specify its binding capability for metal ions to form stable complexes []. Besides, phen is usually selected as a nitrogen ancillary ligand with high steric hindrance, which can increase the fluorescence quantum yields of its complexes [,]. Dibenzo[b,j][1,10]phenanthroline (DBPhen) is enabled at the para position to the nitrogen elements and utilized as an anticancer agent [] and photosensitizer for hydrogen generation from water reduction []. This compound is widely used as a luminescent compound chelating with Lewis acid, such as metal ions [].
In this work, we reported DBPhen as a simple colorimetric sensor for Cu2+ with UV-VIS spectroscopy to monitor a new absorption peak of the DBPhen/Cu2+ complex. The results show that the recognition of Cu2+ can be obtained by color and UV-VIS spectral changes, which has a tremendous antidisruption capability for general metal ions in environments. Cu2+ ions induced a noticeable color change of DBPhen at a visible spectrum of ~545 nm. The color change from yellow to purple actualizes the naked eye recognition with a prospective application value. Additionally, the yellow color was restored by introducing CN− to the complex. Fluorescence quenching of the DBPhen/Cu2+ complex also confirmed the restoration of the emission intensity after adding CN−. As far as we know, this work is the first report on the utilization of DBPhen as a colorimetric sensor for recognizing Cu2+ in aqueous solution. Some bits of information, such as the selectivity, sensitivity, restoration, and sensing mechanism, were provided and discussed to improve new great achievement sensors.
2. Materials and Methods
2.1. Chemicals
NaOH, NiCl2∙6H2O, CuCl2∙2H2O, SnCl2∙2H2O, ZnCl2, KCl, CaCl2∙2H2O, NaCl, and CuSO4. 5H2O were received from Showa Chemical Co. Ltd., Tokyo, Japan. PbCl2 was purchased from Sigma-Aldrich (St. Louis, MO, USA), and FeCl3.6H2O was purchased from Shimakyu’s Pure Chemicals (Yodogawa-ku, Osaka, Japan). CoCl2∙6H2O, CdCl2∙xH2O, FeCl2∙4H2O, HgCl2, quinine sulfate dihydrate, ethyl acetate, and hexane were obtained from Alfa Aesar (Ward Hill, MA, USA). CuCN, DMSO, sodium sulfate, cyclohexanone, and 2-iodo-4-methylaniline were obtained from Sigma-Aldrich. MeOH and H2SO4 were purchased from Avantor-Macron Fine Chemicals (Center Valley, PA, USA) and Honeywell Research Chemicals (Offenbach, Germany), respectively. All the chemicals were used without further purification.
2.2. Apparatus
1H and 13C NMR spectra were measured using a 400 MHz Varian Unity Plus and Varian Mercury Plus Spectrometer. The XR-MS spectrum was measured by performing a SolariX XR FT-MS Mass Spectrometer from Bruker. The UV-VIS absorption spectra were assessed using an Agilent 8453 UV-VIS Spectrometer. The fluorescence spectra were examined by utilizing an Agilent Cary Eclipse Fluorescence Spectrophotometer. The emission color was checked on a UV light at 365 nm (UVP UVGL-25, Analytik Jena US, Upland, CA, USA).
2.3. Preparation of DBPhen
The preparation of DBPhen was performed according to the literature reported protocols []. 4-Methyl-2-(phenylethynyl)aniline (443 mg, 2.1 mmol) was mixed with 2 mL of DMSO in a 15 mL sealed tube. Subsequently, anhydrous FeCl3 (243 mg, 1.5 mmol) and cyclohexanone (98 mg, 1.0 mmol) were mixed sequentially to the mixture, followed by stirring for 7 h at 110 °C. Then, it was diluted with 25 mL of ice water after cooling down naturally. The water layer was taken out with 25 mL of ethyl acetate (3 times). The combined ethyl acetate was given 10 mL of brine wash. The final ethyl acetate layer was dried over Na2SO4 and concentrated to obtain the raw compound. Column chromatography with eluents of hexane to 30–55% ethyl acetate/hexane was used to obtain a pure compound of 5,8-dibenzyl-3,10-dimethyl-6,7-dihydrodibenzo[b,j][1,10]phenanthroline as an off-white solid (450 mg, 90%; melting point of 290–291 °C).
2.4. Assessing of Quantum Yield
The quantum yield (QY) of DBPhen was assessed according to a common procedure. In brief, DBPhen was dispersed in MeOH (η = 1.33), and quinine sulfate was dispersed in 100 mM H2SO4 (η = 1.33, QY = 54%) as a standard. The absorption and fluorescence spectra were monitored at a 400 nm excitation wavelength. The absorption values of the sample and standard were kept below 0.1. The integrated fluorescence intensity of the sample as the function of the absorption was compared with the standard utilizing this formula:
where QY refers to the quantum yield, η is the refractive index of solvent, I refers to the integrated fluorescence intensity, A refers to the absorption value at 400 nm, x is DBPhen, and y is standard.
QYx = QYy(Ay/Ax)(Ix/Iy)(ηx2/ηy2)
2.5. Measurement of Fluorescence and UV-VIS Spectra
Aqueous solutions of metal ions (Fe2+, Ca2+, K+, Cd2+, Pb2+, Hg2+, Cu2+, Na+, Ni2+, Sn2+, Zn2+, Co2+, and Fe3+) were prepared for fluorescence and UV-VIS absorption measurements. DBPhen solution was prepared in MeOH solvent. Working solutions of metal ions and DBPhen were freshly made from the stock solutions. The excitation was recorded at 400 nm with a 5 nm slit width. For a selectivity study, a final concentration of 500 µM of metal ions (200 µL) was mixed with 1 µg/mL DBPhen (800 µL) to measure the UV-VIS absorption and fluorescence spectra. For reaction purposes, 1 min of mixing time was performed before the measurements. For a sensitivity study, final concentrations of 10–500 µM of Cu2+ (200 µL) were mixed with DBPhen (800 µL) for 1 min, followed by the measurement of their UV-VIS spectra. The reversibility of original absorbance and fluorescence emission spectra of DBPhen were determined by adding CN− (1000 µM) to the DBPhen/Cu2+ complex.
2.6. Determination of Limit of Detection
The calibration curve was obtained by adding Cu2+ with different concentrations (10–100 μM) to the DBPhen solution to obtain the detection limit (LOD) of Cu2+, UV-VIS absorption bands of DBPhen and DBPhen/Cu2+ complex at ~545 nm were measured in triplicate, and the standard deviation (SD) of blank control was calculated. The following equation was used to determine the LOD:
where σ stands for the SD of blank control and s stands for the slope of the calibration curve [].
LOD = 3σ/s
3. Results and Discussion
3.1. Preparation and Characteristics of DBPhen
The synthesis route of DBPhen can be seen in Scheme 1. The o-alkynylaniline intermediate (3) was synthesized by the well-known Sonogashira reaction between 2-iodo-4-methylaniline (1) and phenyl acetylene (2). Further, the anhydrous FeCl3 promoted in situ Swern oxidation of cyclohexanone to generate the 1,2-cyclohexanedione reaction with two-fold of 4-methyl-2-(phenylethynyl)aniline (3), which afforded the desired DBPhen scaffold (4). The characteristics of DBPhen were confirmed by 1H NMR spectrum (Figure S1 in the Supplementary Materials), 13CN MR spectrum (Figure S2), and XR FT-MS data (Figure S3). 1H NMR (400 MHz, CDCl3) δ 8.37 (d, J = 8.6 Hz, 2H), 7.73 (s, 2H), 7.53 (dd, J = 8.7, 1.6 Hz, 2H), 7.25–7.14 (m, 6H), 7.07 (d, J = 7.1 Hz, 4H), 4.54 (s, 4H), 3.06 (s, 4H), 2.50 (s, 6H); 13C NMR (101 MHz, CDCl3) δ 151.46, 146.34, 140.83, 138.46, 136.97, 131.31, 130.91, 130.63, 128.49, 127.76, 127.72, 126.11, 122.40, 33.04, 24.79, 21.96; XR FT-MS (EI) calculated for C36H31N2 [M + H]+: 491.24818; found: 491.24830.
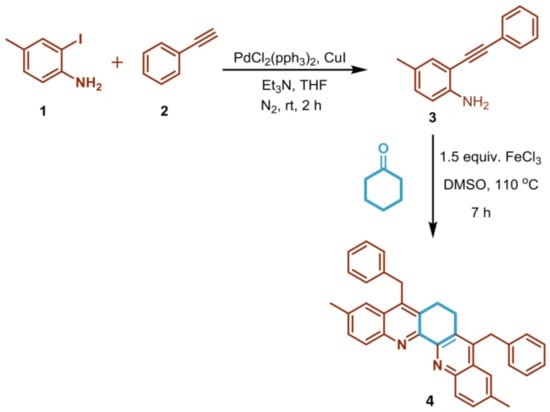
Scheme 1.
Synthesis route to prepare DBPhen scaffold.
3.2. Optical Properties of DBPhen
The fluorescence emission spectra of DBPhen were measured. Figure 1a depicts the fluorescence emission spectra of DBPhen excited at 400 nm with different concentrations of DBPhen ranging from 0.2 to 1.0 µg/mL. The relative highest emission peak of DBPhen was observed at concentrations of 0.8 and 1.0 µg/mL. By increasing the DBPhen concentration, the emission peak center was slightly moved to a longer wavelength. The emission peak center was likely to depend on DBPhen’s concentration, and the intensity increased with increasing concentration. However, once the concentration increases so much that DBPhen’s absorbance becomes significant, the absorption of light will affect the emission spectrum. The primary rationale for the emission shift is the formation probability of molecular clusters/aggregates. In the case of a molecular system, aggregation-induced emission (AIE) and aggregation-caused quenching (ACQ) are the two notable occasions that happen in a lot of the organic molecules, resulting in enhancement and quenching of fluorescence intensity, respectively []. Several molecules showed aggregation-induced red-shifted emission (AIRSE). The presence of red-shifted and enhancing emission intensity at ~480 nm with an increase in DBPhen’s concentration produced the J-aggregates in its concentrated solutions []. The aggregation of DBPhen generated in a continuous fluorescence’s red-shift as the concentration increased. Intermolecular forces like dipole–dipole and van der Waals might be responding to this aggregation []. Optical characteristics verify that the concentration-tunable fluorescence is related to DBPhen’s aggregation, resulting in the continuous red-shift in fluorescence emission. In addition, Figure S4 shows the fluorescence excitation (FLE) features of the DBPhen compound. FLE intensities of DBPhen at 400 and 650 nm increased gradually with its increasing concentration, while intensities at 250, 290, and 315 nm decreased with the increasing concentration of DBPhen.
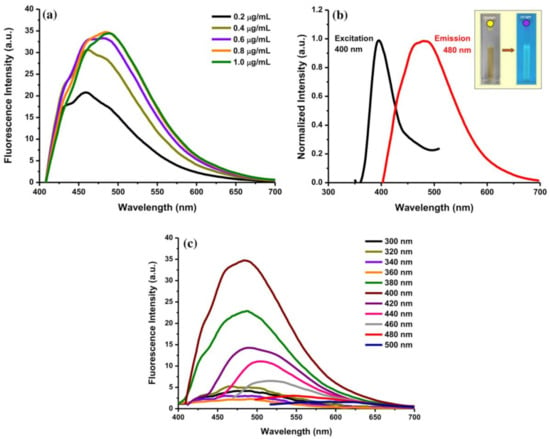
Figure 1.
(a) The fluorescence spectra of DBPhen in MeOH at various concentrations (0.2–1.0 µg/mL), (b) the optimum excitation and fluorescence spectra of DBPhen (0.8 µg/mL) (inset: the appearance of DBPhen solution under daylight and UV light), and (c) the fluorescence spectra of DBPhen (0.8 µg/mL) with excitation wavelengths of 300–500 nm.
The intense peaks of the fluorescence excitation and emission spectra are depicted in Figure 1b. The fluorescence spectra possessed the maximum excitation at ~400 nm and emission at ~480 nm. The fluorescence emission intensity is based on the intense particles of DBPhen with excitation at 400 nm. Figure 1c exhibits the fluorescence spectra of DBPhen at numerous excitation wavelengths. The emission spectra denoted the specific excitation-independent emission nature of DBPhen. The fluorescence emission spectrum first increased with the excitation wavelength from 300 to 320 nm and then the emission spectrum decreased with increasing the excitation wavelengths from 320 to 360 nm. The intense emission peak was observed at 380–420 nm excitation wavelength, with the highest emission peak excited at 400 nm compared with other excitation wavelengths. The fluorescence emission peak was then decreased after exciting at 440–500 nm, indicating that fewer DBPhen molecules were excited at these excitation wavelengths. Besides, the DBPhen emission spectrum’s shape was associated with the concentration of DBPhen and the excitation wavelength. As depicted in Figure S5a–d, the fluorescence emission spectral features of DBPhen with different concentrations were influenced by different excitation wavelengths. The spectral shape was slightly altered but not significantly so. The emission intensity was dependent on the excitation wavelength, and the highest emission intensity was observed with the excitation of 400 nm for all concentrations. Moreover, photographs of DBPhen solution irradiated under daylight and UV light were taken (inset of Figure 1b). Under daylight, the solution color of DBPhen was yellow. Meanwhile, the DBPhen solution emitted a blue fluorescence under the UV light, which could be viewed clearly by the naked eye.
The UV-VIS absorption spectra were measured to explore the optical characteristics of DBPhen at concentrations of 0.2–1.0 µg/mL. The UV-VIS spectra of DBPhen exhibited a broad absorbance band at 210–250 nm and a shoulder peak at 320–390 nm (Figure 2). The intense peak centered at 210–250 nm was derived from the π-π* energy transition in the π system of DBPhen [], where the shoulder peak at 320–390 nm was derived from the n-π* energy transition of DBPhen. The dilution factor valuably altered the absorption of the shoulder peak. The apparent absorption peak was valuably increased and red-shifted to longer wavelengths. J-aggregates are a bathochromic shift (red-shift) in absorption because of the π-stacking aromatic molecules, in which molecules orient in head-to-tail fashion []. The concentration dependence of DBPhen resulted in an aggregate band (bathochromic J-band), which is red-shifted to higher wavelengths []. If the concentration of DBPhen is low, the aggregation will not be formed in the solution, while increasing DBPhen’s concentration led to the formation of an aggregate band at 320–390 nm. Besides, the fluorescence QY of DBPhen was estimated by assessing 400 nm excitation wavelength, and the absorbance was maintained below 0.1. The QY was about 7.9%. The result suggests that DBPhen exhibited a relatively moderate fluorescence QY property.
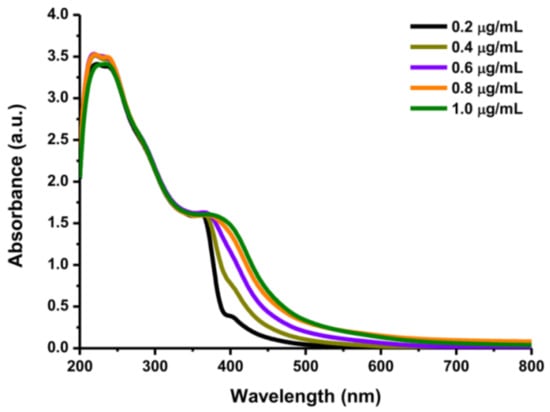
Figure 2.
UV-VIS absorption spectra of DBPhen with concentrations between 0.2 and 1.0 µg/mL.
3.3. Selectivity of DBPhen toward Metal Ions
It is commonly agreed that a remarkable selectivity is an exceptional standard for the desired chemical sensor. Thus, the impact of numerous metal ions on the DBPhen solution was monitored. Accordingly, the fluorescence intensities of DBPhen after mixing with different metal ions were measured. The recognition capability was determined by comparing the fluorescence intensity of DBPhen and that of DBPhen/metal ions. The perturbations in the emission intensity at a maximum emission peak happened in the presence of several metal ions (1000 µM) (Figure S6a,b). The histogram was figured out by plotting F/F0 vs. the level of metal ions (Figure S6c). F0 and F are DBPhen’s fluorescence intensities without and with the addition of metal ions, respectively. These metal ions exhibited distinctive effects on the fluorescence nature of DBPhen. Notably, several metal ions showed a quenching effect on the fluorescence intensity, where K+, Na+, and Zn2+ showed a limited quenching effect; Cu2+, Ni2+, Hg2+, and Co2+ exhibited a significant quenching behavior (Figure S6a). On the other hand, some metal ions, including Ca2+, Fe2+, Pb2+, Fe3+, Sn2+, and Cd2+, enhanced the fluorescence emission intensities of DBPhen (Figure S6b). Although Cu2+ and Cd2+ had a substantial effect on the emission intensity, other metal ions also had a significant impact on the fluorescence behavior. Many metal ions can enhance or reduce the emission intensities of DBPhen. These results indicate that it was challenging to consider DBPhen as a fluorescence sensor for detecting metal ions because almost all metal ions affected the fluorescence behavior.
Photographs of DBPhen solutions after mixing with several metal ions were captured to visualize the selectivity (Figure S7). Under daylight, the DBPhen/metal ion solutions were all yellow except for the DBPhen/Cu2+ solution. Under UV light, the DBPhen/metal ions exhibited blue to bright green emission, which could be viewed obviously by the naked eye. The color of DBPhen/metal ions is correlated to their emission peak centers. The solutions with blue color possessed an emission wavelength that was shorter than that of the solutions with green color. For instance, the DBPhen/Na+ system had a bright blue color with the fluorescence emission peak center at 470 nm, while the DBPhen/Sn2+ system had bright green color with the fluorescence emission center at 505 nm. Some metal ions exhibiting a fluorescence quenching effect had slight dimming in emission color. Unlike those of other metal ions, the color of the DBPhen solution after adding Cu2+ was purple under daylight and did not emit the emission color under UV light. No emission color under UV light was consistent with the highest reduction effect on the emission intensity. The above findings indicate that the DBPhen/metal ions exhibited quenching and enhancement effects on their fluorescence emission intensities with different emission colors based on their emission wavelength centers.
Furthermore, the UV-VIS spectroscopic experiment was carried out by the addition of numerous metal ions (500 µM) to the DBPhen solution to observe the selectivity of DBPhen to metal ions. The recognition capability was measured by comparing the absorption spectra of the DBPhen solutions before and after adding numerous metal ions. The responses of different metal ions to DBPhen on the UV-VIS absorbance are shown in Figure 3. Notably, only Cu2+ exhibited a new absorption band at ~545 nm, while other metal ions induced negligible absorption spectral changes. Therefore, the DBPhen compound can recognize Cu2+ ions selectively based on the absorption peak. Besides, DBPhen had a visual color change from yellow to purple after adding Cu2+ to the DBPhen solution, which can be seen clearly in Figure 4. In contrast, no color change was found after adding different metal ions under similar conditions. Only Cu2+ induced the color change of the DBPhen solution. These findings show that DBPhen possessed specific selectivity toward Cu2+ based on the absorption character and color change. Therefore, DBPhen can be utilized as a colorimetric sensor for simple naked-eye recognition of Cu2+ ions.
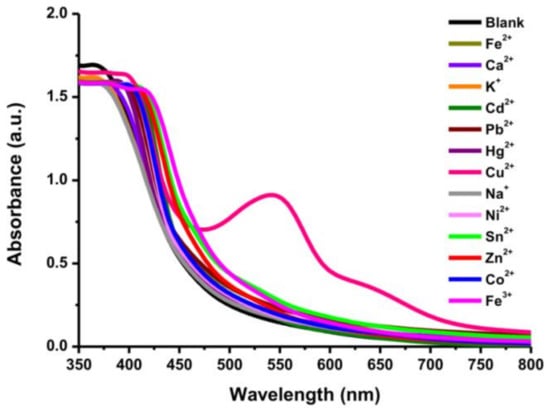
Figure 3.
UV-VIS spectra of DBPhen solutions with the addition of various metal ions (500 µM).
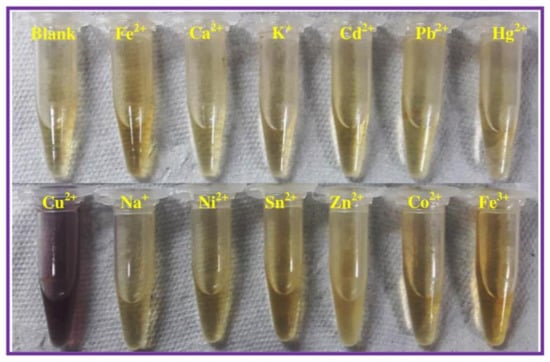
Figure 4.
Appearance of DBPhen solutions after adding numerous metal ions (500 µM).
Moreover, observing the effect of the solvent mixing itself on the sensor’s colorimetric and fluorescence properties, DBPhen was combined with Cu2+ using MeOH and H2O as solvents. The relative fluorescence emission intensities and UV-VIS absorbance showed no significant effects using both solvents in the detection of Cu2+ (Figure S8a,b, 2&3). For the counterion’s impact on the detection, Cu2+ ions from the sources of CuCl2 and CuSO4 were examined. It was found that there was no beneficial effect on the fluorescence and UV-VIS absorbance behaviors (Figure S8a,b, 3&4). Therefore, the anions did not influence the interaction between DBPhen and Cu2+ in an aqueous solution.
3.4. Sensitivity of DBPhen to Copper Ions
The impact of mixing time on the reaction between DBPhen and Cu2+ was initially monitored via the UV-VIS absorption spectra of the DBPhen/Cu2+ complexes (Figure 5a). It can be observed that the reaction between DBPhen and Cu2+ was rapid and complete with 1 min of both mixing and incubation durations. To further examine the sensitivity to recognize Cu2+ ions, the UV-VIS absorption spectra of the DBPhen solutions with various levels of Cu2+ (10–500 µM) were measured (Figure 5b). It can be seen that the peak at ~545 nm enhanced progressively by increasing the level of Cu2+, indicating the forming of DBPhen/Cu2+ complexes with a change of color from yellow to purple. The purple color of the solution was enhanced by increasing the level of Cu2+ (Figure 5c).
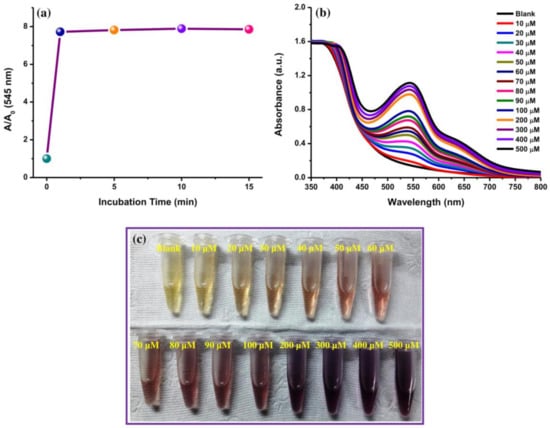
Figure 5.
(a) The plot of incubation time vs. the UV-VIS absorption peak of DBPhen/Cu2+ complex (A/A0) at ~545 nm, (b) the UV-VIS spectra of DBPhen solution with different levels of Cu2+, and (c) the solution appearance of DBPhen solutions after adding Cu2+ with concentrations ranging from 0 to 500 µM.
The analytical performance of DBPhen was analyzed by plotting the relation curve of [Cu2+] versus A/A0 (where A is the absorption of DBPhen at ~545 nm in the existence of Cu2+, and A0 is the absorbance of DBPhen at ~545 nm without adding Cu2+). It can be observed that the A/A0 values show a linear relationship to [Cu2+] between 10 and 100 µM, and the A/A0 values approach a fixed value when [Cu2+] is higher than 100 µM (Figure 6a). The procedure validity was evaluated by determining the linear range, coefficient of determination (R2), and limit of detection (LOD). The calibration curve was linear over the Cu2+ concentrations ranging from 10 to 100 µM with an R2 of 0.9972 (Figure 6b). The LOD was estimated to be 0.14 µM (σ = 0.002 and s = 0.0414) according to the International Union of Pure and Applied Chemistry (IUPAC) standard (3σ/s). For comparison, the performance of DBPhen was compared with those of some other analytical methods for Cu2+ (Table 1). This shows that this colorimetric sensor owned a lower or comparable LOD for Cu2+ with a wide linear range than other reported sensors. From this point of view, DBPhen as a colorimetric sensor can simply, quickly, and effectively recognize Cu2+.
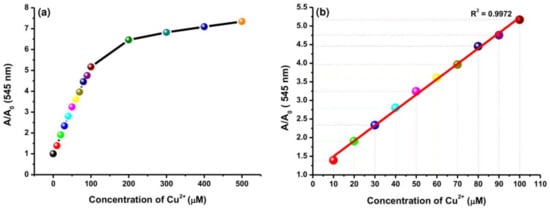
Figure 6.
(a) Plot of A/A0 at ~545 nm with Cu2+ concentrations of 0–500 µM and (b) the linear relationship between the absorption at ~545 nm and Cu2+ concentrations of 10–100 µM.

Table 1.
Comparison of DBPhen as a colorimetric sensor with other sensors to detect Cu2+.
3.5. Reversibility of DBPhen Origin by Adding CN−
The decomplexation between DBPhen and Cu2+ was studied by assessing the UV-VIS and fluorescence characteristics. The reversibility of the reaction between DBPhen and Cu2+ to form a complex during the recognition process was evaluated by introducing CN− as the competing chelating agent to DBPhen and Cu2+. Interestingly, the addition of CN− to the complex showed a significant change in the UV-VIS spectrum and a color change. Figure 7a shows the removal of the absorption peak of DBPhen/Cu2+ at ~545 nm after adding CN− (1000 µM). The reduced fluorescence intensity of the DBPhen/Cu2+ complex was also recovered upon the addition of CN− (Figure 7b), which indicates that the DBPhen and Cu2+ reaction in the sensing process is reversible to a certain degree []. The reversible switching of fluorescence intensity cycles of DBPhen by the CN− addition into the DBPhen/Cu2+ complex indicated that Cu2+ was released from the complex. In the existence of CN−, the purple color of the DBPhen/Cu2+ complex was changed to the original color of DBPhen (yellow) (Figure S9). The coagulation was formed after incubation of the sample for 25 min, and the precipitation was separated by using centrifugation for 5 min at 5000 rpm. In this manner, this indicates an estimation that the DBPhen/Cu2+ complex is also a prospect sensor for CN−.
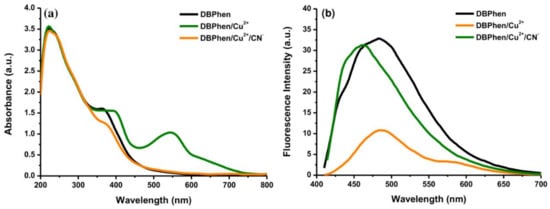
Figure 7.
(a) UV-VIS and (b) fluorescence spectra of DBPhen (black), DBPhen/Cu2+ (green), and DBPhen/Cu2+ after the addition of CN− (orange). The concentrations of Cu2+ and CN− were 500 and 1000 µM, respectively.
3.6. Recognition of Cu2+ in Real Water Samples
The DBPhen-based colorimetric Cu2+ sensor was used to detect the content of Cu2+ in real environmental water samples, including groundwater and lake water samples. The groundwater was used without any filtrations, while the lake water was used after filtration with filter paper and a 0.22 µm membrane filter. The standard solution of Cu2+ (10, 20, and 50 µM) was spiked into the real water samples and interacted with the DBPhen compound. The standard addition method was utilized to calculate the recovery percentages. The UV-VIS absorption spectrum was assessed with three repetitive measurements to calculate their average recovery percentages and relative standard deviations (RSDs). The results of the spiked water samples are displayed in Table 2. It can be observed that the spiked recoveries of Cu2+ ranged from 91.05% to 105.97%. The RSDs ranged from 2.18% to 3.79% for all the samples. These findings declare that DBPhen as a colorimetric sensor would be competitive and could be utilized as an alternative method for recognizing Cu2+ in real water samples.

Table 2.
Detection of Cu2+ in real water samples (n = 3).
3.7. Possible Sensing Mechanism
The potential sensing mechanism for the reaction of DBPhen to Cu2+ was further discussed. After adding Cu2+, the fluorescence of DBPhen was highly reduced because of the paramagnetic character of metal ions. Then, the DBPhen molecule could selectively bind to Cu2+ and change the solution color rapidly from yellow to purple. Further, a noticeable spectral response with a new absorbance peak at ~545 nm was contributed by a coordinate covalent bond between DBPhen and Cu2+. Hence, the binding of the two species resulted in a sensitive optical readout. The color change in the DBPhen solution upon interaction with Cu2+ is due to the electron transfer from the DBPhen ligand to Cu2+. Due to the strong “metal-to-ligand charge transfer absorption” of the DBPhen/Cu2+ complex, an absorption peak was exhibited; therefore, a color change was displayed. Compared with other metal ions, Cu2+ shows stronger affinities with the phen compound since phen compounds act as good ligands for strong interaction with Cu2+ [,]. The electron transfer from the DBPhen ligand to Cu2+ is also responsible for the fluorescence quenching character of the ligand upon complexation with metal ions. Cu2+ may easily establish the coordination interaction with N-heterocyclic rings of DBPhen, resulting in the electron or energy transfer from DBPhen to Cu2+. These findings denote the formation of chelate systems between Cu2+ and DBPhen. Thus, DBPhen recognized Cu2+, causing an electron transfer mechanism. The coordination of Cu2+ to ligand via two N-heterocyclic ring atoms of DBPhen and the proposed mechanism of DBPhen/Cu2+ complexation are presented in Figure 8. The strong chelating ability of DBPhen toward Cu2+ was responsible for both fluorescence and color changes with a new absorption peak. Upon exposure to a high concentration of CN− [Cu2+ with chelating ligands], CN− may facilitate Cu2+ to frame a highly stable complex [Cu(CN)x)n−] due to the high complex stability constant between Cu2+ and CN− []. In the DBPhen/Cu2+ complex, Cu2+ possessed a great binding affinity for CN− due to the decomplexation of Cu2+ from DBPhen. The plausible demetallation mechanism of the DBPhen/Cu2+ complex by CN− can be seen in Figure S10.
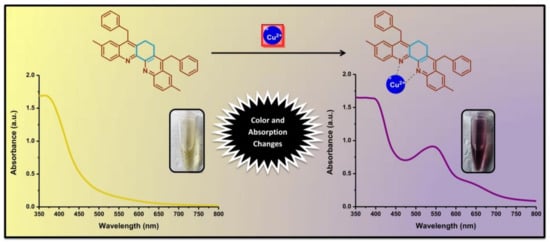
Figure 8.
Proposed sensing mechanism of the interaction between DBPhen and Cu2+.
4. Conclusions
In conclusion, a DBPhen scaffold as a new colorimetric sensor for a simple and rapid recognition of Cu2+ was introduced. The in situ oxidized product of 1,2-cyclohexanedione encounters a double imination and hydroenamination reaction cascade with two-fold of o-alkynylaniline molecules to produce the DBPhen compound. DBPhen was produced through an easy and low-cost preparation procedure. Upon binding with Cu2+, DBPhen had a color change from yellow to purple. DBPhen displayed high selectivity toward Cu2+ and high sensitivity with a detection limit of 0.14 μM. Besides, DBPhen acted as a reversible colorimetric sensor for Cu2+ ions utilizing CN− as a restoring agent. The recovery studies of the real water samples demonstrated the value of DBPhen in practical applications as a fast, selective, and sensitive sensor for Cu2+ ions.
Supplementary Materials
The following are available online at https://www.mdpi.com/2227-9040/9/1/7/s1, Figure S1: 1H NMR spectrum of DBPhen, Figure S2: 13CN MR spectrum of DBPhen, Figure S3: XR FT-MS spectra of DBPhen, Figure S4: Fluorescence excitation (FLE) spectra of DBPhen with various concentrations (0.2–1.0 µg/mL), Figure S5: Emission spectra of DBPhen with concentrations of (a) 0.2, (b) 0.4, (c) 0.6, and 1.0 µg/mL excited at 320, 380, 400, and 440 nm, Figure S6: (a) Reducing effect on the emission intensity of DBPhen after interaction with some metal ions, (b) enhancing effect on the emission intensity of DBPhen after interaction with some metal ions, and (c) relative emission intensities (F/F0) of DBPhen without and with numerous metal ions. The concentration of metal ions was 1000 µM, Figure S7: Appearance of DBPhen solution after the addition of numerous metal ions under daylight and UV light, Figure S8: Relative (a) fluorescence emission intensities (F/F0) and (b) UV-VIS absorbance spectra (A/A0) of (1) DBPhen, (2) DBPhen/Cu2+ in MeOH, (3) DBPhen/Cu2+ in H2O with Cl−, and (4) DBPhen/Cu2+ in H2O with SO42−. The concentrations of DBPhen and Cu2+ were 0.8 µg/mL and 500 µM, respectively, Figure S9: Solution appearance of (1) DBPhen, (2) DBPhen/Cu2+, and (3) DBPhen/Cu2+ with the addition of CN−, Figure S10: Proposed binding mechanism of the DBPhen/Cu2+ complex for CN−.
Author Contributions
Conceptualization, M.Z., G.K.D., G.G.H., and J.-J.W.; methodology, M.Z. and G.K.D.; validation, M.Z. and G.K.D.; formal analysis, M.Z. and G.K.D.; investigation, M.Z. and G.K.D.; resources, G.G.H. and J.-J.W.; data curation, H.-F.C.; writing—original draft preparation, M.Z.; writing—review and editing, M.Z., G.K.D., H.-F.C., and G.G.H.; visualization, M.Z.; supervision, G.G.H. and J.-J.W.; project administration, G.G.H.; funding acquisition, G.G.H., H.-F.C., and J.-J.W. All authors have read and agreed to the published version of the manuscript.
Funding
We declare the financial support from the Taiwan Ministry of Science and Technology under grants MOST107-2113-M-037-013 and MOST108-2113-M-037-015-MY3. This study was also funded by grants from the Kaohsiung Medical University Research Foundation (KMU-M109025, KMU-M110008, and KMU-DK 109006~4).
Institutional Review Board Statement
Not applicable.
Informed Consent Statement
Not applicable.
Data Availability Statement
Data sharing is not applicable.
Acknowledgments
The authors thank the Center for Research and Development and Department of Medicinal and Applied Chemistry, Kaohsiung Medical University, for facilitating the instruments.
Conflicts of Interest
The authors declare no conflict of interest.
References
- Rasheed, T.; Bilal, M.; Nabeel, F.; Iqbal, H.M.N.; Li, C.; Zhou, Y. Fluorescent sensor based models for the detection of environmentally-related toxic heavy metals. Sci. Total Environ. 2018, 615, 476–485. [Google Scholar] [CrossRef] [PubMed]
- Liu, S.; Wang, Y.M.; Han, J. Fluorescent chemosensors for copper(II) ion: Structure, mechanism and application. J. Photochem. Photobiol. C Photochem. Rev. 2017, 32, 78–103. [Google Scholar] [CrossRef]
- Tapiero, H.; Townsend, D.M.; Tew, K.D. Trace elements in human physiology and pathology. Copper. Biomed. Pharmacother. 2003, 57, 386–398. [Google Scholar] [CrossRef]
- Chen, Z.E.; Zang, X.F.; Yang, M.; Zhang, H. A simple indolo[2,3-a]carbazole based colorimetric chemosensor for simultaneous detection of Cu2+ and Fe3+ ions. Spectrochim. Acta Part A Mol. Biomol. Spectrosc. 2020, 234, 118236. [Google Scholar] [CrossRef]
- DiDonato, M.; Sarkar, B. Copper transport and its alterations in Menkes and Wilson diseases. Biochim. Biophys. Acta Mol. Basis Dis. 1997, 1360, 3–16. [Google Scholar] [CrossRef]
- Gaggelli, E.; Kozlowski, H.; Valensin, D.; Valensin, G. Copper homeostasis and neurodegenerative disorders (Alzheimer’s, prion, and Parkinson’s diseases and amyotrophic lateral sclerosis). Chem. Rev. 2006, 106, 1995–2044. [Google Scholar] [CrossRef]
- Dusek, P.; Roos, P.M.; Litwin, T.; Schneider, S.A.; Flaten, T.P.; Aaseth, J. The neurotoxicity of iron, copper and manganese in Parkinson’s and Wilson’s diseases. J. Trace Elem. Med. Biol. 2015, 31, 193–203. [Google Scholar] [CrossRef]
- Şahan, S.; Şahin, U. Determination of copper(II) using atomic absorption spectrometry and eriochrome blue black R loaded Amberlite XAD-1180 resin. Clean Soil Air Water 2010, 38, 485–491. [Google Scholar] [CrossRef]
- Saleem, M.; Lee, K.H. Selective fluorescence detection of Cu2+ in aqueous solution and living cells. J. Lumin. 2014, 145, 843–848. [Google Scholar] [CrossRef]
- Ganjali, M.R.; Hajiagha Babaei, L.; Badiei, A.; Mohammadi Ziarani, G.; Tarlani, A. Novel Method for the Fast Preconcentration and Monitoring of a ppt Level of Lead and Copper with a Modified Hexagonal Mesoporous Silica Compound and Inductively Coupled Plasma Atomic Emission Spectrometry. Anal. Sci. 2004, 20, 725–729. [Google Scholar] [CrossRef]
- Ergül, S. Qualitative Analysis of Cu2+, Co2+, and Ni2+ Cations Using Thin-Layer Chromatography. J. Chromatogr. Sci. 2004, 42, 121–124. [Google Scholar] [CrossRef] [PubMed][Green Version]
- Huang, G.G.; Yang, J. Selective detection of copper ions in aqueous solution based on an evanescent wave infrared absorption spectroscopic method. Anal. Chem. 2003, 75, 2262–2269. [Google Scholar] [CrossRef] [PubMed]
- Wang, Y.; Su, Z.; Wang, L.; Dong, J.; Xue, J.; Yu, J.; Wang, Y.; Hua, X.; Wang, M.; Zhang, C.; et al. SERS Assay for Copper(II) Ions Based on Dual Hot-Spot Model Coupling with MarR Protein: New Cu2+-Specific Biorecognition Element. Anal. Chem. 2017, 89, 6392–6398. [Google Scholar] [CrossRef]
- Xi, W.; Gong, Y.; Mei, B.; Zhang, X.; Zhang, Y.; Chen, B.; Wu, J.; Tian, Y.; Zhou, H. Schiff base derivatives based on diaminomaleonitrile: Colorimetric and fluorescent recognition of Cu(II), cell imaging application, polymorph-dependent fluorescence and aggregation-enhanced emission. Sens. Actuators B Chem. 2014, 205, 158–167. [Google Scholar] [CrossRef]
- An, R.; Zhang, D.; Chen, Y.; Cui, Y. zhi A “turn-on” fluorescent and colorimetric sensor for selective detection of Cu2+ in aqueous media and living cells. Sens. Actuators B Chem. 2016, 222, 48–54. [Google Scholar] [CrossRef]
- Xiong, J.J.; Huang, P.C.; Zhang, C.Y.; Wu, F.Y. Colorimetric detection of Cu2+ in aqueous solution and on the test kit by 4-aminoantipyrine derivatives. Sens. Actuators B Chem. 2016, 226, 30–36. [Google Scholar] [CrossRef]
- Mohammadi, A.; Yaghoubi, S. Development of a highly selective and colorimetric probe for simultaneous detection of Cu2+ and CN− based on an azo chromophore. Sens. Actuators B Chem. 2017, 251, 264–271. [Google Scholar] [CrossRef]
- Ye, B.H.; Tong, M.L.; Chen, X.M. Metal-organic molecular architectures with 2,2′-bipyridyl-like and carboxylate ligands. Coord. Chem. Rev. 2005, 249, 545–565. [Google Scholar] [CrossRef]
- Chelucci, G.; Thummel, R.P. Chiral 2,2′-bipyridines, 1,10-phenanthrolines, and 2,2′:6′,2″-terpyridines: Syntheses and applications in asymmetric homogeneous catalysis. Chem. Rev. 2002, 102, 3129–3170. [Google Scholar] [CrossRef]
- Sammes, P.G.; Yahioglu, G. 1-10-Phenanthroline: A Versatile Ligand. Chem. Soc. Rev. 1994, 23, 327–334. [Google Scholar] [CrossRef]
- Bencini, A.; Lippolis, V. 1,10-Phenanthroline: A versatile building block for the construction of ligands for various purposes. Coord. Chem. Rev. 2010, 254, 2096–2180. [Google Scholar] [CrossRef]
- Alreja, P.; Kaur, N. Recent advances in 1,10-phenanthroline ligands for chemosensing of cations and anions. RSC Adv. 2016, 6, 23169–23217. [Google Scholar] [CrossRef]
- Zheng, J.R.; Ren, N.; Zhang, J.J.; Zhang, D.H.; Yan, L.Z.; Li, Y. Crystal structures and luminescent and thermal properties of lanthanide complexes with 3,5-diisopropylsalicylic acid and 1,10-phenanthroline. J. Chem. Eng. Data 2012, 57, 2503–2512. [Google Scholar] [CrossRef]
- Correa-Ascencio, M.; Galván-Miranda, E.K.; Rascón-Cruz, F.; Jiménez-Sandoval, O.; Jiménez-Sandoval, S.J.; Cea-Olivares, R.; Jancik, V.; Toscano, R.A.; García-Montalvo, V. Lanthanide(III) complexes with 4,5-Bis(diphenylphosphinoyl)-1,2,3- triazolate and the use of 1,10-phenanthroline as auxiliary ligand. Inorg. Chem. 2010, 49, 4109–4116. [Google Scholar] [CrossRef]
- Satheeshkumar, R.; Edatt, L.; Muthusankar, A.; Sameer Kumar, V.B.; Rajendra Prasad, K.J. Synthesis of Novel Quin[1,2-b]Acridines: In Vitro Cytotoxicity and Molecular Docking Studies. Polycycl. Aromat. Compd. 2019, 1–15. [Google Scholar] [CrossRef]
- Luo, S.P.; Chen, N.Y.; Sun, Y.Y.; Xia, L.M.; Wu, Z.C.; Junge, H.; Beller, M.; Wu, Q.A. Heteroleptic copper(I) photosensitizers of dibenzo[b,j]-1,10-phenanthroline derivatives driven hydrogen generation from water reduction. Dyes Pigment. 2016, 134, 580–585. [Google Scholar] [CrossRef]
- Choi, A.W.T.; Poon, C.S.; Liu, H.W.; Cheng, H.K.; Lo, K.K.W. Rhenium(i) polypyridine complexes functionalized with a diaminoaromatic moiety as phosphorescent sensors for nitric oxide. New J. Chem. 2013, 37, 1711–1719. [Google Scholar] [CrossRef]
- Dhandabani, G.K.; Mutra, M.R.; Wang, J.J. FeCl3-Promoted ring size-dictating diversity-oriented synthesis (DOS) of N-heterocycles using: In situ -generated cyclic imines and enamines. Chem. Commun. 2019, 55, 7542–7545. [Google Scholar] [CrossRef]
- Tian, M.; Liu, Y.; Wang, Y.; Zhang, Y. Yellow-emitting carbon dots for selective detecting 4-NP in aqueous media and living biological imaging. Spectrochim. Acta Part A Mol. Biomol. Spectrosc. 2019, 220, 117117. [Google Scholar] [CrossRef]
- Ramya, S.; Nataraj, D.; Krishnan, S.; Premkumar, S.; Thrupthika, T.; Sangeetha, A.; Senthilkumar, K.; Thangadurai, T.D. Aggregation induced emission behavior in oleylamine acetone system and its application to get improved photocurrent from In2S3 quantum dots. Sci. Rep. 2020, 10, 19712. [Google Scholar] [CrossRef]
- Kagatikar, S.; Sunil, D.; Kekuda, D.; Kulkarni, S.D.; Abdul Salam, A.A. New salicylaldehyde azine esters: Structural, aggregation induced fluorescence, electrochemical and theoretical studies. J. Mol. Liq. 2020, 318, 114029. [Google Scholar] [CrossRef]
- Jia, W.; Yang, P.; Li, J.; Yin, Z.; Kong, L.; Lu, H.; Ge, Z.; Wu, Y.; Hao, X.; Yang, J. Synthesis and characterization of a novel cyanostilbene derivative and its initiated polymers: Aggregation-induced emission enhancement behaviors and light-emitting diode applications. Polym. Chem. 2014, 5, 2282–2292. [Google Scholar] [CrossRef]
- Tammiku, J.; Burk, P.; Tuulmets, A. UV-VIS spectrum of the 1,10-phenanthroline- ethylmagnesium bromide complex. An experimental and computational study. Main Gr. Met. Chem. 2000, 23, 301–305. [Google Scholar] [CrossRef]
- Kumar, V.; Baker, G.A.; Pandey, S.; Baker, S.N.; Pandey, S. Contrasting behavior of classical salts versus ionic liquids toward aqueous phase J-aggregate dissociation of a cyanine dye. Langmuir 2011, 27, 12884–12890. [Google Scholar] [CrossRef] [PubMed]
- Dineshkumar, S.; Muthusamy, A. Investigation of aggregation induced emission in 4-hydroxy-3- methoxybenzaldehyde azine and polyazine towards application in (opto) electronics: Synthesis, characterization, photophysical and electrical properties. Des. Monomers Polym. 2017, 20, 234–249. [Google Scholar] [CrossRef]
- Shekari, Z.; Younesi, H.; Heydari, A.; Tajbakhsh, M.; Chaichi, M.J.; Shahbazi, A.; Saberi, D. Fluorescence chemosensory determination of Cu2+ using a new rhodamine-Morpholine conjugate. Chemosensors 2017, 5, 26. [Google Scholar] [CrossRef]
- Xu, X.; Daniel, W.L.; Wei, W.; Mirkin, C.A. Colorimetric Cu2+ detection using DNA-modified gold-nanoparticle aggregates as probes and click chemistry. Small 2010, 6, 623–626. [Google Scholar] [CrossRef]
- Yadav, N.; Singh, A.K. Dicarbohydrazide based chemosensors for copper and cyanide ions: Via a displacement approach. New J. Chem. 2018, 42, 6023–6033. [Google Scholar] [CrossRef]
- Ni, Y.; Lin, D.; Kokot, S. Synchronous fluorescence, UV-visible spectrophotometric, and voltammetric studies of the competitive interaction of bis(1,10-phenanthroline)copper(II) complex and neutral red with DNA. Anal. Biochem. 2006, 352, 231–242. [Google Scholar] [CrossRef]
- Bhalla, V.; Singh, H.; Kumar, M. Triphenylene based copper ensemble for the detection of cyanide ions. Dalton Trans. 2012, 41, 11413–11418. [Google Scholar] [CrossRef]
Publisher’s Note: MDPI stays neutral with regard to jurisdictional claims in published maps and institutional affiliations. |
© 2020 by the authors. Licensee MDPI, Basel, Switzerland. This article is an open access article distributed under the terms and conditions of the Creative Commons Attribution (CC BY) license (http://creativecommons.org/licenses/by/4.0/).