Article

Development of Gold Nanoparticles Decorated Molecularly Imprinted–Based Plasmonic Sensor for the Detection of Aflatoxin M1 in Milk Samples

Department of Chemistry, Hacettepe University, Ankara 06800, Turkey
*
Author to whom correspondence should be addressed.
Chemosensors 2021, 9(12), 363; https://doi.org/10.3390/chemosensors9120363
Submission received: 20 November 2021 / Revised: 8 December 2021 / Accepted: 13 December 2021 / Published: 17 December 2021
(This article belongs to the Special Issue Molecularly Imprinted Plasmonic Sensor)

Abstract

:
Aflatoxins are a group of extremely toxic and carcinogenic substances generated by the mold of the genus Aspergillus that contaminate agricultural products. When dairy cows ingest aflatoxin B1 (AFB1)−contaminated feeds, it is metabolized and transformed in the liver into a carcinogenic major form of aflatoxin M1 (AFM1), which is eliminated through the milk. The detection of AFM1 in milk is very important to be able to guarantee food safety and quality. In recent years, sensors have emerged as a quick, low–cost, and reliable platform for the detection of aflatoxins. Plasmonic sensors with molecularly imprinted polymers (MIPs) can be interesting alternatives for the determination of AFM1. In this work, we designed a molecularly–imprinted–based plasmonic sensor to directly detect lower amounts of AFM1 in raw milk samples. For this purpose, we prepared gold–nanoparticle–(AuNP)−integrated polymer nanofilm on a gold plasmonic sensor chip coated with allyl mercaptan. N−methacryloyl−l−phenylalanine (MAPA) was chosen as a functional monomer. The MIP nanofilm was prepared using the light–initiated polymerization of MAPA and ethylene glycol dimethacrylate in the presence of AFM1 as a template molecule. The developed method enabled the detection of AFM1 with a detection limit of 0.4 pg/mL and demonstrated good linearity (0.0003 ng/mL–20.0 ng/mL) under optimized experimental conditions. The AFM1 determination was performed in random dairy farmer milk samples. Using the analogous mycotoxins, it was also demonstrated that the plasmonic sensor platforms were specific to the detection of AFM1.

Graphical Abstract

1. Introduction

Mycotoxins are secondary metabolites produced mainly by the filamentous fungi of the species Aspergillus, Penicillium, Claviceps, Fusarium, and Alternaria which may contaminate food and feed products [1,2,3]. Mycotoxins play a critical role among chemical contaminants [4,5,6]. Contamination with these compounds is a global concern, resulting in toxic and carcinogenic effects that cause damage in humans [7]. In the food chain, the original mycotoxin may be transformed into other toxic compounds that reach the consumer [8]. Aflatoxins (AFs) are a family of mycotoxins produced primarily by Aspergillus flavus and Aspergillus parasiticus [9,10]. AFs have mutagenic, carcinogenic, teratogenic, hepatotoxic, and DNA–damaging effects in humans as well as animals, even at lower concentrations. Exposure to aflatoxins may occur by ingestion, inhalation, or dermal absorption [11]. Aflatoxin B1 (AFB1) is a highly toxic aflatoxin and is a potent human carcinogen. It is found in cattle feed products due to unsuitable cropping and storage conditions [12]. AFs are found in animal–based foods including milk and dairy products, owing to the intake of AFB1–contaminated feeds [13]. The most common instance of this is the formation of aflatoxin M1 (AFM1) in milk products because of the presence of AFB1 in animal feed. Aflatoxin M1 (AFM1: C17H12O7; molecular weight = 328.27 g/mol) is the main hydroxylated form and a major metabolite of AFB1. It is produced during the biological processes of animals ingesting AFB1–contaminated feeds, and after the consumption of the contaminated feeds, it can be excreted in milk within 12 hours [8,14]. These highly toxic aflatoxins are categorized as group one human carcinogenic compounds according to the International Agency for Research on Cancer (IARC) of the World Health Organization (WHO) [15,16]. The mutagenic and carcinogenic toxicity of AFM1 may be responsible for human primary liver cancer. The legal limits for the amount of AFM1 in milk to decrease the health risk have been set by various regulatory authorities given the high milk and dairy sample consumption by humans, in particular children, and the negative effects of AFM1 on humans’ health. Therefore, the Food and Drug Administration (FDA) of the United States has established a maximum residue level (MRL) in milk of 0.5 μg/kg [17]. It is estimated that around 25% of crops harvested worldwide are contaminated with mycotoxins each year, causing significant economic losses. In summary, there is a requirement for planning an integrated monitoring, control, and sensing system for the presence of aflatoxins throughout the entire food chain [18,19].
Some of the biggest concerns in the dairy industry are the time–consuming and costly detection methods for AFM1. High–performance liquid chromatography (HPLC) [20], thin–layer chromatography (TLC) [21], and liquid chromatography–mass spectroscopy (LC–MS) [22] are common analytical techniques that have been employed for AFM1 detection in milk samples. Although these analytical devices are currently used, the lengthy sample preparation and expensive performance make these methods improper for on–site detection. Moreover, the enzyme–linked immunosorbent assay (ELISA) is another technique for the determination of AFM1 which provides a few commercial kits [23]. Although ELISA has become a popular method for aflatoxin analysis [24], this technique has flaws, such as the lack of good recoverability, the false–positive results, and the high−cost of using antibodies. Thus, the development of a novel technology to overcome these challenges is extremely in demand [25].
Some key fields of the food industries that may benefit from nanotechnology are nanoscale processing, functionalization, novel product development, smart platform design, and instrumentation for improving biosecurity and food safety [26]. The food industry needs to implement novel sensing methods that are simple to use, cheap, sensitive to a specific analyte, and exhibit a quick detection capability. Sensors can meet all these requirements and are an excellent example of an alternative platform to traditional methods employed in food safety [27]. As promising and reliable alternatives, plasmonic sensors have received noteworthy attention in recent years because of their characteristics, including real–time analysis, rapid response, simplicity, low cost, and high specificity. Surface plasmon resonance is a promising alternative technology to plasmonic assay–based label–free sensors. Surface plasmon resonance (SPR) sensors are gaining increasing recognition for their detection of chemicals and biological analytes [28]. A surface plasmon is a charge density oscillation propagating along the interface between a metal and a dielectric. In this sensing technique, the specific capture of the target analyte contained in a liquid sample by the recognition elements anchored to the metallic (e.g., gold) sensor surface is detected with the surface plasmons [29]. The technique measures the changes in the refractive index that occur when affinitive molecules bind to molecules near a metallic surface.
Low–molecular–weight analytes such as mycotoxins and/or analytes are difficult to detect directly at very low concentrations, as the response of the SPR sensor is proportional to the mass of the target molecule. Therefore, alternative test formats are required for aflatoxin detection using SPR technology. To increase the sensor response signal, nanoparticles (quantum dots, magnetic nanoparticles, metallic nanoparticles, or fluorophores) are preferred as an alternative sensing material. Recently, a polymer film with an immobilized gold nanoparticle as a sensing material has been reported. The gold nanoparticles shift the dip of an SPR curve to a higher SPR angle, and the signal amplification is enhanced by the integration of the gold nanoparticles. AuNPs could be synthesized to achieve the advantage of a diversity of effects, such as changes to the refractive index by the particle mass, enhanced surface area, and electromagnetic–field–coupling between the particles’ plasmonic properties and the emitted plasmons [30,31,32].
Molecularly imprinted polymers (MIPs) are one of the most interesting modifications that can be combined with these sensors [33]. MIPs have been demonstrated to be reliable and low–cost materials for selective detection in various applications, such as medical diagnosis [34], environmental monitoring [35], food control [36], and homeland security [37]. MIPs highly prefer smart materials for biomimetic molecular recognition because of their perfect affinity and selectivity, combined with their easy engineering, robustness, and low costs. MIPs are artificial polymers manufactured by the synthesis of a three−dimensional network around a template (target) analyte, thus building specific recognition cavities [38,39,40,41,42]. Briefly, MIP synthesis includes a functional monomer and crosslinking polymerization in the presence of the template analyte, which results in the creation of size–, structure–, and stereo–specific cavities, followed by the removal of the template analyte from the specific cavities, which makes them suitable for template rebinding [43]. MIPs are synthetic antibody mimics showing a high affinity and selectivity for template molecules ranging from ions [44] to small organic/inorganic molecules [33]; peptides [45]; and biological macromolecules such as proteins [46], viruses [47], and whole cells [48]. The mechanical, chemical, and thermal stability, the ease of preparation, and the relative cost-effectiveness of MIPs compared to biological recognition materials make them important for different analytical applications [49]. The area of molecular imprinting technique has seen a recent surge in growth, and a few commercially available products are of great interest for sample cleanup to improve mycotoxin analysis. Several analytical methods have also been developed for the isolation and detection of mycotoxins using molecularly imprinted technology [50]. MIPs as synthetic analogues have been effectively incorporated into analytical methods including assays [51], chromatography [52], and sensor platforms [53]. The development of MIP–based instruments in combination with sensor technologies appears to be one of the most promising selective and simple approaches for the improvement of MIP performance and application. Therefore, we conjectured that the cooperation of these two strategies, using both an analyte–binding selective polymer and a gold nanoparticle, could produce a plasmonic sensor chip for the sensitive detection of small molecules without requiring other reagents.
In this study, we demonstrate an MIP nanofilm–based plasmonic sensor for the real−time, selective, and quick detection of AFM1. For signal amplification, AuNPs were prepared and then characterized by dynamic light−scattering and transmission electron microscopy devices. The AuNPs were integrated into the MIP nanofilm to design an advanced plasmonic sensor that was highly sensitive and selective toward small molecules. The AFM1–imprinted sensors showed a wide dynamic concentration range. Selectivity studies for the MIP−based plasmonic sensors were carried out regarding the binding of the other three mycotoxins (aflatoxin B, ochratoxin A, and citrinin). The detection of AFM1 was also tested using a milk sample. In addition, the polymer film coating characteristics, the real–time monitoring, and the reusability of the novel MIP−based plasmonic sensor for the detection of AFM1 in milk were evaluated.

2. Materials and Methods

2.1. Chemicals and Apparatus

Aflatoxin M1 (AFM1), aflatoxin B1 (AFB1), citrinin (CIT), and ochratoxin A (OTA) were obtained from R–Biopharm Rhone (Germany). Ethylene glycol dimethacrylate (EGDMA), 2–hydroxyethyl methacrylate (HEMA), gold (III) chloride trihydrate, and sodium citrate tribasic dihydrate were obtained from the Sigma Aldrich company. Potassium dihydrogen phosphate (KH2PO4), disodium hydrogen phosphate (Na2HPO4), azobisisobutyronitrile (AIBN), hydrogen peroxide, and other chemicals were purchased from Merck AG (Germany).
The SPR imager II plasmon–based sensor device (GWC Technologies, Madison, WI, USA) was employed for AflaM1 kinetic analysis. Gold SPR sensor chips (SPRchipTM), measuring 1 mm × 18 mm × 18 mm and with a gold surface thickness of ~50 nm, and an SF10 equilateral prism were provided by the GWC company. Ultrapure water was provided by the Barnstead D3804 NANOpure® water purification system, with an 18.0 MΩ/cm resistance indicating pure water. A UVP Blak–Ray B–100AP high–intensity UV lamp (100 watt, 360 nm UV) was used for polymerization.

2.2. Preparation of Gold Nanoparticles

Turkevich’s protocol was applied for the preparation of citrate−stabilized AuNPs [54]. Briefly, gold nanoparticles were prepared by the addition of gold (III) chloride trihydrate (HAuCl4.3H2O) salt to preheated sodium citrate solution. The change in color of the solution to the characteristic wine–red indicated the formation of AuNPs. The nanoparticle size and morphology were measured using transmission electron microscopy (TEM) (Zeiss Evo 40, Oberkochen, Germany) and dynamic light scattering (DLS) (NanoS, Malvern Instruments, London, UK).

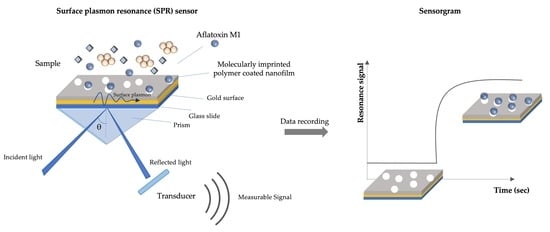
2.3. Development of Molecularly Imprinted–Based Plasmonic Sensor

2.3.1. SPR Sensor Chip Modification

The MIP nanofilm synthesis was handled by the radical polymerization of a monomer mixture and AuNPs in the presence of aflatoxin M1 as a model template on a sensor chip coated with allyl mercaptan. In the first step, the gold SPR sensor chip was rinsed using hot piranha solution (3:1 H2SO4:H2O2, v/v) for 3 min. After 3.0 M of allyl mercaptan (C3H6S) was dropped onto the gold surface, it was incubated overnight at room temperature. The sensor chip was successively rinsed with water/ethanol mix. The preparation of the aflatoxin M1–imprinted enhanced SPR (AFM1−MIP) chips is illustrated in Figure 1.
The AFM1–imprinted enhanced SPR sensor was prepared by the following protocol: the functional monomer MAPA and the AFM1 template molecule were formed into a precomplex (molar ratio 2:1). Afterward, the precomplex was added to 2.0 μmol of the HEMA monomer, 4.0 μmol of the EGDMA crosslinker, and 2.5 μmol AuNP solution. For polymerization initiation, 2 mg of AIBN was added to the monomer solution. The monomer phase was dropped onto on an allyl mercaptan–modified gold surface. UV polymerization was initiated (100 watt, 360 nm) and proceeded for 45 min. A nonimprinted polymer (NIP)−based plasmonic sensor was also designed via the same operation without a template analyte (AFM1). Finally, the sensor chips were rinsed with water and dried.

2.3.2. The Removal of Template Molecule

The aflatoxin M1−imprinted plasmonic sensor chip was successively rinsed with methanol/acetic acid solution. The PBS/methanol/acetic acid was used for the removal of the template molecule AFM1 [20,55].

2.3.3. Characterization of SPR Sensor

The unmodified, AFM1–MIP, and NIP SPR sensor chips were characterized using ellipsometry, scanning electron microscopy (SEM), and atomic force microscopy (AFM). A Nanofilm−EP3 Nulling Ellipsometer, Accurion GmbH, Germany was employed to analyze the gold SPR chip surface layer thickness. The imaging ellipsometer used classical null ellipsometry. The SEM device (QUANTA 400F Field Emission) was used for the surface morphology of the designed nanofilm−coated plasmonic sensor. AFM measurement (Veeco MultiMode V) was performed to characterize the roughness of the SPR sensors’ gold surfaces. AFM is employed to image the topography of solid surfaces at a high resolution. AFM images were obtained in noncontact mode.

2.4. Detection of AFM1

The SPR sensor system was used for the detection of AFM1 in both buffer and milk samples at different concentrations. The AFM1 monitoring was carried out at room temperature. The equilibration buffer, pH 7.4 PBS containing 0.05% Tween-20, flowed through the SPR sensor for 30 min. Thus, the baseline was stabilized. Afterwards, the resonance angle of the SPR sensor device was adjusted with a mirror system, and kinetic studies of the AFM1 were performed at this angle. AFM1 solutions were prepared at a concentration range of 0.0003 ng/mL–20.0 ng/mL and flowed into the SPR sensor system one by one (5.0 mL sample; 0.5 mL/min flow rate). The percentage change in reflectivity (%ΔR) of the SPR sensor response was monitored in real−time. Desorption of the AFM1 captured on the sensor chip surface was performed by a desorption reagent for 10 min (15 mL). After the desorption step, the AFM1−MIP enhanced SPR sensor surface was rinsed in distilled water.

2.5. Selectivity, Reusability, and Stability Studies

Imprinted materials have a high chemical and thermal stability. They show a high affinity and selectivity towards the target analyte [56]. The selectivity of the molecularly imprinted−based enhanced SPR sensor was examined. The SPR sensor response was described by applying the 1.0 ng/mL AFB1 (312.27 g/mol), CIT (243.21 g/mol), and OTA (403.81 g/mol) mycotoxin solutions to evaluate the selectivity of both the AFM1−MIP and the NIP sensor. These three mycotoxins were selected because they are highly toxic and have similar chemical structures. Moreover, competitive binding studies were applied to describe the selectivity of the developed AFM1−imprinted plasmonic sensor. The single, double, and total aflatoxin solutions were prepared at 1.0 ng/mL concentration. The total aflatoxin solution contained AFB1, AFB2, AFG1, and AFG2. Finally, the reusability and stability of the AFM1−MIP plasmonic sensor were also examined by applying 0.025 ng/mL–3.0 ng/mL of the AFM1 solutions.

2.6. Detection of AFM1 in Milk Samples

To ensure consumer safety and human health, it is very important to monitor the concentration of AFM1 in milk samples in real−time [57]. The preparation procedure of milk samples was as follows: the raw milk sample was defatted by centrifugation for 10 min at 5000× g rpm at 25 °C. After centrifugation, the two phases were separated and the supernatant part was collected to carry out the experimental work [58]. The standard addition method was applied to the detection of the concentration of AFM1 in AFM1-free raw milk samples. AFM1−free milk samples were spiked with the stock solution of AFM1 to obtain final concentrations of 0 ng/mL to 20.0 ng/mL.

3. Results and Discussion

3.1. Characterization of AuNPs

The AuNPs’ size and morphology were characterized by DLS and transmission microscopy analysis (DLS result Figure 2a; TEM image Figure 2b). In Figure 2a, the average diameters of the AuNPs are exhibited (14.81 ± 1.69 nm). The polydispersity index (PdI) value was 0.545. According to the results of the TEM images, the AuNPs were seen on their own and in clustered groups. The TEM micrograph for the typical sample resulting from the AuNPs showed an average diameter of ∼20.52 ± 5.87 nm. The results obtained were further corroborated by the TEM observations, as shown in Figure 2b. From the figure, it can be seen that the morphology consisted of a mixture of spherelike nanoparticles.

3.2. Characterization Results of SPR Sensor Chips

Ellipsometry, SEM, and AFM measurements were employed to characterize the surface properties of the polymer−coated nanofilm sensor surface. The AFM1−imprinted chip surface and the nonimprinted chip surface morphologies were characterized by AFM. Figure 3a,b show the AFM images of the chips. The average roughness of the AFM1-imprinted and nonimprinted chips were determined to be 8.08 and 4.84 nm, respectively. These results showed that the aflatoxin M1−imprinted and nonimprinted nanofilms were uniformly attached to the allyl mercaptan−coated chip surface. The modified polymer nanofilm chip surface morphology was investigated by SEM analysis. The SEM images of the AFM1−MIP nanofilm−coated plasmonic sensor demonstrated the modification of the polymer film layer and showed that the thickness of the polymer film layer was ~108 nm (Figure 3c,d). Ellipsometer analysis was carried out to determine the thicknesses of the bare chip and the MIP SPR chip after nanofilm coating (Figure 3e,f). The surface depths of the bare SPR chip and the AFM1−MIP SPR chip were analyzed as being 10 ± 2 nm and 82 ± 3.4 nm, respectively. The characterization results showed that the nanofilm−coated SPR sensor surfaces were prepared homogeneously, and the polymer film thickness was suitable.

3.3. Plasmonic Sensor for Aflatoxin M1 Detection

A plasmonic−based SPR sensor setup utilizing the refractive index change of the surface plasmons was employed. A quartz halogen lamp (6 V, 10 W, 2000 H) laser passed through the SF10 glass prism at a right angle. A peristaltic pump was used at a flow rate of 0.5 mL/min to pass the milk samples over the sensor surface. Kinetic analysis was carried out for the detection of AFM1. The PBS–Tween20 buffer or milk was spiked with AFM1 at concentrations ranging from 0.0003 to 20.0 ng/mL. The samples were prepared by the sequential diluting of 10 μg/mL AFM1 stock solution in the PBS buffer. Figure 4 shows that the AFM1−MIP SPR sensor displayed quick responses when the analyte samples reached the SPR chip surfaces. Afterward, the desorbed SPR chip was washed in distilled water before the AFM1 samples were injected onto the plasmonic sensor platform. The main interaction between the functional monomer and the template molecules is thought to be through hydrophobic interactions. An SPR sensorgram graph with the simultaneous measurement of the change of the refractive index for the AFM1 samples was experimentally demonstrated. The change in the refractive index of the SPR sensors took place on the thin metal layer, i.e., the distance (<200 nm) at which the analyte–ligand interaction effectively disrupts the plasmonic wave and produces a detectable signal. The signal values in the sensorgram changed in direct proportion with the increasing AFM1 concentrations, as shown in Figure 4. The graph showing the ΔR over time acquired from the MIP SPR sensor experiment using different AFM1 concentrations is demonstrated in Figure 5a.
The AFM1−MIP SPR sensor displayed a wide linear range of concentrations from 0.0003 ng/mL to 20 ng/mL. Table 1 shows the comparison of the different sensor systems, with their published and obtained limit-of-detection values. The designed plasmonic sensor had a good linear range and a low limit-of-detection value, as reported by the sensors; this showed that the novel molecularly-imprinted-nanofilm-coated enhanced plasmonic sensor was a suitable sensing platform.

3.4. Kinetic Analysis and Adsorption Isotherm

Kinetic analysis of the aflatoxin M1–imprinted plasmonic sensor was utilized to determine the target molecule–polymer nanofilm interactions. The equilibrium analysis and binding kinetic analysis graphs are given in Figure 5b,c. The ΔRmax, ka, kd, KA, and KD values obtained from the equations of these graphs are summarized in Table 2.
Association   binding   kinetic   d Δ R d t = k a C ( R m a x R e q ) k d Δ R
Scatchard   R e x [ C ] = K A ( R m a x R e q )
An adsorption isotherm is a measure of the relationship between the equilibrium concentrations of confined and free guests over a certain concentration range [65]. The Langmuir and Freundlich models are the two frequently used adsorption models. The interaction pattern between the AFM1 molecules and the nanofilm–coated SPR chip was investigated using the Langmuir, Freundlich, and Langmuir–Freundlich isotherm models (Figure 5d–f). The applied linear model could be determined using the following equations:
Langmuir   Δ R = { Δ R m a x       [ C ] K D + [ C ] }
Freundlich   Δ R = { Δ R m a k s C 1 / n }
Langmuir Freundlich     Δ R = { Δ R m a x       [ C ] 1 / n K D + [ C ] 1 / n }
The change in the reflectivity response is ΔR; KA (ng/mL)−1 and KD (ng/mL) are the association and dissociation equilibrium constants; the AFM1 concentration is C (ng/mL); 1/n is the Freundlich exponent; ka (ng/mL.s) and kd (s−1) are the association and dissociation kinetic rate constants; and the subscripts ex, max, and eq refer to experimental, maximum, and equilibrium, respectively.
The Langmuir model was proposed to define the adsorption of analytes onto homogeneous solid surfaces that show one type of adsorption site [66,67]. The Langmuir isotherm model is more accurate when a monolayer is formed [68]. The Langmuir isotherm model was found to be the most suitable isotherm model for the AFM1–imprinted sensor. There were no lateral interactions in this model, which represented the homogeneous distribution of interaction points with similar energy levels. All adsorption sites are equivalent, distinguishable, and independent in the Langmuir model; furthermore, each adsorption site can bind only a single molecule [69]. The linearity of the Langmuir model was more compatible with the linearity of the Scatchard equation. The calculated Rmax value was very close to the experimental value (12.5 ng/mL). The KA and KD values were calculated by the Langmuir equation as 0.38 ng/mL and 4.75 ng/mL, respectively.

3.5. Selectivity

The nonimprinted (NIP) chip was also tested to determine the selectivity of the MIP−based plasmonic sensor chip. Mycotoxin solutions with a concentration of 1.0 ng/mL were sent to the SPR sensor system. The signal values from the MIP and NIP sensors are given in Figure 6a,b. The relative selectivity coefficients compared to the other mycotoxins were found to be higher than one. When the selectivity (k) and the relative selectivity coefficient (k’) were calculated, the results showed that the SPR sensor was more selective and sensitive to the template molecule (Table 3).
The binding ratio between the MIP and the control sensor (NIP) was calculated using the imprinting factor (IF), which was determined as ΔR–MIP/ΔR−NIP. The imprinting factors, calculated as the binding ratios between MIP and NIP, for AFM1, AFB1, OTA, and CIT were 4.22, 3.16, 0.98, and 0.73, respectively. ΔR−MIP and ΔR−NIP are the percentage changes in reflectivity of the mycotoxins. Figure 6b shows that the IF results for AFM1 were higher than for the other three mycotoxins. The MIP plasmonic sensor could significantly enhance the selective capacity, and the specific cavity sites were improper for other mycotoxins. The results indicated that the imprinted polymer−coated plasmonic sensor could discriminate efficiently between the different mycotoxins. Selectivity studies with the total aflatoxin solution were also carried out with the double and total aflatoxin (AFB1, AFB2, AFG1, and AFG2) mixed solutions. The response of the MIP sensor sensorgram to these aflatoxins is seen in Figure 6c. When the double and total aflatoxin solutions were examined, it was observed that the ΔR value increased in the mixtures with AFM1 compared to when the single solution was used. This showed that when the other molecules were combined with AFM1, the other aflatoxins acted as competitive agents and caused an increase in the ΔR value.

3.6. Milk Sample

To prove the feasibility of the designed MIP−based enhanced SPR sensor in the sensing of food samples, raw milk samples were spiked with different concentrations of AFM1. The prepared milk samples were analyzed under optimum experimental conditions at twelve concentration stages. AFM1 concentrations ranging from 0 ng/mL to 20.0 ng/mL were added to the raw milk solutions. It was observed that the AFM1−imprinted SPR sensor’s response changes were proportional to the increase in the AFM1 concentration. The sensorgram graph of the raw milk sample is given in Figure 6d. The developed plasmonic sensor allowed the detection of AFM1 in milk samples at concentrations as low as 0.3 pg/mL within 8 min. In this research, a label−free and rapid plasmonic sensor was designed, and the high selectivity and sensitivity of this SPR sensor was displayed using buffer solutions and milk samples at 0.003–20.0 ng/mL concentrations. The changes in the signal response of the MIP−based plasmonic sensor were consistent with the changes in the concentration of the AFM1 in the spiked milk samples and the AFM1 concentration in the buffer solution.

3.7. Reusability and Stability

The reproducibility, storage stability, and reusability of the plasmonic sensor were also studied. The AFM1−MIP SPR sensor was stored at 4 °C. There was no significant instability in the responses of the SPR sensor for the detection of AFM1 after repeated experiments every three months for one year. No significant signal loss was observed after the same period. It can be said that the SPR signal response decreased by 12.08% after 12 months compared to the initial response, but this method showed acceptable stability and sensitivity (Figure 7a). Notably, the reproducibility of the AFM1−MIP sensor’s signals to the template analyte was not influenced by adsorbate’s nature, with relative standard deviation (RSD%) values ranging from 2 to 5%. The plasmonic sensor fabricated using MIP−based nanofilm that was tested in this study demonstrated the reusability of the AFM1–imprinted sensor and gave rise to well−defined, reproducible signal responses. Figure 7b indicates the time−shifts of the equilibrium–adsorption–desorption cycle as percentage change in reflectivity (ΔR). The MIP−based plasmonic sensor demonstrated here for the simultaneous analysis of AFM1 samples with reusability and a good storage capability is a noteworthy consideration for the development of plasmon−based sensor technology.

4. Conclusions

Phytopathogenic and mycotoxigenic fungal residues have always been one of the top concerns for agriculture and food safety around the world. Current aflatoxin pollution affects peoples’ quality of life with each passing day. It is very important to develop rapid and reliable methods for the detection of these secondary metabolites formed in crops under certain humidity and temperature conditions. AFM1 is the major metabolite and the hydroxylated form of AFB1. It is produced by dairy cows receiving AFB1−contaminated feeds. Today, molecular imprinting technologies have received great attention and MIP−based SPR sensors, which can be used as a preliminary study for the development of rapid and effective detection methods for these toxins, have been prepared and their usability has been demonstrated. For the more sensitive and selective determination of low molecular weight analytes, a gold−nanoparticle−integrated molecularly imprinted polymer film−coated sensitized SPR sensor was designed. The sensitivity of the sensor was greatly improved due to the nanofilm containing gold nanoparticles; the proposed sensors exhibited excellent selectivity towards AFM1, owing to the molecularly imprinted polymer nanofilm. The MIP−based plasmonic sensor was successfully applied for the detection of AFM1 in raw milk samples. The plasmonic sensor demonstrated a wide linear range, from 0.0003 ng/mL to 20.0 ng/mL in both the buffer and the spiked milk. The limit-of-detection value was found to be 0.4 pg/mL. Herein, a novel and highly sensitive SPR sensing platform was developed that demonstrated simplicity, speed, cost−effectiveness, and high selectivity and sensitivity, evidencing its perfect potential for application in milk product control. Therefore, considering the cost−effective design, the ease of use, and the quick read−out, the use of this molecularly imprinted–based plasmonic sensor could contribute to safeguarding consumers’ health. As a result, integrating AuNP structures enhances the sensitivities of plasmonic sensors and enables the development of a new generation of sensors.

Author Contributions

Conceptualization and design, S.A., H.Y. and A.D.; writing—original draft preparation, review, and editing, S.A., H.Y. and A.D.; methodology—visualization and supervision, S.A., H.Y. and A.D. All authors have read and agreed to the published version of the manuscript.

Funding

This research received no external funding.

Institutional Review Board Statement

Not applicable.

Informed Consent Statement

Not applicable.

Data Availability Statement

Not applicable.

Conflicts of Interest

The authors declare no conflict of interest.

References

  1. Ketney, O.; Santini, A.; Oancea, S. Recent Aflatoxin Survey Data in Milk and Milk Products: A Review. Int. J. Dairy Technol. 2017, 70, 320–331. [Google Scholar] [CrossRef]
  2. Abera, B.D.; Falco, A.; Ibba, P.; Cantarella, G.; Petti, L.; Lugli, P. Development of Flexible Dispense−Printed Electrochemical Immunosensor for Aflatoxin M1 Detection in Milk. Sensors 2019, 19, 3912. [Google Scholar] [CrossRef] [Green Version]
  3. Beitollahi, H.; Tajik, S.; Dourandish, Z.; Zhang, K.; Van Le, Q.; Jang, H.W.; Kim, S.Y.; Shokouhimehr, M. Recent Advances in the Aptamer–Based Electrochemical Biosensors for Detecting Aflatoxin B1 and Its Pertinent Metabolite Aflatoxin M1. Sensors 2020, 20, 3256. [Google Scholar] [CrossRef]
  4. Eskola, M.; Kos, G.; Elliott, C.T.; Hajšlová, J.; Mayar, S.; Eskola, M.; Kos, G.; Elliott, C.T.; Hajšlová, J.; Mayar, S.; et al. Worldwide Contamination of Food-Crops with Mycotoxins: Validity of the Widely Cited ‘ FAO Estimate ’ of 25%. Crit. Rev. Food Sci. Nutr. 2020, 60, 2773–2789. [Google Scholar] [CrossRef]
  5. Danesh, N.M.; Bostan, H.B.; Abnous, K.; Ramezani, M.; Youssefi, K.; Taghdisi, S.M.; Karimi, G. Ultrasensitive Detection of Aflatoxin B1 and Its Major Metabolite Aflatoxin M1 Using Aptasensors: A Review. Trends Anal. Chem. 2018, 99, 117–128. [Google Scholar] [CrossRef]
  6. Karapetis, S.; Nikolelis, D.; Hianik, T. Label-Free and Redox Markers−Based Electrochemical Aptasensors for Aflatoxin M1 Detection. Sensors 2018, 18, 4218. [Google Scholar] [CrossRef] [Green Version]
  7. Ong, J.Y.; Pike, A.; Tan, L.L. Recent Advances in Conventional Methods and Electrochemical Aptasensors for Mycotoxin Detection. Foods 2021, 10, 1437. [Google Scholar] [CrossRef]
  8. Marchese, S.; Polo, A.; Ariano, A.; Velotto, S.; Costantini, S.; Severino, L. Aflatoxin B1 and M1: Biological Properties and Their Involvement in Cancer Development. Toxins 2018, 10, 214. [Google Scholar] [CrossRef] [Green Version]
  9. Nidhina, N.; Bhavya, M.L.; Bhaskar, N.; Muthukumar, S.P.; Murthy, P.S. Aflatoxin Production by Aspergillus Flavus in Rumen Liquor and Its Implications. Food Control 2017, 71, 26–31. [Google Scholar] [CrossRef]
  10. Giovanni, S.D.; Zambrini, V.; Varriale, A.; Auria, S.D. Sweet Sensor for the Detection of Aflatoxin M1 in Whole Milk. ACS Omega 2019, 4, 12803–12807. [Google Scholar] [CrossRef] [Green Version]
  11. Vaz, A.; Silva, A.C.C.; Rodrigues, P.; Venâncio, A. Detection Methods for Aflatoxin M1 in Dairy Products. Microorganisms 2020, 1, 1–16. [Google Scholar] [CrossRef] [Green Version]
  12. Xiong, J.; Xiong, L.; Zhou, H.; Liu, Y.; Wu, L. Occurrence of Aflatoxin B1 in Dairy Cow Feedstuff and Aflatoxin M1 in UHT and Pasteurized Milk in Central China. Food Control 2018, 92, 386–390. [Google Scholar] [CrossRef]
  13. Gu, Y.; Wang, Y.; Wu, X.; Pan, M.; Hu, N.; Wang, J.; Wang, S. Quartz Crystal Microbalance Sensor Based on Covalent Organic Framework Composite and Molecularly Imprinted Polymer of Poly(o-Aminothiophenol) with Gold Nanoparticles for the Determination of Aflatoxin B1. Sens. Actuators B Chem. 2019, 291, 293–297. [Google Scholar] [CrossRef]
  14. Xiong, J.; Wang, Y.M.; Nennich, Y.L.; Liu, J. Transfer of Dietary Aflatoxin B1 to Milk Aflatoxin M1 and Effect of Inclusion of Adsorbent in the Diet of Dairy Cows. J. Dairy Sci. 2015, 98, 2545–2554. [Google Scholar] [CrossRef]
  15. IARC. Some Naturally Occurring Substances: Food Items and Constituents, Heterocyclic Aromatic Amines and Mycotoxins. In IARC Monographs on the Evaluation of Carcinogenic Risks to Humans; IARC: Lyon, France, 1993; Volume 56. [Google Scholar]
  16. IARC. Some Traditional Herbal Medicines, Some Mycotoxins, Naphthalene and Styrene. In IARC Monograph on the Evaluation of Carcinogenic Risk to Humans; IARC: Lyon, France, 2002; Volume 82. [Google Scholar]
  17. FAO. CPG Sec 527.400 Whole Milk, Lowfat Milk, Skim Milk−AGatoxin M1. FDA Compliance Policy Guides; FDA: Washington, DC, USA, 2005. [Google Scholar]
  18. Gurban, A.M.; Epure, P.; Oancea, F.; Doni, M. Achievements and Prospects in Electrochemical−Based Biosensing Platforms for Aflatoxin M1 Detection in Milk and Dairy Products. Sensors 2017, 17, 2951. [Google Scholar] [CrossRef] [Green Version]
  19. Bervis, N.; Lor, S.; Juan, T.; Carraminana, J.J.; Herrera, A.; Arina, A.; Herrera, M. Field Monitoring of Aflatoxins in Feed and Milk of High-Yielding Dairy Cows under Two Feeding Systems. Toxins 2021, 13, 201. [Google Scholar] [CrossRef]
  20. Khodadadi, M.; Malekpour, A.; Mehrgardi, M.A. Aptamer Functionalized Magnetic Nanoparticles for Effective Extraction of Ultratrace Amounts of Aflatoxin M1 Prior Its Determination by HPLC. J. Chromatogr. A 2018, 1564, 85–93. [Google Scholar] [CrossRef]
  21. Shundo, L.; Sabino, M. Aflatoxin M1 in Milk by Immunoaffinity Column Cleanup with TLC/HPLC Determination. Braz. J. Microbiol. 2006, 37, 164–167. [Google Scholar] [CrossRef] [Green Version]
  22. Rodríguez−Carrasco, Y.; Izzo, L.; Gaspari, A.; Graziani, G.; Mañes, J.; Ritieni, A. Simultaneous Determination of AFB1 and AFM1 in Milk Samples by Ultra High Performance Liquid Chromatography Coupled to Quadrupole Orbitrap Mass Spectrometry. Beverages 2018, 4, 43. [Google Scholar] [CrossRef] [Green Version]
  23. Vdovenko, M.M.; Lu, C.C.; Yu, F.Y.; Sakharov, I.Y. Development of Ultrasensitive Direct Chemiluminescent Enzyme Immunoassay for Determination of Aflatoxin M1 in Milk. Food Chem. 2014, 158, 310–314. [Google Scholar] [CrossRef]
  24. Radoi, A.; Targa, M.; Prieto-Simon, B.; Marty, J. Enzyme-Linked Immunosorbent Assay (ELISA) Based on Superparamagnetic Nanoparticles for Aflatoxin M1 Detection. Talanta 2008, 77, 138–143. [Google Scholar] [CrossRef]
  25. Istamboulié, G.; Paniel, N.; Zara, L.; Reguillo Granados, L.; Barthelmebs, L.; Noguer, T. Development of an Impedimetric Aptasensor for the Determination of Aflaatoxin M1 in Milk. Talanta 2016, 146, 464–469. [Google Scholar] [CrossRef]
  26. Rastogi, S.; Kumari, V.; Sharma, V.; Ahmad, F. Gold Nanoparticle-Based Sensors in Food Safety Applications. Food Anal. Methods 2021. [Google Scholar] [CrossRef]
  27. Ramezani, M.; Esmaelpourfarkhani, M.; Taghdisi, S.M.; Abnous, K.; Alibolandi, M. Application of nanosensors for food safety. In Nanosensors for Smart Cities; Han, B., Nguyen, T.A., Singh, P.K., Tomer, V.K., Farmani, A., Eds.; Elsevier: Amsterdam, The Netherlands, 2020; pp. 369–386. ISBN 9780128198704. [Google Scholar]
  28. Homola, J. Surface Plasmon Resonance Sensors for Detection of Chemical and Biological Species. Chem. Rev. 2008, 108, 462–493. [Google Scholar] [CrossRef]
  29. Wang, Y.; Dostálek, J.; Knoll, W. Long Range Surface Plasmon-Enhanced Fluorescence Spectroscopy for the Detection of Aflatoxin M1 in Milk. Biosens. Bioelectron. 2009, 24, 2264–2267. [Google Scholar] [CrossRef]
  30. Szunerits, S.; Spadavecchia, J.; Boukherroub, R. Surface Plasmon Resonance: Signal Amplification Using Colloidal Gold Nanoparticles for Enhanced Sensitivity. Rev. Anal. Chem. 2014, 33, 153–164. [Google Scholar] [CrossRef] [Green Version]
  31. Hong, X.; Hall, E.A.H. Contribution of Gold Nanoparticles to the Signal Amplification in Surface Plasmon Resonance. Analyst 2012, 137, 4712–4719. [Google Scholar] [CrossRef]
  32. Matsui, J.; Akamatsu, K.; Hara, N.; Miyoshi, D.; Nawafune, H.; Tamaki, K.; Sugimoto, N. SPR Sensor Chip for Detection of Small Molecules Using Molecularly Imprinted Polymer with Embedded Gold Nanoparticles. Anal. Chem. 2005, 77, 4282–4285. [Google Scholar] [CrossRef] [PubMed]
  33. Mostafiz, B.; Arjomand, S.; Banan, K.; Afsharara, H.; Hatamabadi, D.; Mousavi, P.; Mustansar, C.; Keçili, R.; Ghorbani-Bidkorbeh, F. Molecularly Imprinted Polymer-Carbon Paste Electrode (MIP−CPE)-Based Sensors for the Sensitive Detection of Organic and Inorganic Environmental Pollutants: A Review. Trends Environ. Anal. Chem. 2021, 32, e00144. [Google Scholar] [CrossRef]
  34. Liu, J.; Wang, Y.; Liu, X.; Yuan, Q.; Zhang, Y.; Li, Y. Novel Molecularly Imprinted Polymer (MIP) Multiple Sensors for Endogenous Redox Couples Determination and Their Applications in Lung Cancer Diagnosis. Talanta 2019, 199, 573–580. [Google Scholar] [CrossRef]
  35. Naseri, M.; Mohammadniaei, M.; Sun, Y.; Ashley, J. The Use of Aptamers and Molecularly Imprinted Polymers in Biosensors for Environmental Monitoring: A Tale of Two Receptors. Chemosensors 2020, 8, 32. [Google Scholar] [CrossRef]
  36. Akhoundian, M.; Rüter, A.; Shinde, S. Ultratrace Detection of Histamine Using a Molecularly-Imprinted Polymer-Based Voltammetric Sensor. Sensors 2017, 17, 645. [Google Scholar] [CrossRef] [Green Version]
  37. Holthoff, E.L.; Stratis-cullum, D.N.; Hankus, M.E. A Nanosensor for TNT Detection Based on Molecularly Imprinted Polymers and Surface Enhanced Raman Scattering. Sensors 2011, 11, 2700–2714. [Google Scholar] [CrossRef] [Green Version]
  38. Paruli, E.I.I.I.; Soppera, O.; Haupt, K.; Gonzato, C. Photopolymerization and Photostructuring of Molecularly Imprinted Polymers. ACS Appl. Polym. Mater. 2021, 3, 4769–4790. [Google Scholar] [CrossRef]
  39. Akgönüllü, S.; Bakhshpour, M.; Denizli, A. Molecularly imprinted bionanomaterials and their biomedical applications. In Bionanomaterials Fundamentals and Biomedical Applications; Singh, R.P., Singh, K.R., Eds.; IOP Science: London, UK, 2021; pp. 9–27. ISBN 9780750337670. [Google Scholar]
  40. Battal, D.; Akgönüllü, S.; Yalcin, M.S.; Yavuz, H.; Denizli, A. Molecularly Imprinted Polymer Based Quartz Crystal Microbalance Sensor System for Sensitive and Label-Free Detection of Synthetic Cannabinoids in Urine. Biosens. Bioelectron. 2018, 111, 10–17. [Google Scholar] [CrossRef] [PubMed]
  41. Akgönüllü, S.; Battal, D.; Yalcin, M.S.; Yavuz, H.; Denizli, A. Rapid and Sensitive Detection of Synthetic Cannabinoids JWH-018, JWH-073 and Their Metabolites Using Molecularly Imprinted Polymer-Coated QCM Nanosensor in Artificial Saliva. Microchem. J. 2020, 153, 104454. [Google Scholar] [CrossRef]
  42. Saylan, Y.; Akgönüllü, S.; Yavuz, H.; Ünal, S.; Denizli, A. Molecularly Imprinted Polymer Based Sensors for Medical Applications. Sensors 2019, 19, 1279. [Google Scholar] [CrossRef] [Green Version]
  43. Martin-Esteban, A. Recent Molecularly Imprinted Polymer-Based Sample Preparation Techniques in Environmental Analysis. Trends Environ. Anal. Chem. 2016, 9, 8–14. [Google Scholar] [CrossRef]
  44. Türkmen, D.; Özkaya Türkmen, M..; Akgönüllü, S.; Denizli, A. Development of Ion Imprinted Based Magnetic Nanoparticles for Selective Removal of Arsenic (III) and Arsenic (V) from Wastewater. Sep. Sci. Technol. 2021, 1–10. [Google Scholar] [CrossRef]
  45. Caserta, G.; Zhang, X.; Yarman, A.; Supala, E.; Wollenberger, U.; Gyurcsányi, R.E.; Zebger, I.; Scheller, F.W. Insights in Electrosynthesis, Target Binding, and Stability of Peptide-Imprinted Polymer Nanofilms. Electrochim. Acta 2021, 381, 138236. [Google Scholar] [CrossRef]
  46. Saylan, Y.; Denizli, A. Molecular Fingerprints of Hemoglobin on a Nanofilm Chip. Sensors 2018, 18, 3016. [Google Scholar] [CrossRef] [Green Version]
  47. Lu, C.H.; Zhang, Y.; Tang, S.F.; Fang, Z.B.; Yang, H.H.; Chen, X.; Chen, G.N. Sensing HIV Related Protein Using Epitope Imprinted Hydrophilic Polymer Coated Quartz Crystal Microbalance. Biosens. Bioelectron. 2012, 31, 439–444. [Google Scholar] [CrossRef] [PubMed]
  48. Shan, X.; Yamauchi, T.; Yamamoto, Y.; Shiigi, H.; Nagaoka, T. A Rapid and Specific Bacterial Detection Method Based on Cell-Imprinted Microplates. Analyst 2018, 143, 1505–1716. [Google Scholar] [CrossRef] [PubMed]
  49. Detections, S.; Capoferri, D.; Ruslan, A.-D.; Del Carlo, M.; Compagnone, D.; Merkoci, A. Electrochromic Molecular Imprinting Sensor for Visual and Smartphone-Based Detections. Anal. Chem. 2018, 90, 5850–5856. [Google Scholar] [CrossRef] [Green Version]
  50. Appell, M.; Mueller, A. Mycotoxin Analysis Using Imprinted Materials Technology: Recent Developments. J. AOAC Int. 2016, 99, 861–864. [Google Scholar] [CrossRef]
  51. Boonsriwong, W.; Chunta, S.; Thepsimanon, N.; Singsanan, S.; Lieberzeit, P.A. Thin Film Plastic Antibody-Based Microplate Assay for Human Serum Albumin Determination. Polymers 2021, 13, 1763. [Google Scholar] [CrossRef] [PubMed]
  52. Surapong, N.; Burakham, R. Magnetic Molecularly Imprinted Polymer for the Selective Enrichment of Glyphosate, Glufosinate, and Aminomethylphosphonic Acid Prior to High-Performance Liquid Chromatography. ACS Omega 2021, 6, 27007–27016. [Google Scholar] [CrossRef]
  53. Akgönüllü, S.; Yavuz, H.; Denizli, A. SPR Nanosensor Based on Molecularly Imprinted Polymer Film with Gold Nanoparticles for Sensitive Detection of Aflatoxin B1. Talanta 2020, 219, 121219. [Google Scholar] [CrossRef]
  54. Enustun, B.V.; Turkevich, J. Coagulation of Colloidal Gold. J. Am. Chem. Soc. 1963, 85, 3317–3328. [Google Scholar] [CrossRef]
  55. Bodbodak, S.; Hesari, J.; Peighambardoust, S.H.; Mahkam, M. Selective Decontamination of Aflatoxin M1 in Milk by Molecularly Imprinted Polymer Coated on the Surface of Stainless Steel Plate. Int. J. Dairy Technol. 2018, 71, 868–878. [Google Scholar] [CrossRef]
  56. Horemans, F.; Alenus, J.; Bongaers, E.; Weustenraed, A.; Thoelen, R.; Duchateau, J.; Lutsen, L.; Vanderzande, D.; Wagner, P.; Cleij, T.J. MIP−Based Sensor Platforms for the Detection of Histamine in the Nano- and Micromolar Range in Aqueous Media. Sens. Actuators B Chem. 2010, 148, 392–398. [Google Scholar] [CrossRef]
  57. Li, H.; Yang, D.; Li, P.; Zhang, Q.; Zhang, W.; Ding, X.; Mao, J.; Wu, J. Palladium Nanoparticles-Based Fluorescence Resonance Energy Transfer Aptasensor for Highly Sensitive Detection of Aflatoxin M1 in Milk. Toxins 2017, 9, 318. [Google Scholar] [CrossRef] [Green Version]
  58. Zheng, N.; Sun, P.; Wang, J.Q.; Zhen, Y.P.; Han, R.W.; Xu, X.M. Occurrence of Aflatoxin M1 in UHT Milk and Pasteurized Milk in China Market. Food Control 2013, 29, 198–201. [Google Scholar] [CrossRef]
  59. Fang, B.; Xu, S.; Huang, Y.; Su, F.; Huang, Z.; Fang, H.; Peng, J. Gold Nanorods Etching-Based Plasmonic Immunoassay for Qualitative and Quantitative Detection of Aflatoxin M1 in Milk. Food Chem. 2020, 329, 127160. [Google Scholar] [CrossRef]
  60. Kasoju, A.; Shahdeo, D.; Khan, A.A.; Shrikrishna, N.S. Fabrication of Microfluidic Device for Aflatoxin M1 Detection in Milk Samples with Specific Aptamers. Sci. Rep. 2020, 10, 4627. [Google Scholar] [CrossRef] [PubMed] [Green Version]
  61. Jalalian, S.H.; Ramezani, M.; Danesh, N.M.; Alibolandi, M.; Abnous, K.; Taghdisi, S.M. A Novel Electrochemical Aptasensor for Detection of Aflatoxin M1 Based on Target-Induced Immobilization of Gold Nanoparticles on the Surface of Electrode. Biosens. Bioelectron. 2018, 117, 487–492. [Google Scholar] [CrossRef] [PubMed]
  62. Bacher, G.; Pal, S.; Kanungo, L.; Bhand, S. A Label-Free Silver Wire Based Impedimetric Immunosensor for Detection of Aflatoxin M1 in Milk. Sens. Actuators B Chem. 2012, 168, 223–230. [Google Scholar] [CrossRef]
  63. Sharma, A.; Catanante, G.; Hayat, A.; Istamboulie, G.; Ben, I.; Bhand, S.; Marty, J.L.; Louis, J. Development of Structure Switching Aptamer Assay for Detection of Aflatoxin M1 in Milk Sample. Talanta 2016, 158, 35–41. [Google Scholar] [CrossRef]
  64. Karczmarczyk, A.; Dubiak-Szepietowska, M.; Vorobii, M.; Rodriguez-Emmenegger, C.; Dostálek, J.; Feller, K.H. Sensitive and Rapid Detection of Aflatoxin M1 in Milk Utilizing Enhanced SPR and p(HEMA) Brushes. Biosens. Bioelectron. 2016, 81, 159–165. [Google Scholar] [CrossRef]
  65. Emir Diltemiz, S.; Ecevit, K. High-Performance Formaldehyde Adsorption on CuO/ZnO Composite Nanofiber Coated QCM Sensors. J. Alloys Compd. 2019, 783, 608–616. [Google Scholar] [CrossRef]
  66. Khayyun, T.S.; Mseer, A.H. Comparison of the Experimental Results with the Langmuir and Freundlich Models for Copper Removal on Limestone Adsorbent. Appl. Water Sci. 2019, 9, 170. [Google Scholar] [CrossRef] [Green Version]
  67. Langmuir, I. The Adsorption of Gases on Plane Surfaces of Glass, Mica and Platinum. J. Am. Chem. Soc. 1918, 40, 1361–1403. [Google Scholar] [CrossRef] [Green Version]
  68. Stromer, B.S.; Woodbury, B.; Williams, C.F. Tylosin Sorption to Diatomaceous Earth Described by Langmuir Isotherm and Freundlich Isotherm Models. Chemosphere 2018, 193, 912–920. [Google Scholar] [CrossRef] [PubMed]
  69. Latour, R.A. The Langmuir Isotherm: A Commonly Applied but Misleading Approach for the Analysis of Protein Adsorption Behavior. J. Biomed. Mater. Res.-Part A 2014, 103, 949–958. [Google Scholar] [CrossRef] [PubMed]
Figure 1. Schematic representation of MIP–based plasmonic sensor chip fabrication process.
Chemosensors 09 00363 g001
Figure 2. (a) DLS image and (b) TEM image of AuNPs.
Chemosensors 09 00363 g002
Figure 3. (a) MIP, (b) NIP AFM images; (c) unmodified surface, (d) MIP nanofilm surface SEM image; and (e) bare SPR chip, (f) MIP SPR chip ellipsometer images.
Chemosensors 09 00363 g003
Figure 4. The sensorgram images of AFM1 solutions under different concentrations. Experiments were conducted in the presence of AFM1 samples from 0.0003 to 20.0 ng/mL in PBS buffer.
Chemosensors 09 00363 g004
Figure 5. (a) Calibration curve; (b) association binding kinetic; (c) Scatchard equation; (d) Langmuir model; (e) Freundlich model; and (f) Langmuir–Freundlich model of AFM1−imprinted plasmonic sensor.
Chemosensors 09 00363 g005
Figure 6. The SPR sensor response for different mycotoxins: (a) AFM1−MIP enhanced plasmonic sensor (mycotoxin concentration: 1.0 ng/mL); (b) comparison of results of AFM1−MIP and NIP plasmonic sensor (mycotoxin concentration: 1.0 ng/mL); (c) response of the AFM1−MIP plasmonic sensor to total aflatoxin solution (mycotoxin concentration: 1.0 ng/mL); (d) real–time monitoring of AFM1 in spiked milk sample.
Chemosensors 09 00363 g006
Figure 7. (a) Storage stability and (b) reusability of AFM1−imprinted plasmonic sensor.
Chemosensors 09 00363 g007
Table 1. Comparison of different sensing platforms for the detection of Aflatoxin M1 in milk samples.
Sensor TypeMethodLinear RangeLODSampleRef.
PlasmonicGold-nanorod-etching-based plasmonic immunoassay0.25–10 ng/mL0.11 ng/mLMilk
(supermarket)
[59]
ColorimetricMicrofluidic paper-based analytical device328.27 ng/mL–0.33 pg/mL0.98 pg/mL–3.28 pg/mLStandard buffer and spiked buffalo milk[60]
ElectrochemicalTarget-induced immobilization of AuNP-based electrochemical aptasensor0.002–0.6 ng/mL0.9 pg/mLMilk and serum sample[61]
ImpedimetricLabel-free silver-wire-based impedimetric immunosensor0.25–100 pg/mL1.0 pg/mLMilk[62]
FluorescenceSwitching aptasensing platform0.001–2 ng/mL0.005 ng/mLMilk (local market)[63]
PlasmonicPoly(2-hydroxyethyl methacrylate) p(HEMA) brush0.1–1000 ng/mL18.0 pg/mLMilk[64]
Plasmonic
(SPR sensor)
Molecularly imprinted polymer nanofilm with embedded gold nanoparticles0.0003–20 ng/mL0.4 pg/mLBuffer solution and spiked raw milkThis work
Table 2. Kinetic and isotherm parameters of MIP−based plasmonic sensor.
Association Binding KineticEquilibrium Analysis (Scatchard)Langmuir Freundlich Langmuir–Freundlich
ka (ng.mL−1)−1.s−10.0025ΔRmax13.64ΔRmax12.5ΔRmax3.42ΔRmax16.66
kd (s−1)0.0033KA (ng.mL−1)−10.14KD (ng.mL−1)4.75n1.281/n0.28
KA (ng.mL−1)−10.75KD ng.mL−11.91KA (ng.mL−1)−10.38R20.9819KD (ng.mL−1)5.16
KD ng.mL−11.32R20.8908R20.9795 KA (ng.mL−1)−10.19
R20.9755 R20.9819
Table 3. The selectivity coefficient (k), relative selectivity coefficient (k’), and imprinting factor (IF) results.
MycotoxinMIP NIP IF (MIP/NIP)
ΔRkΔRkk’
AFM13.380.84.22
AFB11.621.870.51.61.333.16
OTA0.983.440.990.804.260.98
CIT0.774.381.050.765.760.73
Publisher’s Note: MDPI stays neutral with regard to jurisdictional claims in published maps and institutional affiliations.

