Article

A Deferasirox Derivative That Acts as a Multifaceted Platform for the Detection and Quantification of Fe3+

Department of Chemistry, The University of Texas at Austin, 105 E 24th Street A5300, Austin, TX 78712-1224, USA
*
Author to whom correspondence should be addressed.
Chemosensors 2021, 9(4), 68; https://doi.org/10.3390/chemosensors9040068
Submission received: 15 February 2021 / Revised: 22 March 2021 / Accepted: 25 March 2021 / Published: 30 March 2021
(This article belongs to the Special Issue Applications of Chemosensors in Real-World Sample Analysis)

Abstract

:
Here, we report that ExSO3H, a synthetically accessible, water-soluble, non-toxic derivative of the clinical iron chelator deferasirox, acts as a colorimetric chemosensor that permits the detection and quantification of Fe3+ in aqueous samples at pH 2–5. In addition, we observed that a fluorescent turn-on response was produced when this chelator was allowed to interact with human serum albumin (HSA). This fluorescence was quenched in the presence of Fe3+, thus allowing us to monitor the presence of this biologically important metal cation via two independent methods.

1. Introduction

The selective detection and reliable quantification of metal cations in aqueous samples is a critical aspect of analytical chemistry. It serves, for instance, to ensure that quality standards set by regulatory bodies, such as the World Health Organization (WHO), are met for drinking water and food [1,2]. These needs are providing an incentive to develop fast, reliable and inexpensive analytical methods that meet the sensitivity and detection limits associated with these and other quality standards. Iron, the most abundant transition metal in the earth’s crust, is a key micro-nutrient due to its structural role in biology and its presence as a cofactor in a plethora of enzymes and proteins. Iron, in formal oxidation states ranging from Fe2+ to Fe5+, is involved in numerous vital processes including but not limited to oxygen transport and storage, energy generation within the mitochondria, drug metabolism, and DNA synthesis [3,4,5,6]. In normal non-biological milieus, the dominant oxidation state for iron is Fe3+, a species whose solubility is highly dependent on pH due to the formation of poorly soluble Fe3+ oxide- and hydroxide species, e.g., Ksp for Fe(OH)3 ≈ 10−40 [4]. However, matrix effects such as the presence of oxalates, salicylates and humic acids have been reported to increase the solubility of Fe3+ in real-life water samples [7,8,9].
In the laboratory, the concentrations of heavy metals, such as cadmium, arsenic and lead, are frequently quantified via flame atom absorption spectroscopy (FAAS) due to the low costs, the small sample size requirements, and the fast response times associated with this method [10]. However, the reliable quantification of iron cations in real-life water samples via FAAS at or below the WHO recommended limit of 0.3 ppm (=0.3 mg/L or 5.4 µM) requires laborious preconcentration due to the low concentration of Fe3+ which lie well below the detection limit of FAAS for this particular cation [11]. In addition to this shortcoming, the unpredictable impact of matrix effects further limits the utility of FAAS as an analytical method for the quantification of iron cations in water samples [12]. Other instrumental methods that have been explored for iron detection include inductively coupled plasma mass spectrometry (ICPMS), [13,14] inductively coupled plasma atomic emission spectroscopy [15], potentiometry [16] and voltammetry [17]. However, these techniques are either expensive, require costly instrumentation, or are time consuming to conduct when analyzing multiple samples. In an effort to overcome these drawbacks, researchers have focused on the development of spectrophotometric chemosensors that allow for the rapid determination of iron content in water samples using colorimetric [18,19,20,21,22,23,24,25,26,27,28] and fluorescent-based [21,23,27,28,29,30,31,32,33,34] means. However, many of these systems require the use of organic co-solvents, such as chloroform or acetic acid. Moreover, as a general rule, existing iron chemosensors are relatively challenging to access synthetically; many also depend on chemical motifs that are inherently toxic, such as rhodamine [35].
Chelators that display binding selectivity towards the ferric iron have been in clinical use for a number of decades as treatments for iron overload disease [4]. Deferasirox (1) is an U.S. Food and Drug Administration (FDA) approved iron chelator that possesses a high binding affinity for ferric iron (logβ = 36.9 for the 2:1 ligand-metal complex) [36] and benefits from selectivity over other biologically relevant metal cations. Interestingly, 1 is known to form a distinct, pink colored 1:1 ligand-metal complex with Fe3+, particularly in organic solvents [36]. In water, however, 1 has been reported to form both 1:1 and 2:1 complexes with Fe3+. These two species have different spectral features. Moreover, their actual distribution is a sensitive function of pH. As a consequence, tight control over the pH is required if 1 is to be used for the quantitative determination of Fe3+ in water [36]. Further complicating matters is the hydrophobicity of 1 (logP = 3.8); this results in poor water solubility and further limits its utility as a Fe3+ chemosensor [37]. Recognizing these limitations, we focused our efforts on evaluating the sulfonic acid-bearing deferasirox derivative, 2, as a potential Fe3+ chemosensor. The strategic introduction of sulfonic acid groups to enhance the water solubility of chemosensors has been explored previously [38,39]. The introduction of this functional group has also been reported to reduce the cytotoxicity of small molecules [40,41]. As true for 1, the distribution between the 1:1 and 2:1 complexes of 2 with Fe3+ in water favors predominantly the 1:1 complex below pH 5 (vide infra) [36]. We thus thought that 2 could emerge as a chemosensor for Fe3+ that would permit the naked-eye detection and spectrophotometric quantification of Fe3+ in aqueous samples. This study was undertaken in an effort to test this hypothesis.

2. Materials and Methods

2.1. Synthesis

Deferasirox (1) and the sulfonic acid bearing derivative ExSO3H (2) were synthesized on the decagram scale from commercially available reactants and in good yield following a simple two-step procedure that was adapted from the literature (cf. Supplementary Materials Scheme S1) [36].
Detailed synthetic procedures and analytical data verifying the identity and purity of all prepared compounds can be found in the supporting information (ESI). The reported 1H NMR and 13C NMR spectra were measured on Varian Inova spectrometers at The University of Texas at Austin using CDCl3 and DMSO-d6 as the deuterated solvents. Chemical shifts are reported relative to the residual solvent proton signals. For the spin multiplicities, the following abbreviations were used: s (singlet), d (doublet), t (triplet), q (quartet), and m (multiplet), as well as appropriate combinations of these. Coupling constants for protons (J) are given in Hertz (Hz). The NMR spectra were analyzed using the software MestReNova v.10.0.2-15465 (Mestrelab Research S.L., Santiago de Compostela, Spain). All deuterated solvents were purchased from Cambridge Isotope Laboratories (Tewksbury, USA). High-resolution electrospray ionization (ESI) mass spectra were recorded on a VG ZAB2E instrument or VG AutoSpec apparatus.

2.2. Chemicals

All materials were obtained from commercial sources at the highest purity available and used without further purification. Reactions were carried out under air unless otherwise specified. Flash column chromatography was performed on Sorbent silica gel (40–63 μm). Analytical thin layer chromatography (TLC) analyses were carried out using glass-backed silica gel plates (200 μm, Sorbent Technologies, Norcross, GA, USA).

2.3. Water Samples

Stream water was collected on Tuesday 23 July 2019, 11 a.m. from a local stream in Austin at 30°17′13.9″ N, 97°44′02.7″ W. Tap water was collected on Wednesday 8 July 2019, 4 p.m. from a tap inside the Sessler Group Labs on the 5th floor of the Norman Hackerman Building at 105 E 24th Street, Austin, TX, 78712 (USA).

2.4. pH Determination

pH measurements were performed at 20 °C on a calibrated Accumet® AE-150 pH meter with a glass combination pH and oxidation-reduction potential (ORP) titration electrode (Ag/AgCl in sat. KCl as the internal reference) and a temperature sensor.

2.5. Spectroscopy

UV-Vis spectra were recorded on a Varian Cary 5000 UV-Vis-NIR Spectrophotometer. A baseline correction was performed with the corresponding blank (pure solvent) before each spectrum was taken. Fluorescence spectroscopic measurements were made using an Agilent Cary Eclipse fluorescence spectrofluorometer. The emission and excitation slit widths were fixed at 5 nm unless otherwise specified. Emission spectra were recorded using an excitation wavelength of 330 nm unless otherwise specified. Where applicable, appropriate blanks were subtracted from the spectra.

2.6. Cell Experiments

A549 cells were obtained from the American Type Culture Collection (ATCC, Manassas, VA, USA) and maintained in an RPMI-1640 Medium (Sigma, St. Louis, MO, USA) supplemented with 10% fetal bovine serum (FBS, Sigma, St. Louis, MO, USA) and 2% Penicillin/Streptomycin (P/S, Sigma, St. Louis, MO, USA) in a humidified atmosphere of 5% CO2 and 95% air at 37 °C. Cells were split when they reached 90% confluency. Absorbance values for the 3-(4,5-dimethylthiazol-2-yl)-2,5-diphenyltetrazolium bromide (MTT) assay were measured at 540 nm with an M5 microplate reader (Molecular Device, Sunnyvale, CA, USA). Linear regression analyses were performed in Origin 2019b (OriginLab, Northampton, MA, USA).
For the MTT assay, A549 cells were harvested and plated on a 96-well plate in 100 µL growth medium at a density of 1500 cells per well. The cells were left to grow overnight in an incubator at 37 °C under 5% CO2 atmosphere for 24 h. The next day, appropriate concentrations of the compound under investigation were prepared via three-fold serial dilution in growth medium, and 100 µL was added to each row of wells. Herein, the highest concentration of compound that was evaluated was 250 µM. Two rows of wells were treated with only 100 µL medium as reference. After further incubation for 72 h, 3 mg/mL MTT dye was dissolved in FBS- and P/S free medium and 50 µL of this MTT solution was added to each well. After an additional incubation for 4 h, the supernatant was carefully removed and 50 µL of DMSO was added to each well to solubilize the precipitated formazan dye. The optical density was measured for each well and a dose–response curve was produced from the mean absorbance of each row of wells, which was normalized to the wells containing untreated cells to allow for plate-to-plate comparison. The dose–response curves were subjected to linear regression analysis to determine the half maximum inhibitory concentration (IC50) values. Data are shown as the mean of 3 replicate experiments and error bars represent the standard deviation.

3. Results and Discussion

In the presence of Fe3+ in water at pH = 3, both 1 and 2 show a distinct absorption peak with an absorbance maximum around 510 nm in the visible spectral region, as shown in Figure 1a. However, chemosensor 2 produces a more readily visible coloration and gives rise to a greater absorbance at 510 nm with respect to 1. We thus went on to evaluate the sensitivity of 2 to changes in pH. Towards this end, aqueous acetate buffer solutions of pH 2–5 were prepared and the absorbance at 510 nm was measured for solutions that were 30 µM in both Fe3+ (as FeCl3) and 2, respectively, over the course of 50 min. The results, shown in Figure 1c, reveal that 2 yielded a reproducible response over the 2–5 pH range. Moreover, the measured absorbance at 510 nm was found to increase rapidly until reaching a constant plateau after 3–9 min depending on the pH. At pH = 3 and pH = 4, we observed a similar absorbance at 510 nm after only 3 min incubation time, which remained constant. At pH = 2, a constant absorbance was measured after 5 min incubation time; however, at all time points the absorbance value was below that measured at pH = 3. At pH = 5, we observed the highest absorbance among the evaluated pH levels after an incubation time of 9 min. However, at pH = 5 the intensity grew comparatively slowly and remained less consistent over time as compared to what was seen at pH = 3. These findings indicated to us that each of the evaluated pH levels would be advantageous in some aspect for further exploration of 2 as a colorimetric chemosensor. To ensure consistency, pH = 3 was used for further experiments, in part because this pH value would allow for a direct comparison to 1, which at this pH also supports the predominant formation of a 1:1 complex [36].
To assess the binding stoichiometry between 2 and Fe3+, we employed the method of continuous variation (Job plot analysis), which yielded an absorption maximum at a mole fraction of 0.5 as expected for a 1:1 binding stoichiometry (Figure 2a,b).
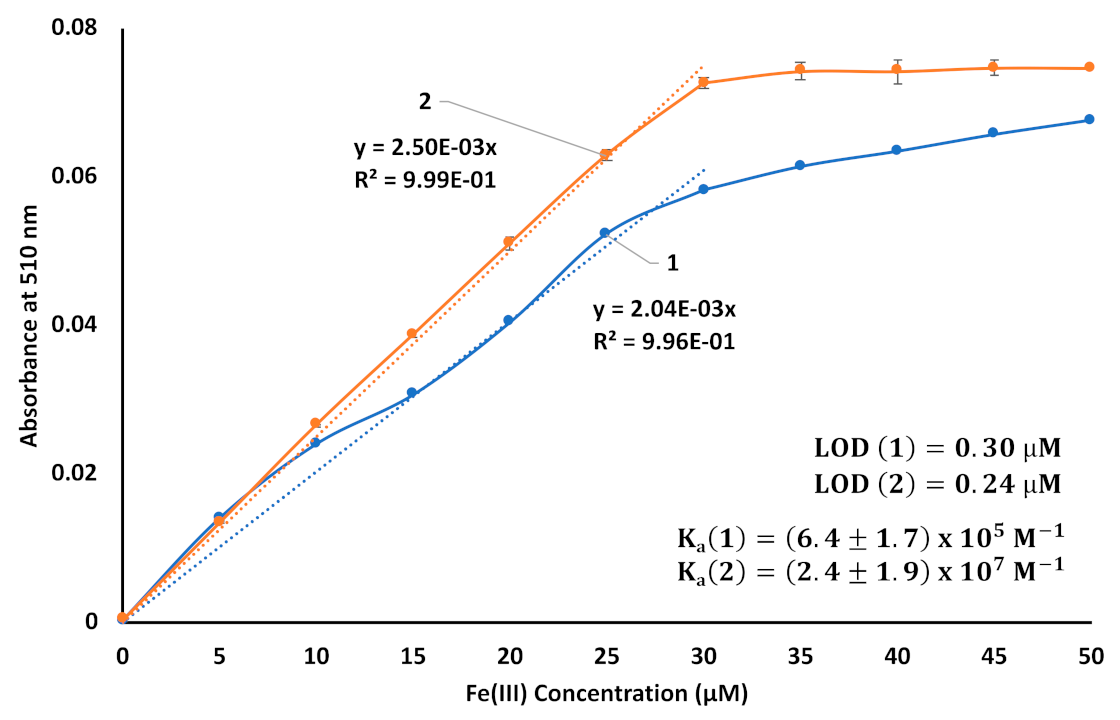
The titration of 1 and 2 with Fe3+ in a 0.1 M aqueous acetate buffer at pH 3 yielded a linear concentration dependent increase in the absorbance intensity at 510 nm in the case of 2. The response became non-linear after 1 equivalent of Fe3+ (30 µM) had been added, a finding consistent with the proposed 1:1 binding mode. Less ideal behavior was seen for chelator 1, as can be seen from an inspection of Figure 3. From the titration data, the association constants (Ka) for the 1:1 metal-ligand complexes of 1 and 2 with Fe3+ could be estimated via a non-linear regression analysis [42]. We also calculated the limit of detection (LOD) using the following formula: LOD = 3 × SDb × mx−1 (where SDb = standard deviation of the blank and mx = slope of the titration curve). The results obtained in this way (cf. Figure 3) provided support for the inference drawn on the basis of the colorimetric studies, namely that 2 constitutes the more sensitive chemosensor for Fe3+. In fact, at pH 3, sensor 2 permits the quantification of Fe3+ in water with a LOD = 0.24 µM vs. ca. 0.30 µM for 1. Due to the nonlinear nature of the response seen with 1, the latter value should be treated as being an estimate. Based on these findings, we conclude that 2 may be employed as a chemosensor for the quantification of Fe3+ within the 0.24 µM to 30 µM concentration regime where linear response behavior is seen.
A screen of nine different divalent and trivalent metal cations revealed that only Fe3+ produced an appreciable color change with chemosensor 2 as shown in Figure 4. In the case of Mn2+ and 2, an absorbance feature at 510 nm was seen at high concentrations; however, at the same 50 µM concentration where Fe3+ produced a response, no visible coloration was seen in the case of Mn2+. Notably, the presence of Cu2+, Al3+ and Fe2+, all potential interferants for an Fe3+ binding motif, did not produce any visible discoloration nor a measurable absorbance at 510 nm.
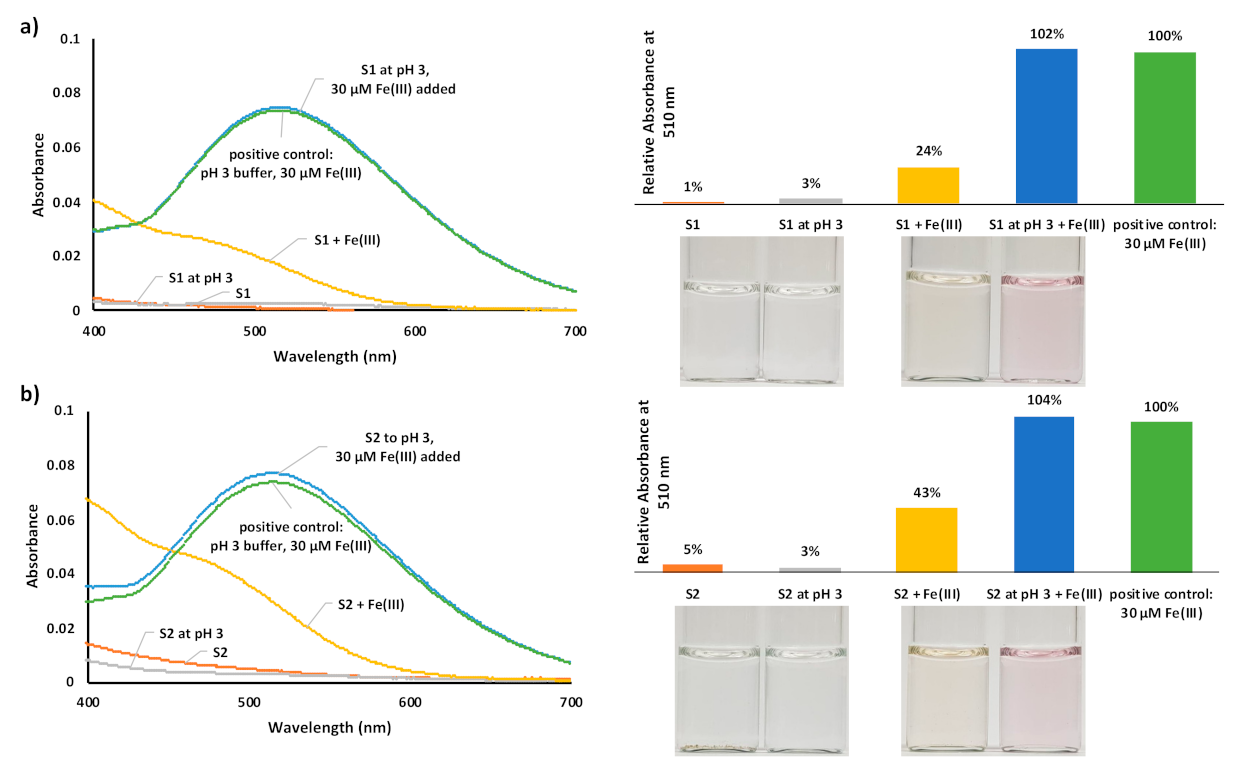
We went on to evaluate the performance of 2 as an Fe3+ colorimetric chemosensor in a tap water sample (S1) and a stream water sample (S2), with the results being shown in Figure 5. The addition of 50 µM 2 produced only a small absorbance at 510 nm for each sample, respectively. To verify the effectiveness of 2 as a colorimetric sensor and to assess the impact of matrix effects, we then added 30 µM Fe3+ to each sample and compared the response to a positive control containing 30 µM Fe3+ and 50 µM 2 in pH 3 buffer solution. Due to the basic pH of each water sample (pH > 8), the addition of Fe3+ produced a shallower absorbance curve than might have been expected for each water sample. Thus, we explored prior acidification of each sample to pH 3 by adding adequate amounts of 0.01 M HCl. Under these conditions, the addition of 30 µM Fe3+ resulted in the expected proportional increase in absorbance at 510 nm and gave a signal commensurate with the positive control. These results lead us to suggest that after pH adjustment, matrix effects do not significantly impact the efficacy of 2 in real-life water samples.
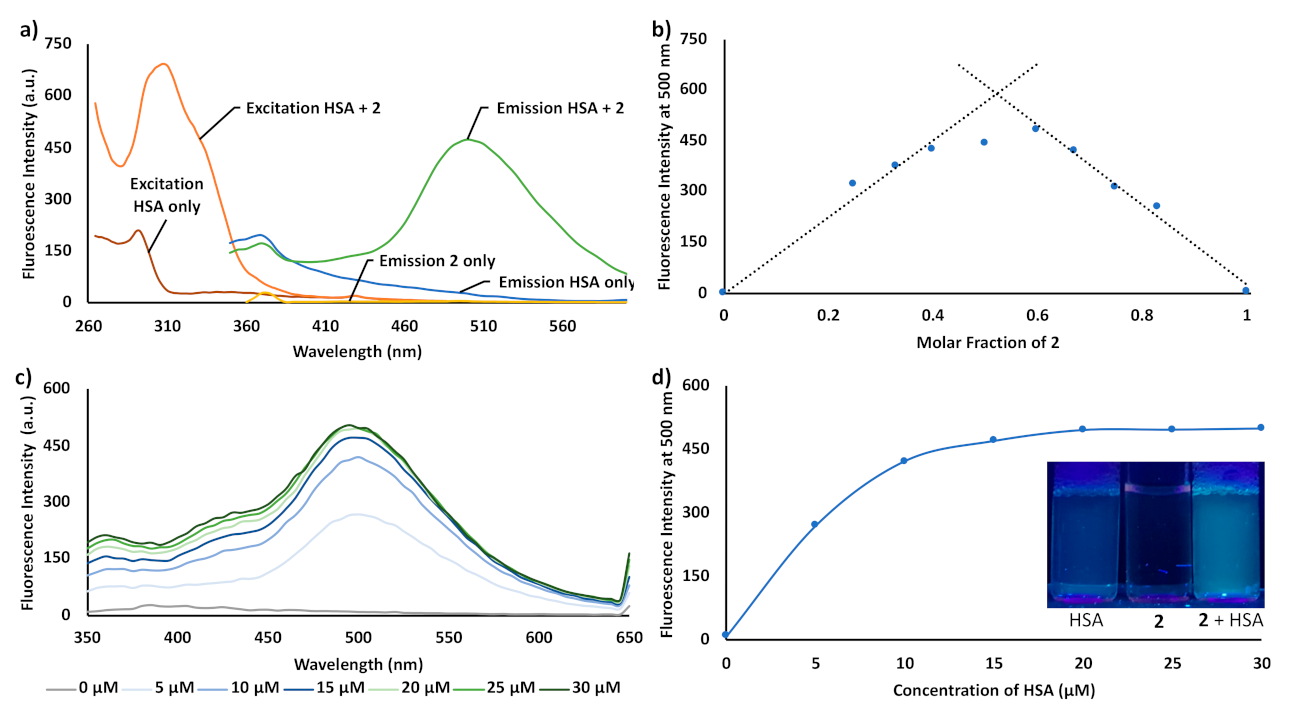
We have recently found that the strategic functionalization of 1 provides access to chelators that show fluorescent behavior in aqueous media via a fluorescence mechanism that involves aggregation induced emission (AIE) [43]. It was thus thought that the measurement of the putative AIE fluorescent emission intensity might provide a means of quantifying the concentration of 2 in aqueous samples. Unfortunately, the sulfonated derivative 2 did not produce a detectable fluorescent signal in acetate buffer at pH 3 or in deionized water at pH 5.5 after addition, respectively, a finding that we attribute to this particular chelator having a relatively high water-solubility with respect to other deferasirox-derivatives, including 1. High water solubility is expected to militate against aggregation and preclude an AIE effect. This perceived limitation was overcome by adding human serum albumin (HSA) to solutions of 2 in deionized water. Deionized water was employed to avoid both the acid catalyzed denaturation of HSA in pH 3 buffer solution and also avoid the precipitation of insoluble iron hydroxide species, which is the case if pH 7.2 PBS buffer is utilized [44,45]. The addition of 10 µM 2 to 20 µM HSA in deionized water resulted in pH = 6.5, as verified by pH measurements carried out upon completion of the experiment.
The encapsulation of small molecules in HSA and other proteins has gained increasing attention in recent years since it allows the unique electronic environments inside the protein to be accessed while typically providing increased water solubility [46,47,48]. In our case, it was expected to lead to a fluorescent probe. As can be seen from an inspection of Figure 6, mixtures of 2 and HSA in deionized water did indeed prove fluorescent. The excitation and emission spectra for 2 after contact with HSA are shown in Figure 6. A 1:1 binding stoichiometry between 2 and HSA was inferred based on continuous variation analyses (Job plots). The addition of HSA to 10 µM 2 in water produced a fluorescence turn-on response in a concentration dependent manner as shown in Figure 6c,d under excitation at 330 nm. A steep increase in the fluorescence emission intensity at 500 nm was observed upon the addition of up to 1 equivalent of HSA, while apparent saturation of the fluorescence was reached once 2 equivalents of HSA had been added.
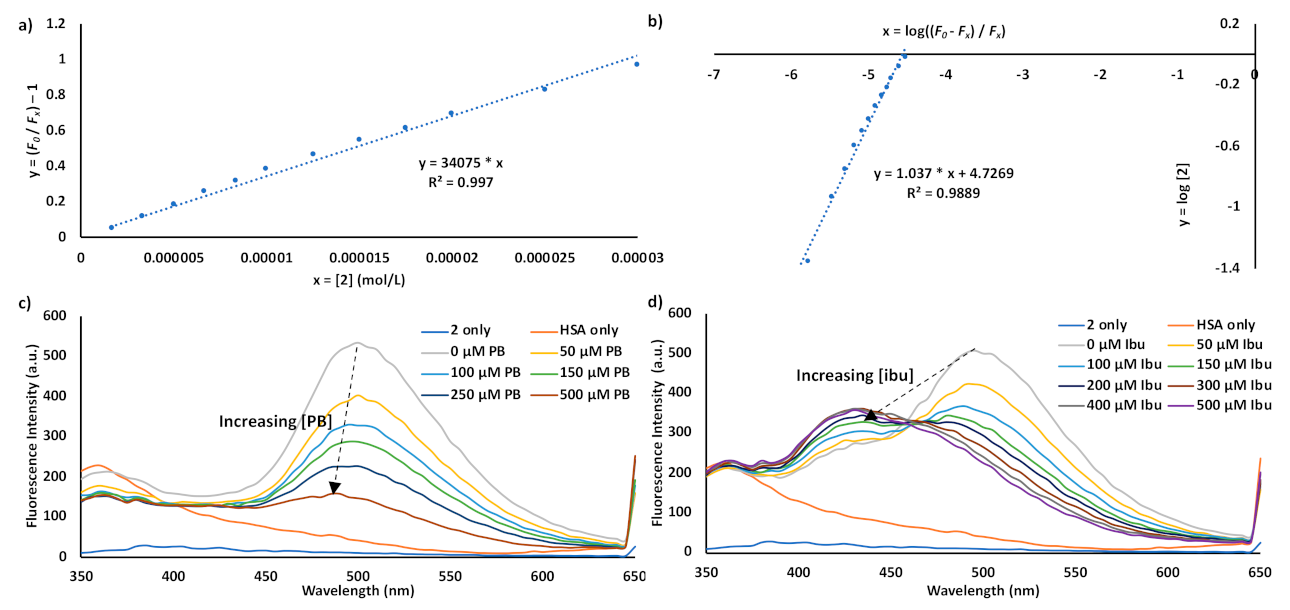
To gain insight into the interaction between 2 and HSA, a Stern–Volmer plot was created using data obtained via the incremental addition of 2 to 5 µM HSA in deionized water, with the results shown in Figure 7a. Here, 2 acted as quencher for the emission of the tryptophan moieties in HSA and in accord with the Stern–Volmer Equation (1), (F0Fx) − 1 was plotted over [2]:
F 0 F x 1 = K S V Q = k q τ 0 Q
With F0, Fx = fluorescence intensity at 360 nm in the absence (F0) and presence (Fx) of quencher Q, K S V = Stern–Volmer quenching constant, k q = the bimolecular rate constant of the quenching reaction, and τ 0 = the average fluorescent lifetime.
Rearranging Equation (1) and inserting K S V = 3.4 10 4   M 1 = slope in Figure 7a and τ 0 = 5 10 9   s = fluorescent lifetime of the tryptophan moieties in HSA [49,50,51] yields Equation (2):
k q = K S V τ 0 = 3.4 10 4 5 10 9 L mol s = 6.8 10 12   M 1 s 1
From the magnitude of k q , the interaction between 2 and HSA was deduced as involving static quenching, which is ascribed to the binding of 2 by HSA. Dynamic quenching is limited by diffusion control and therefore requires k q 6 10 9   M 1 s 1 [49,52], which was not observed. Modification of the Stern–Volmer equation allowed us to estimate n, the number of equivalents of 2 that bind to HSA, and Ka, the binding constant between 2 and HSA [49,50,51], as follows:
log F 0 F x 1 = n log Q + log K a
From the slope of the double logarithm plot shown in Figure 7b, a 1:1 binding stoichiometry between 2 and HSA was inferred, as well as an association constant for this interaction of K a 5.0 10 4   M 1 from the intercept of the plot.
To gain further insights into the interactions between 2 and HSA, competition assays were performed using phenylbutazone (PB) and ibuprofen (ibu). These two drugs have been reported to bind predominantly to the IIA and IIIA regions of HSA, respectively [46]. The results shown in Figure 7c are consistent with competition between 2 and phenylbutazone. Such a finding provides support for the notion that the deferasirox derivative 2 binds to the IIA region of HSA. By contrast, the addition of ibuprofen resulted in a shift in the emission wavelength but persistence in the fluorescent emission. This latter finding is consistent with 2 remaining bound to HSA upon the addition of the IIIa region binder, ibuprofen. The cause of the observed shift in emission wavelength was not further explored over the course of this investigation.
The addition of Fe3+ to 2 after pre-complexation with HSA resulted in a loss in the fluorescence intensity at 500 nm in a linear, concentration dependent manner up to 1 equivalent of Fe3+ added as shown in Figure 8. Based on the titration data, the association constants (Ka) for the HSA-encapsulated ligand 2 with Fe3+ could be estimated via a non-linear regression analysis [42]. We also calculated the limit of detection (LOD) using the following formula: LOD = 3 × SDF0 × |mx−1| (where SDF0 = standard deviation of 10 µM 2 mixed with 20 µM HSA, and mx = slope of the titration curve). However, it is to be noted that this combination requires photoexcitation at or below 350 nm, which could limit its utility as a biological fluorescent probe.
A standard mixture of 10 µM 2 and 20 µM HSA was screened with a selection of nine different divalent and trivalent metal cations, and the resultant emission spectra are shown in Figure 9. We observed fluorescent quenching in the presence of Cu2+, Fe2+, and Fe3+, while the addition of Al3+ resulted in the emergence of a new fluorescent maximum at 430 nm. These results lead us to suggest that 2 may be employed for the selective quantification of Fe3+ via colorimetry and combined Fe2+/3+ via fluorimetry; however, experimental conditions that exclude the presence of Cu2+ and Al3+ would need to be employed for the latter analyses. The observed emission increase in the presence of Al3+ will be the subject of further explorations in our lab; however, such efforts are beyond the scope of the present iron sensing study.
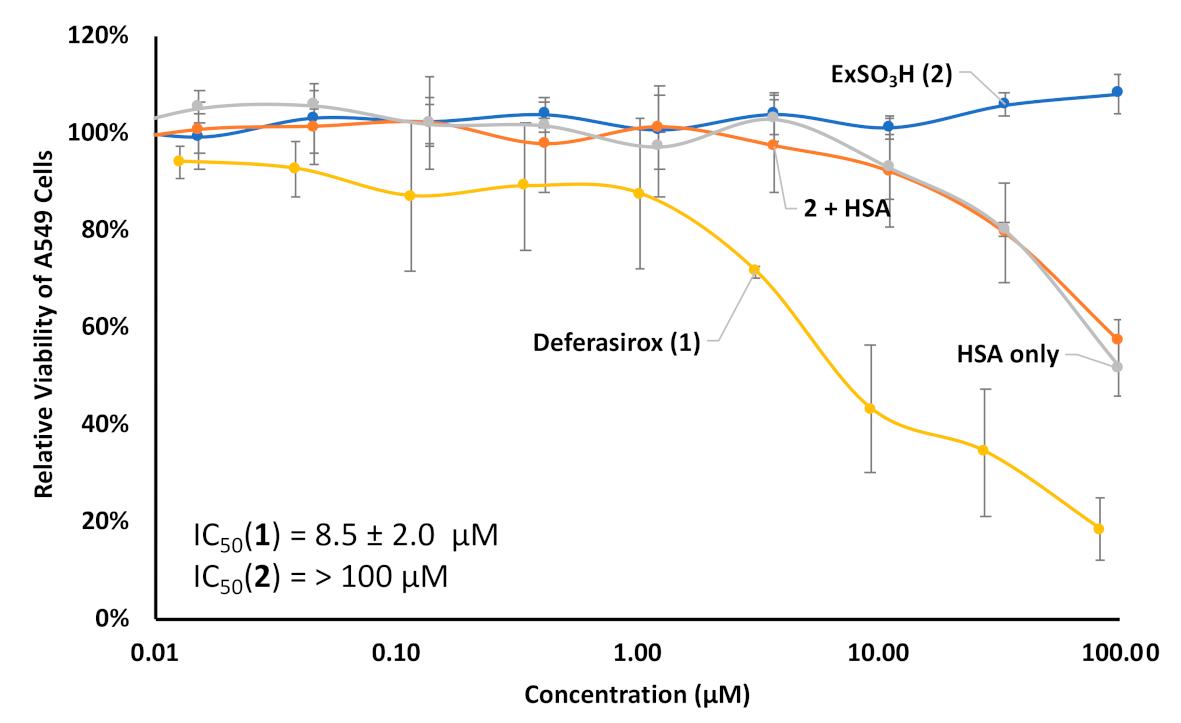
Cellular toxicity is another aspect of that needs to be considered during chemosensor development. Therefore, the in vitro cytotoxicity of 1 and 2 was evaluated in A549 lung cancer cells via a standard MTT assay with results shown in Figure 10. The A549 cell line is one with reported sensitivity to Fe3+ chelators and is one in which the cytotoxicity of 1 has been well established [53]. In accord with literature-based expectations, chelator 1 produced a concentration dependent decrease in cell viability with an IC50 value of 8.5 µM when incubated for 72 h. In contrast, 2 did not give rise to observable cytotoxicity in A549 cells over the full range of concentrations evaluated (i.e., 0–100 µM). The preincubation of 2 with HSA did not lead to a notable increase in the cytotoxicity.
To provide further context regarding the potential utility of 2 as an iron cation sensor, we have summarized previously reported Fe3+ selective chemosensors in Table 1. This table contains data for a representative set of five different chemical scaffolds that have been explored for the detection and quantification of Fe3+ in water samples. In comparison to these prior studies, 2 shows excellent LOD and an attractive Ka value. It is also appealing in that it is suitable for use under fully aqueous conditions.

4. Conclusions

In this study, we have shown that ExSO3H (2), a water-soluble, non-cytotoxic, synthetically accessible and simple-to-prepare chemosensor, allows for the detection and quantification of Fe3+ in aqueous media at ≤pH 5. Chemosensor 2 produces a colorimetric response in the presence of Fe3+ but not other representative divalent or trivalent cations. Under acidic conditions, this colorimetric response could be used to quantify Fe3+ concentrations in real-life water samples. We further showed that treatment of 2 with the serum protein HSA, resulted in a fluorescent turn-on response that is quenched by Fe3+ in a concentration dependent manner, and that neither the free ligand 2 nor its protein-complex was cytotoxic to A549 cells.

Supplementary Materials

The following are available online at https://www.mdpi.com/article/10.3390/chemosensors9040068/s1, Scheme S1: Synthetic scheme for the preparation of 1 and 2., Figure S1: Emission profiles before and after addition of DMSO to 2 and HSA., Figure S2: Emission profiles of HSA upon addition of 2 used for the Stern-Volmer plot., Detailed synthetic procedures for all relevant compounds and the NMR and high-resolution MS spectra used for their characterization.

Author Contributions

Conceptualization, A.S. and A.C.S.; methodology, A.S., A.C.S. and Y.-Y.W.; validation, M.Y.Z., D.-Y.H.; investigation, A.S. and S.-M.H.; resources, J.L.S.; data curation, A.S.; writing—original draft preparation, A.S.; writing—review and editing, S.S., D.M.K., J.L.S.; supervision, J.L.S.; funding acquisition, J.L.S. All authors have read and agreed to the published version of the manuscript.

Funding

This work was supported by the Robert A. Welch Foundation (F-0018 to J.L.S.) and a ConTex grant provided by The University of Texas System (2019-06A to J.L.S.).

Data Availability Statement

All relevant data is contained within the article or supplementary material.

Acknowledgments

We acknowledge use of a Bruker AVIII HD 500 with Prodigy liquid nitrogen cryoprobe supported by NIH grant 1 S10 OD021508.

Conflicts of Interest

The authors declare no conflict of interest.

References

  1. World Health Organization; International Programme on Chemical Safety. Guidelines for Drinking-Water Quality: Health Criteria and Other Supporting Information, 2nd ed.; WHO: Geneva, Switzerland, 1996; Volume 2. [Google Scholar]
  2. Pesavento, M.; Alberti, G.; Biesuz, R. Analytical methods for determination of free metal ion concentration, labile species fraction and metal complexation capacity of environmental waters: A review. Anal. Chim. Acta 2009, 631, 129–141. [Google Scholar] [CrossRef] [PubMed]
  3. Que, E.L.; Domaille, D.W.; Chang, C.J. Metals in Neurobiology: Probing Their Chemistry and Biology with Molecular Imaging. Chem. Rev. 2008, 108, 1517–1549. [Google Scholar] [CrossRef] [PubMed]
  4. Steinbrueck, A.; Sedgwick, A.C.; Brewster, J.T.; Yan, K.-C.; Shang, Y.; Knoll, D.M.; Vargas-Zúñiga, G.I.; He, X.-P.; Tian, H.; Sessler, J.L. Transition metal chelators, pro-chelators, and ionophores as small molecule cancer chemotherapeutic agents. Chem. Soc. Rev. 2020, 49, 3726–3747. [Google Scholar] [CrossRef] [PubMed]
  5. Richardson, D.R.; Kalinowski, D.S.; Lau, S.; Jansson, P.J.; Lovejoy, D.B. Cancer cell iron metabolism and the development of potent iron chelators as anti-tumour agents. Biochim. Biophys. Acta Gen. Subj. 2009, 1790, 702–717. [Google Scholar] [CrossRef]
  6. Abbaspour, N.; Hurrell, R.; Kelishadi, R. Review on iron and its importance for human health. J. Res. Med. Sci. 2014, 19, 164–174. [Google Scholar] [PubMed]
  7. Fujii, M.; Imaoka, A.; Yoshimura, C.; Waite, T.D. Effects of molecular composition of natural organic matter on ferric iron complexation at circumneutral pH. Environ. Sci. Technol. 2014, 48, 4414–4424. [Google Scholar] [CrossRef]
  8. Schwertmann, U. Solubility and dissolution of iron oxides. Plant Soil 1991, 130, 1–25. [Google Scholar] [CrossRef]
  9. Arpadjan, S.; Tsekova, K.; Petrova, P.; Knutsson, J. Field sampling, speciation and determination of dissolved iron (II) and iron (III) in waters. Bulg. Chem. Commun. 2012, 44, 299–306. [Google Scholar] [CrossRef]
  10. Vickackaite, V.; Tautkus, S.; Kazlauskas, R. Determination of Heavy Metals in Natural Waters by Flame Atomic Absorption Spectrometry. Chem. Anal. 1996, 41, 483–488. [Google Scholar]
  11. Shamspur, T.; Sheikhshoaie, I.; Mashhadizadeh, M.H. Flame atomic absorption spectroscopy (FAAS) determination of iron(III) after preconcentration on to modified analcime zeolite with 5-((4-nitrophenylazo)-N-(2′,4′-dimethoxyphenyl))salicylaldimine by column method. J. Anal. At. Spectrom. 2005, 20, 476–478. [Google Scholar] [CrossRef]
  12. Yildiz, O.; Citak, D.; Tuzen, M.; Soylak, M. Determination of copper, lead and iron in water and food samples after column solid phase extraction using 1-phenylthiosemicarbazide on Dowex Optipore L-493 resin. Food Chem. Toxicol. 2011, 49, 458–463. [Google Scholar] [CrossRef] [PubMed]
  13. Yan, X.P.; Hendry, J.M.; Kerrich, R. Speciation of dissolved iron(III) and iron(II) in water by on-line coupling of flow injection separation and preconcentration with inductively coupled plasma mass spectrometry. Anal. Chem. 2000, 72, 1879–1884. [Google Scholar] [CrossRef] [PubMed]
  14. Hu, Q. Simultaneous Separation and Quantification of Iron and Transition Species Using LC-ICP-MS. Am. J. Anal. Chem. 2011, 2, 675–682. [Google Scholar] [CrossRef] [Green Version]
  15. Pomazal, K.; Prohaska, C.; Steffan, I.; Reich, G.; Huber, J.F.K. Determination of Cu, Fe, Mn, and Zn in blood fractions by SEC-HPLC-ICP-AES coupling. Analyst 1999, 124, 657–663. [Google Scholar] [CrossRef] [PubMed]
  16. Becuwe, M.; Rouge, P.; Gervais, C.; Courty, M.; Dassonville-Klimpt, A.; Sonnet, P.; Baudrin, E. A new sensitive organic/inorganic hybrid material based on titanium oxide for the potentiometric detection of iron(III). J. Colloid Interface Sci. 2012, 388, 130–136. [Google Scholar] [CrossRef] [PubMed]
  17. van den Berg, C.M.G. Chemical speciation of iron in seawater by cathodic stripping voltammetry with dihydroxynaphthalene. Anal. Chem. 2006, 78, 156–163. [Google Scholar] [CrossRef] [PubMed]
  18. Liu, X.; Li, N.; Xu, M.M.; Wang, J.; Jiang, C.; Song, G.; Wang, Y. Specific colorimetric detection of Fe3+ ions in aqueous solution by squaraine-based chemosensor. RSC Adv. 2018, 8, 34860–34866. [Google Scholar] [CrossRef] [Green Version]
  19. Adebayo, B.K.; Ayejuyo, S.; Okoro, H.K.; Ximba, B.J. Spectrophotometric determination of iron (III) in tap water using 8-hydoxyquinoline as a chromogenic reagent. Afr. J. Biotechnol. 2011, 10, 16051–16057. [Google Scholar] [CrossRef]
  20. Lashgari, N.; Badiei, A.; Mohammadi Ziarani, G. A Fluorescent Sensor for Al(III) and Colorimetric Sensor for Fe(III) and Fe(II) Based on a Novel 8-Hydroxyquinoline Derivative. J. Fluoresc. 2016, 26, 1885–1894. [Google Scholar] [CrossRef]
  21. Harathi, J.; Thenmozhi, K. AIE-active Schiff base compounds as fluorescent probes for the highly sensitive and selective detection of Fe3+ ions. Mater. Chem. Front. 2020, 4, 1471–1482. [Google Scholar] [CrossRef]
  22. Wei, D.; Sun, Y.; Yin, J.; Wei, G.; Du, Y. Design and application of Fe3+ probe for “naked-eye” colorimetric detection in fully aqueous system. Sens. Actuators B Chem. 2011, 160, 1316–1321. [Google Scholar] [CrossRef]
  23. Nizar, S.A.; Kobayashi, T.; Mohd Suah, F.B. An aminonaphthalene-based colorimetric and fluorescent sensor for selective recognition of Fe3+ in water. Luminescence 2020, 35, 1286–1295. [Google Scholar] [CrossRef]
  24. Jang, H.J.; Ahn, H.M.; Kim, M.S.; Kim, C. A highly selective colorimetric chemosensor for sequential detection of Fe3+ and pyrophosphate in aqueous solution. Tetrahedron 2017, 73, 6624–6631. [Google Scholar] [CrossRef]
  25. Wang, W.; Wei, J.; Liu, H.; Liu, Q.; Gao, Y. A novel colorimetric chemosensor based on quinoline for the sequential detection of Fe3+ and PPi in aqueous solution. Tetrahedron Lett. 2017, 58, 1025–1029. [Google Scholar] [CrossRef]
  26. Kao, M.H.; Wan, C.F.; Wu, A.T. A selective colorimetric chemosensor for Fe3+. Luminescence 2017, 32, 1561–1566. [Google Scholar] [CrossRef]
  27. Wang, L.; Li, W.; Zhi, W.; Huang, Y.; Han, J.; Wang, Y.; Ren, Y.; Ni, L. A new coumarin schiff based fluorescent-colorimetric chemosensor for dual monitoring of Zn2+ and Fe3+ in different solutions: An application to bio-imaging. Sens. Actuators B Chem. 2018, 260, 243–254. [Google Scholar] [CrossRef]
  28. Zhou, F.; Leng, T.H.; Liu, Y.J.; Wang, C.Y.; Shi, P.; Zhu, W.H. Water-soluble rhodamine-based chemosensor for Fe3+ with high sensitivity, selectivity and anti-interference capacity and its imaging application in living cells. Dye. Pigment. 2017, 142, 429–436. [Google Scholar] [CrossRef]
  29. Hao, E.; Meng, T.; Zhang, M.; Pang, W.; Zhou, Y.; Jiao, L. Solvent dependent fluorescent properties of a 1,2,3-triazole linked 8-hydroxyquinoline chemosensor: Tunable detection from zinc(II) to iron(III) in the CH3CN/H2O system. J. Phys. Chem. A 2011, 115, 8234–8241. [Google Scholar] [CrossRef]
  30. Liu, S.R.; Wu, S.P. New water-soluble highly selective fluorescent chemosensor for Fe (III) ions and its application to living cell imaging. Sens. Actuators B Chem. 2012, 171–172, 1110–1116. [Google Scholar] [CrossRef]
  31. Suryawanshi, S.B.; Mahajan, P.G.; Bodake, A.J.; Kolekar, G.B.; Patil, S.R. Carbazole based nanoprobe for selective recognition of Fe3 + ion in aqueous medium: Spectroscopic insight. Spectrochim. Acta Part A Mol. Biomol. Spectrosc. 2017, 183, 232–238. [Google Scholar] [CrossRef]
  32. Chen, Z.; Lu, D.; Zhang, G.; Yang, J.; Dong, C.; Shuang, S. Glutathione capped silver nanoclusters-based fluorescent probe for highly sensitive detection of Fe3+. Sens. Actuators B Chem. 2014, 202, 631–637. [Google Scholar] [CrossRef]
  33. Vanjare, B.D.; Mahajan, P.G.; Hong, S.K.; Lee, K.H. Discriminating Chemosensor for Detection of Fe3+ in Aqueous Media by Fluorescence Quenching Methodology. Bull. Korean Chem. Soc. 2018, 39, 631–637. [Google Scholar] [CrossRef]
  34. Dong, L.; Wu, C.; Zeng, X.; Mu, L.; Xue, S.F.; Tao, Z.; Zhang, J.X. The synthesis of a rhodamine B schiff-base chemosensor and recognition properties for Fe3+ in neutral ethanol aqueous solution. Sens. Actuators B Chem. 2010, 145, 433–437. [Google Scholar] [CrossRef]
  35. Gupta, R.S.; Dudani, A.K. Species-specific differences in the toxicity of rhodamine 123 toward cultured mammalian cells. J. Cell. Physiol. 1987, 130, 321–327. [Google Scholar] [CrossRef] [PubMed]
  36. Steinhauser, S.; Heinz, U.; Bartholomä, M.; Weyhermüller, T.; Nick, H.; Hegetschweiler, K. Complex Formation of ICL670 and Related Ligands with Fe III and Fe II. Eur. J. Inorg. Chem. 2004, 2004, 4177–4192. [Google Scholar] [CrossRef]
  37. Rouge, P.; Dassonville-Klimpt, A.; Cézard, C.; Boudesocque, S.; Ourouda, R.; Amant, C.; Gaboriau, F.; Forfar, I.; Guillon, J.; Guillon, E.; et al. Synthesis, physicochemical studies, molecular dynamics simulations, and metal-ion-dependent antiproliferative and antiangiogenic properties of cone ICL670-substituted calix[4]arenes. Chempluschem 2012, 77, 1001–1016. [Google Scholar] [CrossRef]
  38. Jo, T.G.; Jung, J.M.; Han, J.; Lim, M.H.; Kim, C. A single fluorescent chemosensor for multiple targets of Cu2+, Fe2+/3+ and Al3+ in living cells and a near-perfect aqueous solution. RSC Adv. 2017, 7, 28723–28732. [Google Scholar] [CrossRef] [Green Version]
  39. Shi, B.B.; Zhang, P.; Wei, T.B.; Yao, H.; Lin, Q.; Zhang, Y.M. Highly selective fluorescent sensing for CN− in water: Utilization of the supramolecular self-assembly. Chem. Commun. 2013, 49, 7812–7814. [Google Scholar] [CrossRef]
  40. Simpson, P.V.; Schmidt, C.; Ott, I.; Bruhn, H.; Schatzschneider, U. Synthesis, Cellular Uptake and Biological Activity Against Pathogenic Microorganisms and Cancer Cells of Rhodium and Iridium N-Heterocyclic Carbene Complexes Bearing Charged Substituents. Eur. J. Inorg. Chem. 2013, 2013, 5547–5554. [Google Scholar] [CrossRef]
  41. Peng, Y.; Shi, Y.; Zhang, H.; Mine, Y.; Tsao, R. Anti-inflammatory and anti-oxidative activities of daidzein and its sulfonic acid ester derivatives. J. Funct. Foods 2017, 35, 635–640. [Google Scholar] [CrossRef]
  42. Thordarson, P. Determining association constants from titration experiments in supramolecular chemistry. Chem. Soc. Rev. 2011, 40, 1305–1323. [Google Scholar] [CrossRef]
  43. Sedgwick, A.C.; Yan, K.-C.; Mangel, D.N.; Shang, Y.; Steinbrueck, A.; Han, H.-H.; Brewster, J.T.; Hu, X.-L.; Snelson, D.W.; Lynch, V.M.; et al. Deferasirox (ExJade): An FDA-Approved AIEgen Platform with Unique Photophysical Properties. J. Am. Chem. Soc. 2021, 143, 1278–1283. [Google Scholar] [CrossRef]
  44. Neurath, H.; Greenstein, J.P.; Putnam, F.W.; Erickson, J.O. The chemistry of protein denaturation. Chem. Rev. 1944, 34, 157–265. [Google Scholar] [CrossRef]
  45. Lee, J.Y.; Hirose, M. Partially folded state of the disulfide-reduced form of human serum albumin as an intermediate for reversible denaturation. J. Biol. Chem. 1992, 267, 14753–14758. [Google Scholar] [CrossRef]
  46. Han, H.H.; Sedgwick, A.C.; Shang, Y.; Li, N.; Liu, T.; Li, B.H.; Yu, K.; Zang, Y.; Brewster, J.T.; Odyniec, M.L.; et al. Protein encapsulation: A new approach for improving the capability of small-molecule fluorogenic probes. Chem. Sci. 2020, 11, 1107–1113. [Google Scholar] [CrossRef] [Green Version]
  47. Edwardson, T.G.W.; Tetter, S.; Hilvert, D. Two-tier supramolecular encapsulation of small molecules in a protein cage. Nat. Commun. 2020, 11, 5410. [Google Scholar] [CrossRef] [PubMed]
  48. Jia, Z.; Han, H.-H.; Sedgwick, A.C.; Williams, G.T.; Gwynne, L.; Brewster, J.T.; Bull, S.D.; Jenkins, A.T.A.; He, X.-P.; Schönherr, H.; et al. Protein Encapsulation: A Nanocarrier Approach to the Fluorescence Imaging of an Enzyme-Based Biomarker. Front. Chem. 2020, 8, 389. [Google Scholar] [CrossRef] [PubMed]
  49. Sen, S.; Perrin, M.W.; Sedgwick, A.C.; Dunsky, E.Y.; Lynch, V.M.; He, X.P.; Sessler, J.L.; Arambula, J.F. Toward multifunctional anticancer therapeutics: Post-synthetic carbonate functionalisation of asymmetric Au(i) bis-N-heterocyclic carbenes. Chem. Commun. 2020, 56, 7877–7880. [Google Scholar] [CrossRef] [PubMed]
  50. Nusrat, S.; Siddiqi, M.K.; Zaman, M.; Zaidi, N.; Ajmal, M.R.; Alam, P.; Qadeer, A.; Abdelhameed, A.S.; Khan, R.H. A comprehensive spectroscopic and computational investigation to probe the interaction of antineoplastic drug nordihydroguaiaretic acid with serum albumins. PLoS ONE 2016, 11, e0158833. [Google Scholar] [CrossRef]
  51. Lakowicz, J.R. Principles of fluorescence spectroscopy Chapter 4: Time-Domain Lifetime Measurements. In Principles of Fluorescence Spectroscopy; Springer: Boston, MA, USA, 2006; pp. 97–156. ISBN 0387312781. [Google Scholar]
  52. Calvert, J.G.; Pitts, J.N. Photochemistry; John Wiley & Sons, Inc.: Hoboken, NJ, USA, 1966; pp. 626–627. ISBN 0471130907. [Google Scholar]
  53. Loza-Rosas, S.A.; Vázquez-Salgado, A.M.; Rivero, K.I.; Negrón, L.J.; Delgado, Y.; Benjamín-Rivera, J.A.; Vázquez-Maldonado, A.L.; Parks, T.B.; Munet-Colón, C.; Tinoco, A.D. Expanding the Therapeutic Potential of the Iron Chelator Deferasirox in the Development of Aqueous Stable Ti(IV) Anticancer Complexes. Inorg. Chem. 2017, 56, 7788–7802. [Google Scholar] [CrossRef] [PubMed]
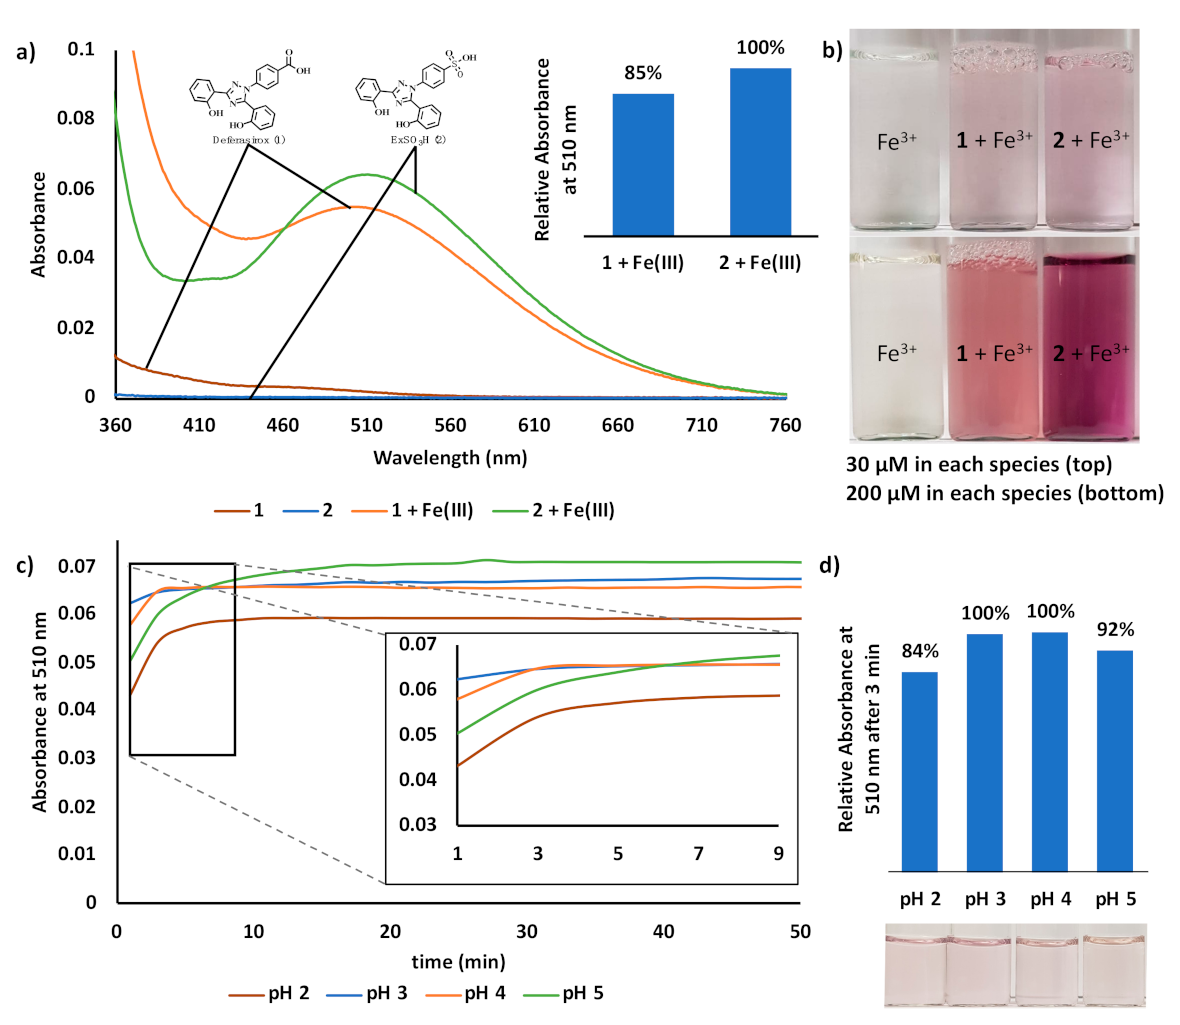
Figure 1. (a) Absorbance spectra of 1 and 2 (both at 30 µM) in the absence and presence of one molar equivalent of Fe3+ in acetate buffer at pH = 3. (b) Photos of FeCl3 in the absence and presence of 1 or 2 at 30 µM and 200 µM at pH = 3, respectively. (c) Time profile of the absorbance at 510 nm for 30 µM 2 and 30 µM Fe3+ (as FeCl3) in aqueous acetate buffer solutions at the indicated pH. (d) Relative absorbance at 510 nm after incubating for 3 min in an acetate buffer at the indicated pH (top) and pictures of the corresponding solutions (bottom).
Chemosensors 09 00068 g001
Figure 2. (a) Absorbance profiles of varying ratios of 2 and Fe3+ (as FeCl3) indicated as mol% 2: Fe3+ in 0.1 M aqueous acetate buffer at pH = 3 with the sum of both species = 50 µM at each datum point. (b) Corresponding Job’s plot of the absorbance at 510 nm of 2 and Fe3+. A maximum in the absorbance intensity is seen at a mole fraction = 0.5, a finding consistent with a 1:1 binding ratio.
Chemosensors 09 00068 g002
Figure 3. Titration of 1 and 2 with Fe3+ in 0.1 M acetate buffer at pH 3. The chelator concentration was held constant at 30 µM. The inset gives the association constants (Ka) corresponding to the formation of the 1:1 complexes, along with the limits of detection (LODs) determined using the following equation: LOD (x) = 3 × SDb × mx−1 where SDb = standard deviation of the blank and mx = the slope of the titration curve.
Chemosensors 09 00068 g003
Figure 4. (a) Absorbance spectra of 30 µM 2 recorded in the presence of 50 µM of various test di- and trivalent metal cations in water at pH 3. (b) Relative absorbance at 510 nm for each metal cation solution and photos of the corresponding samples.
Chemosensors 09 00068 g004
Figure 5. Evaluation of 2 in samples of (a) tap water (S1) and (b) stream water (S2). Samples are shown prior to and after acidification to pH 3. The spectra are shown to the left and the relative absorbance at 510 nm for each sample is shown in the bar charts to the right. The control samples were made up at pH 3 in an acetate buffer.
Chemosensors 09 00068 g005
Figure 6. (a) Excitation and emission spectrum for solutions 10 µM in 2, 20 µM in human serum albumin (HSA), and their combination, respectively, in deionized water. (b) Job plot of 2 and HSA with the sum of both species = 30 µM in deionized water. (c) Addition of human serum albumin (HSA) to a 10 µM solution of 2 in deionized water. (d) Fluorescence intensity at 500 nm plotted against [HSA]. In the photo, the fluorescent emission of 25 µM HSA, 25 µM 2 and both combined is shown under excitation at 350 nm using a hand-held UV lamp. Emission spectra were collected with excitation at 330 nm and excitation spectra were collected for the emission at 500 nm. All experiments were conducted using excitation and emission slit widths of 5 nm, respectively. The quantum yield of 2 after complexation with two equivalents HSA was calculated to be 0.0272 (reference: quinine sulfate, 0.1 M H2SO4), which is in agreement with other deferasirox derivatives that we have reported previously [43].
Chemosensors 09 00068 g006
Figure 7. (a) Stern–Volmer plot for the addition of 2 into 5 µM HSA in deionized water. F0, Fx = fluorescence intensity at 360 nm (emission of HSA) in the absence (F0) and presence (Fx) of quencher 2. (b) Double logarithm plot. (c,d) Displacement studies involving plots of the fluorescence emission intensity of 10 µM aqueous solutions of 2 containing 20 µM HSA recorded upon addition of phenylbutazone (PB) and ibuprofen (Ibu), respectively. Experiments were conducted with excitation at 290 nm for (a,b) and excitation at 330 nm for (c,d); excitation and emission slit widths were 5 nm, respectively, in all experiments.
Chemosensors 09 00068 g007
Figure 8. (a) Fluorescence quenching seen upon the addition of Fe3+ to aqueous solutions of 10 µM 2 containing 20 µM HSA. (b) Fluorescence intensity at 500 nm plotted against [Fe(III)]. All experiments were conducted with excitation at 330 nm and with excitation and emission slit widths of 5 nm, respectively. The inset gives the association constants (Ka) corresponding to the formation of the 1:1 complex, along with the limit of detection (LOD) determined using the following equation: LOD (x) = 3 × SDF0×|mx−1| where SDF0 = standard deviation of 10 µM 2 mixed with 20 µM HSA and mx = the slope of the titration curve.
Chemosensors 09 00068 g008
Figure 9. (a) Fluorescence emission profiles of 10 µM 2 and 20 µM HSA in the presence of 20 µM of various test di- and trivalent metal cations in deionized water. (b) Relative fluorescence intensity at 500 nm for each metal cation solution.
Chemosensors 09 00068 g009
Figure 10. Cytotoxicity studies of 1 and 2 conducted in A549 cells grown in RPMI 1640 media at pH 7.2. Experiments were performed in triplicate with error bars indicating the standard deviation at each datum point. Cells were treated with different concentrations of 1, 2 and 2 pre-combined with human serum albumin (HSA), respectively, and viability was determined after an exposure time of 72 h via MTT assay.
Chemosensors 09 00068 g010
Table 1. Comparison of 2 with other reported Fe3+ chemosensors.
Chemical Structure
and Core-Scaffold
Sensing MethodAssociation
Constant (Ka)
LOD
for Fe3+
Solvent System 1Ref.
Chemosensors 09 00068 i001
based on deferasirox
Colorimetry and Fluorescence2.4 × 107 M−10.24 µM100% H2OThis work
Chemosensors 09 00068 i002
based on squaraine
Colorimetry9.6 × 105 M−11 µM80% H2O
20% AcOH
[18]
Chemosensors 09 00068 i003
based on coumarine
Colorimetry and
Fluorescence
9.4 × 10³ M−15.38 µM80% EtOH
20% H2O
[27]
Chemosensors 09 00068 i004
based on rhodamine
Colorimetry and
Fluorescence
4.7 × 10⁸ M−10.28 µM50% H2O
50% DMSO
[28]
Chemosensors 09 00068 i005
based on julolidine
Colorimetry9.9 × 104 M−10.51 µM100% H2O[24]
Chemosensors 09 00068 i006
based on 8-hydroxyquinoline
Fluorescencenot reported1.23 µM95% MeCN
5% H2O
[29]
1 Solvent abbreviations: AcOH = acetic acid, EtOH = ethanol, H2O = water, DMSO = dimethyl sulfoxide, MeCN = acetonitrile.
Publisher’s Note: MDPI stays neutral with regard to jurisdictional claims in published maps and institutional affiliations.