Article

Synthesis, Characterization and Gas Sensing Study of ZnO-SnO2 Nanocomposite Thin Films

by
Victor V. Petrov
1,*,
Victor V. Sysoev
2,*,
Aleksandra P. Starnikova
1,
Maria G. Volkova
3,
Zamir Kh. Kalazhokov
4,
Viktoriya Yu. Storozhenko
3,
Soslan A. Khubezhov
5,6 and
Ekaterina M. Bayan
3
1
Institute of Nanotechnologies, Electronics, and Equipment Engineering, Southern Federal University, 347928 Taganrog, Russia
2
Department of Physics, Yuri Gagarin State Technical University of Saratov, 410054 Saratov, Russia
3
Department of Chemistry, Southern Federal University, 344090 Rostov-on-Don, Russia
4
Institute of Physics and Mathematics, Kabardino-Balkarian State University, n.a. Kh.M. Berbekov, 360004 Nalchik, Russia
5
Department of Physics, North-Ossetian State University, 362025 Vladikavkaz, Russia
6
Department of Physics and Engineering, ITMO University, 191002 Petersburg, Russia
*
Authors to whom correspondence should be addressed.
Chemosensors 2021, 9(6), 124; https://doi.org/10.3390/chemosensors9060124
Submission received: 29 April 2021 / Revised: 27 May 2021 / Accepted: 27 May 2021 / Published: 30 May 2021
(This article belongs to the Collection Sustainable Metal Oxide Materials for Sensing Applications)

Abstract

:
Thin nanocomposite films composed of ZnO and SnO2 at 0.5–5 mol.% concentrations were synthesized by a new solid-phase low-temperature pyrolysis under the developed protocols. This hetero-oxide material was thoroughly studied by X-ray diffraction analysis (XRD), scanning electron microscopy (SEM), X-ray photoelectron spectroscopy (XPS) and Auger electron spectroscopy (AES) techniques to be compared with electrical and gas-sensing properties. We have found that the films have a poly-nanocrystal structure of ZnO and SnO2 crystals with characteristic grain sizes at 10–15 nm range. When comparing the chemiresistive response of the films with varied tin dioxide content, the sample of Sn:Zn optimum ratio taken as 1:99 yields 1.5-fold improvement upon to 5–50 ppm NO2 exposure at 200 °C. We argue that these remarkable changes have matured from both a reducing the intergrain potential barrier down to 0.58 eV and increasing the concentration of anionic vacancies at this rational composite. The results demonstrate that solid-phase low-temperature pyrolysis is a powerful technique for adjusting the functional gas-sensing properties of hetero-oxide film via modifying the ratio of the oxide components.

Graphical Abstract

1. Introduction

The current societal requirements to provide technologies which are compatible with the digital delivery of information about the surroundings, for instance within Internet-of-Things paradigm, force the further development of various functional electronic units such as gas sensors [1,2,3], solar- and photocells [4,5], photocatalysts [6], etc. which are primarily based on semiconductors. In relation to gas sensors, the synthesis and study of the properties of oxide materials that are composed of various elements present a high degree of interest in advancing the sensor’s performance. The most commonly used materials in low-cost commercial sensors are zinc oxide [7], tin dioxide [8], indium oxide [9], and titanium dioxide [10] which are characterized by good chemical stability, non-toxicity, and a high chemiresistive response to many gases, making them interesting to society and industry. Among these oxides, the zinc one, which was pioneered in the 1960s [11] as a gas sensor, is possibly the most studied one. ZnO is an important semiconductor with a wide band gap of about 3.37 eV at room temperature [5], with n-type conductivity that allows one to add impurities or heterojunctions which tune its gas-sensitive properties [12].
Recently, a high degree of attention has been paid to nanocomposite materials based on a mixture of ZnO and SnO2 oxides with different ratios of zinc and tin atoms due to their excellent gas-sensitive properties. Nanocomposite materials are obtained mainly by hydrothermal synthesis [13,14], chemical technologies [15,16], electrospinning [13,17], the atomic layer deposition method [14], magnetron evaporation [18], spray pyrolysis [19,20,21], etc. The existence of a two-phase structure based on a ZnO and SnO2 oxides is due to low annealing temperatures (<700 °C). This is theoretically proved in [22]. A temperature treatment is used to correct the functional properties of oxides [20,23]. Thus, studying the optical properties of the ZnO-SnO2 composite films synthesized by magnetron sputtering showed that the band gap was in the range of 3.31–3.34 eV depending on the technology protocols [18]. The tin ions’ concentration is very critical as a modifying additive for the composite materials’ properties. For example, it was shown in the synthesis of SnO2-ZnO films by spray pyrolysis that the maximum concentration of Sn ions for obtaining films without reducing the crystal properties is about 8% [19]. When the tin content in the film samples reaches 10%, the properties of the composites may deteriorate. An increase in the concentration of Sn ions up to 6% leads to a narrowing of the band gap to 2.8 eV [20]. The advancing of sensor properties in nanocomposite materials is associated both with a change in the content of surface oxygen forms and the synergistic effect of the n–n heterojunctions’ formation, which leads to the emergence of potential barriers [13,15,16,17]. For instance, films based on a mixture of ZnO and SnO2 oxides, with a concentration of Sn4+ of 4%, prepared by spray pyrolysis have exhibited better sensitivity to H2S at fairly low concentrations of 20 ppm [21]. However, the most significant effect of adding Sn4+ small concentrations to zinc oxide was that it was shown to improve gas sensitivity to NO2 [15,16,17] and ethanol [13,16,24]. Therefore, for materials based on a mixture of ZnO and SnO2 oxides with the Sn:Zn = 5:95, obtained by chemical technologies, the gas response at an operating temperature of 150 °C was 48 upon exposing to 1 ppm of NO2 [16]. Gas sensors based on the material with the Sn:Zn = 5:95 ratio showed a gas response equal to 14.3 versus 0.5 ppm of NO2 at an operating temperature of 90 °C [15].
This rather short survey of the literature indicates that the variation of Sn content in ZnO-SnO2 films is quite imperative to tune their gas-sensing properties, and appropriate technology protocols are required with this purpose. We may note that a sol–gel approach requires a long time to prepare the films, and techniques such as hydrothermal synthesis or sputtering need expensive equipment, which reduces their application in mass-scale production. We guess that the simplest and most economically feasible method for synthesizing ZnO-based film is spray pyrolysis [25] or solid-phase pyrolysis [26]. Therefore, we tried to explore this approach here to systematically study the effect of small SnO2 additives in ZnO films synthesized by a new solid-phase low-temperature pyrolysis technique under new protocols on the physico-chemical, electro-physical and gas-sensitive properties of these films.

2. Materials and Methods

2.1. Materials

Crystal hydrates of zinc acetate, Zn(CH3COO)2·2H2O, and tin tetrachloride salts, SnCl4·5H2O, organic acid, acetone, and 1,4-dioxane as an organic solvent were used as precursors for the synthesis of thin ZnO-SnO2 films. All the chemicals were of analytical grade or of the highest purity available (ECROS, St. Petersburg, Russia). The film materials were obtained on glass, oxidized Si, and Al2O3 ceramic substrates.

2.2. Preparation of Materials

Organic salts of tin and zinc were obtained from the melt. The intermediate organic products were dissolved in dioxane to target the Sn:Zn ratios to be 0:100 (pure ZnO), 0.5:99.5, 1:99, 5:95. The resulting solutions were applied three times onto the substrates with intermediate drying of each layer in air at two steps, under room temperature and then at 100 °C in a drying cabinet to remove the liquid phase. Further temperature treatment was carried out in a muffle furnace for 2 h at 550 °C; the heating rate was 10 °C /min. The backward cooling of the film-coated substrate to room temperature was carried out by cooling of the muffle furnace. The given synthesis conditions were applied accounting for previous studies [27,28]. For the first time, films of pure zinc oxide were obtained using this technology, which was primarily suggested earlier [27]. The conditions of application to the substrates, the time and annealing temperature, the rate of heating and cooling of the muffle furnace were determined in our previous studies [27,28].

2.3. Characterization of Physical Properties

The crystal structure of the synthesized materials was examined by X-ray diffraction analysis (XRD, ARL X’TRA diffractometer, CuKα1-radiation), operated at 35 kV and 30 mA. The mean crystallite size (D) was evaluated according to broadening of the diffraction peak at the highest intensity using the Scherrer equation D = kλ/βcosΘ, where k is the shape factor (k = 0.9), λ is the X-ray wavelength (λ = 0.1540562 nm), β is the full width at the half maximum of the diffraction line and Θ is the diffraction angle. The values of β and Θ have been taken for (010), (002), (011) lattice planes related to the ZnO wurtzite phase.
The surface morphology was characterized by scanning electron microscopy (SEM, scanning electron microscope Nova Nanolab 600) at 10 keV. Image J and Digimizer software were used to measure the particles’ diameters. More than 150 particles were used to plot the particle size distribution histograms.
Surface composition and chemical state of the synthesis materials were analyzed by X-ray photoelectron spectroscopy (XPS, K–Alpha Thermo Scientific spectrometer) and Auger electron spectroscopy (AES) [29,30,31,32,33,34]. The analysis was carried out in ultra-high vacuum conditions, of 1.8∙10−9 mbar, using monochromatic X-rays source of Al with 1486.6 eV. The binding energies (BE) of the reference samples, Au, Ag and Cu, were obtained at values: Au 4f = 84 eV, Ag 3d = 368.2 eV and Cu 2p = 932.6 eV. We employed a flood gun to suppress surface charging. The value of BE recorded for adventitious carbon was C 1s = 284.8 eV. The survey spectra were collected in the mode of constant pass energy of −200 eV with a spectrum resolution of 1 eV. The signal intensity values were averaged statistically over ten measurements. To clarify the chemical state of the elements under study, the high-resolution spectra were collected using X-ray beam at spots of 400 μm diameter with the 20 eV pass energy at a spectrum resolution of 0.1 eV, number of scans was equal to 20. The component analysis was performed via fitting curves with the help of joint Shirley and Tugard functions to distinguish the peaks; the line shape of the plotted curves was obtained at 30% ratio of Lorenz/Gauss mixture.
The optical properties of ZnO-SnO2 film were studied to be applied on the glass substrates by means of measuring the optical absorption spectra (Varian Cary-100 spectrophotometer) in the wavelength range of 300–1100 nm. The band gap energy was found according to analysis of absorption edge using the equation
α2 = A(hν − Eg)
where հ is Planck’s constant; A is a constant and Eg is the optical band gap [35].

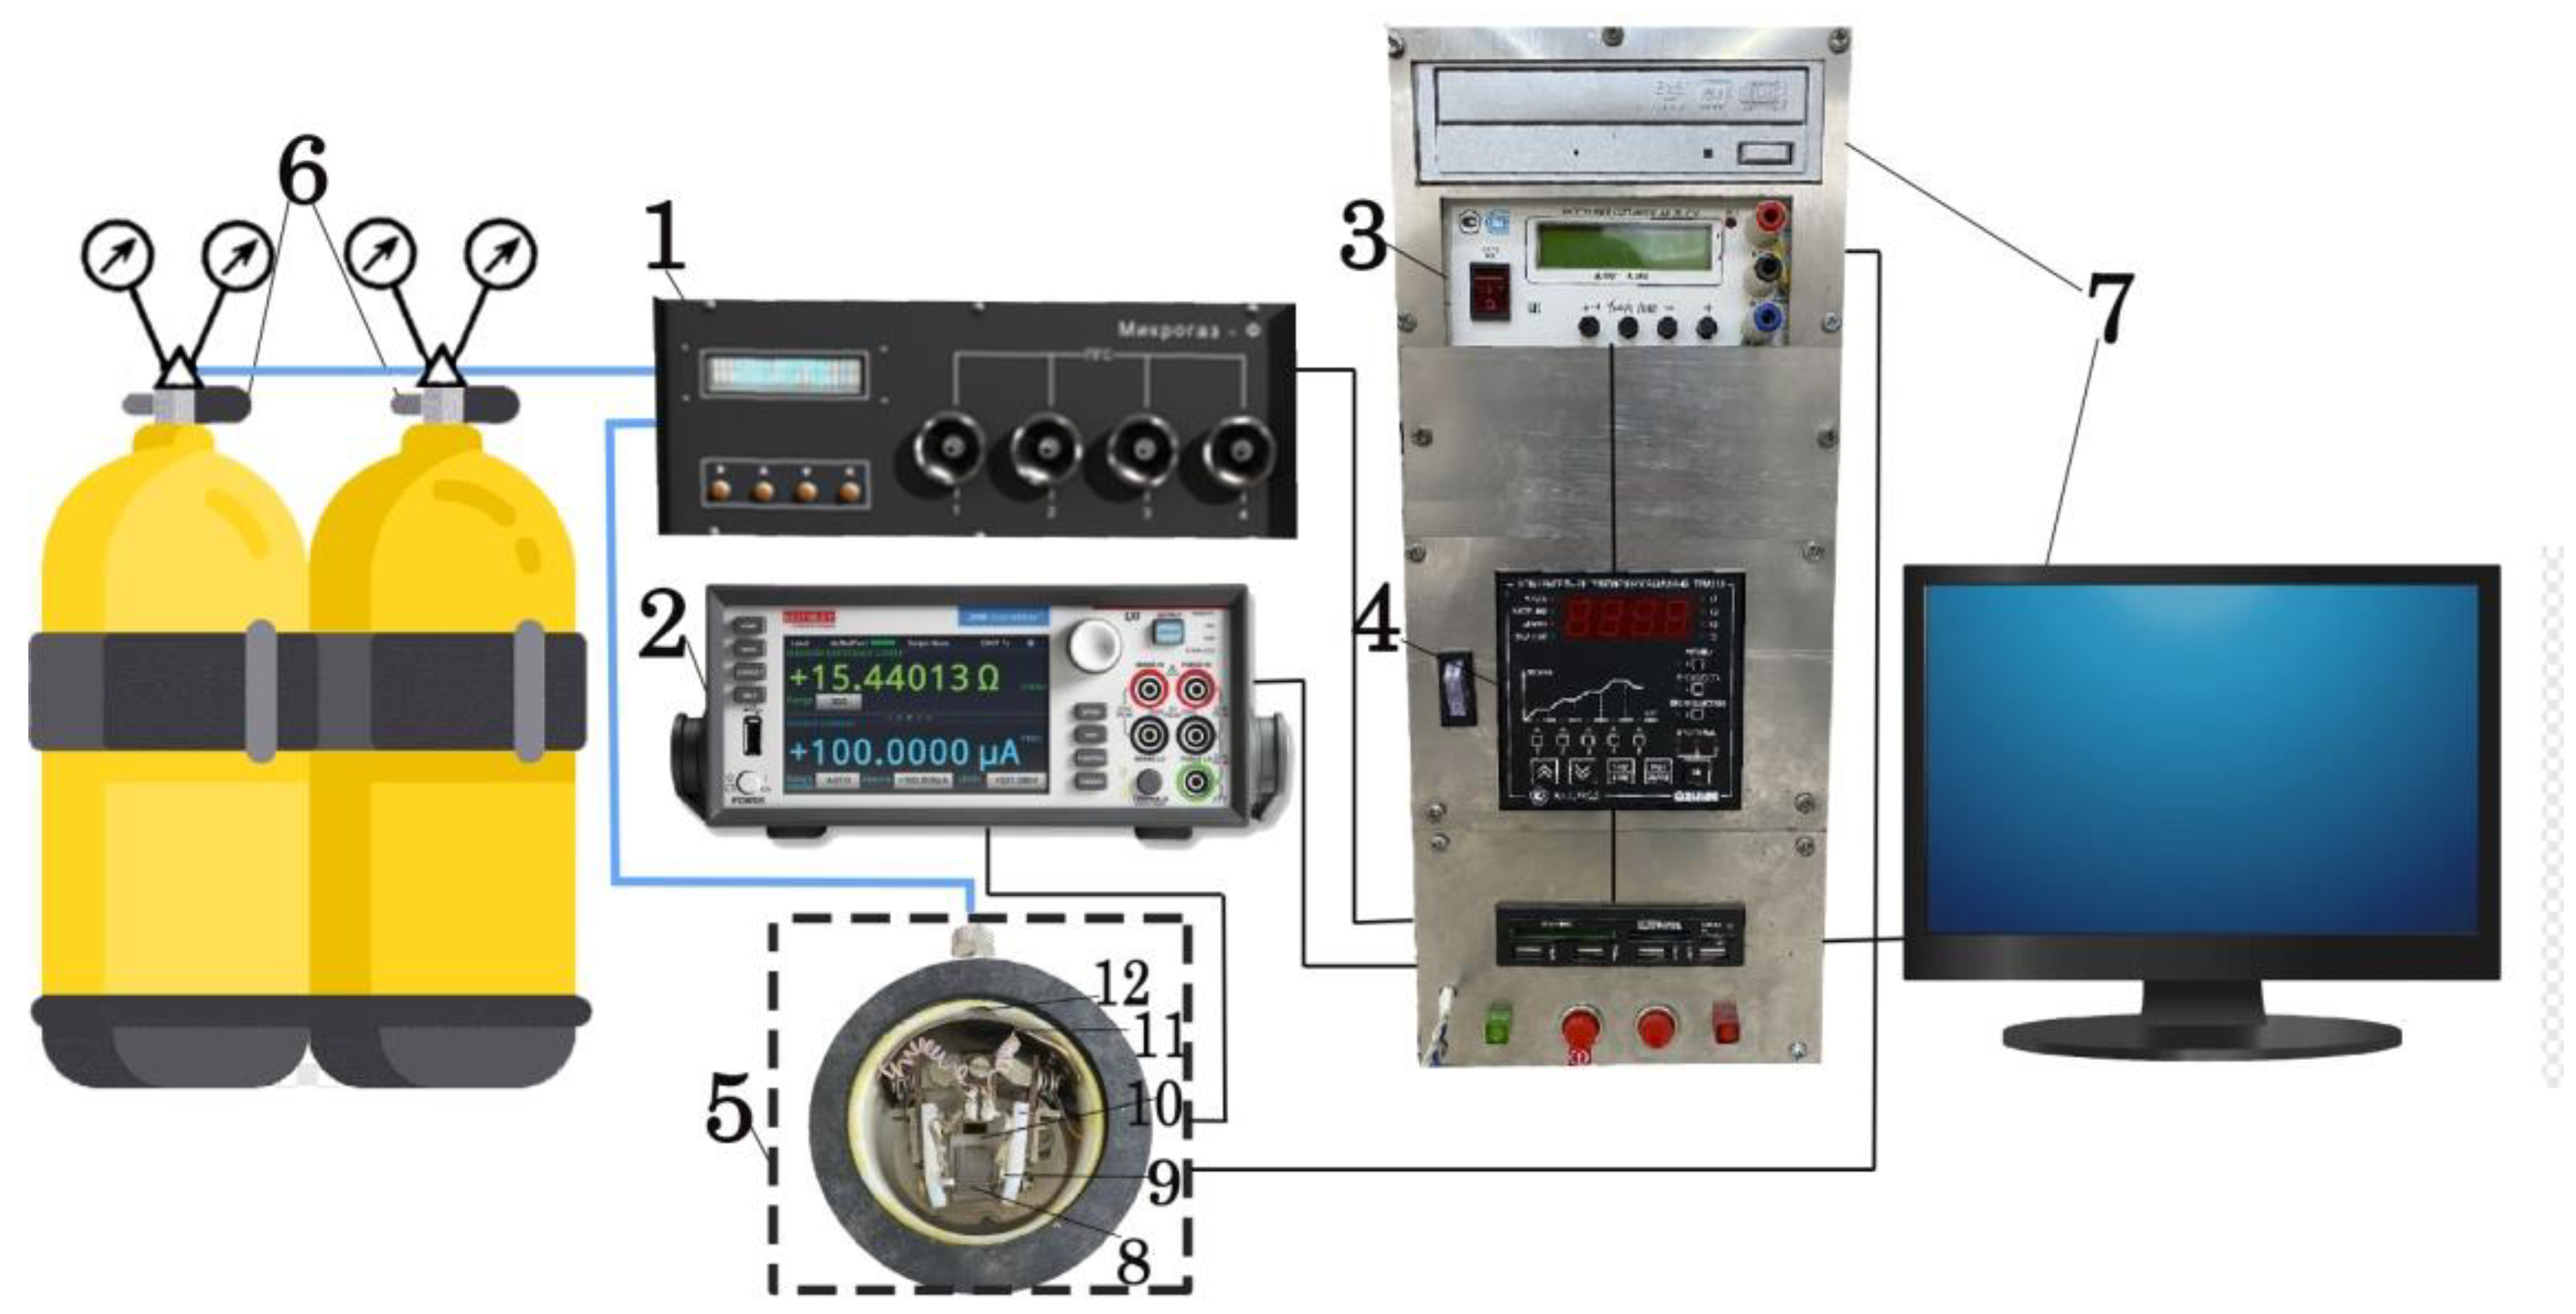
2.4. Electrophysical and Gas Sensing Measurements

ZnO-SnO2 was deposited as thin films using pyrolysis on glass substrates. To study the electrophysical and gas-sensitive properties, V-Ni metal contacts with a thickness of 0.15–0.2 μm were formed on top of ZnO-SnO2 by a vacuum thermal deposition, the distance between the contacts was 200 μm. It was measured using an automated installation for determining the parameters of gas sensors as depicted in Figure 1. The measuring chamber (5) of the automated test bench provides an electromagnetic shielding of the measuring unit and allows one to measure such parameters as the resistance of sensors and the conductivity of gas-sensitive materials in the range of 10−2–1011 Ohm·cm with high accuracy. The resistance values of the film samples were measured using the Keithly 2450 source-meter (2) and displayed both on the screen of the source-meter and on the PC (7) to be stored in PC memory. The sample (8) was placed on the heater (10) in the sealed measuring chamber (5) to be heated using a power supply unit (3) controlled by a TRM251 configurator (4) with accuracy of ±0.5 °C. The sample was pressed by a system of freely moving probes in three directions (9). During measurements (5), the chamber was closed with a cover (not shown in Figure 1) equipped with output for the gas exhaust. To measure the gas-sensitive properties of the ZTO films, the test gas supply was regulated and controlled (6) using a computer-controlled gas mixture generator (Microgaz F, Moscow, Russia) (1). The gas was pumped into the measuring chamber via the entry input (12) and evenly distributed over its volume using an average (11). All the equipment—the gas mixture generator (1), the configurator (3), the source-meter (2)—was managed by home-made software with PC (7).
With the test bench, we measured the dependence of the film electrical conductivity on temperature. To study the values of potential barriers at the intergrain interfaces in the ZnO-SnO2 film, the method of temperature-stimulated conductivity measurements was used [36,37], which makes it possible to find out the “effective” value of the energy barrier (Vb). In this method, the conductivity is measured as a function of time following a step change of the temperature with further analysis by the model described earlier [36].
The gas-sensitive properties of the ZnO-SnO2 films were measured upon exposure to NO2 at 5–50 ppm concentrations in a mixture with a synthetic air (N2/O2 mixture) at operating temperatures of 100–250 °C. The accurate mixing of air and the analyte was carried out employing a gas mixture generator. The analyte probe was measured in a flow mode at the flow rate of 300 sccm. The chemiresistive response of the ZnO-SnO2-based sensor prototype was estimated as
S = Rg/R0,
where R0 is the sensor resistance in pure air before NO2 treatment, Rg is the sensor resistance upon exposing to the analyte, when the response becomes maximum.

3. Results and Discussion

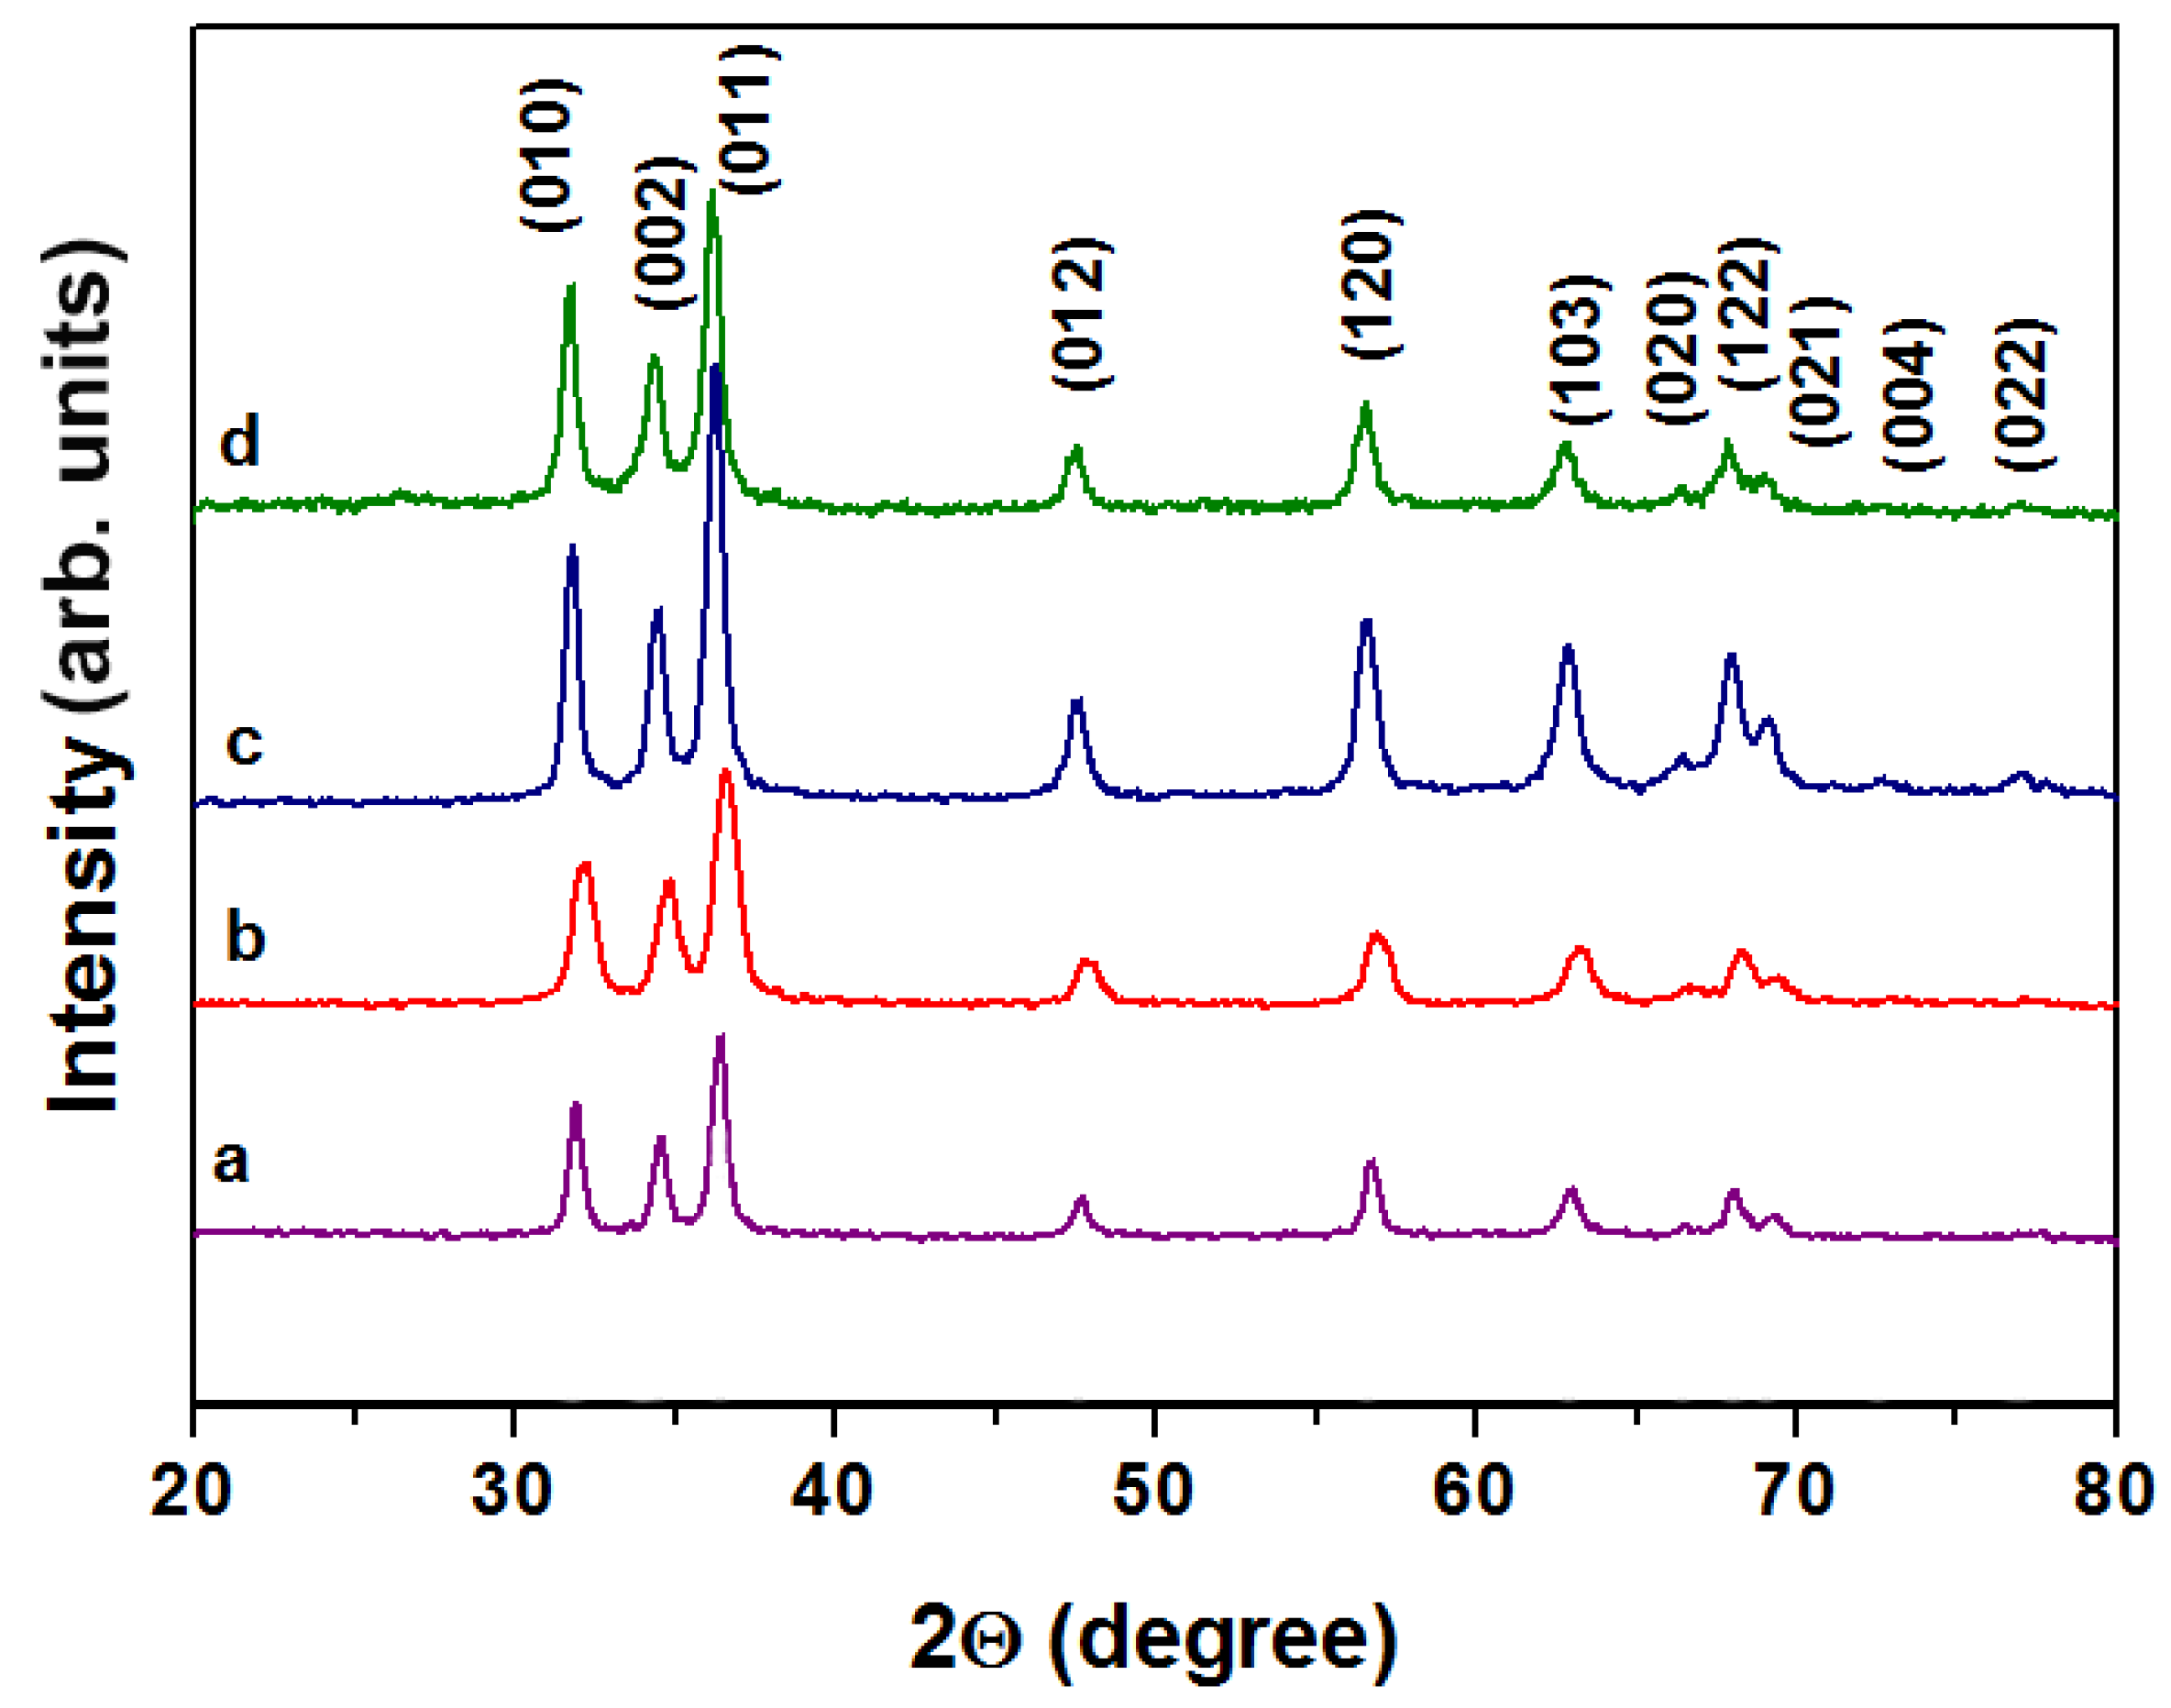
3.1. Structural, Morphological and Compositional Characteristics
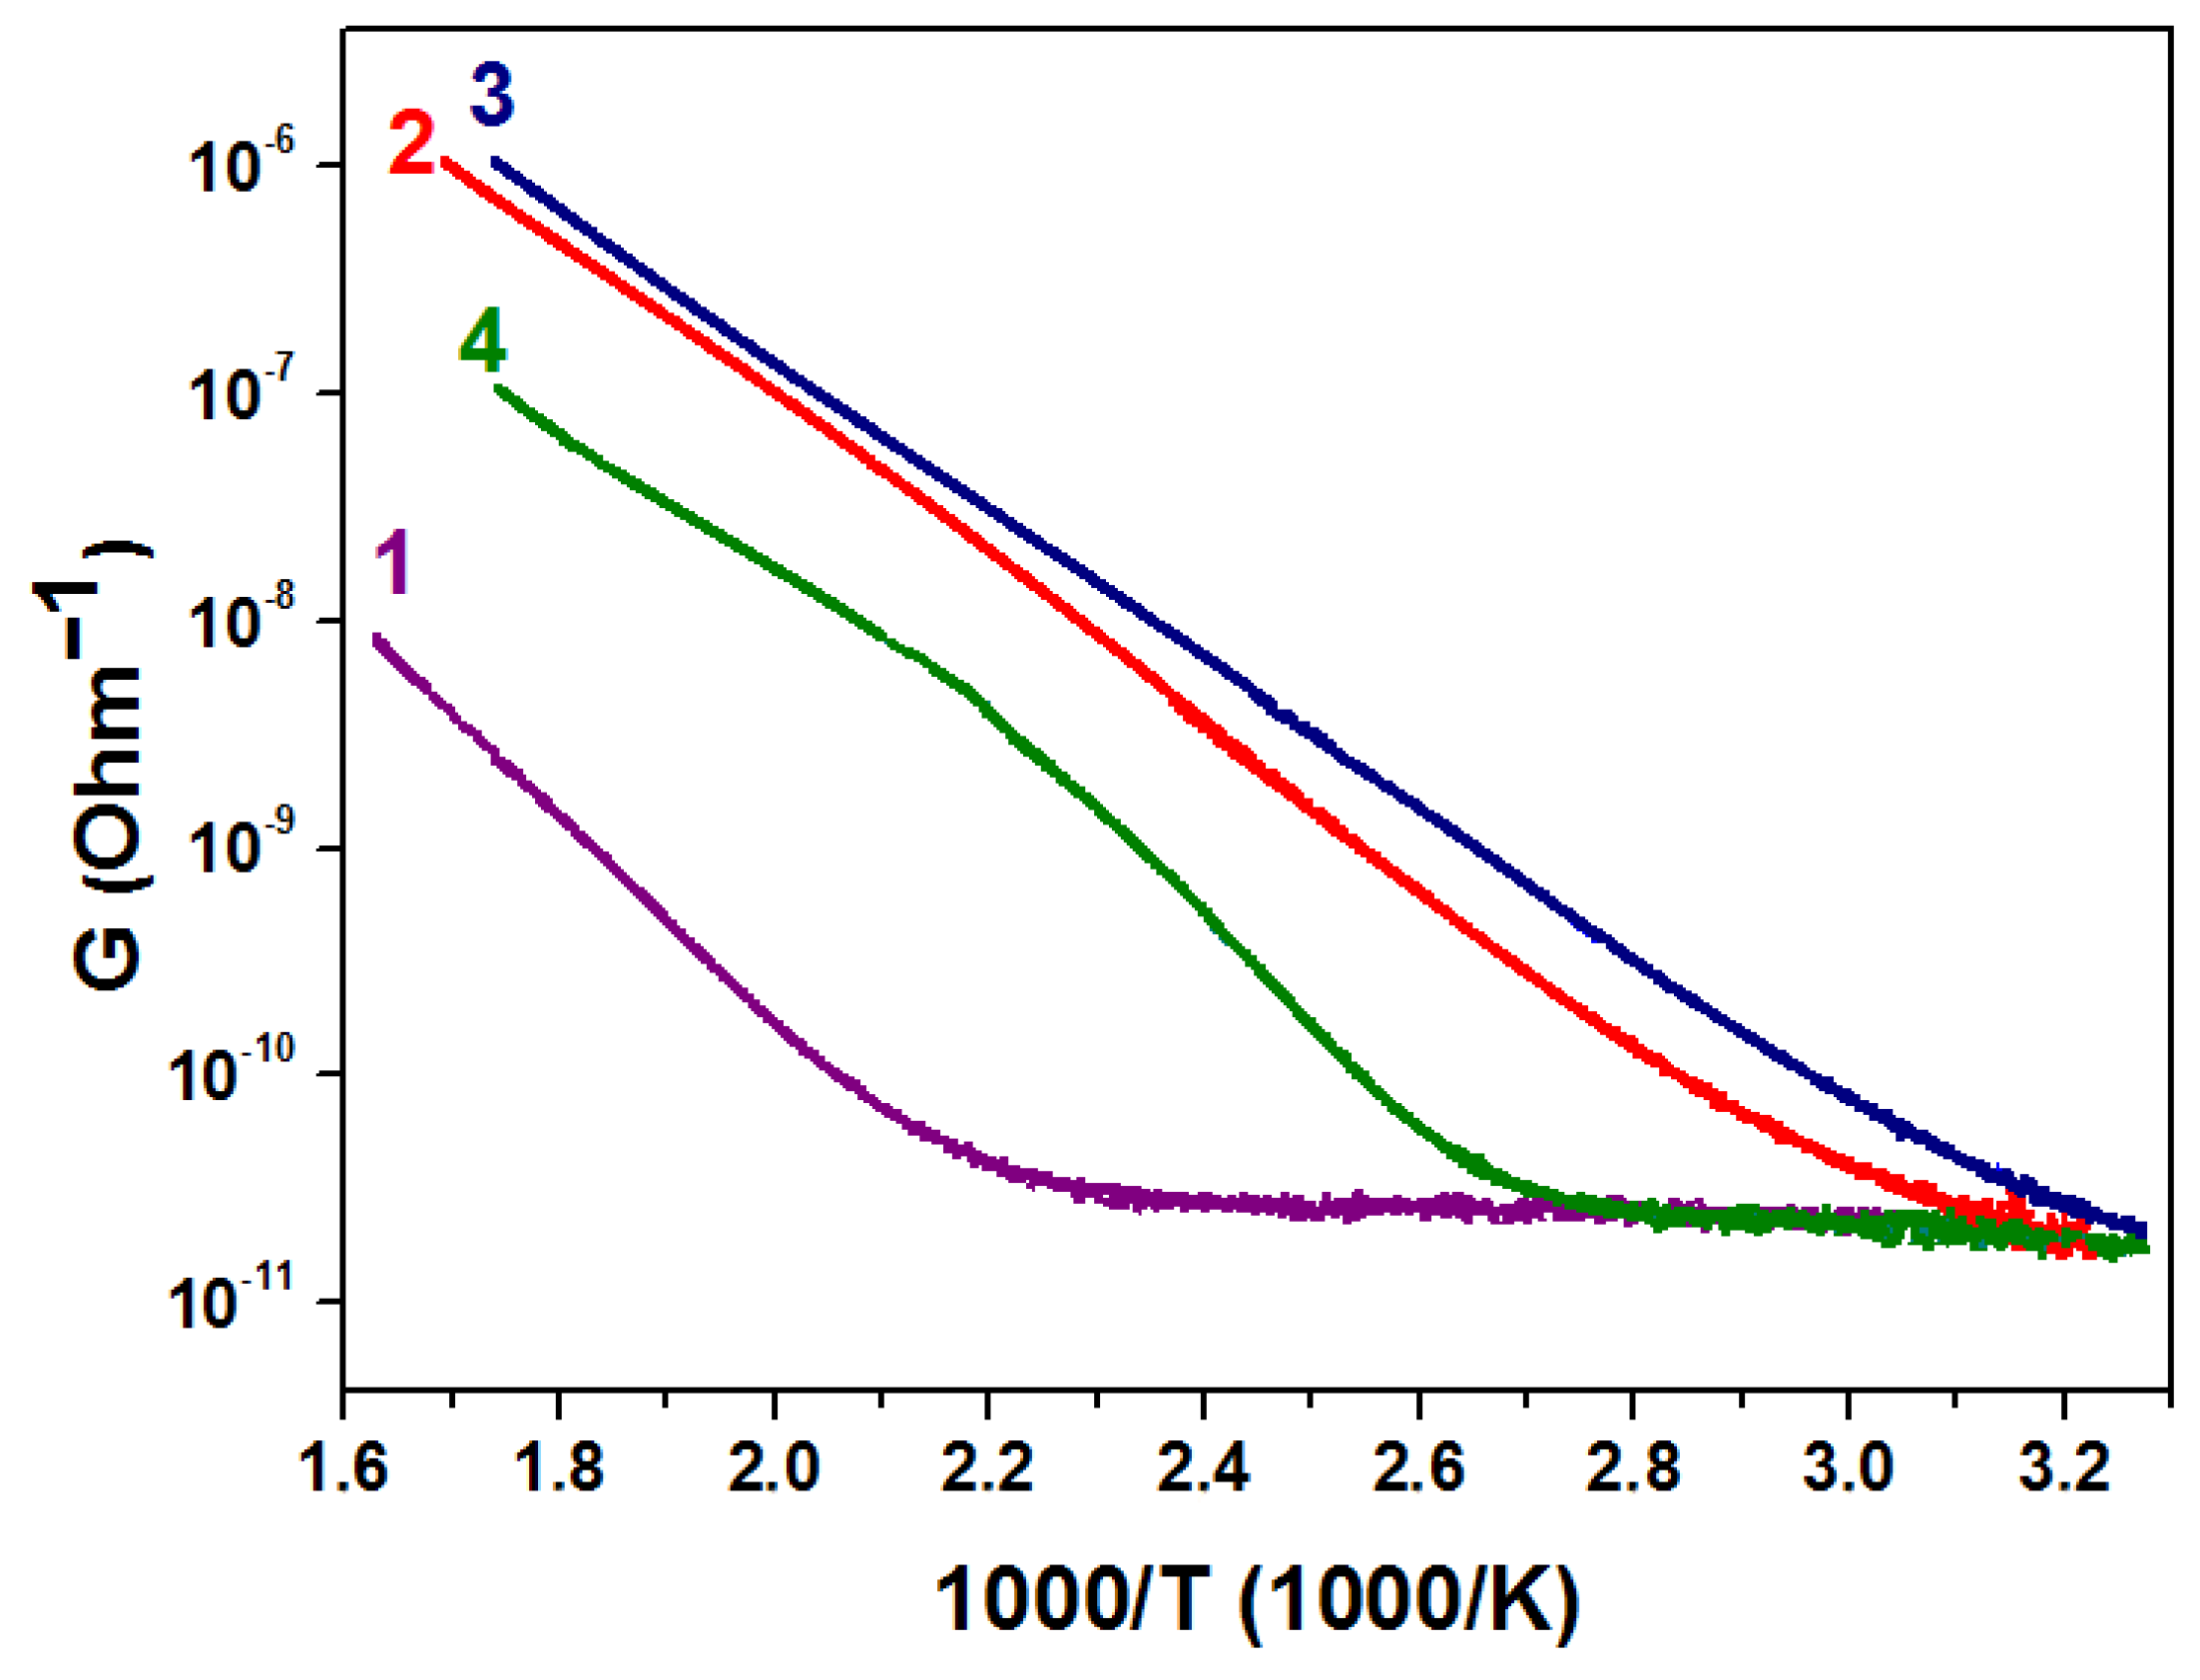
Figure 2 shows the XRD patterns of ZnO-SnO2 nanocomposite thin films synthesized by solid-phase low-temperature pyrolysis. All diffraction peaks belong to the wurtzite structure of ZnO [38]. No peaks corresponding to SnO2 were found, which may be due to both the small amount of it in the system and the small size of the crystallites, in agreement with other studies [15]. Other studies report that the formation of other phases in this system requires high temperatures-700 °C and more, as well as higher concentrations of Sn4+ [39]. When the tin concentration increased, the crystallinity degree and the peaks’ intensity enhanced too. The ZnO-SnO2 samples containing Sn4+ at 0.5 mol.% and 1 mol.% are characterized by the highest crystallinity, 63.29% and 63.36%, respectively. The lowest peak intensity and, accordingly, the lowest crystallization was shown for a pure zinc oxide ZnO to be 35.63%, which confirms the positive effect of doping agents on the material’s properties. The material with Sn:Zn = 5:95 also has a low degree of crystallinity, 55.56%, which is consistent with other studies [23].
The coherent scattering region corresponding to the average particle size was calculated using the Scherer equation and was 10–15 nm for all the synthesized ZnO-SnO2 materials. It is worth noting that the enhancing of tin concentration modifies the particle size: the smallest particle size of 10 nm was shown for the film with Sn:Zn = 0.5:99.5, while the particle size of the material containing 1 mol.% of Sn is 14 nm. The highest particle size was equal to 15 nm for material containing 5 mol.% of Sn.
According to the SEM inspection, all ZnO-SnO2 films have a rather uniform surface with no visible interfaces between the layers; the film’s thickness is ca. 200 ± 30 nm (Figure 3). The average particle size calculated by processing the SEM images lies in the 12–15 nm range, which is consistent with the one calculated by the Scherer equation according to the XRD data.

3.2. Electrophysics

The conductivity (G) dependences on the reciprocal temperature of the samples are shown in Figure 4. The analysis of the presented curves shows that the free carriers are generated as a result of thermal excitation which has an activation nature. Therefore, the dependence of the ZnO-SnO2 resistivity on temperature is described by the Arrhenius equation [35] as
G= G0 ∙ exp(−Ea/k ∙ T),
where Ea is the activation energy of conductance, k is the Boltzmann constant, and G0 is the pre-exponential factor (constant).
The activation energy of conductance (Ea) was extracted in the temperature range where a linear reduction of G(T) is observed; this range goes from approx. 100 to 300 °C. The Ea dependence for all the ZnO-SnO2 films under study is given in Table 1.
It was shown that the activation energy of conduction is in the range of 0.6–0.8 eV, which corresponds to the energy of Zn atom vacancy in the conduction band of ZnO [40]. The decrease in the activation energy with an increase in the concentration of tin dioxide in ZnO-SnO2 films from 0.78 eV to 0.60 eV can be explained by a change in the charge state of vacancies due to the electron flow from SnO2 crystallites to ZnO crystallites at the SnO2-ZnO heterojunction. Since the electron work function of zinc oxide (5.2 eV) [41] is higher than that of tin oxide (4.8 eV) [42], electrons will transfer from SnO2 to ZnO upon contact. In this case, the magnitude of the potential barrier decreases. This can also explain the fact that the potential barrier Vb has a minimum (0.58 eV) for a film with a Sn:Zn ratio of 1:99.
With a further increase in the concentration of SnO2 crystallites, a large number of SnO2-SnO2 heterojunctions appear, which again leads to an increase in Vb.

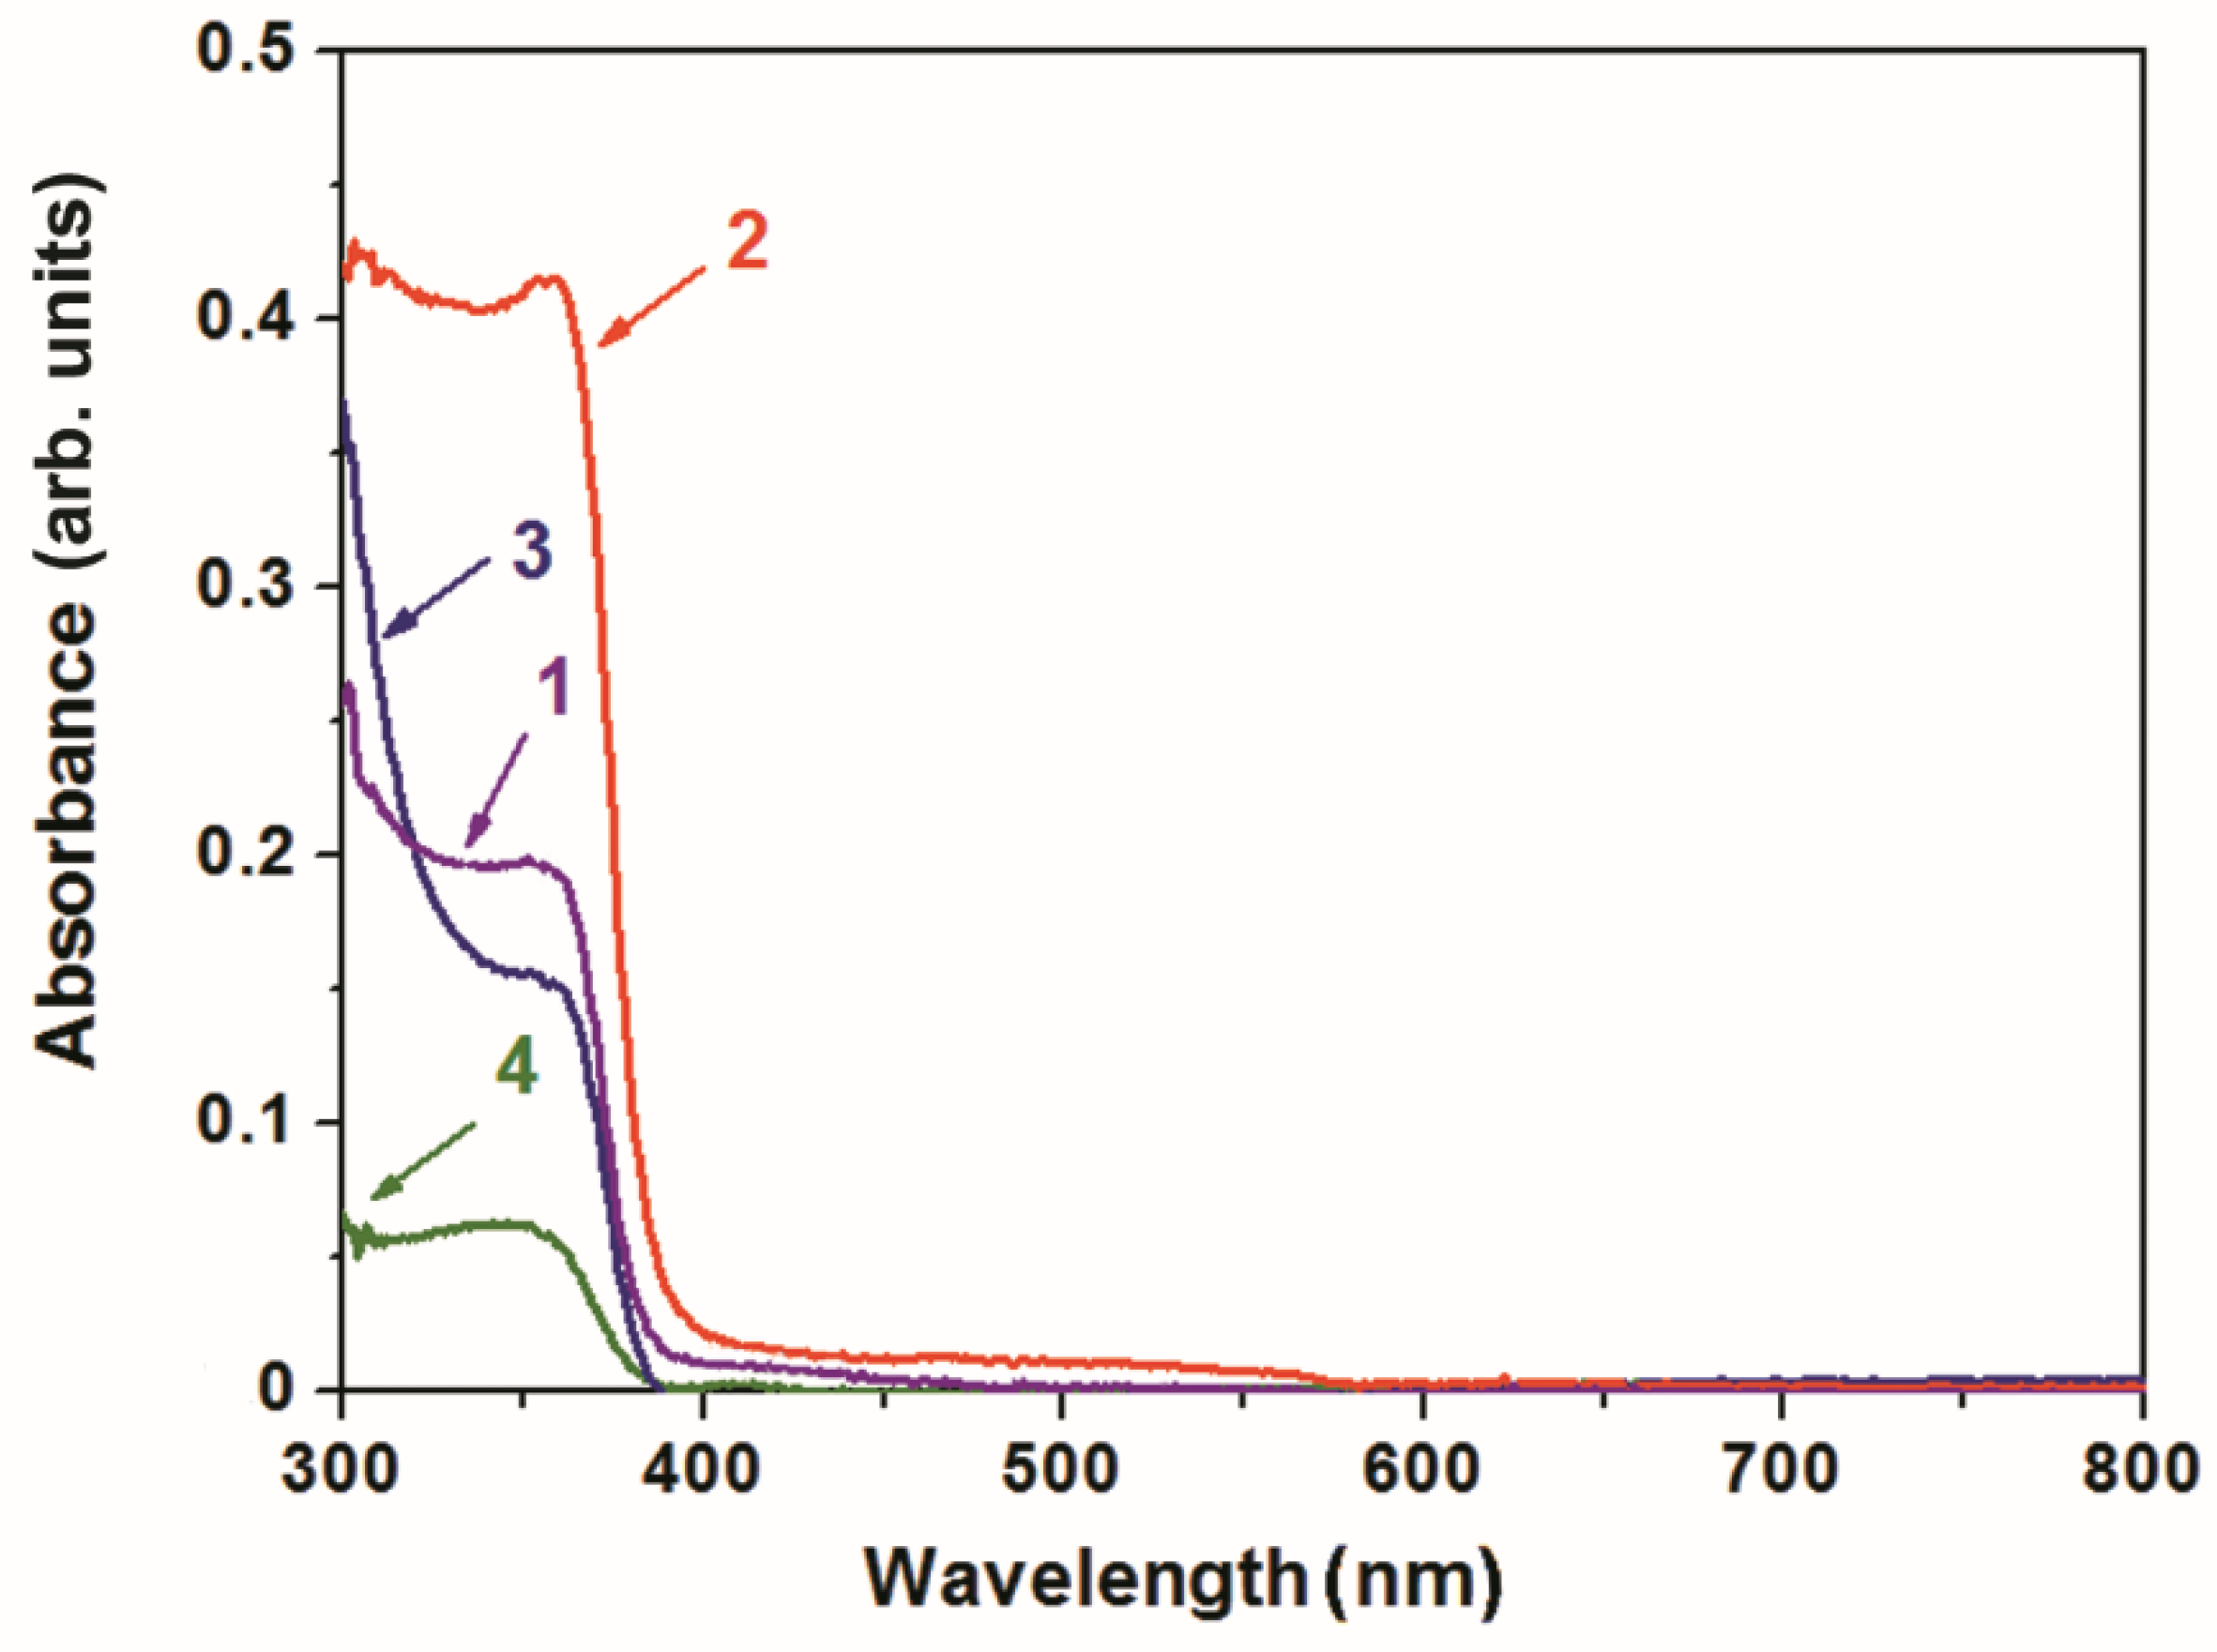
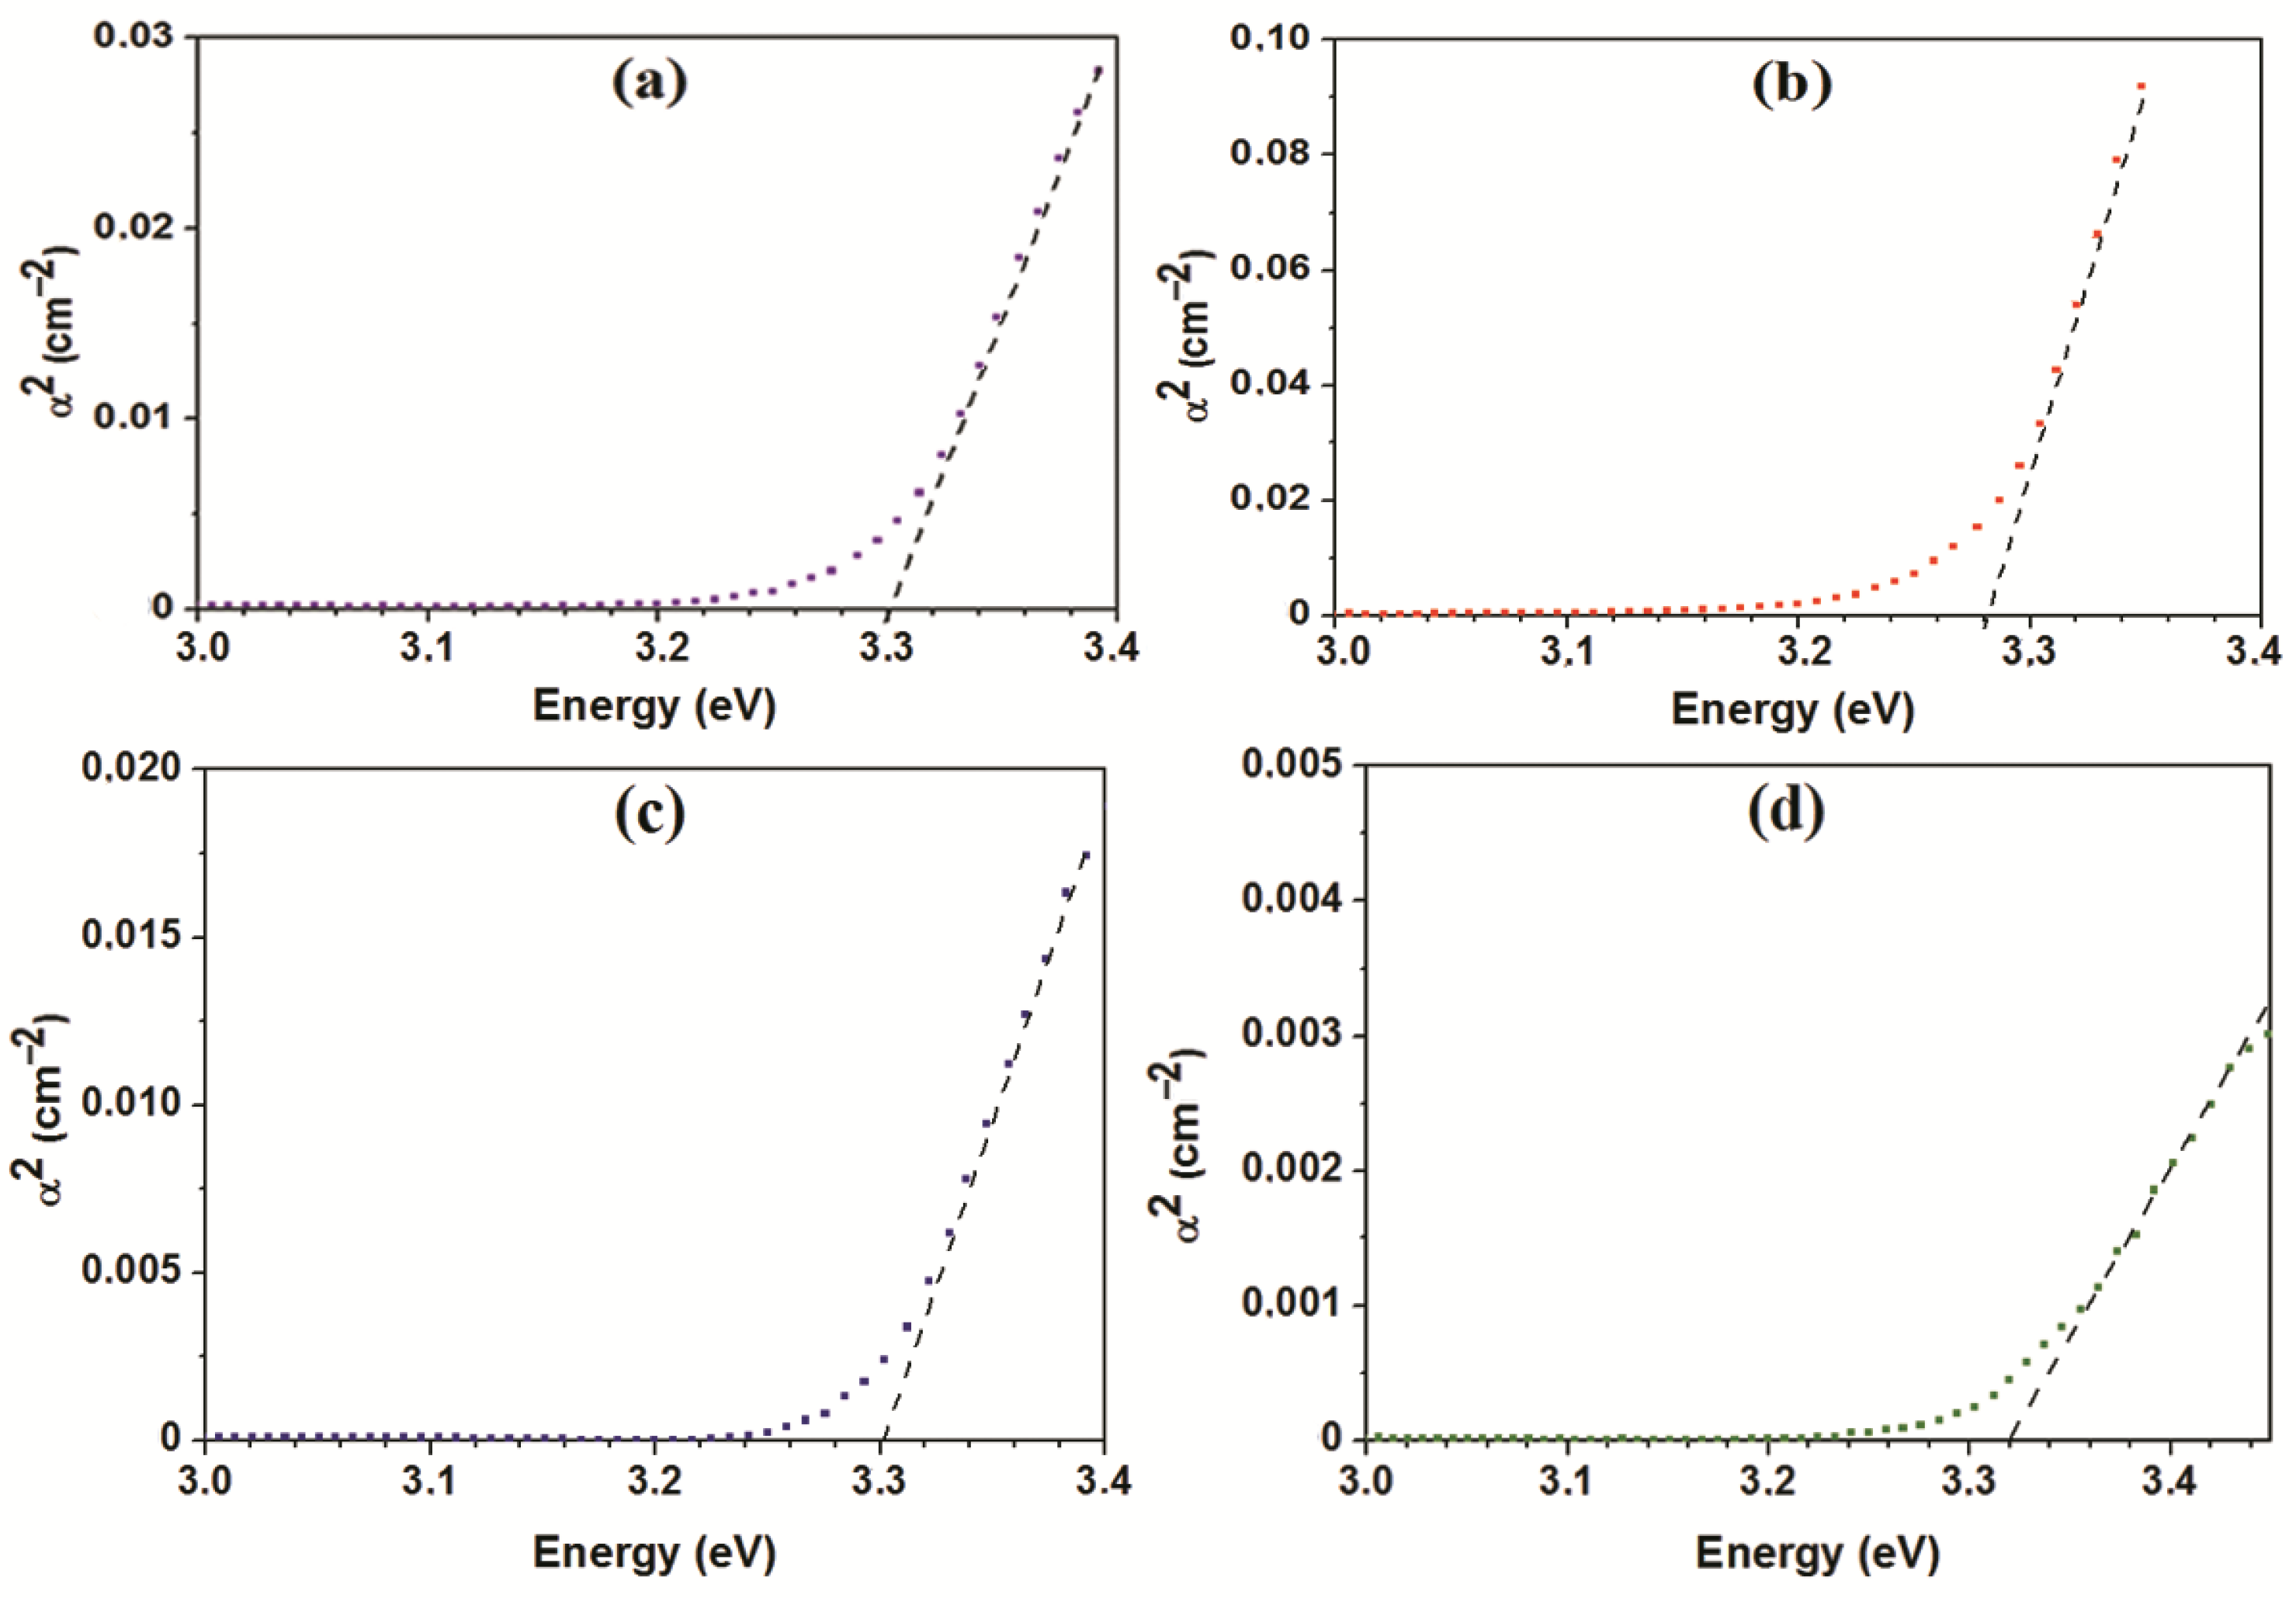
3.3. Optical Properties
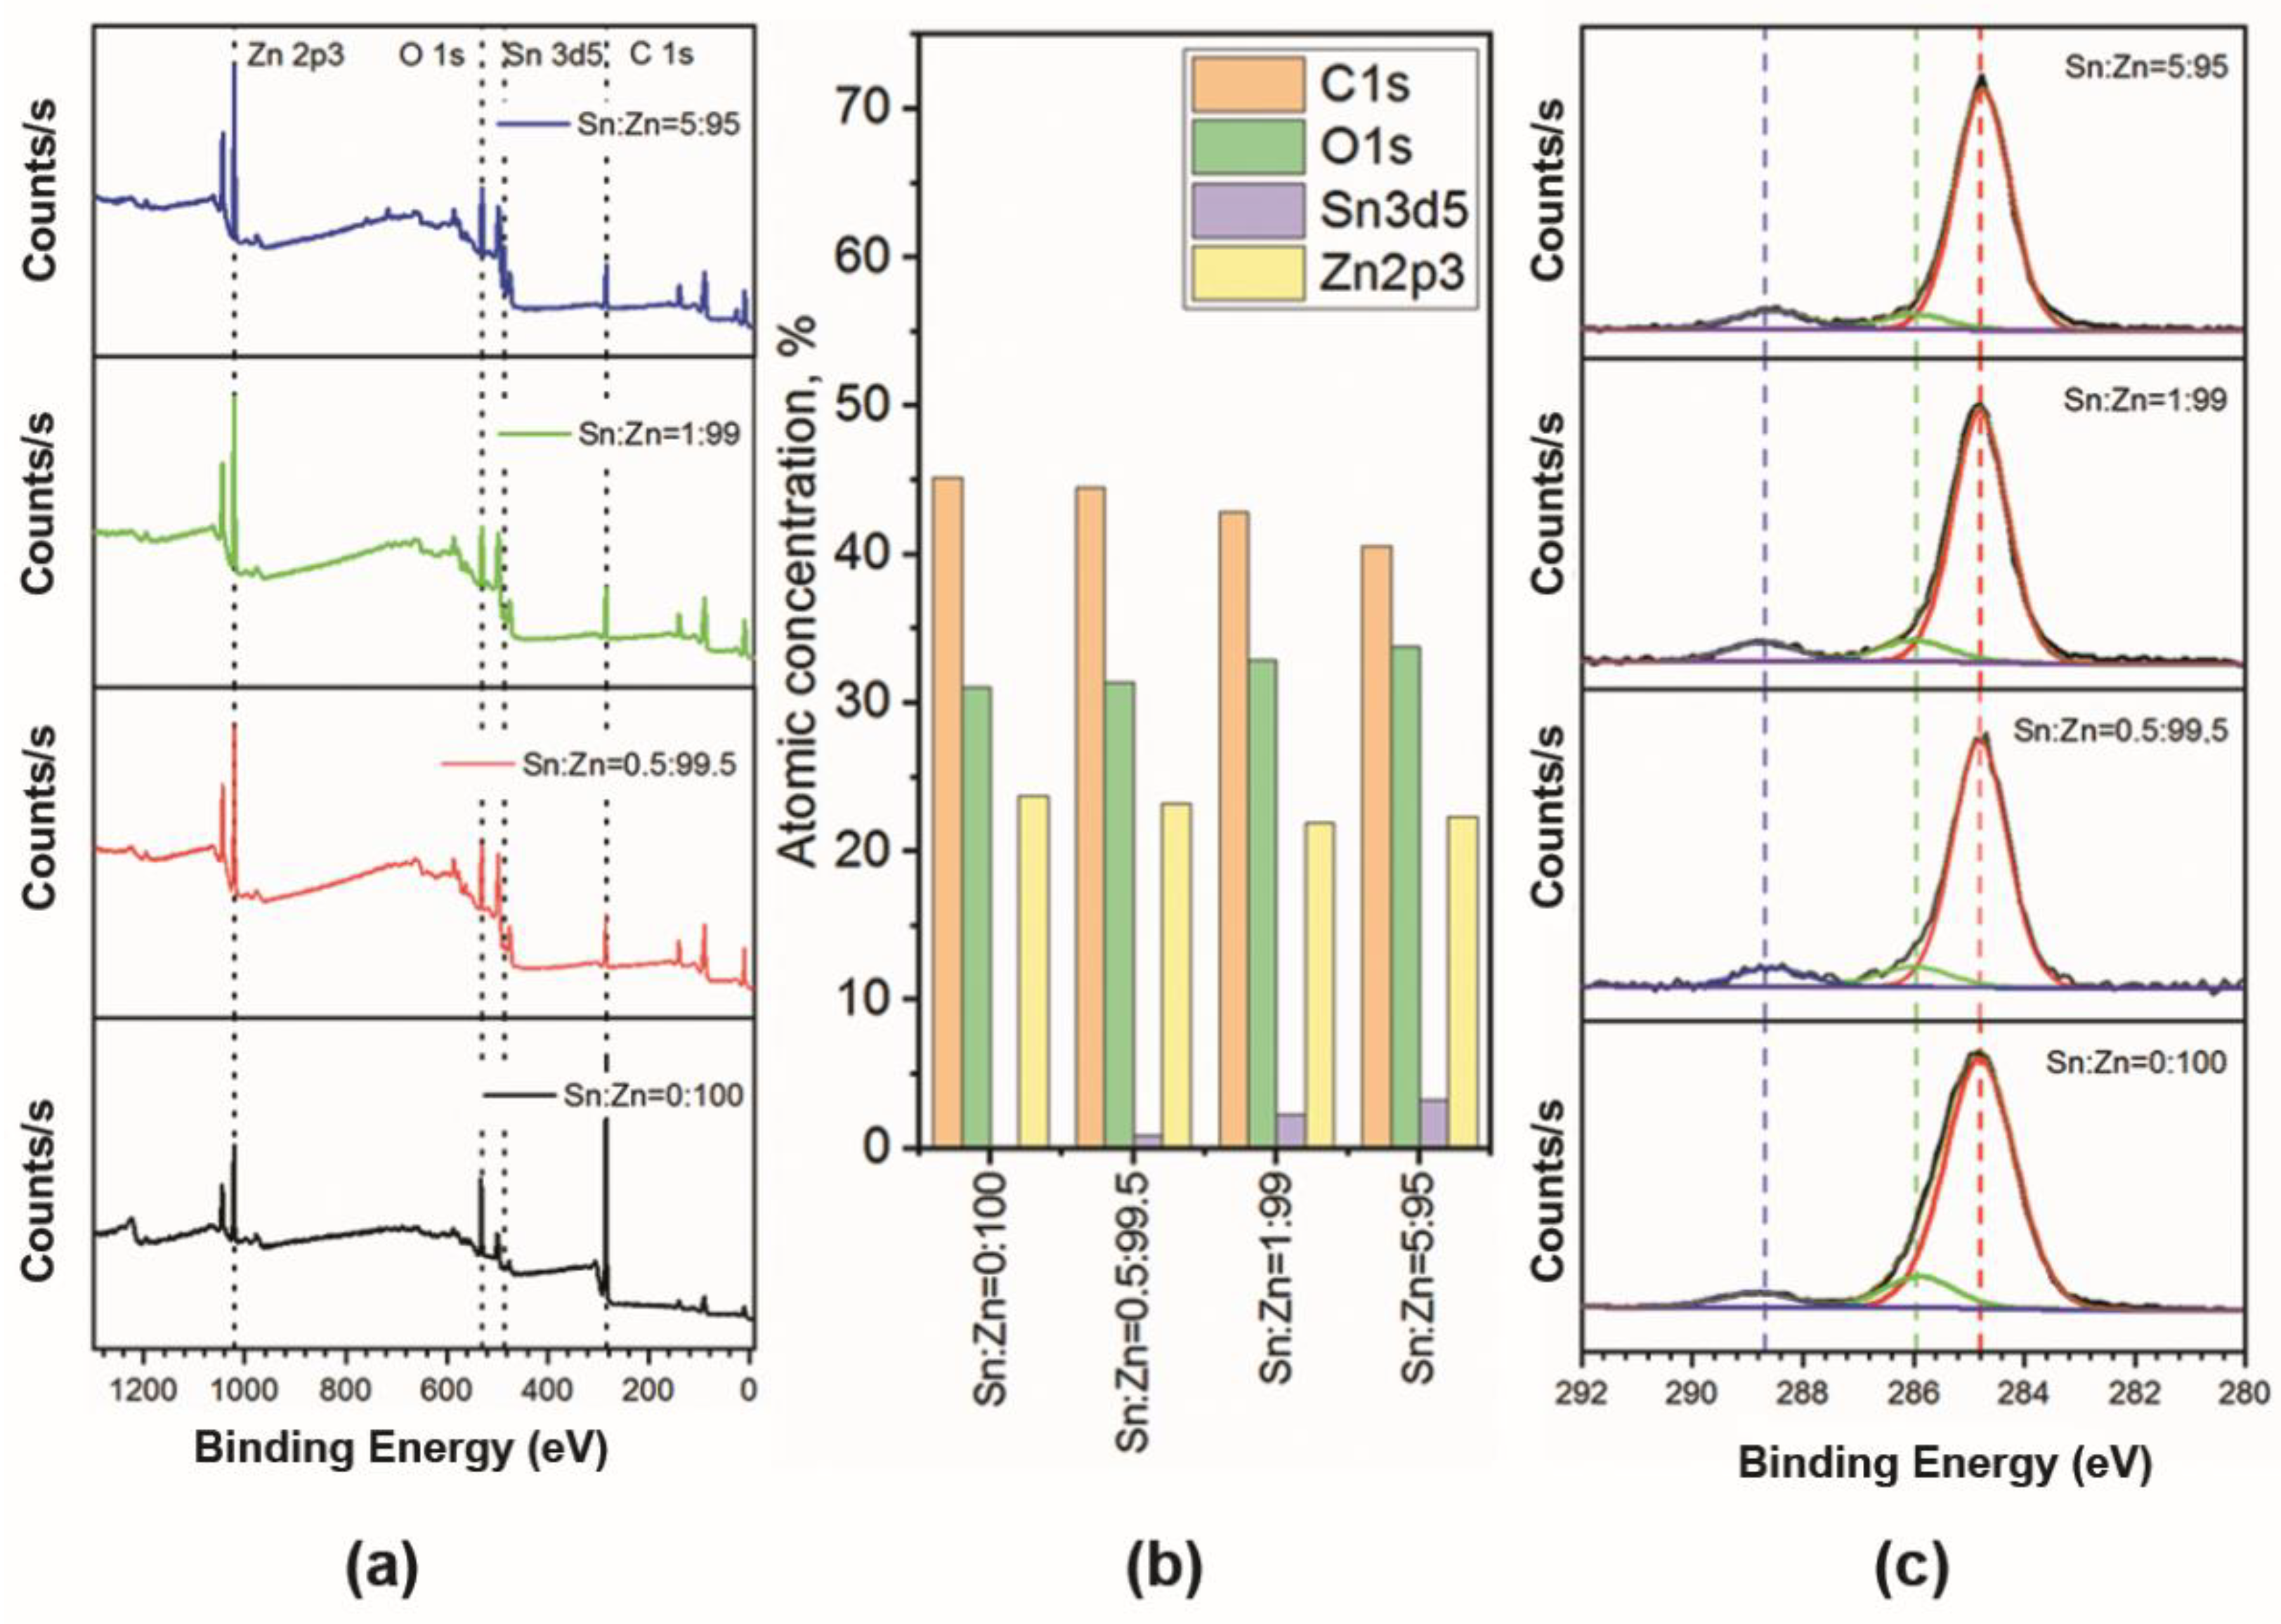
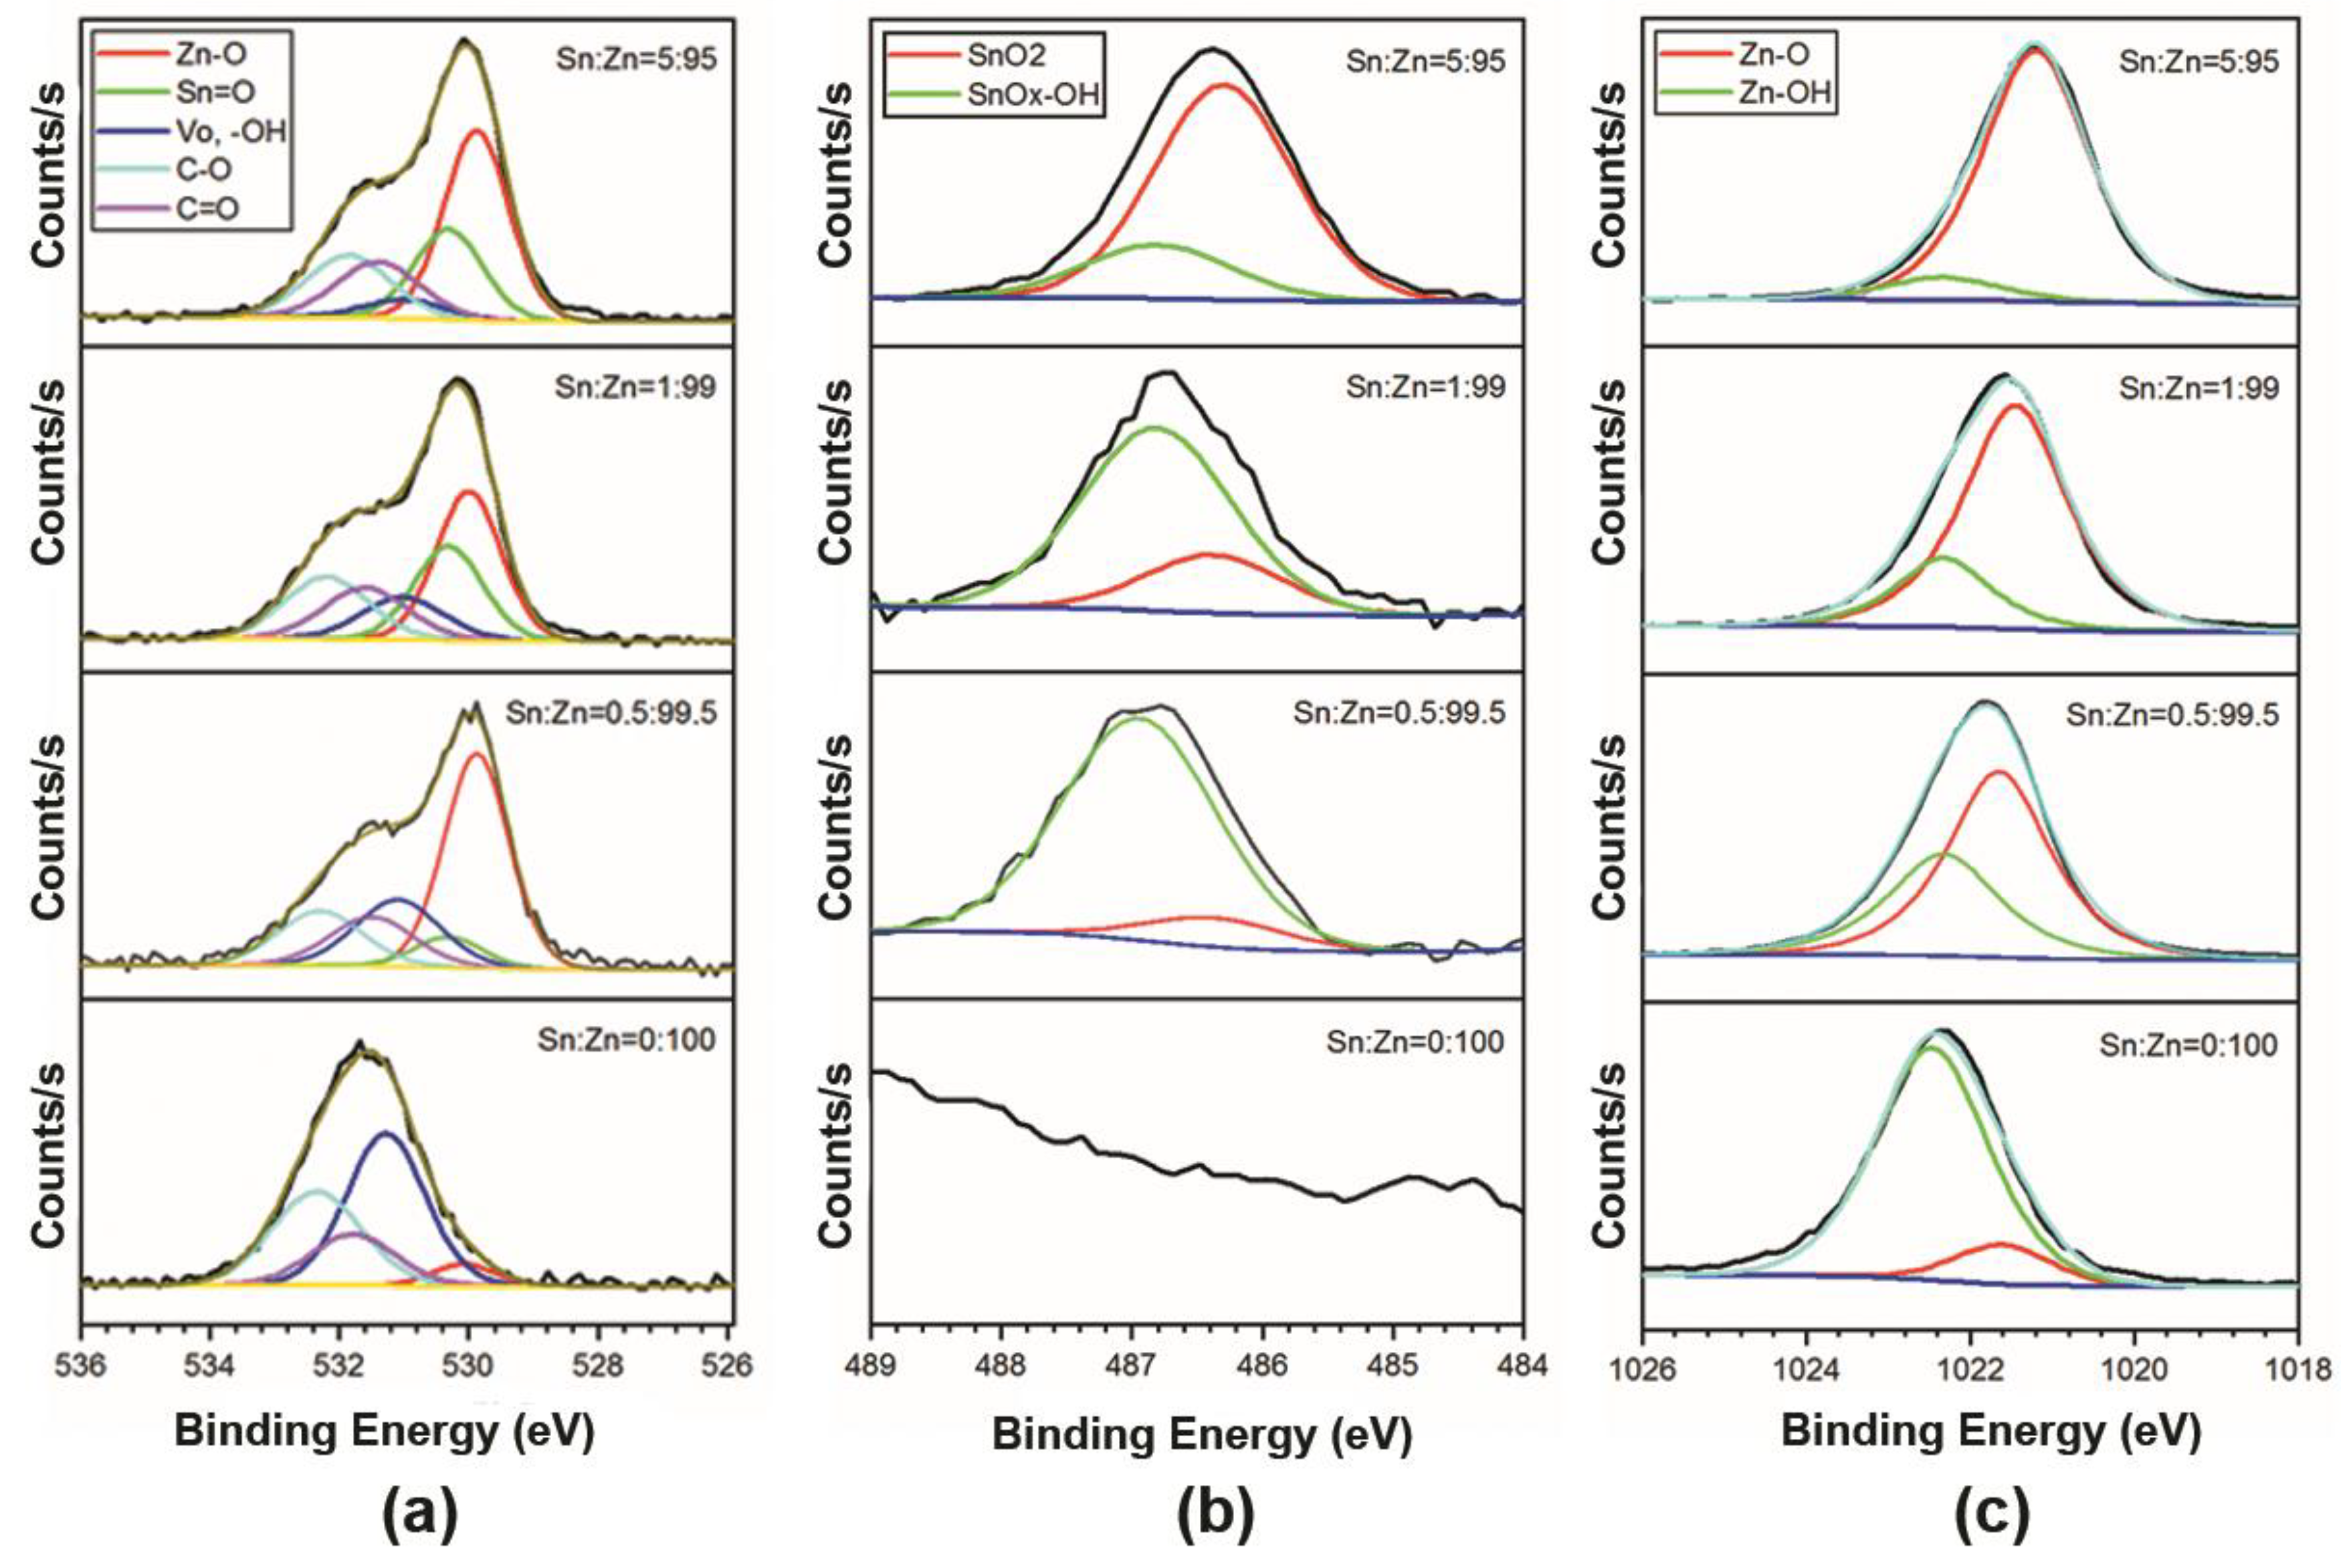
All the ZnO-SnO2 samples, regardless of the tin concentration, have a high transparency, more than 90%, in the wavelength range of 380–800 nm. When considering the absorption in the range of 300–380 nm, it can be seen that the addition of tin results mostly in reducing the optical absorption (Figure 5, curves 2, 3, 4). At the same time, the intensity of absorption is governed by the crystallite sizes in these films (see Table 1). The maximum absorption coefficient appeared at the wavelengths below 380 nm is noted for the material with Sn:Zn = 0.5:99.5 (DXRD = 12 nm, DSEM = 12 nm) while the minimum one is observed in the material with Sn:Zn = 5:95 (DXRD = 15 nm, DSEM = 16 nm). The absorption in a pure ZnO film (Figure 5, curve 1) follows this trend: the size of crystallites in the ZnO film is the same as that of the ZnO-SnO2 film with Sn:Zn = 1:99 ratio (DXRD = 14 nm, DSEM = 13 nm). It is worth noting that the thicknesses of all the films are approximately the same, 200 ± 15 nm. Above 380 nm of wavelength, the absorption coefficient for all materials tends towards zero.
For all the ZnO-SnO2 materials, the band gap (Eg) was evaluated by extrapolating the linear sections of the curve a2 = f(hν) to the X–axis as drawn in Figure 6. For the material with Sn:Zn = 0.5:99.5, the minimum band gap of 3.28 eV was derived, while the other materials have similar values to be 3.30 eV and 3.32 eV, which are slightly less than one for pure ZnO 3.37 eV. When tin dioxide is introduced into the structure of zinc oxide, one would expect an increase in the band gap, but this does not happen. The addition of 0.5–5% of Sn4+ is not enough to change the band gap of the resulting nanocomposite material. Significant changes in the band gap occur at higher concentrations of SnO2 in ZnO, as shown, for instance, in Ref. [39]. The decrease in the band gap can mature from an increase in the structure’s disorderliness when the crystallites’ sizes become minimum (Table 1). This is also in good agreement with experimental research study [18].

3.4. XPS Analysis

The survey spectra and chemical composition of the synthesized ZnO-SnO2 films (Zn:Sn = 100:0, 99.5:0.5, 99:1, 95:5) are drawn in Figure 7. Figure 7b shows that the atomic concentration of Zn and Sn are agrees well with the given composition of the films. The presence of carbon in the spectra at a level of 41–45% for all the samples is associated with the technological features of solid-phase pyrolysis and adventitious carbon adsorption from the atmosphere [43,44]. The deconvolution of high-resolution spectra for the C 1s indicates a close quantitative ratio of carbon compounds as C-C (284.8 eV), C = O (286 eV), and O = C-O (288.5 eV) bonds for all the samples (Figure 7c) [44].
Taking into account the carbon compounds, it is possible to carry out a thorough calculation of the oxygen line of O 1s component and thus to distinguish the chemical state of the metal atoms Zn and Sn in the composite. These data are given in Figure 8a. As one can see, there are significant changes in the maxima and line shapes of high-resolution O 1s spectra, which can be explained by the variation of the composite samples. The major component composition of O 1s line corresponds to C-O compound at 531.86–532.35 eV, C=O at 531.4–531.79 eV, ZnO at 529.88–530.08 eV, and SnOx at 530.31 eV. As reported in various studies on ZnO and SnO2, the components of the O 1s line with Binding Energy (531.0–531.28 eV) corresponds both to the presence of anionic oxygen VO vacancy species [45,46,47,48,49,50,51,52], and to adsorbed–OH groups [53,54,55,56]. However, due to the close binding energies, it is impossible to separate this peak into the -OH and VO components [57].
The results of the high-resolution spectra component analysis of the photoelectron lines related to Zn 2p3/2 and Sn 3d5/2 are displayed in Figure 8b,c. The binding energies of the components corresponding to the chemical bonds of C-O, C=O, -OH, Zn-O, Sn-O, and VO for the O 1s line are given in Table 2. To perform a comparative analysis, various research data on ZnO-SnO2 films under study are also presented [45,46,50,51,57].
The calculation of the modified Auger parameter and the Wagner plot drawn in Figure 9 from Zn LMM and Sn MNN additionally indicates the presence of oxide and hydroxide states of the metals [58]. As can be seen, the Zn LMM series show a tendency towards a reduction of hydroxyl groups with an increasing in the concentration of tin oxide in the ZnO-SnO2 films (Figure 9a, blue dot line) that agrees with the presented XPS data of Figure 7c. Moreover, the XPS and AES data clearly showed (Figure 7, Figure 8 and Figure 9) the appearance of Sn-O bonds corresponding to crystalline SnO2 and Zn-O, which confirms the composite structure of the ZnO-SnO2 films.
A qualitative assessment of the fraction of VO vacancies in the ZnO-SnO2 films was carried out via estimating the difference between the total area of the components corresponding to the hydroxide group –OH, and VO vacancies, and the fraction of metal-hydroxide groups that were found from the ratios of the photoelectron lines of Zn 2p3/2 and Sn 3d5/2 components, as follows:
S(O1sVo, -OH) = S(O1s Sn-OH) + S(O1s Zn-OH) +S (Vo),
S(O1s Sn-OH) + S(O1s Zn-OH) =
S(O1sVo, -OH) ∙ (SSnO2)/SSn-OH) + S(O1sVo, -OH) ∙ (SZnO)/SZn-OH),
where S(O1sVo, -OH) is the total area of the component corresponding to the metal-hydroxide group -OH and vacancy VO; S(O1s Sn-OH) is the area that falls on the Sn-OH bond in the O 1s line; S(O1s Zn-OH) is the area that falls to the Zn-OH bond in the O 1s line; (SSnO2)/SSn-OH) is the ratio of the areas corresponding to the components of the Sn 3d5/2; (SZnO)/SZn-OH) is the ratio of the areas corresponding to components of the Zn 2p3/2.
As a result, we could obtain the concentrations of the hydroxyl groups –OH and VO vacancies in the ZnO-SnO2 films; the data are depicted in Figure 10. As one can see, minor additions of SnO2 into ZnO leads to a decrease in the concentration of OH groups on the surface, depending on the increase in the SnO2 content in the ZnO-SnO2 films. This process enhances the concentration of anionic vacancies with the largest number found in ZnO-SnO2 sample at 1 mol.% of Sn4+. This approach allows us to perform a “fine tuning” of the functional properties of these films.

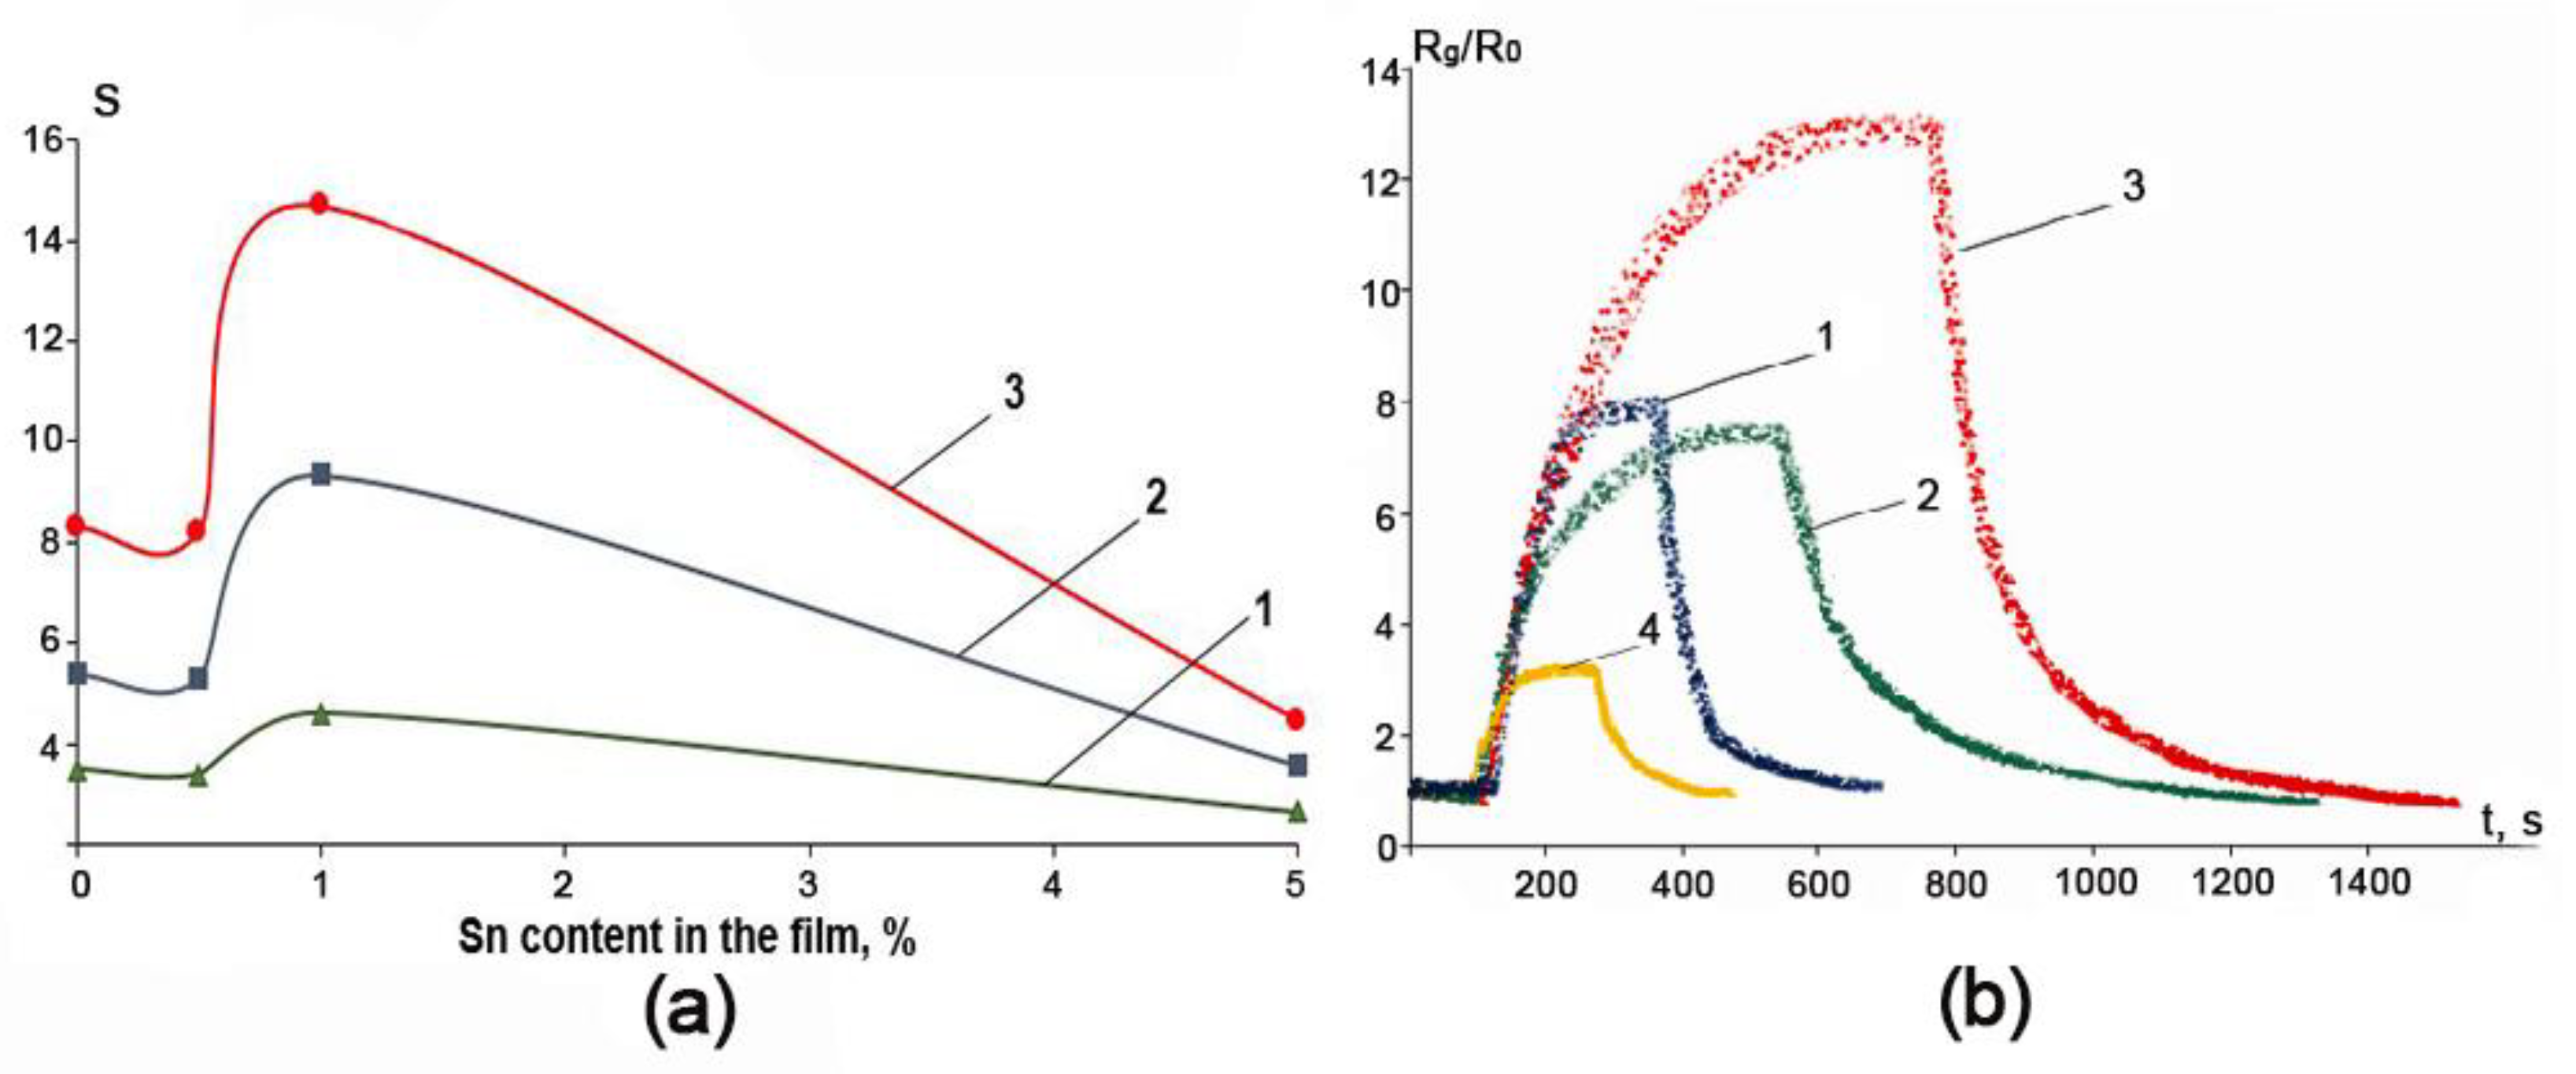
3.5. Gas Sensing Results

The influence of above-noted “tuning” is clearly seen upon studies of the gas-sensitive properties of the ZnO-SnO2 films under exposure to NO2 at concentrations of 5–50 ppm at the operating temperature of 200 °C. This heating regime was chosen because the higher temperatures facilitate desorbing OH groups from the surface of metal oxides [59,60,61], while lower temperatures are not enough to activate the chemiresistive response of the sensors.
The results on the response S of ZnO-SnO2-based sensors are collected in Figure 11. A typical R(t) transient upon exposure to 50 ppm NO2 is shown in Figure 11b. It can be seen that ZnO-SnO2 film with Sn:Zn = 1:99 has approximately 1.5 times higher sensitivity to nitrogen dioxide when compared to other samples. It is interesting that the curve of the gas response vs. Sn content in the ZnO-SnO2 film (Figure 11a) correlates well to one yielding the content of VO vacancies in the ZnO-SnO2 films (Figure 10) which was obtained via the XPS method and subsequent evaluation. In addition, the ZnO-SnO2 film of Sn:Zn = 1:99 ratio is characterized by a lower value of the potential barrier Vb and low values of the conduction activation energy Ea, resulting from the transition of electrons from tin oxide to zinc oxide under the formation of ZnO-SnO2 heterojunctions. The latter circumstance may be due to the small size of the crystallites estimated via the XRD and SEM analysis results. This makes it possible to conclude that the increase in the gas response in the ZnO-SnO2 film with Sn:Zn = 1:99 is due to higher concentrations of anion vacancies, small crystallite sizes and low values of Vb and Ea, which is in good agreement with other research studies [13,15,16,17].
For ZnO-SnO2 films containing a low SnO2 concentration, the major mechanism of gas sensitivity seems to be the interaction of NO2 molecules with V O anion vacancies [62]. The adsorption of NO2 on the V O anion vacancies results in the dissociation of these molecules as:
V O + NO 2 , g a s V O NO 2 , a d s V O O a d s + NO g a s ,
V O + NO g a s V O O a d s + 1 2 N 2 , g a s
Subsequently, the V O O a d s sorption complexes are decomposed with a formation of molecular oxygen which goes away to the gaseous phase, and an oxygen vacancy Vo: 2 ( V O O a d s ) 2 V O + O 2 , g a s .
This description corresponds to our experimental observations.

4. Conclusions

In this work, ZnO-SnO2 thin films were fabricated employing new solid-phase low-temperature pyrolysis technique. The nanocomposite structure of the ZnO-SnO2 films was proved by XRD, SEM, XPS and AES methods. All materials have a particle size in 10–15 nm range, which is confirmed by XRD and SEM data, and have a wurtzite structure regardless of the Sn4+ concentration. The minimum particle size, the highest crystallinity degree, and the minimum band gap were shown for the material with the Sn:Zn ratio equal to 0.5:99.5.
The study of the electrophysical properties of ZnO-SnO2 films showed that the values of the activation energy of the conductivity decrease from 0.78 eV to 0.6 eV with enhancing the concentration of SnO2. At the same time, the minimum value of the intergrain potential barrier was shown for the film with the Sn:Zn ratio equal to 1: 99 to be 0.58 eV. It could be explained by the shift of electrons at the SnO2-ZnO heterojunction from tin oxide to zinc oxide. For the same material, the highest concentration of anionic vacancies is shown. The minimum values of the potential barrier and the high concentration of anionic vacancies leads to the best gas-sensitive properties of the ZnO-SnO2 films with the Sn:Zn ratio equal to 1:99 to NO2 at the operating temperature of 200 °C; the chemiresistive response is 1.5 times higher when compared to other materials.
Thus, by the solid-phase low-temperature pyrolysis technique it is possible to obtain a nanocomposite ZnO-SnO2 thin film with the specified electrophysical and gas-sensitive properties by adjusting the concentration of the oxide components within the given limits. It allows us to recommend the solid-phase low-temperature pyrolysis technique as quite promising for producing materials with the desired properties.

Author Contributions

Conceptualization, V.V.P., E.M.B. and V.V.S.; synthesis of films, E.M.B., V.Y.S. and M.G.V.; XPS, AES, S.A.K. and Z.K.K.; SEM V.V.P.; electrophysical and gas sensitive properties, V.V.P. and A.P.S.; XRD analysis, V.Y.S. writing—original draft preparation, V.V.P., V.V.S., E.M.B., S.A.K. and M.G.V.; writing—review and editing, V.V.P., E.M.B. and V.V.S. All authors have read and agreed to the published version of the manuscript.

Funding

This work was financially supported by the RFBR, project 20-07-00653 A.

Institutional Review Board Statement

Not applicable.

Informed Consent Statement

Not applicable.

Data Availability Statement

Data are available on request from authors.

Acknowledgments

The authors are grateful to the Molecular Spectroscopy Center of Southern Federal University for the registration of the spectra and the Laboratory for the Technology of Functional Nanomaterials of Institute of Nanotechnologies, Electronics, and Equipment Engineering, (Southern Federal University), for assistance in carrying out the research using the method of scanning electron microscopy.

Conflicts of Interest

The authors declare no conflict of interest.

References

  1. Zhu, L.; Zeng, W. Room-temperature gas sensing of ZnO-based gas sensor: A review. Sens. Actuators A Phys. 2017, 267, 242–261. [Google Scholar] [CrossRef]
  2. Li, Z.; Li, H.; Wu, Z.; Wang, M.; Luo, J.-T.; Torun, H.; Hu, P.; Yang, C.; Grundmann, M.; Liu, X.; et al. Advances in designs and mechanisms of semiconducting metal oxide nanostructures for high-precision gas sensors operated at room temperature. Mater. Horiz. 2019, 6, 470–506. [Google Scholar] [CrossRef] [Green Version]
  3. Petrov, V.V.; Bayan, E.M.; Khubezhov, S.A.; Varzarev, Y.N.; Volkova, M.G. Investigation of Rapid Gas-Sensitive Properties Degradation of ZnO–SnO2 Thin Films Grown on the Glass Substrate. Chemosensors 2020, 8, 40. [Google Scholar] [CrossRef]
  4. Xiong, L.; Guo, Y.; Wen, J.; Liu, H.; Yang, G.; Qin, P.; Fang, G. Review on the Application of SnO2 in Perovskite Solar Cells. Adv. Funct. Mater. 2018, 28, 1802757. [Google Scholar] [CrossRef]
  5. Naghdi, S.; Rhee, K.Y.; Hui, D.; Park, S.J. A Review of Conductive Metal Nanomaterials as Conductive, Transparent, and Flexible Coatings, Thin Films, and Conductive Fillers: Different Deposition Methods and Applications. Coatings 2018, 8, 278. [Google Scholar] [CrossRef] [Green Version]
  6. Islam, M.R.; Rahman, M.; Farhad, S.; Podder, J. Structural, optical and photocatalysis properties of sol–gel deposited Al-doped ZnO thin films. Surf. Interfaces 2019, 16, 120–126. [Google Scholar] [CrossRef]
  7. Vittal, R.; Ho, K.-C. Zinc oxide based dye-sensitized solar cells: A review. Renew. Sustain. Energy Rev. 2017, 70, 920–935. [Google Scholar] [CrossRef]
  8. Onkar, S.G.; Raghuwanshi, F.C.; Patil, D.R.; Krishnakumar, T. Synthesis, Characterization and Gas Sensing Study of SnO2 Thick Film Sensor towards H2S, NH3, LPG and CO2. Mater. Today Proc. 2020, 23, 190–201. [Google Scholar] [CrossRef]
  9. Minami, T. Present status of transparent conducting oxide thin-film development for Indium-Tin-Oxide (ITO) substitutes. Thin Solid Films 2008, 516, 5822–5828. [Google Scholar] [CrossRef]
  10. Bayan, E.M.; Lupeiko, T.G.; Pustovaya, L.E.; Volkova, M.G. Synthesis and photocatalytic properties of Sn–TiO2 nanomaterials. J. Adv. Dielectr. 2020, 10, 2060018. [Google Scholar] [CrossRef]
  11. Seiyama, T.; Kato, A.; Fujiishi, K.; Nagatani, M. A New Detector for Gaseous Components Using Semiconductive Thin Films. Anal. Chem. 1962, 34, 1502–1503. [Google Scholar] [CrossRef]
  12. Petrov, V.V.; Varzarev, Y.N.; Bayan, E.M.; Storozhenko, V.Y.; Rozhko, A.A. Study of the Electrophysical Properties of Thin Films of Mixed Zinc and Tin Oxides. In Proceedings of the 2019 IEEE International Conference on Electrical Engineering and Photonics (EExPolytech), St. Petersburg, Russia, 17–18 October 2019; Volume 8906834, pp. 242–243. [Google Scholar]
  13. Li, W.; Ma, S.; Li, Y.; Yang, G.; Mao, Y.; Luo, J.; Gengzang, D.; Xu, X.; Yan, S. Enhanced ethanol sensing performance of hollow ZnO–SnO2 core–shell nanofibers. Sens. Actuators B Chem. 2015, 211, 392–402. [Google Scholar] [CrossRef]
  14. Chen, W.; Li, Q.; Xu, L.; Zeng, W. Gas Sensing Properties of ZnO-SnO2 Nanostructures. J. Nanosci. Nanotechnol. 2015, 15, 1245–1252. [Google Scholar] [CrossRef]
  15. Liu, S.; Zhang, Y.; Gao, S.; Fei, T.; Zhang, Y.; Zheng, X. An organometallic chemistry-assisted strategy for modification of zinc oxide nanoparticles by tin oxide nanoparticles: Formation of n-n heterojunction and boosting NO2 sensing properties. J. Colloid Interface Sci. 2020, 567, 328–338. [Google Scholar] [CrossRef]
  16. Zhao, S.; Shen, Y.; Zhou, P.; Li, G.; Hao, F.; Han, C.; Liu, W.; Wei, D. Construction of ZnO–SnO2 n-n junction for dual-sensing of nitrogen dioxide and ethanol. Vacuum 2020, 181, 109615. [Google Scholar] [CrossRef]
  17. Bai, S.; Fu, H.; Zhao, Y.; Tian, K.; Luo, R.; Li, D.; Chen, A. On the construction of hollow nanofibers of ZnO-SnO2 heterojunctions to enhance the NO2 sensing properties. Sens. Actuators B Chem. 2018, 266, 692–702. [Google Scholar] [CrossRef]
  18. Xu, B.; Ren, X.-G.; Gu, G.-R.; Lan, L.-L.; Wu, B.-J. Structural and optical properties of Zn-doped SnO2 films prepared by DC and RF magnetron co-sputtering. Superlattices Microstruct. 2016, 89, 34–42. [Google Scholar] [CrossRef]
  19. Chahmat, N.; Souier, T.; Mokri, A.; Bououdina, M.; Aida, M.; Ghers, M. Structure, microstructure and optical properties of Sn-doped ZnO thin films. J. Alloy. Compd. 2014, 593, 148–153. [Google Scholar] [CrossRef]
  20. Manoharan, C.; Pavithra, G.; Dhanapandian, S.; Dhamodaran, P.; Shanthi, B. Properties of spray pyrolised ZnO:Sn thin films and their antibacterial activity. Spectrochim. Acta Part A Mol. Biomol. Spectrosc. 2015, 141, 292–299. [Google Scholar] [CrossRef]
  21. Shewale, P.; Yu, Y.; Kim, J.; Bobade, C.; Uplane, M. H2S gas sensitive Sn-doped ZnO thin films: Synthesis and characterization. J. Anal. Appl. Pyrolysis 2015, 112, 348–356. [Google Scholar] [CrossRef]
  22. Guo, Z.L.; Zhuang, J.; Ma, Z.; Xia, H.R.; Wen, Q.X.; Luo, X.Y.; Wen, X. Enhanced electron extraction using ZnO/ZnO-SnO2 solid double-layer photoanode thin films for efficient dye sensitized solar cells. Thin Solid Films 2019, 684, 1–8. [Google Scholar] [CrossRef]
  23. Aydin, H.; El-Nasser, H.; Aydin, C.; Al-Ghamdi, A.A.; Yakuphanoglu, F. Synthesis and characterization of nanostructured undoped and Sn-doped ZnO thin films via sol–gel approach. Appl. Surf. Sci. 2015, 350, 109–114. [Google Scholar] [CrossRef]
  24. Yang, X.; Zhang, S.; Yu, Q.; Zhao, L.; Sun, P.; Wang, T.; Liu, F.; Yan, X.; Gao, Y.; Liang, X.; et al. One step synthesis of branched SnO2/ZnO heterostructures and their enhanced gas-sensing properties. Sens. Actuators B Chem. 2019, 281, 415–423. [Google Scholar] [CrossRef]
  25. Srinivasulu, T.; Saritha, K.; Reddy, K.R. Synthesis and characterization of Fe-doped ZnO thin films deposited by chemical spray pyrolysis. Mod. Electron. Mater. 2017, 3, 76–85. [Google Scholar] [CrossRef]
  26. Volkova, M.G.; Storozhenko, V.Y.; Petrov, V.V.; Bayan, E.M. Characterization of nanocrystalline ZnO thin films prepared by new pyrolysis method. J. Phys. Conf. Ser. 2020, 1695, 012023. [Google Scholar] [CrossRef]
  27. Volkova, M.G.; Storozhenko, V.Y.; Petrov, V.V.; Bayan, E.M. Effect of tin doping on optical properties of ZnO thin films grown on glass substrate. J. Phys. Conf. Ser. 2020, 1695, 012122. [Google Scholar] [CrossRef]
  28. Petrov, V.V.; Starnikova, A.P.; Varzarev, Y.N.; Abdullin, K.A.; Makarenko, D.P. Gas sensitive properties of ZnO nanorods formed on silicon and glass substrates. IOP Conf. Ser. Mater. Sci. Eng. 2019, 703, 012038. [Google Scholar] [CrossRef]
  29. Zhang, L.; Xu, W.; Liu, W.; Cao, P.; Han, S.; Zhu, D.; Lu, Y. Structural, chemical, optical, and electrical evolution of solution-processed SnO2 films and their applications in thin-film transistors. J. Phys. D Appl. Phys. 2020, 53, 175106. [Google Scholar] [CrossRef]
  30. Siegbahn, K. Electron Spectroscopy for Atoms, Molecules and Condensed Matter. Science 1982, 217, 111–121. [Google Scholar] [CrossRef]
  31. Shmatko, V.A.; Yalovega, G.E.; Myasoedova, T.N.; Brzhezinskaya, M.M.; Shtekhin, I.E.; Petrov, V.V. Influence of the sur-face morphology and structure on the gas-sorption properties of SiO2CuOx nanocomposite materials: X-ray spectroscopy investigations. Phys. Solid Stat. 2015, 57, 399–406. [Google Scholar] [CrossRef]
  32. Myasoedova, T.; Yalovega, G.; Shmatko, V.; Funik, A.; Petrov, V. SiO2CuO films for nitrogen dioxide detection: Correlation between technological conditions and properties. Sens. Actuators B Chem. 2016, 230, 167–175. [Google Scholar] [CrossRef]
  33. Scofield, J. Hartree-Slater subshell photoionization cross-sections at 1254 and 1487 eV. J. Electron Spectrosc. Relat. Phenom. 1976, 8, 129–137. [Google Scholar] [CrossRef]
  34. Wagner, C.D.; Naumkin, A.V.; Kraut-Vass, A.; Allison, J.W.; Powell, C.J.; Rumble, J.R., Jr. NIST Standard Reference Database 20, Version 3.4 (Web Version). 2003. Available online: http:/srdata.nist.gov/xps/ (accessed on 21 April 2021).
  35. Shalimova, K.V. Physics of Semiconductors (Moscow: Energia); Energoatomizdat: Moscow, Russia, 1976. [Google Scholar]
  36. Clifford, P.; Tuma, D. Characteristics of semiconductor gas sensors II. transient response to temperature change. Sens. Actuators 1982, 3, 255–281. [Google Scholar] [CrossRef]
  37. Vorobyeva, N.A.; Rumyantseva, M.N.; Forsh, P.A.; Gaskov, A.M. Conductivity of Nanocrystalline ZnO(Ga). Semiconductors 2013, 47, 650–654. [Google Scholar] [CrossRef]
  38. Schreyer, M.; Guo, L.; Thirunahari, S.; Gao, F.; Garland, M. Simultaneous determination of several crystal structures from powder mixtures: The combination of powder X-ray diffraction, band-target entropy minimization and Rietveld methods. J. Appl. Crystallogr. 2014, 47, 659–667. [Google Scholar] [CrossRef]
  39. Wang, C.; Wang, X.; Xu, B.-Q.; Zhao, J.; Mai, B.; Peng, P.; Sheng, G.; Fu, J. Enhanced photocatalytic performance of nanosized coupled ZnO/SnO2 photocatalysts for methyl orange degradation. J. Photochem. Photobiol. A Chem. 2004, 168, 47–52. [Google Scholar] [CrossRef]
  40. Xu, C.X.; Sun, X.W.; Zhang, X.H.; Ke, L.; Chua, S.J. Photoluminescent properties of copper-doped zinc oxide nanowires. Nanotechnology 2004, 15, 856–861. [Google Scholar] [CrossRef]
  41. Pawar, R.C.; Kim, H.-S.; Lee, C.S. Improved field emission and photocatalysis properties of cacti-like zinc oxide nanostructures. Scr. Mater. 2013, 68, 142–145. [Google Scholar] [CrossRef]
  42. Gulevich, D.; Rumyantseva, M.; Gerasimov, E.; Khmelevsky, N.; Tsvetkova, E.; Gaskov, A. Synergy Effect of Au and SiO2 Modification on SnO2 Sensor Properties in VOCs Detection in Humid Air. Nanomaterials 2020, 10, 813. [Google Scholar] [CrossRef]
  43. Gurwitz, R.; Cohen, R.; Shalish, I. Interaction of light with the ZnO surface: Photon induced oxygen “breathing,” oxygen vacancies, persistent photoconductivity, and persistent photovoltage. J. Appl. Phys. 2014, 115, 033701. [Google Scholar] [CrossRef] [Green Version]
  44. Greczynski, G.; Hultman, L. X-ray photoelectron spectroscopy: Towards reliable binding energy referencing. Prog. Mater. Sci. 2020, 107, 100591. [Google Scholar] [CrossRef]
  45. Pei, Z.; Ding, L.; Hu, J.; Weng, S.; Zheng, Z.; Huang, M.; Liu, P. Defect and its dominance in ZnO films: A new insight into the role of defect over photocatalytic activity. Appl. Catal. B Environ. 2013, 142–143, 736–743. [Google Scholar] [CrossRef]
  46. Krzywiecki, M.; Grządziel, L.; Sarfraz, A.; Iqbal, D.; Szwajca, A.; Erbe, A. Zinc oxide as a defect-dominated material in thin films for photovoltaic applications—experimental determination of defect levels, quantification of composition, and construction of band diagram. Phys. Chem. Chem. Phys. 2015, 17, 10004–10013. [Google Scholar] [CrossRef] [Green Version]
  47. Diallo, A.; Ngom, B.D.; Park, E.; Maaza, M. Green synthesis of ZnO nanoparticles by Aspalathus linearis: Structural & optical properties. J. Alloy. Compd. 2015, 646, 425–430. [Google Scholar] [CrossRef]
  48. Steffy, K.; Shanthi, G.; Maroky, A.S.; Selvakumar, S. Synthesis and characterization of ZnO phytonanocomposite using Strychnos nux-vomica L. (Loganiaceae) and antimicrobial activity against multidrug-resistant bacterial strains from diabetic foot ulcer. J. Adv. Res. 2018, 9, 69–77. [Google Scholar] [CrossRef] [PubMed]
  49. Han, Y.J.; Kang, K.-T.; Ju, B.-K.; Cho, K.H. Effect of Time-Dependent Characteristics of ZnO Nanoparticles Electron Transport Layer Improved by Intense-Pulsed Light Post-Treatment on Hole-Electron Injection Balance of Quantum-Dot Light-Emitting Diodes. Materials 2020, 13, 5041. [Google Scholar] [CrossRef]
  50. Shao, M.; Liu, J.; Ding, W.; Wang, J.; Dong, F.; Zhang, J. Oxygen vacancy engineering of self-doped SnO2−x nanocrystals for ultrasensitive NO2 detection. J. Mater. Chem. C 2020, 8, 487–494. [Google Scholar] [CrossRef]
  51. Daiyan, R.; Lovell, E.C.; Bedford, N.M.; Saputera, W.H.; Wu, K.; Lim, S.; Horlyck, J.; Ng, Y.H.; Lu, X.; Amal, R. Modulating Activity through Defect Engineering of Tin Oxides for Electrochemical CO 2 Reduction. Adv. Sci. 2019, 6, 1900678. [Google Scholar] [CrossRef] [PubMed] [Green Version]
  52. Sharma, B.; Sharma, A.; Joshi, M.; Myung, J.-H. Sputtered SnO2/ZnO Heterostructures for Improved NO2 Gas Sensing Properties. Chemosensors 2020, 8, 67. [Google Scholar] [CrossRef]
  53. Yang, L.; Zhao, Q.; Willander, M.; Liu, X.; Fahlman, M.; Yang, J. Origin of the surface recombination centers in ZnO nanorods arrays by X-ray photoelectron spectroscopy. Appl. Surf. Sci. 2010, 256, 3592–3597. [Google Scholar] [CrossRef] [Green Version]
  54. Al-Gaashani, R.; Radiman, S.; Daud, A.; Tabet, N.; Al-Douri, Y. XPS and optical studies of different morphologies of ZnO nanostructures prepared by microwave methods. Ceram. Int. 2013, 39, 2283–2292. [Google Scholar] [CrossRef]
  55. Guillén, G.G.; Palma, M.I.M.; Krishnan, B.; Avellaneda, D.; Castillo, G.; Das Roy, T.; Shaji, S. Structure and morphologies of ZnO nanoparticles synthesized by pulsed laser ablation in liquid: Effects of temperature and energy fluence. Mater. Chem. Phys. 2015, 162, 561–570. [Google Scholar] [CrossRef]
  56. Marrani, A.G.; Caprioli, F.; Boccia, A.; Zanoni, R.; Decker, F. Electrochemically deposited ZnO films: An XPS study on the evolution of their surface hydroxide and defect composition upon thermal annealing. J. Solid State Electrochem. 2013, 18, 505–513. [Google Scholar] [CrossRef]
  57. Zehani, E.; Hassani, S.; Vigneron, J.; Etcheberry, A.; Galtier, P.; Sallet, V.; Lusson, A. Reconstruction of perfect ZnO nanowires facets with high optical quality. Appl. Surf. Sci. 2017, 411, 374–378. [Google Scholar] [CrossRef]
  58. Moretti, G. The Wagner plot and the Auger parameter as tools to separate initial- and final-state contributions in X-ray photoemission spectroscopy. Surf. Sci. 2013, 618, 3–11. [Google Scholar] [CrossRef]
  59. McAleer, J.F.; Moseley, P.T.; Norris, J.O.W.; Williams, D.E. Tin dioxide gas sensors. Part 1.—Aspects of the surface chemistry revealed by electrical conductance variations. J. Chem. Soc. Faraday Trans. 1 1987, 83, 1323–1346. [Google Scholar] [CrossRef]
  60. Comini, E.; Guidi, V.; Malagu’, C.; Martinelli, G.; Pan, Z.; Sberveglieri, G.; Wang, Z.L. Electrical Properties of Tin Dioxide Two-Dimensional Nanostructures. J. Phys. Chem. B 2004, 108, 1882–1887. [Google Scholar] [CrossRef]
  61. Shimanoe, K.; Ikari, K.; Shimizu, Y.; Yamazoe, N. STM observation of SnO2 (110) thermal-treated under oxidative condition. Sens. Actuators B Chem. 2006, 118, 90–93. [Google Scholar] [CrossRef]
  62. Francioso, L.; Forleo, A.; Capone, S.; Epifani, M.; Taurino, A.M.; Siciliano, P.A. Nanostructured In2O3–SnO2 sol–gel thin film as material for NO2 detection. Sens. Actuators B Chem. 2006, 114, 646–655. [Google Scholar] [CrossRef]
Figure 1. The measuring setup to study the gas-sensing performance of the ZnO-SnO2 films: 1—a gas mixture generator; 2—a source-meter; 3—a configurator; 4—a power supply; 5—a measuring chamber; 6—calibration gas mixtures at balloons; 7—a personal computer (PC), 8—the sensor sample; 9—probes; 10—a heater; 11—a gas flow divider; 12—a gas supply input.
Chemosensors 09 00124 g001
Figure 2. XRD patterns of ZnO-SnO2 films under study: pure ZnO (curve a), Sn:Zn = 0.5:99.5 (curve b), Sn:Zn = 1:99 (curve c), Sn:Zn = 5:95 (curve d).
Chemosensors 09 00124 g002
Figure 3. SEM images of surface and particles size distribution in ZnO-SnO2 films: ZnO (a), Sn:Zn = 0.5:99.5 (b), Sn:Zn = 1:99 (c), and Sn:Zn = 5:95 (d).
Chemosensors 09 00124 g003
Figure 4. Conductivity dependences of the of ZnO-SnO2 films with the Sn:Zn ratio equal to 0:100 (1), 0.5: 99.5 (2), 1: 99 (3), 5: 95 (4) on the reverse temperature.
Chemosensors 09 00124 g004
Figure 5. Optical absorption spectra for ZnO-SnO2 materials: ZnO (curve 1), Sn:Zn = 0.5:99.5 (curve 2), Sn:Zn = 1:99 (curve 3), Sn:Zn = 5:95 (curve 4).
Chemosensors 09 00124 g005
Figure 6. The estimation of the band gap for ZnO-SnO2 materials: ZnO (a), Sn:Zn = 0.5:99.5 (b), Sn:Zn = 1:99 (c), Sn:Zn = 5:95 (d).
Chemosensors 09 00124 g006
Figure 7. Survey spectra of pure ZnO and ZnO-SnO2 samples with Sn:Zn = 0.5:99.5, Sn:Zn = 1:99, Sn:Zn = 5:95 ratios (a), atomic concentration of presented elements (b), high-resolution spectra of C 1s (c).
Chemosensors 09 00124 g007
Figure 8. High-resolution spectra of thin ZnO-SnO2 films materials ZnO, Sn:Zn = 0.5:99.5, Sn:Zn = 1:99, Sn:Zn = 5:95. High-resolution spectra of O 1s (a), Sn 3d5/2 (b), Zn 2p3/2 (c).
Chemosensors 09 00124 g008
Figure 9. Spectra of Auger electron series of Zn LMM (a), Sn MNN (b) of thin ZnO-SnO2 films materials ZnO, Sn:Zn = 0.5:99.5, Sn:Zn = 1:99, Sn:Zn = 5:95 and Wagner plot (c). Green dotted lines correspond to hydroxide groups, and red to oxide ones; the bold dots correspond to modified Auger parameters, respectively.
Chemosensors 09 00124 g009
Figure 10. Dependence of the relative concentrations of hydroxide groups -OH and vacancies VO on the Sn:Zn ratio in the ZnO-SnO2 films.
Chemosensors 09 00124 g010
Figure 11. The dependence of the gas response of ZnO-SnO2 films with various Sn content to NO2 at concentrations of 5 ppm (1), 10 ppm (2), and 50 ppm (3) (a) and the typical R(t) response of ZnO-SnO2 films: ZnO (1), Sn:Zn = 0.5:99.5 (2), Sn:Zn = 1:99 (3), Sn:Zn = 5:95 (4) when exposed to the 50 ppm of NO2 at an operating temperature of 200 °C (b).
Chemosensors 09 00124 g011
Table 1. Characteristics of ZnO-SnO2 films obtained by solid-phase low-temperature pyrolysis technique.
MaterialZnOSn:Zn = 0.5:99.5 Sn:Zn = 1:99Sn:Zn = 5:95
Ea, eV0.780.710.650.60
Eg, eV3.303.283.303.32
Vb, eV0.710.680.580.73
DXRD, nm14101415
DSEM, nm13121316
Table 2. The values of the components binding energies for the photoelectron lines of O 1s in zinc and tin oxides.
Bond, eVPresent ResearchOther Studies
Sn:Zn = 0:100Sn:Zn = 0.5:99.5Sn:Zn = 1:99Sn:Zn = 5:95[45][46][50][51][57]
Zn-O530.08529.88530.00529.88530.1531 530.6
SnO2-530.31530.31530.31- 530.3531
VO,
-OH
531.28531.10531.02531.00531.3; 532532.5530.8532; 533531
C-O531.79531.50531.60531.40 532.4
C=O532.35532.30532.20531.86
Publisher’s Note: MDPI stays neutral with regard to jurisdictional claims in published maps and institutional affiliations.

