Article

Non-Local Patch Regression Algorithm-Enhanced Differential Photoacoustic Methodology for Highly Sensitive Trace Gas Detection

1
School of Physics and Optoelectronic Engineering, Xidian University, Xi’an 710071, China
2
Xi’an Key Laboratory of Computational Imaging, Xi’an 710071, China
3
Center for Advanced Diffusion-Wave and Photoacoustic Technologies (CADIPT), Department of Mechanical and Industrial Engineering, University of Toronto, Toronto, ON M5S 3G8, Canada
*
Author to whom correspondence should be addressed.
Chemosensors 2021, 9(9), 268; https://doi.org/10.3390/chemosensors9090268
Submission received: 12 July 2021 / Revised: 8 September 2021 / Accepted: 16 September 2021 / Published: 18 September 2021
(This article belongs to the Section Nanostructures for Chemical Sensing)

Abstract

:
A non-local patch regression (NLPR) denoising-enhanced differential broadband photoacoustic (PA) sensor was developed for the high-sensitive detection of multiple trace gases. Using the edge preservation index (EPI) and signal-to-noise ratio (SNR) as a dual-criterion, the fluctuation was dramatically suppressed while the spectral absorption peaks were maintained by the introduction of a NLPR algorithm. The feasibility of the broadband framework was verified by measuring the C2H2 in the background of ambient air. A normalized noise equivalent absorption (NNEA) coefficient of 6.13 × 10⁻¹¹ cm−1·W·Hz−1/2 was obtained with a 30-mW globar source and a SNR improvement factor of 23. Furthermore, the simultaneous multiple-trace-gas detection capability was determined by measuring C2H2, H2O, and CO2. Following the guidance of single-component processing, the NLPR processed results showed higher EPI and SNR compared to the spectra denoised by the wavelet method and the non-local means algorithm. The experimentally determined SNRs of the C2H2, H2O, and CO2 spectra were improved by a factor of 20. The NNEA coefficient reached a value of 7.02 × 10⁻¹¹ cm−1·W·Hz−1/2 for C2H2. The NLPR algorithm presented good performance in noise suppression and absorption peak fidelity, which offered a higher dynamic range and was demonstrated to be an effective approach for trace gas analysis.

1. Introduction

There is an ever-increasing need for non-destructive and rapid monitoring technologies for multiple trace gas species and their concentrations in the fields of environmental protection, medical diagnosis, industrial production, and food safety [1,2]. Photoacoustic spectroscopy (PAS) based technologies [3,4,5,6] feature the advantages of fast response, high sensitivity, high selectivity, and a large dynamic detection range and have thus played an important role in multi-component gas sensing. The basic principle of PAS is that the gas molecules absorb the light energy at specific wavelengths and cause the local temperature to increase. Combined with the periodic modulation of the light source, the gas temperature thermally diffuses to generate pressure oscillations and acoustic signals [7]. Up until now, various PAS-based sensor modalities have been developed for multi-gas analysis, such as the use of multi-lasers combined time-division multiplexing methods [8,9,10], multi-resonators with various frequency demodulation schemes [11], and broadband detection-based thermal emitters or blackbody radiators using several band-pass filters [12]. However, use of multiple lasers yields narrowband wavelength selection for specific gas absorption, limiting the capability to simultaneously detect multiple gases. There is an increasing interest in the combination of PAS systems and Fourier transform infrared (FTIR) spectrometers [13,14], which is due to their high selectivity and broadband detection ability. Compared to laser-based PAS methods, the broadband FTIR spectrum is more suitable for covering the absorption bands of multiple gas species during simultaneous measurements, which generate a wide dynamic measurement range and reduce the radiation risk. Recently, a step-scan differential Fourier transform infrared photoacoustic spectroscopy (DFTIR-PAS) modality [15] was developed to eliminate the adverse effects of coherent noise and strongly overlapped background gases, thereby revealing hidden weak absorptions. However, due to the relatively poor intensity of the broadband source (on the order of several μW/wavenumber), the weak PA signal was sensitively affected by the incoherent noise, including the thermal noise and electronical noise, which was a major obstacle to highly sensitive detection [16]. An optimized system (hardware and software) should lower the overall noise level, suppress baselines, and thus offer a higher dynamic range for spectroscopic measurements without losing molecular absorption signatures. Therefore, there is a strong need to improve the DFTIR-PAS detection precision for multi-gas sensing and well-adapted and -executed denoising algorithms that can be applied to measured spectroscopic data processing, which is crucial for attaining this goal [17,18].
Conventional denoising algorithms for absorption spectra processing, such as the Savitzky–Golay filter [19], moving average [20,21], and wavelet transforms (WT) [22,23,24,25], have improved the SNR to some extent by suppressing noise levels. However, these methods also cause useful absorption information deterioration without the consideration of spectral peak fidelity. The loss of absorption peak features results in large residuals for concentration prediction and deteriorates the accuracy of gas analysis [21,22]. The Lorentz-broadened spectrum of gas molecules can be obtained by FTIR, which is different from 2f wavelength modulation spectroscopy. For the calibrated DFTIR-PAS gas sensor, the spectral absorption peak fidelity is not only the signal peak values but also the absorption profiles of the spectrum. As a result, there is an additional considerable need to develop a denoising algorithm so as to further preserve the absorption peak information with high SNR improvement, especially when dealing with the complex spectra for multi-component gas detection. A non-local patch regression (NLPR) algorithm, based on the well-known non-local means (NLM) algorithm is proposed to avoid over-smoothing and the loss of data information under large smoothing parameters in PA signal processing by solving the optimization framework from the patch distribution [26,27,28,29].
In this paper, a NLPR denoising-module-enhanced DFTIR-PAS gas sensor was developed for the highly sensitive and selective detection of multi-component trace gas mixtures. The dual optical path differential PA system was equipped with a globar source, a Michelson interferometer, two identical T-type photoacoustic resonators, and a data processing unit, which were assembled to collect differential PA signals after interacting with the trace gases. With the help of the NLPR denoising module, the highly sensitive simultaneous detection capability for measuring C2H2, H2O, and CO2 was determined. The edge preservation index (EPI) representing the spectral absorption peak fidelity and the SNR were used as dual criteria to develop critical denoising parameter selection. Although the enhanced DTIR-PAS system was configured with limited optical power, we observed considerable SNR improvement with the NLPR technique. The feasibility of the spectral processing method for noise suppression and absorption peak fidelity was verified in both single-component and multi-component applications.

2. NLPR Algorithm Enhanced DFTIR-PAS Configuration and Theory

2.1. Experimental Setup and System Noise Analysis

A schematic of the proposed step-scan DFTIR-PAS configuration for trace gas sensing is shown in Figure 1a. The broadband globar with a total power of 30 mW and a spectral coverage of 1000–4000 cm−1 in an FTIR spectrometer was used as the incident source, where the intensity was approximately 30 μW at the target wavenumber for C2H2 detection. A FTIR spectrometer with 4 cm−1 spatial resolution is fundamentally based on the principle of a Michelson interferometer, which produces an interferogram. The incident beam was transmitted and reflected in alternation with a home-made high-reflectivity mirror chopper into the two identical T-type resonators. Thus, the light intensity was modulated with a 50% duty cycle, avoiding the beam splitter and ensuring maximum source intensity utilization. The sample cell was filled with a mixture of the target gas and laboratory air (RH: 45%), and the reference cell was sealed with laboratory air only. The resonant frequency for the two resonators was 342 Hz, and the Q factor was 83. All of the experiments for the two T-resonators were conducted at atmospheric pressure and room temperature. The pressure controller was used to monitor the pressure in the sample cell and to prevent pressure changes from affecting the experimental results. The acoustic signal was collected using microphones (Primo®, Tokyo, Japan, model EM158, 25 mV/Pa). The converted electrical signals were sent to the signal mixer and the lock-in amplifier (Stanford Research Systems®, Sunnyvale, CA, USA, model SR850) for differential processing. By subtracting the background signals caused by out-of-phase light modulation, the differential PA signals were extracted in the signal mixer. The spectral scanning and stabilization time of the step-scan FTIR was 1900 ms at each spectral data collection point, and the differential PA signals were collected with a 300 ms lock-in time constant. A denoising module integrates the NLPR algorithm to process the PA signals to further improve target gas detection. A data acquisition card was included in the denoising module. After collecting all of the PA amplitudes from one scanning period, the NLPR algorithm processed the measured PA signals with about 1830 ms. Both the amplitude and phase signals versus the time in the N2 buffer gas are shown in Figure 1b, which indicates a system stable time of 80 min. The original spectrum of the gas mixture of 100 ppm C2H2 and the laboratory air is shown in Figure 1c. The overall line shapes and profiles of the absorption peaks are consistent with the HITRAN simulation, except for the fact that the two peaks at 1297 cm−1 and 1347 cm−1 are different in height. The reasons for this could be the unevenly distributed power distribution of the globar source corresponding to the wavenumbers and cross-interference by water molecules. Although the main absorption peaks at 1297 cm−1, 1347 cm−1, 3226 cm−1, and 3303 cm−1 are distinguishable, there is a high background noise level. The SNR of the PA spectrum was 26.62, and the limit of quantitation (LoQ) (10σ) only achieved 37.57 ppm [15].
For the PAS-based gas sensor, the received PA signal is proportional to incident light intensity I 0 , photoacoustic cell constant F , gas volume concentration C , detector sensitivity R m i c , and gas absorption coefficient α ( υ ) . The system noise n s in the sample cell includes coherent noise, n c o h e r e n t , and incoherent noise, n i n c o h e r e n t . The coherent noise is the interference signal associated with the incident light. The incoherent noise refers to random background noise. The detection sensitivity of the PA signal in the sample cell is the minimum detectable gas concentration C s min at S N R = 1 , which can be expressed as
I 0 F C s min R m i c α ( υ ) = n s = n i n c o h e r e n t + n c o h e r e n t = [ n s t + n s e ] + [ n w i n d o w + n w a l l + n l i g h t ]
where the thermal noise n s t and electrical noise n s e both constitute the incoherent noise in the system; n w i n d o w and n w a l l represent the coherent noise caused by the incident light absorption or the scattering of the radiation on the optical window and the resonator wall, respectively; and n l i g h t is the coherent noise caused by the light fluctuation. An analytical expression of the noise n r in the reference cell can also be derived in a similar manner. In the differential mode PA system, the coherent noise generated in the two resonators is modulated by the mirror chopper. Therefore, the DFTIR-PAS detection sensitivity C d min is correlated to the differential noise, which is given by
I 0 F C d min R m i c α ( υ ) = n s + n r = n i n c o h e r e n t + n c o h e r e n t ( 1 + λ e i φ )
where n i n c o h e r e n t is the differential incoherent noise that cannot be suppressed, λ is the reflectance, and φ is the phase difference between the two PA cells. Note that if φ = π and λ 1 , which means an out-of-phase modulation of the incident light sources, the coherent noise in the system will be eliminated according to Euler’s formula. The mirror chopper used for the intensity modulation was coated with high reflectivity gold film, and the reflectance was 96.1%. By adjusting the PA phase difference between the two resonators, the coherent noise could be almost completely removed in the experiments. When the incident light, detector response, PA cell constant, and target gas are fixed, the sensitivity C d min is mainly controlled by n i n c o h e r e n t .
The incoherent noise cannot be eliminated by experimental procedures, a fact that constitutes a major obstacle to the further suppression of the system noise level and the improvement of trace gas detection. Therefore, a denoising module was added to the DFTIR-PAS configuration to improve the sensitivity.

2.2. Detection Precision and SNR Enhancement Based on NLPR Denoising

The SNR of the PA signals can be improved after denoising processing. However, the loss of the spectral absorption peak features will affect the gas absorption information and the concentration prediction. Patch-based denoising methods with non-locality can be used to address spectral peak fidelity degradation. Despite their popularity in image processing, they have received little attention in the case of one-dimensional signals obtained in gas analysis. To further preserve the absorption peak features and to improve the detection sensitivity, the NLPR algorithm was proposed for DFTIR-PAS gas analysis.
The NLPR algorithm, developed on the basis of the NLM algorithm, makes full use of the redundant information in the entire signal. For PA signals, the “patch” in NLPR processing can be regarded as a time series composed of PA amplitudes. Figure 2 shows the execution process of the basic NLPR algorithm. The large search window D ( s ) centered on the sampling point s is set. The neighborhood patch U ( t ) , which represents the sample sequence centered on t with a half width P in the PA signal, slides into the entire search window. The weights are obtained by solving the Euclidean distance between U ( t ) and another neighborhood patch U ( s ) . Different structural similarity determines different weights in the signal reconstruction process.
For a given noised-PA spectrum signal, assuming u s is the linear indexing of the patch U ( s ) , the sampling PA amplitudes can be regarded as the corrupted version of the true signal f s
u s = f s + n s
where n s is additive random noise. In the NLPR algorithm, the denoised patch U ^ ( s ) can be calculated by executing p regression [23] on the patch space as follows:
U ^ ( s ) = arg   min U t D ( s ) w s , t U U ( t ) p   ( 0 < p 2 )
where p is a sparse parameter called the “convex regime” of the optimization framework. It determines the capability for absorption peak feature preservation and noise suppression in NLPR processing. Note that when p = 2 , Equation (4) becomes the basic NLM algorithm because the NLM algorithm is implemented on the weighted average from the patch distribution. Therefore, the NLPR algorithm can be seen as an extension of the NLM algorithm. In particular, when 0 < p < 1 , the resulting estimator turns out to be robust to absorption information preservation and background noise suppression. For PA signals, an optimal p value needs to be determined to improve denoising performance.
The weight w s , t can be written as
w s , t = exp ( 1 h 2 U ( s ) U ( t ) 2 )
where h is the smoothing parameter. An improved smoothness can be achieved by increasing h. The selection of a specific h value should be proportional to the noise level [27,28].
The focus of the NLPR algorithm is on fixing smaller values p to better minimize the PA amplitude patch residuals U U ( t ) induced by the outliers. The PA amplitudes estimated by smaller patch residuals will lead to significant improvements in the denoising quality on noise suppression and spectral absorption peak fidelity.
To solve Equation (4), an iteratively reweighted least-squares (IRLS) algorithm [26] is put forward in NLPR in which the iterative solver must be initialized by NLM estimation. The Algorithm 1 procedure of PA spectrum signal denoising based on NLPR method is shown in Table 1. The details of NLPR robustness and the IRLS solver are described in the Appendix A.

3. Results and Analyses

3.1. Single Target Gas Analysis

In order to verify the spectral quality and SNR improvement of the NLPR algorithm-enhanced DFTIR-PAS gas sensor, 100 ppm C2H2 was used as the target gas due to its simple spectral structure and absorption profile. The dual criteria of EPI and SNR were introduced for the evaluation of the background noise suppression level and the spectral peak fidelity.
The EPI [30,31] was used to evaluate the denoised PA signal for spectral absorption peak fidelity. During the denoising procedure, a sample sequence N of absorption peaks was selected for evaluation. The EPI can be defined as
EPI = i N | u ^ ( i + 1 ) u ^ ( i ) | i N | u ( i + 1 ) u ( i ) |
where u and u ^ represent the noisy signal and the denoised signal, respectively, and i is the sample index of the selected absorption peaks. The value range of EPI is (0, 1). In general, the closer the EPI value is to 1, the better the absorption peak features are preserved. If the PA signal is not processed by the denoising algorithm, the EPI value can be regarded as the ratio of the same signals, resulting in a value of 1.
The SNR was used to evaluate the measurement sensitivity of the PAS sensor system at a specific environment temperature, gas concentration, laser power, and detection bandwidth
SNR = S noise   level
where S is the measured PA signal at the target wave number. The noise level is obtained by calculating the standard deviation between the experimental data and the best-fit straight line in the baseline at spectral locations with no gas absorption.
For the NLPR denoising process, the half-width D of the search window, the half-width P of the neighbor window, the smoothing parameter h , and the convex regime 0 < p 2 need to be analyzed for the behaviors of the SNR improvement and the preservation of the absorption peak feature. In this case, D = 500 was set to contain multiple potential absorption peaks and to enhance the non-local search capability. The selection of P should be similar to the feature size of interest [32]. Therefore, P = 10 was set to be around the half-width of the absorption peak. The two critical parameters h and p should be determined separately using the controlled variable method. To demonstrate the smoothing behavior of h , h = 6 σ and h = 15 σ were implemented in the basic NLM algorithm ( p = 2 ) according to Equation (4). The denoised results are shown in Figure 3a. The enlargement of region 1 shown in Figure 3b represents the absorption peaks around 1297 cm−1 and 1347 cm−1. The denoised result h = 6 σ exhibits a better absorption peak fidelity, and the EPI in the range of 1260–1390 cm−1 was 0.9921, which was calculated with the raw data, resulting in the red and blue lines almost overlapping. However, the denoised result h = 15 σ caused absorption peak deformation, for which the EPI was only 0.5226. This means that there is over-smoothing and absorption information loss for large h , and the spectral absorption peak fidelity presents a downward trend with increasing h . Figure 3c shows the enlargement of region 2, which represents the baseline between 3500 cm−1 and 3950 cm−1. The noise levels are 8.68 × 10⁻⁶ with h = 6 σ and 2.09 × 10⁻⁶ with h = 15 σ , which show the ability to improve background noise suppression with increasing h . The first set of experiments in Figure 3 shows that the high SNR and spectral peak fidelity are not compatible under the large smoothing parameters in the NLM algorithm. The NLPR algorithm focusing on the optimization framework of the patch distribution can improve spectral peak fidelity while suppressing background noise under large noise levels.
p is another critical parameter that needs to be taken into account besides the optimal choice of h . To compare the results under the variable parameters h and p , the sequence of the PA signals from 1260 cm−1 to 1390 cm−1 was selected to evaluate the EPI, and the PA signal ranging from 3500 cm−1 to 3950 cm−1 was used to calculate the noise level. All of the parameters except h and p were fixed during the implementation of NLPR in order to discuss the experimental behavior dependence on the SNR improvement and the spectral peak fidelity.
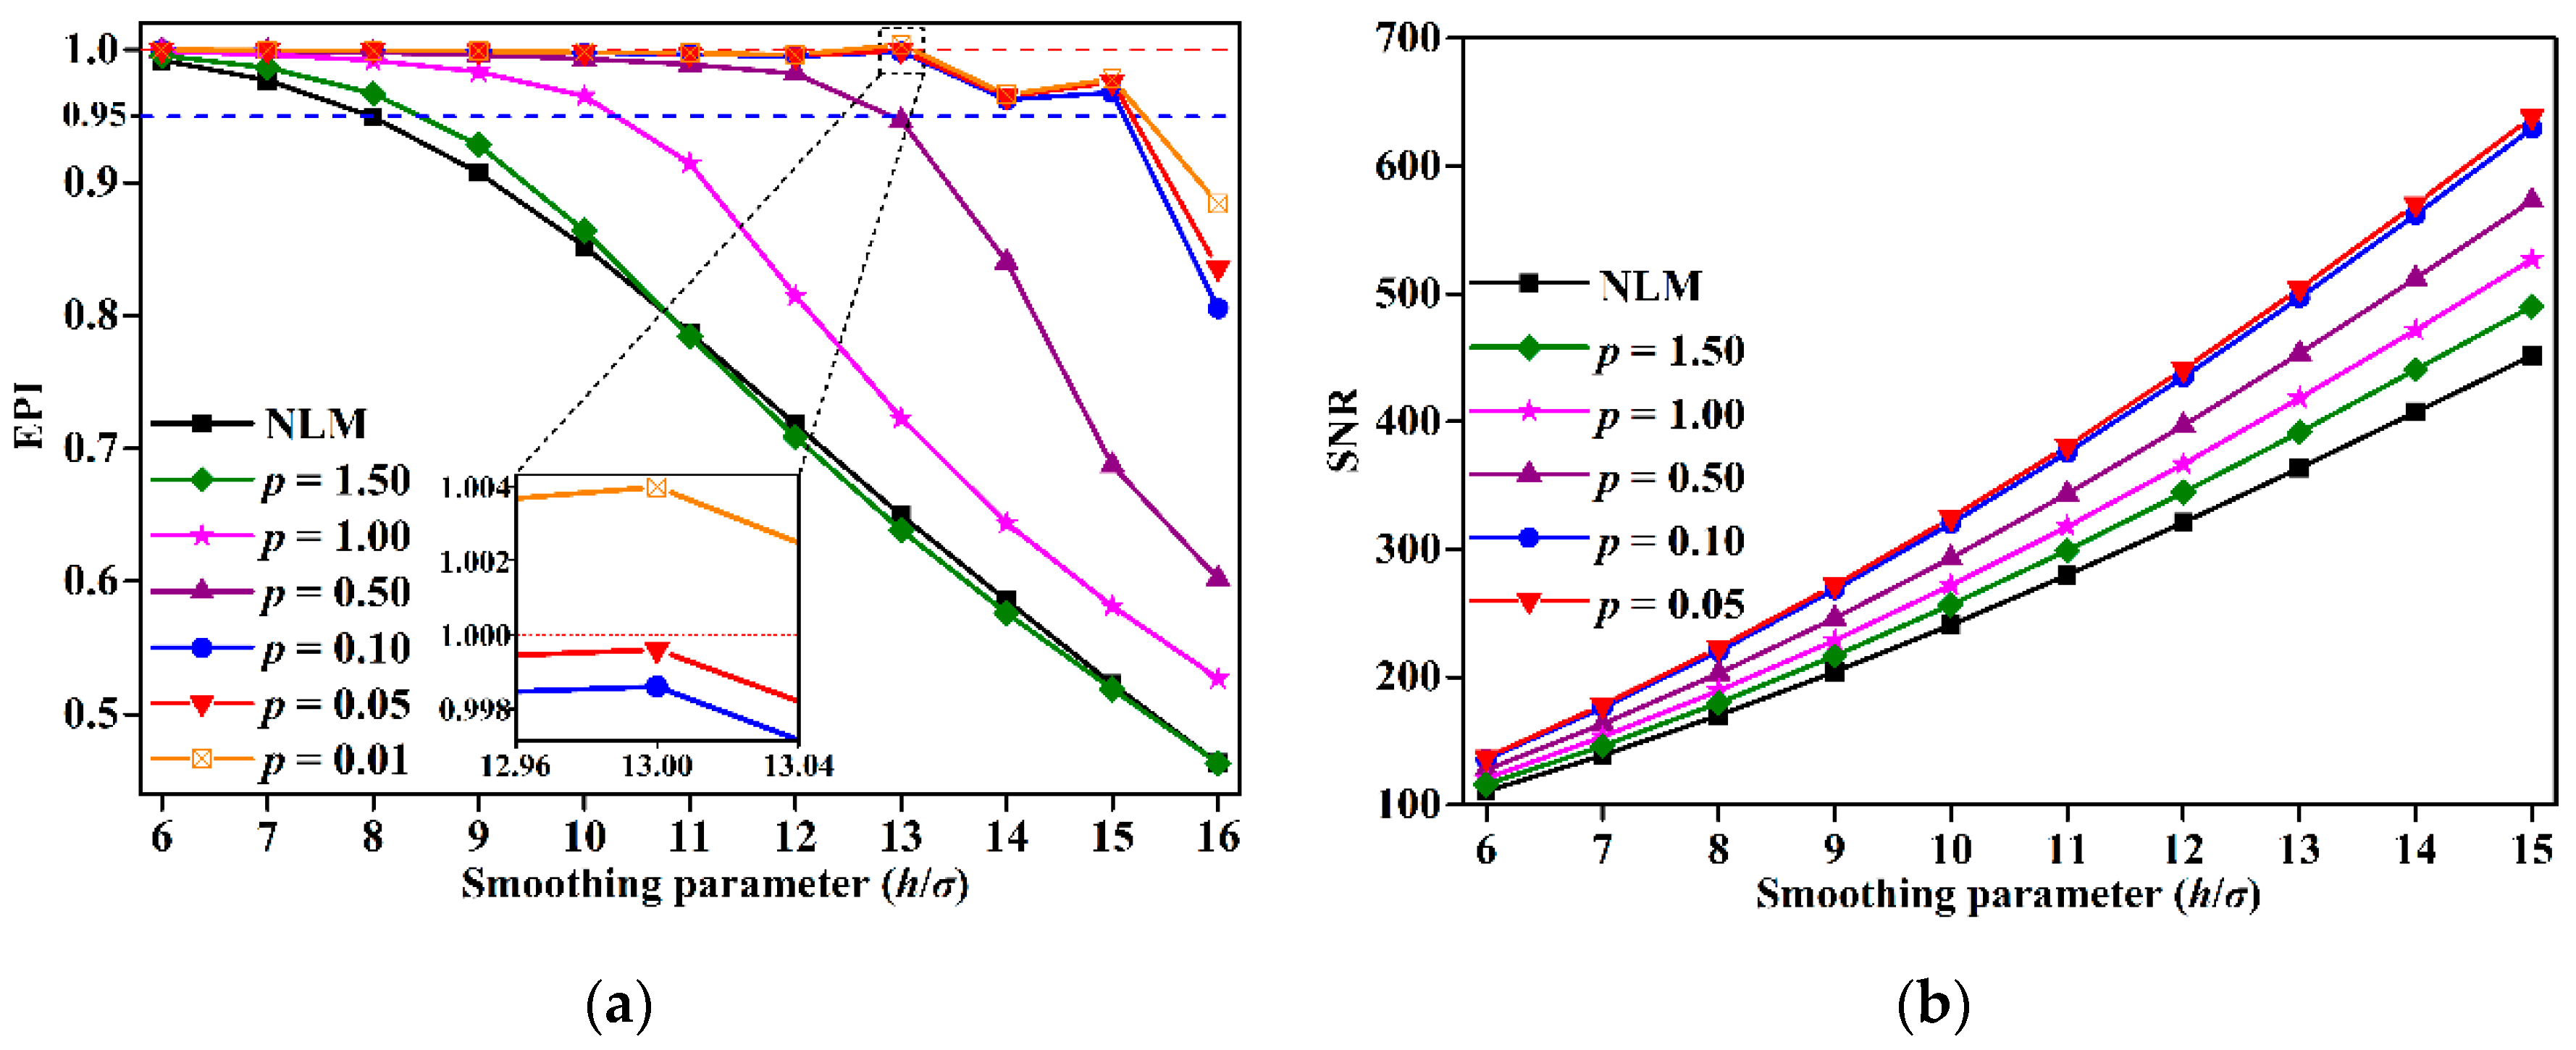
As shown in Figure 4a, the EPIs displayed a decreasing trend with increasing h . With the same h , the EPIs increase gradually as p trends towards zero, which indicates that the absorption peak preservation ability is improved with decreasing p . However, the p value cannot be infinitely small. Note that for p < 0.1 , the EPIs barely increase, with minimal or no benefit on the spectral absorption peak fidelity. In the insert diagram, for the EPI value p = 0.01 and h = 13 σ for the absorption peaks in the range of 1260–1390 cm−1, there is an apparent error (EPI > 1) that is outside of the acceptable range. This is a problem caused by local convergence and nondeterministic polynomial issues as well as other parameter constraints during NLPR processing.
For a calibrated system without denoising, the PA signal vs. gas concentration can achieve a good linear fitting relationship. The profiles of the absorption peaks were less affected by the incoherent noise above a certain concentration. Due to the randomness and the disorder of the background noise, denoising algorithms cannot achieve a PA signal reduction that matches the incoherent noise perfectly at each point. Instead of reducing the measured signals, it is better to preserve the absorption peak values and spectrum profiles simultaneously during the denoising process. Meanwhile, the EPI was set artificially to be no less than 0.95 to ensure better performance in improving the spectral peak fidelity and to find a smooth limit so as to maximize the smoothing with minimal absorption peak information loss. Therefore, the results of p < 0.05 and h > 15 σ were abandoned during the SNR evaluation. As shown in Figure 4b, the SNR displays general improvement with increasing h . In addition to the main effect of improving the spectral absorption peak fidelity, it was found that the noise levels are further suppressed with decreasing p . The absorption features are diverse for various absorption lines, and the preservation ability for each absorption peak is different under the same denoising parameters. Thus, it is not appropriate to make the denoised signal residuals consistent with the noise residuals. As a result, p = 0.05 and h = 15 σ were selected to implement the optimal NLPR algorithm for PA signal processing. The EPI of the absorption peaks in the range of 1280–1390 cm−1 was >0.96, and the SNR of the PA signal was improved to 633.47 compared to 26.62, which was the value from the original data.
Due to the good time-frequency localization characteristics and the simple implementation, the WT method has been widely employed in the field of gas analysis [21,22,23,24]. In order to preserve absorption peak features for comparison, a hard threshold wavelet denoising method was applied to process the differential PA spectrum. In our experiment, the optimal parameters such as wavelet mother function “sym5”, global unified threshold “sqtwolog”, and 6 layer decomposition (“sym5”, “sqtwolog”, 6) [16], was implemented. Figure 5a shows a comparison of the denoised results with the NLPR method and the hard threshold wavelet denoising method. The NLPR exhibited better performance in improving the SNR while preserving the absorption peaks. The wavelet method was only able to achieve the SNR of 150.22 and resulted in a pseudo Gibbs phenomenon due to the discontinuous threshold function. The trends in the spectral peak fidelity and the noise suppression are described as follows: The enlargement of region 1, which revealed the absorption peaks in the range of 1280–1390 cm−1, is shown in Figure 5b. The EPI value of 0.9670 was acquired after NLPR processing under the large smoothing parameter, and the blue and red lines mostly overlap in the high-amplitude region. However, the wavelet method only obtained an EPI value of 0.9319, which demonstrated that the NLPR provides better absorption peak preservation and that there is no absorption peak shift. The baseline from 3500 cm−1 to 3950 cm−1 is presented in Figure 5c. The NLPR achieved a lower noise level of 1.50 × 10⁻⁶ than the wavelet method, which achieved a noise level of 4.90 × 10⁻⁶. Finally, the wavelet method obtained a NNEA coefficient of 2.54 × 10⁻¹⁰ cm−1·W·Hz−1/2, and the NLPR algorithm-enhanced system achieved a NNEA coefficient of 6.13 × 10⁻¹¹ cm−1·W·Hz−1/2, a 23-fold SNR improvement over the raw data and two times better than the result processed by the wavelet method.
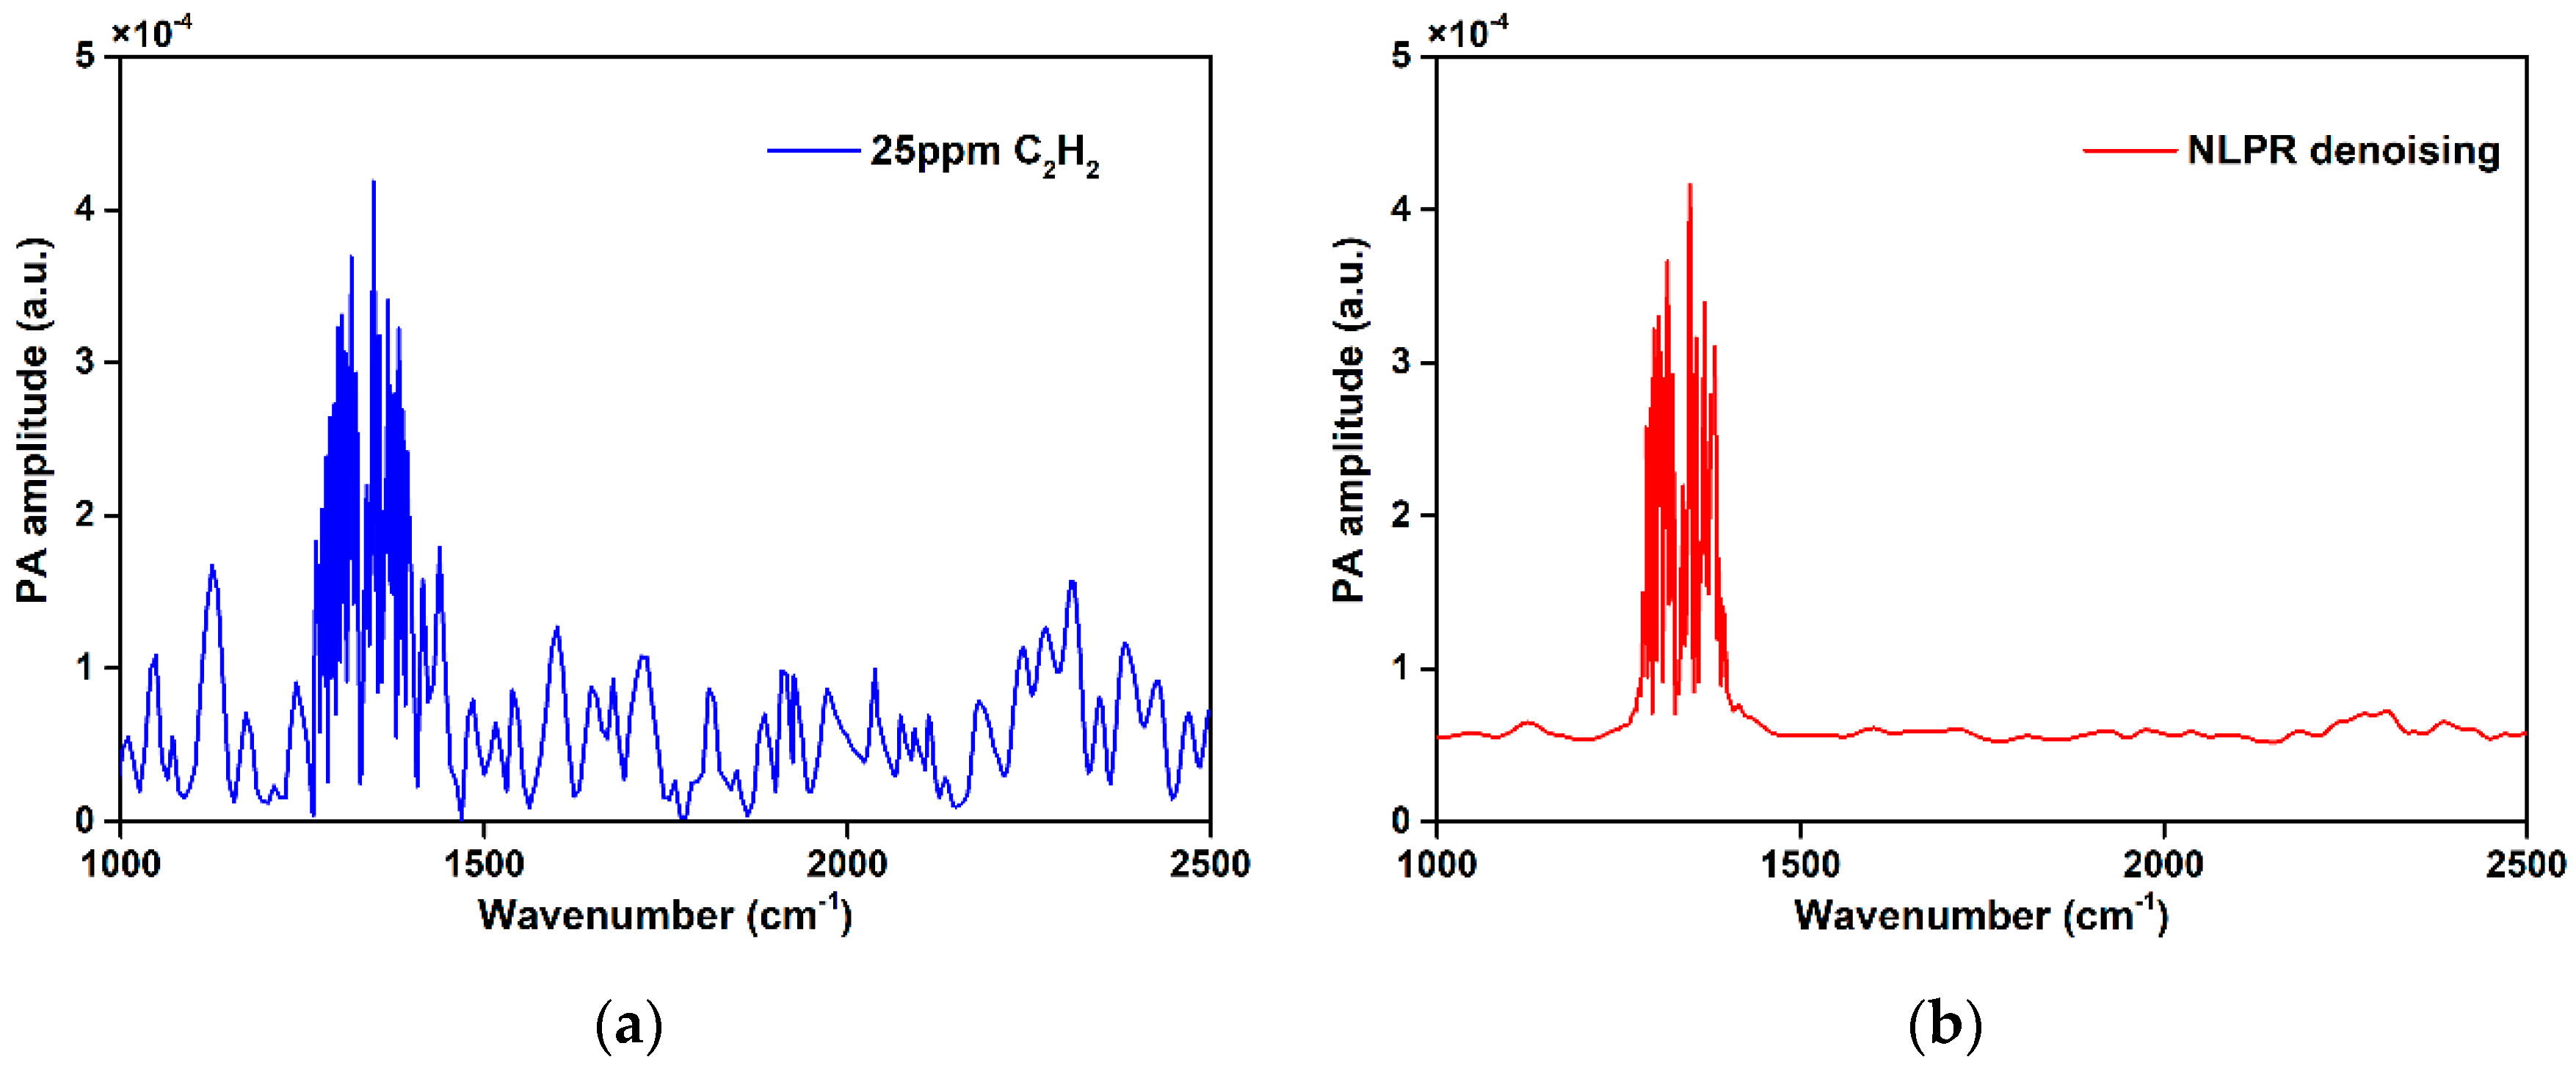
Figure 6a shows the PA spectrum obtained by the upgraded DFTIR-PAS sensor with the 25 ppm C2H2, which is lower than the original LoQ (10σ) concentration before filtering (37.57 ppm). In the case of 25 ppm C2H2, the PA signal amplitudes are still higher than those at the baselines. The spectrum denoised by NLPR algorithm processing is given in Figure 6b, and the absorption peaks are more clearly distinguishable than the background noise, which is helpful for quantitative analysis and accuracy improvement. The SNR of the PA spectrum improved from 7.63 to 113.52, and the Kurtosis index K [21] improved from 7.61 to 19.86. The K value obtained by NLPR indicates the better quality of spectral signals and the better gas absorption detectability for the enhanced system. The results show that the NLPR algorithm can effectively improve quantization accuracy and measurement precision, which offers a higher dynamic range and improves the LoQ (10σ) for trace gas analysis.
Table 2 shows a comparison between the NLPR-enhanced DFTIR-PAS configuration and other laser-based PAS methods. Scaling to equivalent incident light intensity, spectrum processing by the NLPR algorithm achieved a higher detection precision than that of laser-based methods. The long-standing problem of using a broadband source is the weak optical power density, resulting in lower precision than laser-based methods. By introducing the NNEA coefficient, the effectiveness of our NLPR algorithm-enhanced broadband system was determined. Moreover, multiple lasers and multiplexing systems are essential for laser-based multi-component gas detection. Broadband simultaneous detection is the inherent advantage of FTIR; the improved detection precision and dynamic range by the NLPR algorithm will increase the application prospects of DFTIR-PAS systems. The NLPR algorithm guarantees significantly improved noise level suppression performance and effective absorption peak fidelity. Moreover, the SNR improvement achieved by this method compensates for the weak brightness of DFTIR-PAS.

3.2. Multi-Component Gas Analysis

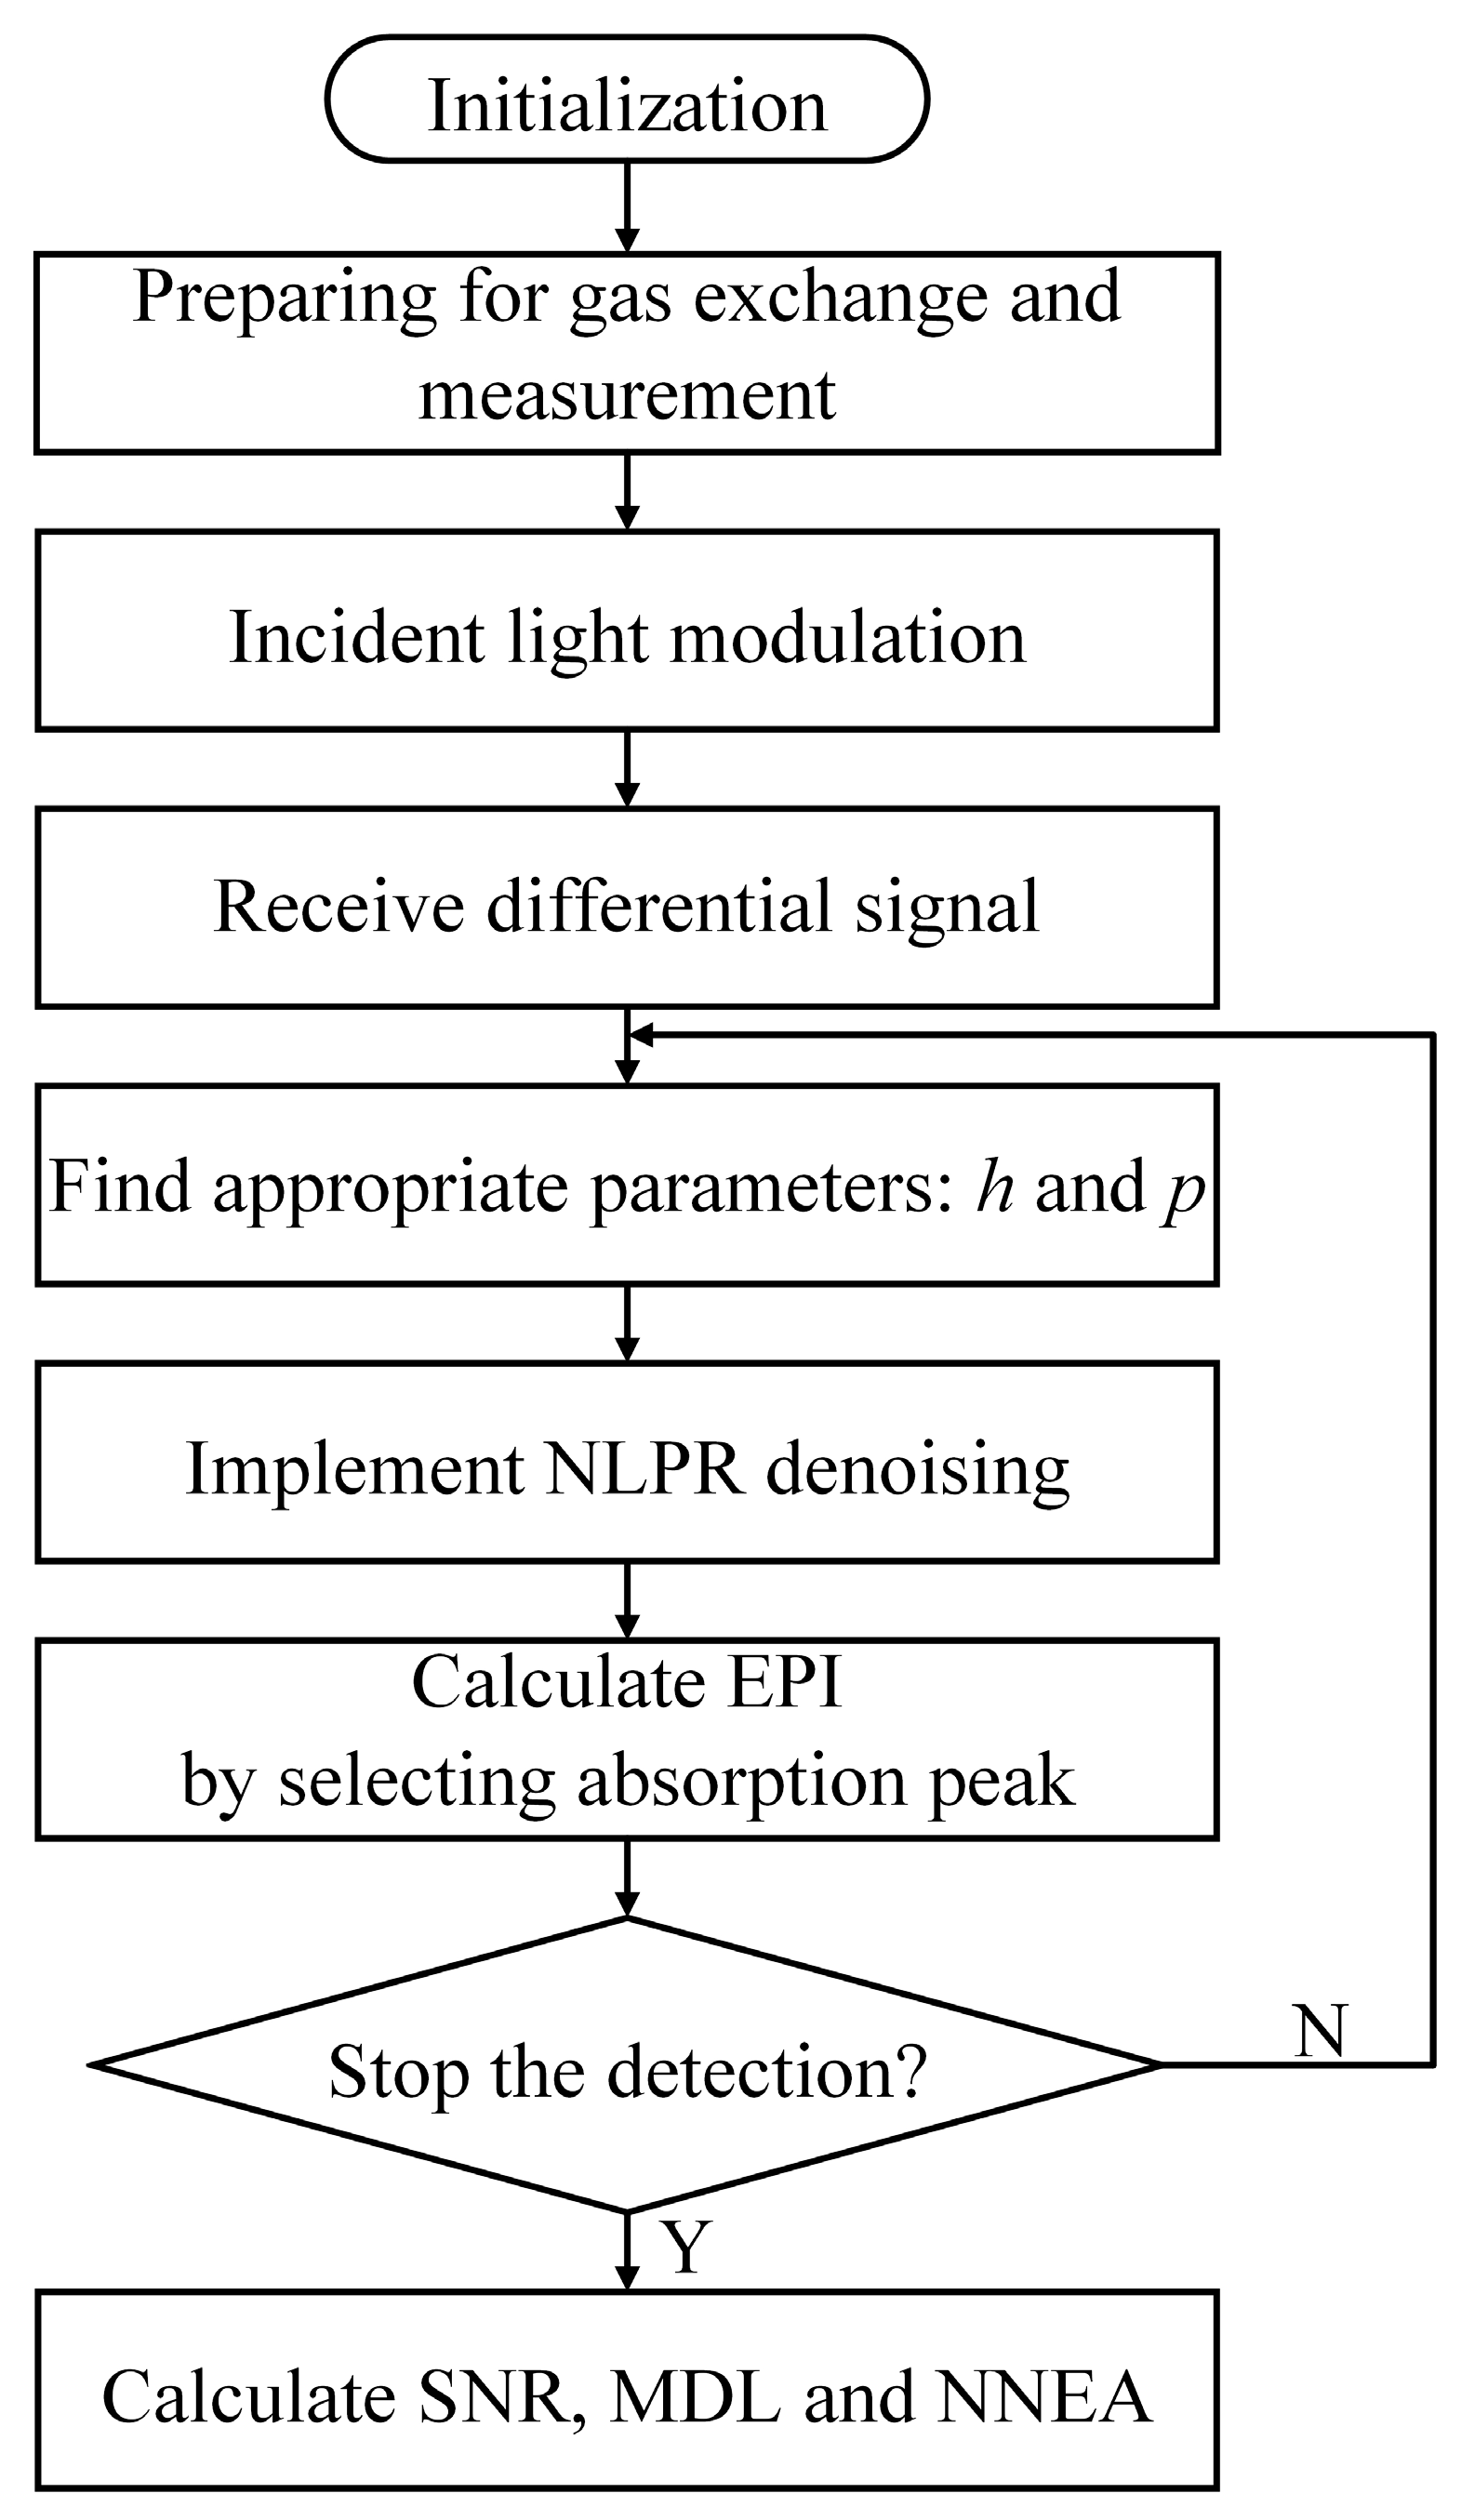
The main detection procedure for multi-component gas analysis is shown in the flowchart of Figure 7, according to the denoising process of the single component spectrum. First, the experimental parameters were initialized after powering up the system. Then, the target gas was filled, and the incident light was also guided into both PA cells. Next, the lock-in amplifier and the data storage units were used to collect and store the PA signals. After receiving the noisy spectroscopic data, the NLPR algorithm was implemented, and the EPI was calculated to determine spectral absorption peak fidelity so as to optimize the denoising parameters. If the EPI exceeded 0.95 as the h increased and p decreased to 0.05, then the detection procedure was completed.
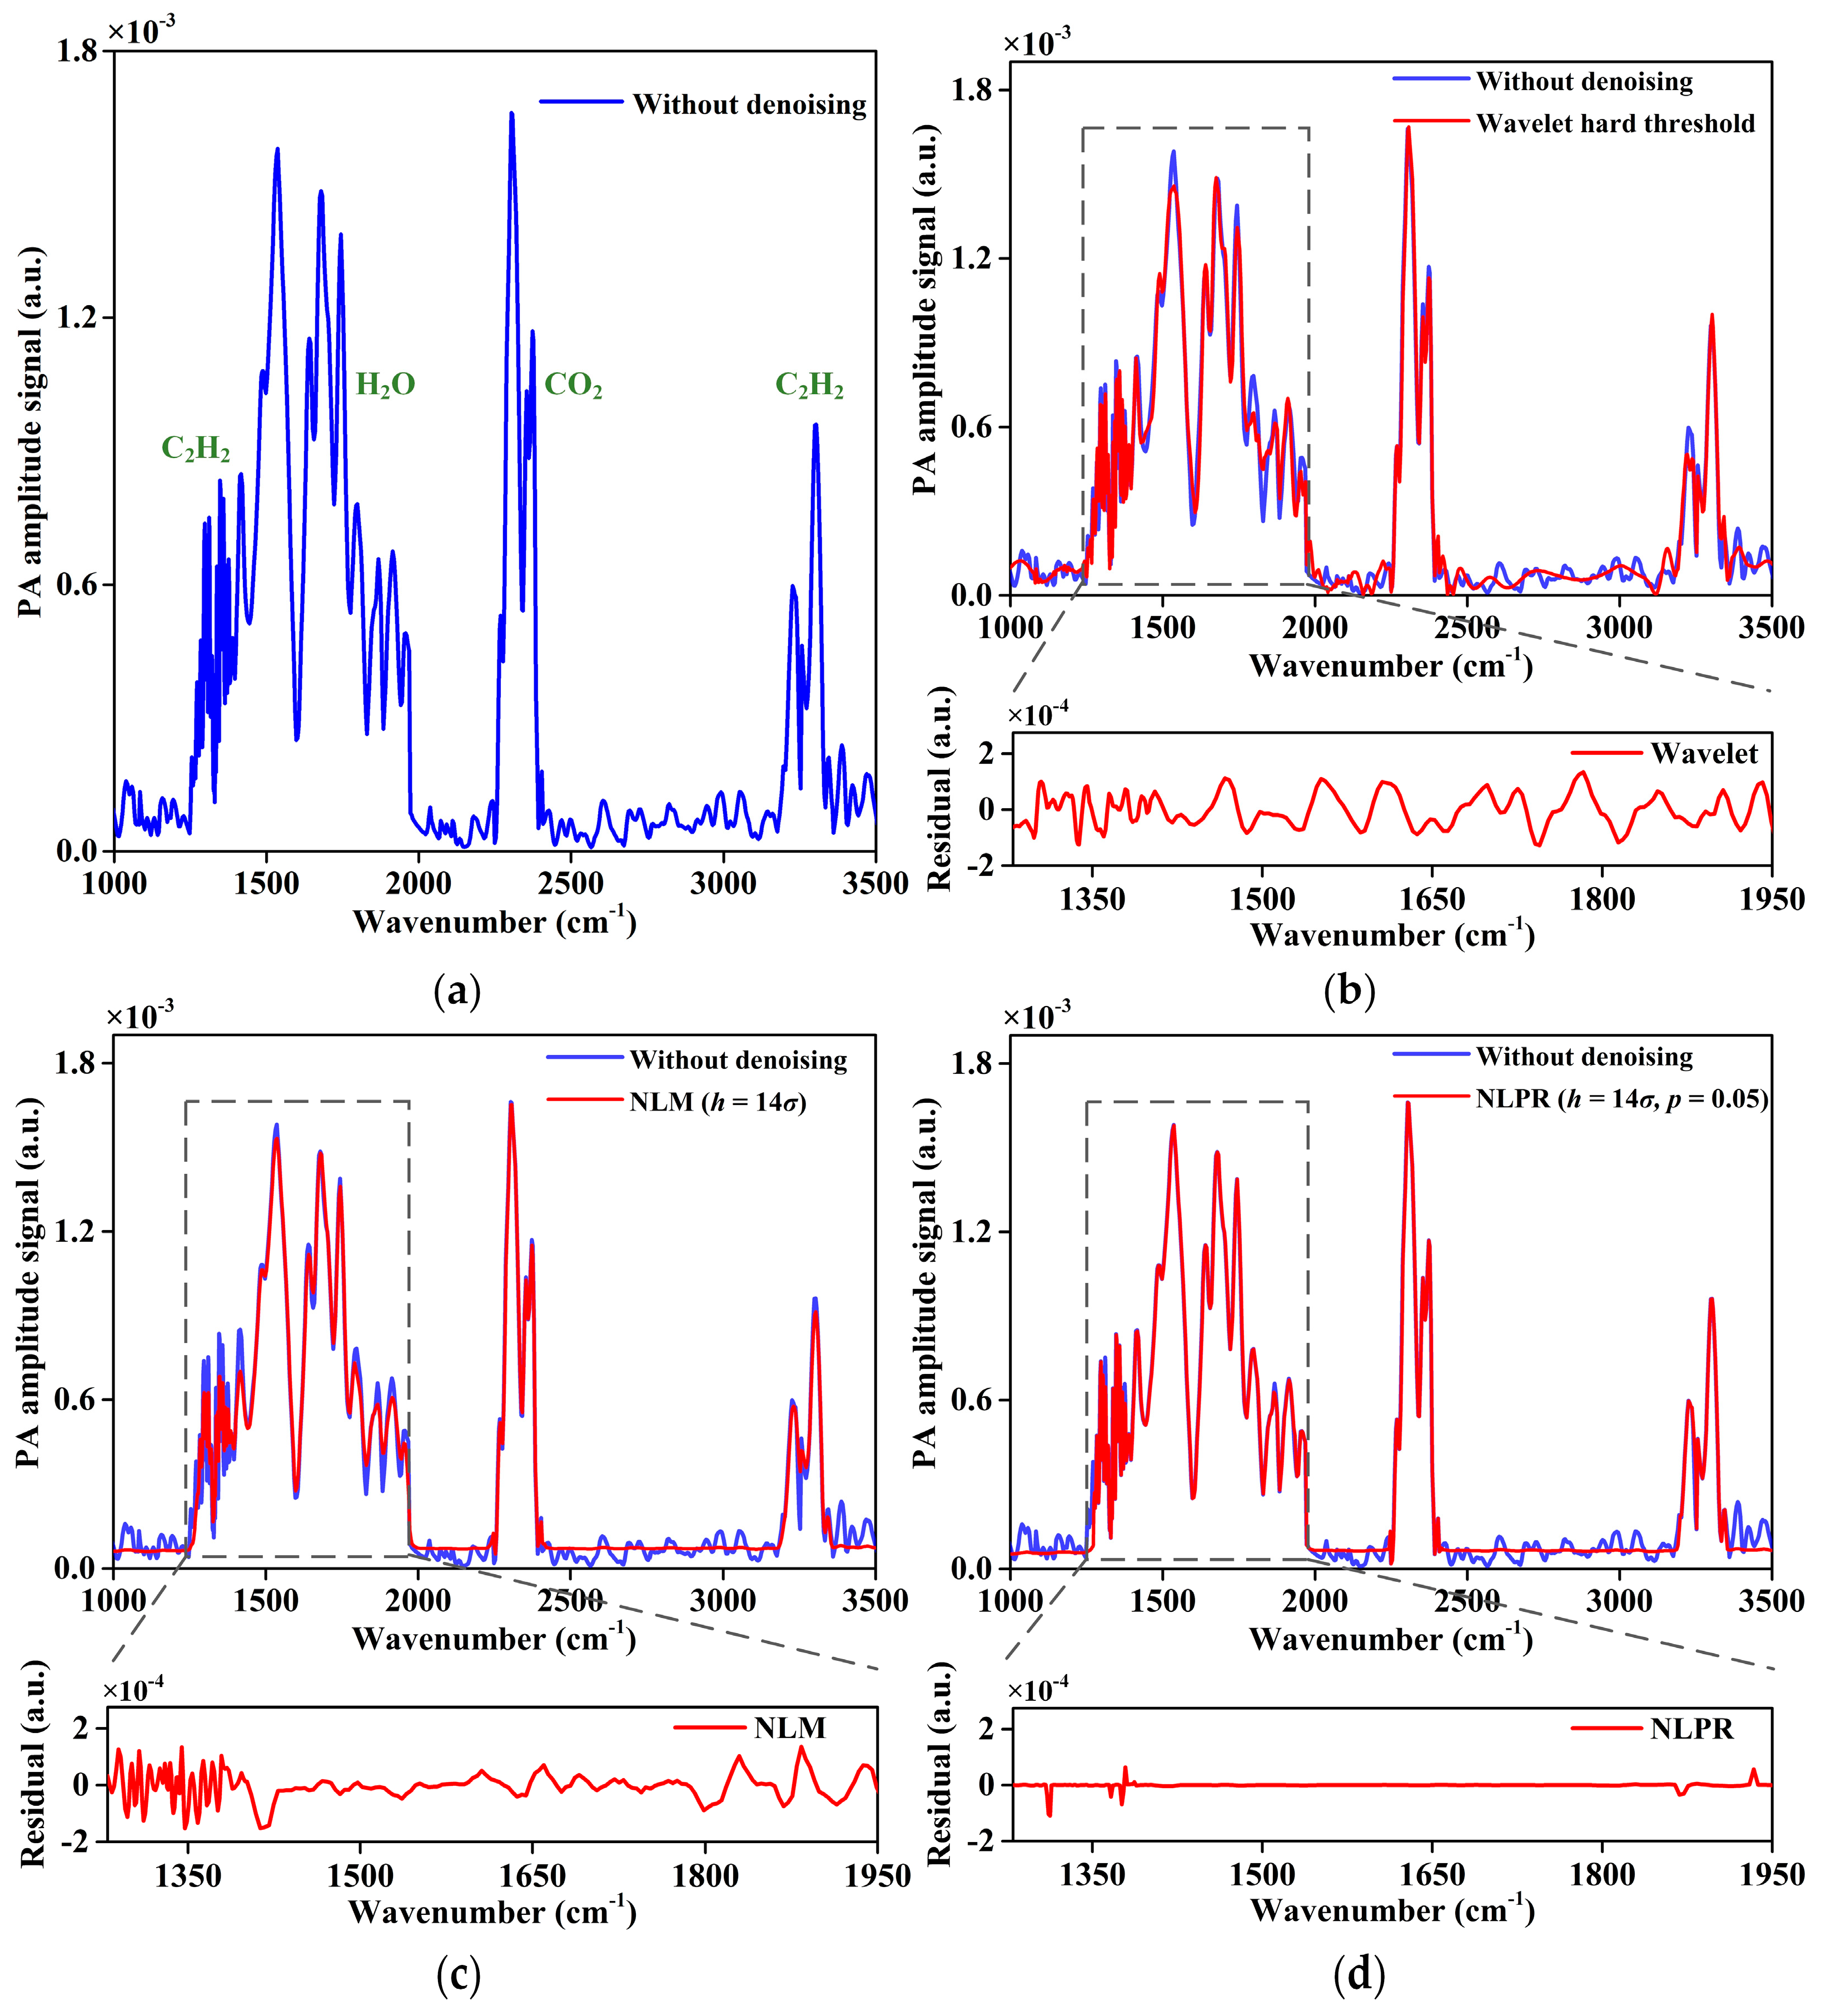
A gas mixture of 100 ppm C2H2, 1000 ppm H2O, and 50 ppm CO2 with laboratory air as the background was used to verify the capability of simultaneous multiple trace gas detection. The experimental results without the denoising process are shown in Figure 8a, revealing the absorption peaks of C2H2 (1253–1382 cm−1 and 3191–3326 cm−1), H2O (1389–1968 cm−1), and CO2 (2262–2389 cm−1), respectively. In our experimental environment, the interference of other unknown gases on the PA signals was negligible. In fact, the potential spectral absorption peaks from other gases should be considered for practical applications. This spectral range in the mid-infrared is the feature region where most volatile organic compounds (VOCs) have strong absorption lines. For atmospheric and industrial pollution monitoring, the absorption features of these VOC gases require a detailed study of the characteristic broadband in the spectral range.
The three denoised results and the residuals of the absorption peak amplitudes in the range of 1280–1950 cm−1 compared to the raw data are shown in Figure 8b–d, which present the denoising behaviors on absorption peak preservation and baseline smoothing. The results show that the NLPR algorithm acquires the minimum residuals in the high amplitude region, revealing a significant improvement in terms of spectral peak fidelity. A value of h = 14 σ , which is different from that for single spectral component detection, which was h = 15 σ , was used as the smoothing parameter because the structure of the multi-component spectrum is more complex with more absorption peak features, and h had to be smaller in order to maintain EPI > 0.95.
Cross-interference [36] is another problem that must be solved in multi-component detection. However, they cannot be completely suppressed, and the optimal choice is to select non-overlapping absorption peaks for different target gas calibrations. According to Figure 8a, C2H2 and CO2 detection characterized by well-defined absorption peaks in the spectral range was straightforward, as only the absorption lines of C2H2 and H2O overlap slightly. Thanks to the broadband features and high spatial resolution of DFTIR-PAS, gas mixtures of C2H2, H2O, and CO2 were found to have less cross-interference due to the selection of several appropriate absorption peaks during calibration.
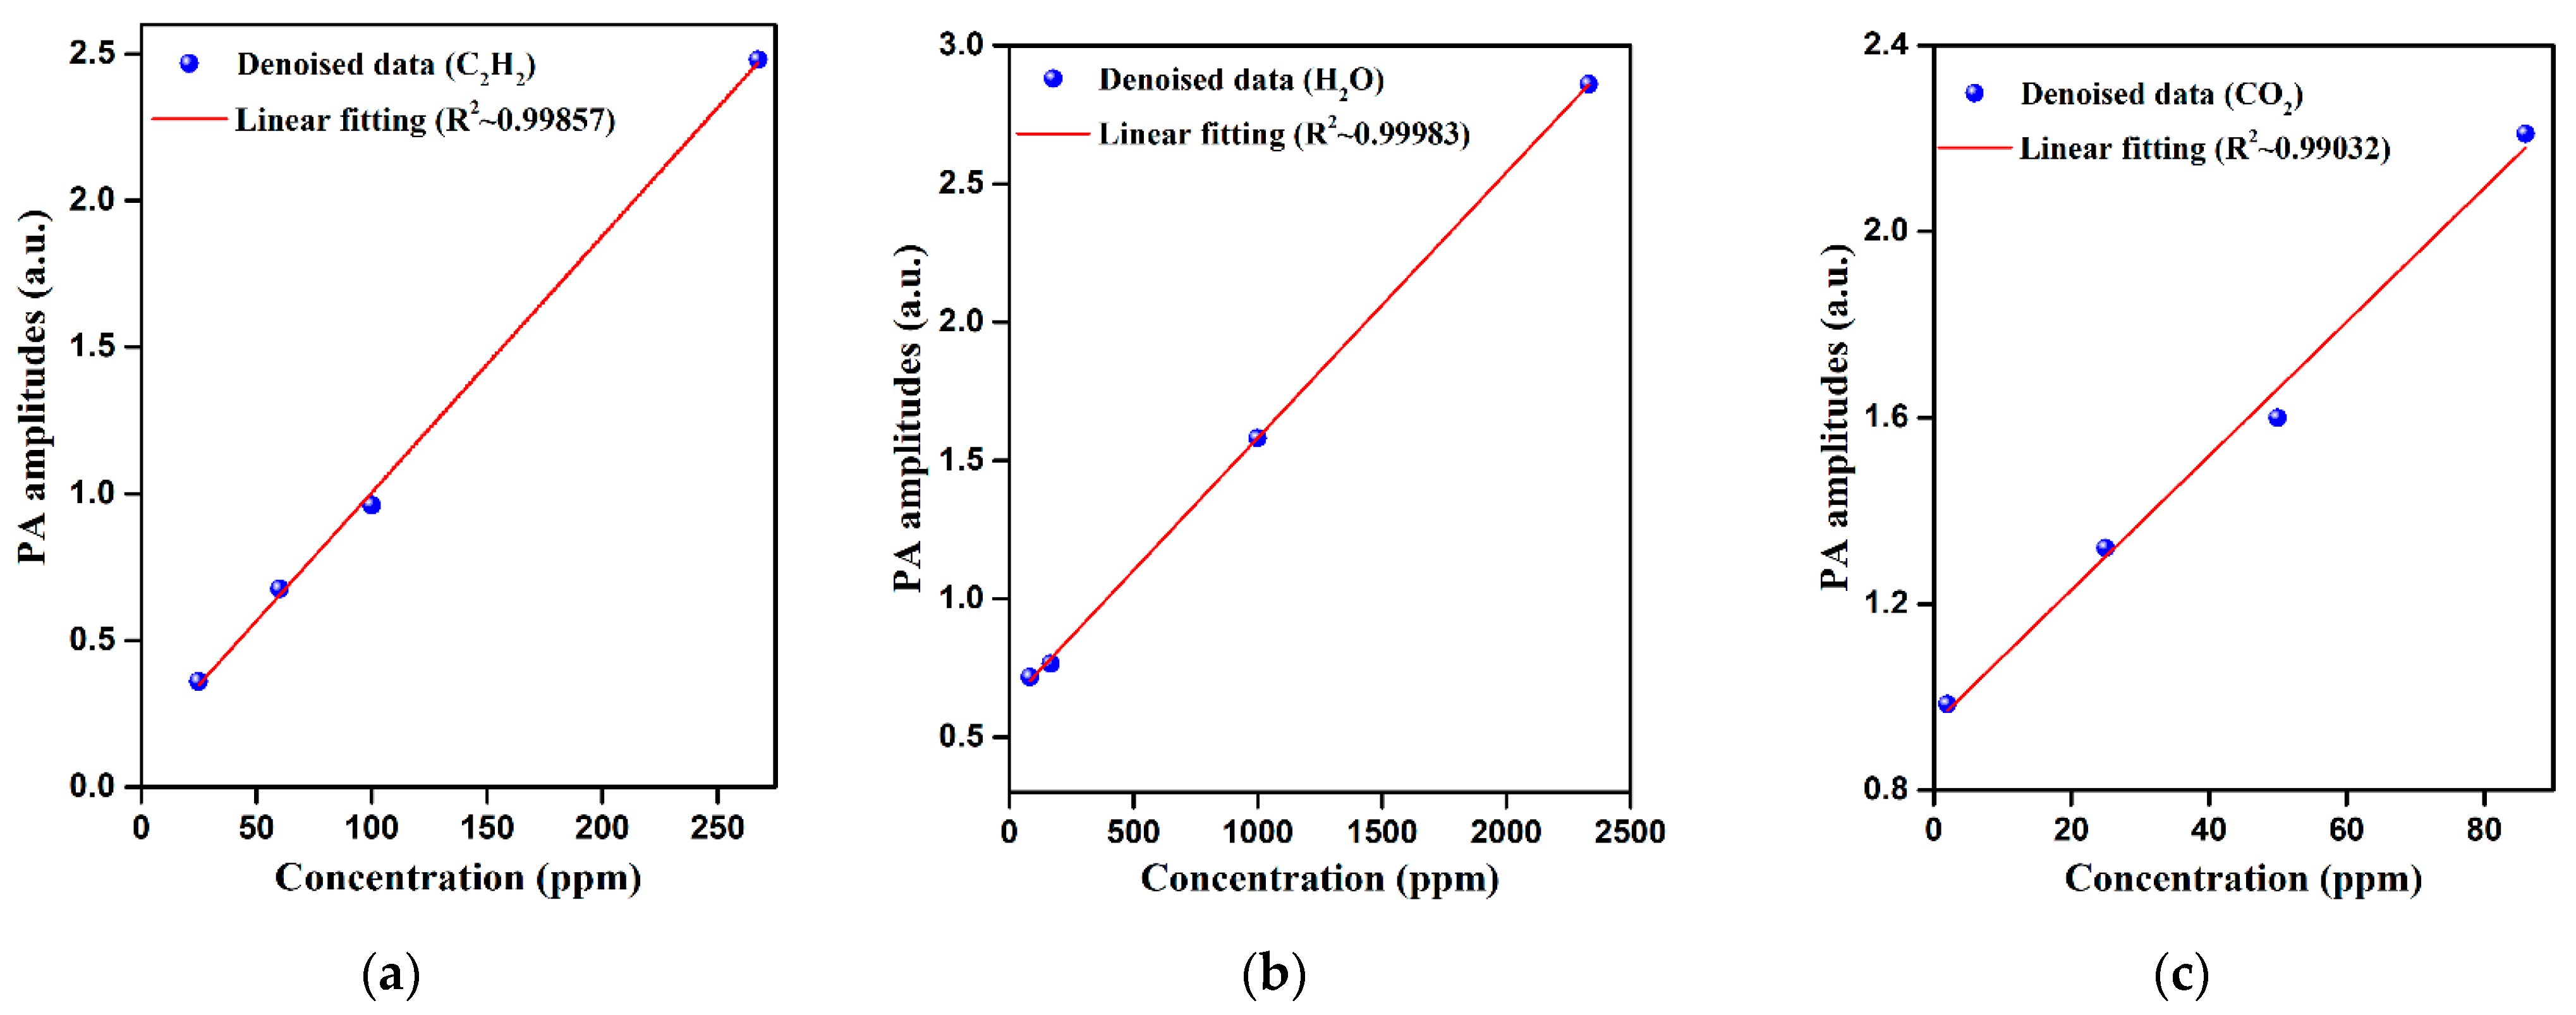
Figure 9a–c show the multi-component gas calibration results. Several specified concentrations for the three target gas samples were measured by averaging 10 sets of data. The target wavenumbers of 1679 cm−1, 2349 cm−1, and 3303 cm−1 were selected to calibrate for H2O, CO2, and C2H2, respectively, avoiding the cross-interference of multi-component gases. In fact, the random and disordered background noise may affect the accurate acquisition of signal peak values. However, a conventional denoising algorithm would deform the line shapes of the PA spectra, and it cannot be guaranteed that the drop in the denoised signal residuals is the same as the drop in the noise levels. Moreover, the denoised amplitude residuals at different absorption lines also cannot be guaranteed to be the same, especially for complex multi-component PA signals. By virtue of NLPR deionisation, the background noise was suppressed, while the absorption peaks were preserved as much as possible. The calculated R-square values were found to be 0.99857, 0.99983, and 0.99032, respectively, based on a linear fitting analysis, which indicated that the NLPR algorithm-enhanced system has excellent linearity responses to the C2H2, H2O, and CO2 concentration levels.
The denoised evaluation results of the three algorithms for measuring 100 ppm C2H2, 1000 ppm H2O, and 50 ppm CO2 are presented in Table 3. The sampling spectra from 1260 cm−1 to 1390 cm−1 were used for the calculation of the EPI. The hard threshold wavelet method achieved the lowest SNR improvement among the three methods, with an EPI of 0.9180. Under the same smoothing condition as h, the NLM method produced an appropriate detection sensitivity, but the EPI value dropped sharply. The experimental results of NLPR showed that an EPI of 0.9599 was acquired and that the SNR was improved to 552.65, which demonstrated the best denoising performance among these methods.
In conclusion, NLPR-enhanced PAS gas sensor spectrum processing exhibited better noise suppression behavior and absorption peak fidelity than the WT and NLM methods with regard to the complex simultaneous multi-component trace gas spectra. Furthermore, the NNEA coefficient of 7.02 × 10⁻¹¹ cm−1·W·Hz−1/2 was achieved for C2H2, with a SNR improvement factor of 20 over the original PA configuration. The NLPR algorithm can offer a higher dynamic range and can improve the LoQ for the system.

4. Conclusions

An improved DFTIR-PAS configuration with NLPR denoising module enhancement was shown to be an effective method for the highly sensitive and selective detection of simultaneous multi-component trace gas spectroscopy. Using the dual criteria of EPI and SNR, the incoherent noise was suppressed, and spectral absorption peak fidelity was improved by the NLPR algorithm. This PA gas spectrometer processing algorithm was experimentally verified to be effective for both single and multi-component trace gas detection schemes: They exhibited better performance in SNR improvement and absorption peak preservation than the WT and NLM methods. After denoising parameter optimization, an NNEA coefficient of 6.13 × 10⁻¹¹ cm−1·W·Hz−1/2 with a 23-fold SNR improvement over the original spectroscopic data was obtained by measuring C2H2 with a 30-mW globar source. Following the procedure used in the single target gas analysis, the simultaneous sensing capability of the algorithm was validated by means of experimental measurements of mixtures of C2H2, H2O, and CO2, resulting in an NNEA coefficient of 7.02 × 10⁻¹¹ cm−1·W·Hz−1/2 with a SNR improvement factor of 20. NLPR-enhanced broadband DFTIR-PA spectroscopy exhibits unique potential for applications in environmental monitoring, medical diagnoses, industrial production, and food safety. In the future, we can miniaturize the system by optimizing the size and structure of the T-type PA cell and the circuit components.

Author Contributions

Conceptualization, L.Z. and L.L.; methodology, L.Z. and L.L.; software, L.Z.; validation, L.Z., X.Y., and X.Z.; formal analysis, L.Z. and X.Y.; investigation, H.H. and X.Z.; resources, H.H. and X.Z.; writing—original draft preparation, L.Z.; writing—review and editing, L.Z., L.L. and A.M.; project administration, X.S.; funding acquisition, L.L. and X.S. All authors have read and agreed to the published version of the manuscript.

Funding

This research was funded by the National Science Foundation of China (Grant No. 62175194, 61805187 and 61801347), the China Postdoctoral Science Foundation (Grant No. 2019M653546), and the Natural Science Foundation of Shaanxi Province with Grant No. 2019JQ-651 and 2020JQ-293. This work was also supported by the Fundamental Research Funds for the Central Universities (XJS190505) and the Natural Sciences and Engineering Research Council of Canada (NSERC) through a Discovery Grant to A. Mandelis and the Chinese Recruitment Program of Global Experts (Thousand Talents). X.Y acknowledges the Guangdong Basic and Applied Basic Research Foundation with Grant No. 2020A1515111012.

Institutional Review Board Statement

Not applicable.

Informed Consent Statement

Not applicable.

Data Availability Statement

Not applicable.

Acknowledgments

L. Zhang would like to thank W. Li from Xidian University for his help in the denoising algorithm discussion, and L. Zhang would also like to thank Mandelis for his help in revising the paper. Authors also thank the reviewers for their comments on the manuscript.

Conflicts of Interest

The authors declare no conflict of interest.

Appendix A

For the basic NLM algorithm, the estimated PA amplitude at point s is the weighted average of amplitudes at other sampling points t in the window D ( s ) . Therefore, the denoised PA patch U ^ ( s ) with NLM can be calculated by executing the 2 regression on the patch space [26]:
U ^ ( s ) = t D ( s ) w s , t U ( t ) t D ( s ) w s , t = arg   min U t D ( s ) w s , t U U ( t ) 2
In NLPR processing, robustness can be improved by replacing the 2 regression in Equation (A1) with the p ( 0 < p 2 ) regression. This novelty was inspired by a generally agreed upon opinion that the 1 minimization is more robust to outliers than 2 minimization [26,27]. Therefore, the optimization framework focuses on t D ( s ) w s , t U U ( t ) p minimization instead, according to Equation (4).
In particular, when p approaches 0, it guarantees better absorption peak feature preservation performance under large smoothing parameters. The denoising implementation depends on the patch similarity and not the physical distance between the sampling points s and t. The absorption peak feature preservation ability and noise suppression will be improved by decreasing p . To pursue significant denoising quality improvement, p will trend towards 0. However, note that setting 0 < p < 1 makes the optimization framework no longer convex [24]. Non-convexity will cause difficulties in finding the global minimum, which will result in a non-optimal estimate of PA amplitude. Nonetheless, if the solver can be initialized close to the global optimum, the probability of finding the optimal denoised results will increase greatly.
The regularized IRLS algorithm [24] is added to solve the regression problem. In the first instance, the iterative solver should be initialized by NLM estimation, namely
U ^ ( 0 ) = t D ( s ) w s , t U ( t ) t D ( s ) w s , t
Then, U U ( t ) p = U U ( t ) 2 U U ( t ) p 2 can be set for each iteration k 1 and U U ( t ) 2 U ( k 1 ) U ( t ) p 2 is used to approximate the next iteration with the current estimation. Thus, Equation (4) can be written in the form of an alternative least squares problem:
U ^ ( k ) = arg   min U t D ( s ) w s , t U U ( t ) 2 ( U ( k 1 ) U ( t ) 2 + ε ( k ) ) 1 p / 2 = t D ( s ) w s , t μ t ( k ) U ( t ) t D ( s ) w s , t μ t ( k )
where ε ( k ) > 0 is used to prevent division by zero, and μ t ( k ) = ( U ( k 1 ) U ( t ) 2 + ε ( k ) ) p / 2 1 .
The IRLS algorithm with NLM initialization provides the solution of p regression in NLPR processing and finds the most appropriate estimated PA signals, especially in the non-convex region 0 < p < 1 . In contrast to the basic NLM algorithm, the denoising performance on spectral absorption peak fidelity and background noise suppression can be greatly improved with decreasing p by virtue of NLPR algorithm under large smoothness. It was found that taking EPI values in the range (0.95,1) optimizes the subtle balancing act of maximizing spectral smoothing with minimum loss of useful optical absorption information.

References

  1. Wang, J.; Zhang, W.; Liang, L.; Yu, Q. Tunable fiber laser based photoacoustic spectrometer for multi-gas analysis. Sens. Actuators B Chem. 2011, 160, 1268–1272. [Google Scholar] [CrossRef]
  2. Ismail, B. Tunable double-mode sensor for multi-gas detection based on the external-cavity diode laser. Appl. Opt. 2018, 57, 4039–4042. [Google Scholar]
  3. Yin, X.; Wu, H.; Dong, L.; Li, B.; Ma, W.; Zhang, L.; Yin, W.; Xiao, L.; Jia, S.; Tittel, F.K. ppb-Level SO2 Photoacoustic Sensors with a Suppressed Absorption–Desorption Effect by Using a 7.41 μm External-Cavity Quantum Cascade Laser. ACS Sens. 2020, 5, 549–556. [Google Scholar] [CrossRef]
  4. Yin, X.; Dong, L.; Wu, H.; Zheng, H.; Ma, W.; Zhang, L.; Yin, W.; Jia, S.; Tittel, F.K. Sub-ppb nitrogen dioxide detection with a large linear dynamic range by use of a differential photoacoustic cell and a 3.5 W blue multimode diode laser. Sens. Actuators B Chem. 2017, 247, 329–335. [Google Scholar] [CrossRef] [Green Version]
  5. Chen, K.; Yu, Z.; Gong, Z.; Yu, Q. Lock-in white-light-interferometry-based all-optical photoacoustic spectrometer. Opt. Lett. 2018, 43, 5038–5041. [Google Scholar] [CrossRef]
  6. Lv, H.; Zheng, H.; Liu, Y.; Yang, Z.; Wu, Q.; Lin, H.; Montano, B.A.Z.; Zhu, W.; Yu, J.; Kan, R.; et al. Radial-cavity quartz-enhanced photoacoustic spectroscopy. Opt. Lett. 2021, 46, 3917. [Google Scholar] [CrossRef]
  7. Palzer, S. Photoacoustic-Based Gas Sensing: A Review. Sensors 2020, 20, 2745. [Google Scholar] [CrossRef]
  8. Yin, X.; Dong, L.; Wu, H.; Zhang, L.; Ma, W.; Yin, W.; Xiao, L.; Jia, S.; Tittel, F.K. Highly sensitive photoacoustic multicomponent gas sensor for SF6 decomposition online monitoring. Opt. Express 2019, 27, A224–A234. [Google Scholar] [CrossRef] [Green Version]
  9. Mao, X.; Zhou, X.; Gong, Z.; Yu, Q. An all-optical photoacoustic spectrometer for multi-gas analysis. Sens. Actuators B Chem. 2016, 232, 251–256. [Google Scholar] [CrossRef]
  10. Wang, Z.; Chang, J.; Tian, C.; Feng, Y.; Wang, C.; Zhang, H.; Zhang, Q.; Li, H.; Feng, Z.; Zhang, X.; et al. Two-component gas quartz-enhanced photoacoustic spectroscopy sensor based on time-division multiplexing of distributed-feedback laser driver current. Appl. Opt. 2019, 58, 8479–8485. [Google Scholar] [CrossRef]
  11. Liu, K.; Mei, J.; Zhang, W.; Chen, W.; Gao, X. Multi-resonator photoacoustic spectroscopy. Sens. Actuators B Chem. 2017, 251, 632–636. [Google Scholar] [CrossRef]
  12. Chen, K.; Liu, S.; Zhang, B.; Gong, Z.; Chen, Y.; Zhang, M.; Deng, H.; Guo, M.; Ma, F.; Zhu, F.; et al. Highly sensitive photoacoustic multi-gas analyzer combined with mid-infrared broadband source and near-infrared laser. Opt. Lasers Eng. 2020, 124, 105844. [Google Scholar] [CrossRef]
  13. Hirschmann, C.B.; Uotila, J.; Ojala, S.; Tenhunen, J.; Keiski, R.L. Fourier Transform Infrared Photoacoustic Multicomponent Gas Spectroscopy with Optical Cantilever Detection. Appl. Spectrosc. 2010, 64, 293–297. [Google Scholar] [CrossRef]
  14. Mikkonen, T.; Amiot, C.; Aalto, A.; Patokoski, K.; Genty, G.; Toivonen, J. Broadband cantilever-enhanced photoacoustic spectroscopy in the mid-IR using a supercontinuum. Opt. Lett. 2018, 43, 5094–5097. [Google Scholar] [CrossRef]
  15. Liu, L.; Mandelis, A.; Huan, H.; Michaelian, K.H. Step-scan differential Fourier transform infrared photoacoustic spectroscopy (DFTIR-PAS): A spectral deconvolution method for weak absorber detection in the presence of strongly overlapping background absorptions. Opt. Lett. 2017, 42, 1424–1427. [Google Scholar] [CrossRef]
  16. Liu, L.; Huan, H.; Li, W.; Mandelis, A.; Wang, Y.; Zhang, L.; Zhang, X.; Yin, X.; Wu, Y.; Shao, X. Highly sensitive broadband differential infrared photoacoustic spectroscopy with wavelet denoising algorithm for trace gas detection. Photoacoustics 2021, 21, 100228. [Google Scholar] [CrossRef]
  17. Li, J.; Yu, B.; Zhao, W.; Chen, W. A Review of Signal Enhancement and Noise Reduction Techniques for Tunable Diode Laser Absorption Spectroscopy. Appl. Spectrosc. Rev. 2014, 49, 666–691. [Google Scholar] [CrossRef]
  18. Zhou, S.; Shen, C.-Y.; Zhang, L.; Liu, N.-W.; He, T.-B.; Yu, B.-L.; Li, J.-S. Dual-optimized adaptive Kalman filtering algorithm based on BP neural network and variance compensation for laser absorption spectroscopy. Opt. Express 2019, 27, 31874–31888. [Google Scholar] [CrossRef]
  19. Zimmermann, B.; Kohler, A. Optimizing Savitzky–Golay Parameters for Improving Spectral Resolution and Quantification in Infrared Spectroscopy. Appl. Spectrosc. 2013, 67, 892–902. [Google Scholar] [CrossRef] [Green Version]
  20. Al-Mbaideen, A.A. Application of Moving Average Filter for the Quantitative Analysis of the NIR Spectra. J. Anal. Chem. 2019, 74, 686–692. [Google Scholar] [CrossRef]
  21. Fan, B.-Q.; Zhang, Y.-J.; He, Y.; You, K.; Li, M.-Q.; Yu, D.-Q.; Xie, H.; Lei, B.-E. Adaptive monostable stochastic resonance for processing UV absorption spectrum of nitric oxide. Opt. Express 2020, 28, 9811–9822. [Google Scholar] [CrossRef]
  22. Mappe-Fogaing, I.; Joly, L.; Durry, G.; Dumelié, N.; Decarpenterie, T.; Cousin, J.; Parvitte, B.; Zéninari, V. Wavelet Denoising for Infrared Laser Spectroscopy and Gas Detection. Appl. Spectrosc. 2012, 66, 700–710. [Google Scholar] [CrossRef]
  23. Zheng, C.-T.; Ye, W.-L.; Huang, J.-Q.; Cao, T.-S.; Lv, M.; Dang, J.-M.; Wang, Y.-D. Performance improvement of a near-infrared CH4 detection device using wavelet-denoising-assisted wavelength modulation technique. Sens. Actuators B Chem. 2014, 190, 249–258. [Google Scholar] [CrossRef]
  24. Li, J.; Yu, B.; Fischer, H. Wavelet Transform Based on the Optimal Wavelet Pairs for Tunable Diode Laser Absorption Spectroscopy Signal Processing. Appl. Spectrosc. 2015, 69, 496–506. [Google Scholar] [CrossRef]
  25. Li, Y.; Wang, R.; Tittel, F.K.; Ma, Y. Sensitive methane detection based on quartz-enhanced photoacoustic spectroscopy with a high-power diode laser and wavelet filtering. Opt. Lasers Eng. 2020, 132, 106155. [Google Scholar] [CrossRef]
  26. Chaudhury, K.N. On the Convergence of the IRLS Algorithm in Non-Local Patch Regression. IEEE Signal. Process. Lett. 2013, 20, 815–818. [Google Scholar] [CrossRef] [Green Version]
  27. Buades, A.; Coll, B.; Morel, J.-M. A Review of Image Denoising Algorithms, with a New One. Multiscale Model. Simul. 2005, 4, 490–530. [Google Scholar] [CrossRef]
  28. Chaudhury, K.N.; Singer, A. Non-Local Euclidean Medians. IEEE Signal. Process. Lett. 2012, 19, 745–748. [Google Scholar] [CrossRef] [Green Version]
  29. Sun, Z.; Chen, S. Analysis of Non-Local Euclidean Medians and Its Improvement. IEEE Signal. Process. Lett. 2013, 20, 303–306. [Google Scholar] [CrossRef]
  30. Tounsi, Y.; Kumar, M.; Nassim, A.; Mendoza-Santoyo, F. Speckle noise reduction in digital speckle pattern interferometric fringes by nonlocal means and its related adaptive kernel-based methods. Appl. Opt. 2018, 57, 7681–7690. [Google Scholar] [CrossRef]
  31. Sattar, F.; Floreby, L.; Salomonsson, G.; Lovstrom, B. Image enhancement based on a nonlinear multiscale method. IEEE Trans. Image Process. 1997, 6, 888–895. [Google Scholar] [CrossRef]
  32. Tracey, B.H.; Miller, E.L. Nonlocal Means Denoising of ECG Signals. IEEE Trans. Biomed. Eng. 2012, 59, 2383–2386. [Google Scholar] [CrossRef]
  33. Zhang, B.; Chen, K.; Chen, Y.; Yang, B.; Guo, M.; Deng, H.; Ma, F.; Zhu, F.; Gong, Z.; Peng, W.; et al. High-sensitivity photoacoustic gas detector by employing multi-pass cell and fiber-optic microphone. Opt. Express 2020, 28, 6618–6630. [Google Scholar] [CrossRef]
  34. Elia, A.; Di Franco, C.; Spagnolo, V.; Lugarà, P.M.; Scamarcio, G. Quantum Cascade Laser-Based Photoacoustic Sensor for Trace Detection of Formaldehyde Gas. Sensors 2009, 9, 2697–2705. [Google Scholar] [CrossRef] [Green Version]
  35. Li, S.; Wu, H.; Cui, R.; Sampaolo, A.; Patimisco, P.; Spagnolo, V.; Tittel, F.K.; Dong, L. Piezo-enhanced acoustic detection module for mid-infrared trace gas sensing using a grooved quartz tuning fork. Opt. Express 2019, 27, 35267–35278. [Google Scholar] [CrossRef]
  36. Weigl, S.; Wittmann, E.; Rück, T.; Bierl, R.; Matysik, F.-M. Effects of ambient parameters and cross-sensitivities from O2, CO2 and H2O on the photoacoustic detection of acetone in the UV region. Sens. Actuators B Chem. 2021, 328, 129001. [Google Scholar] [CrossRef]
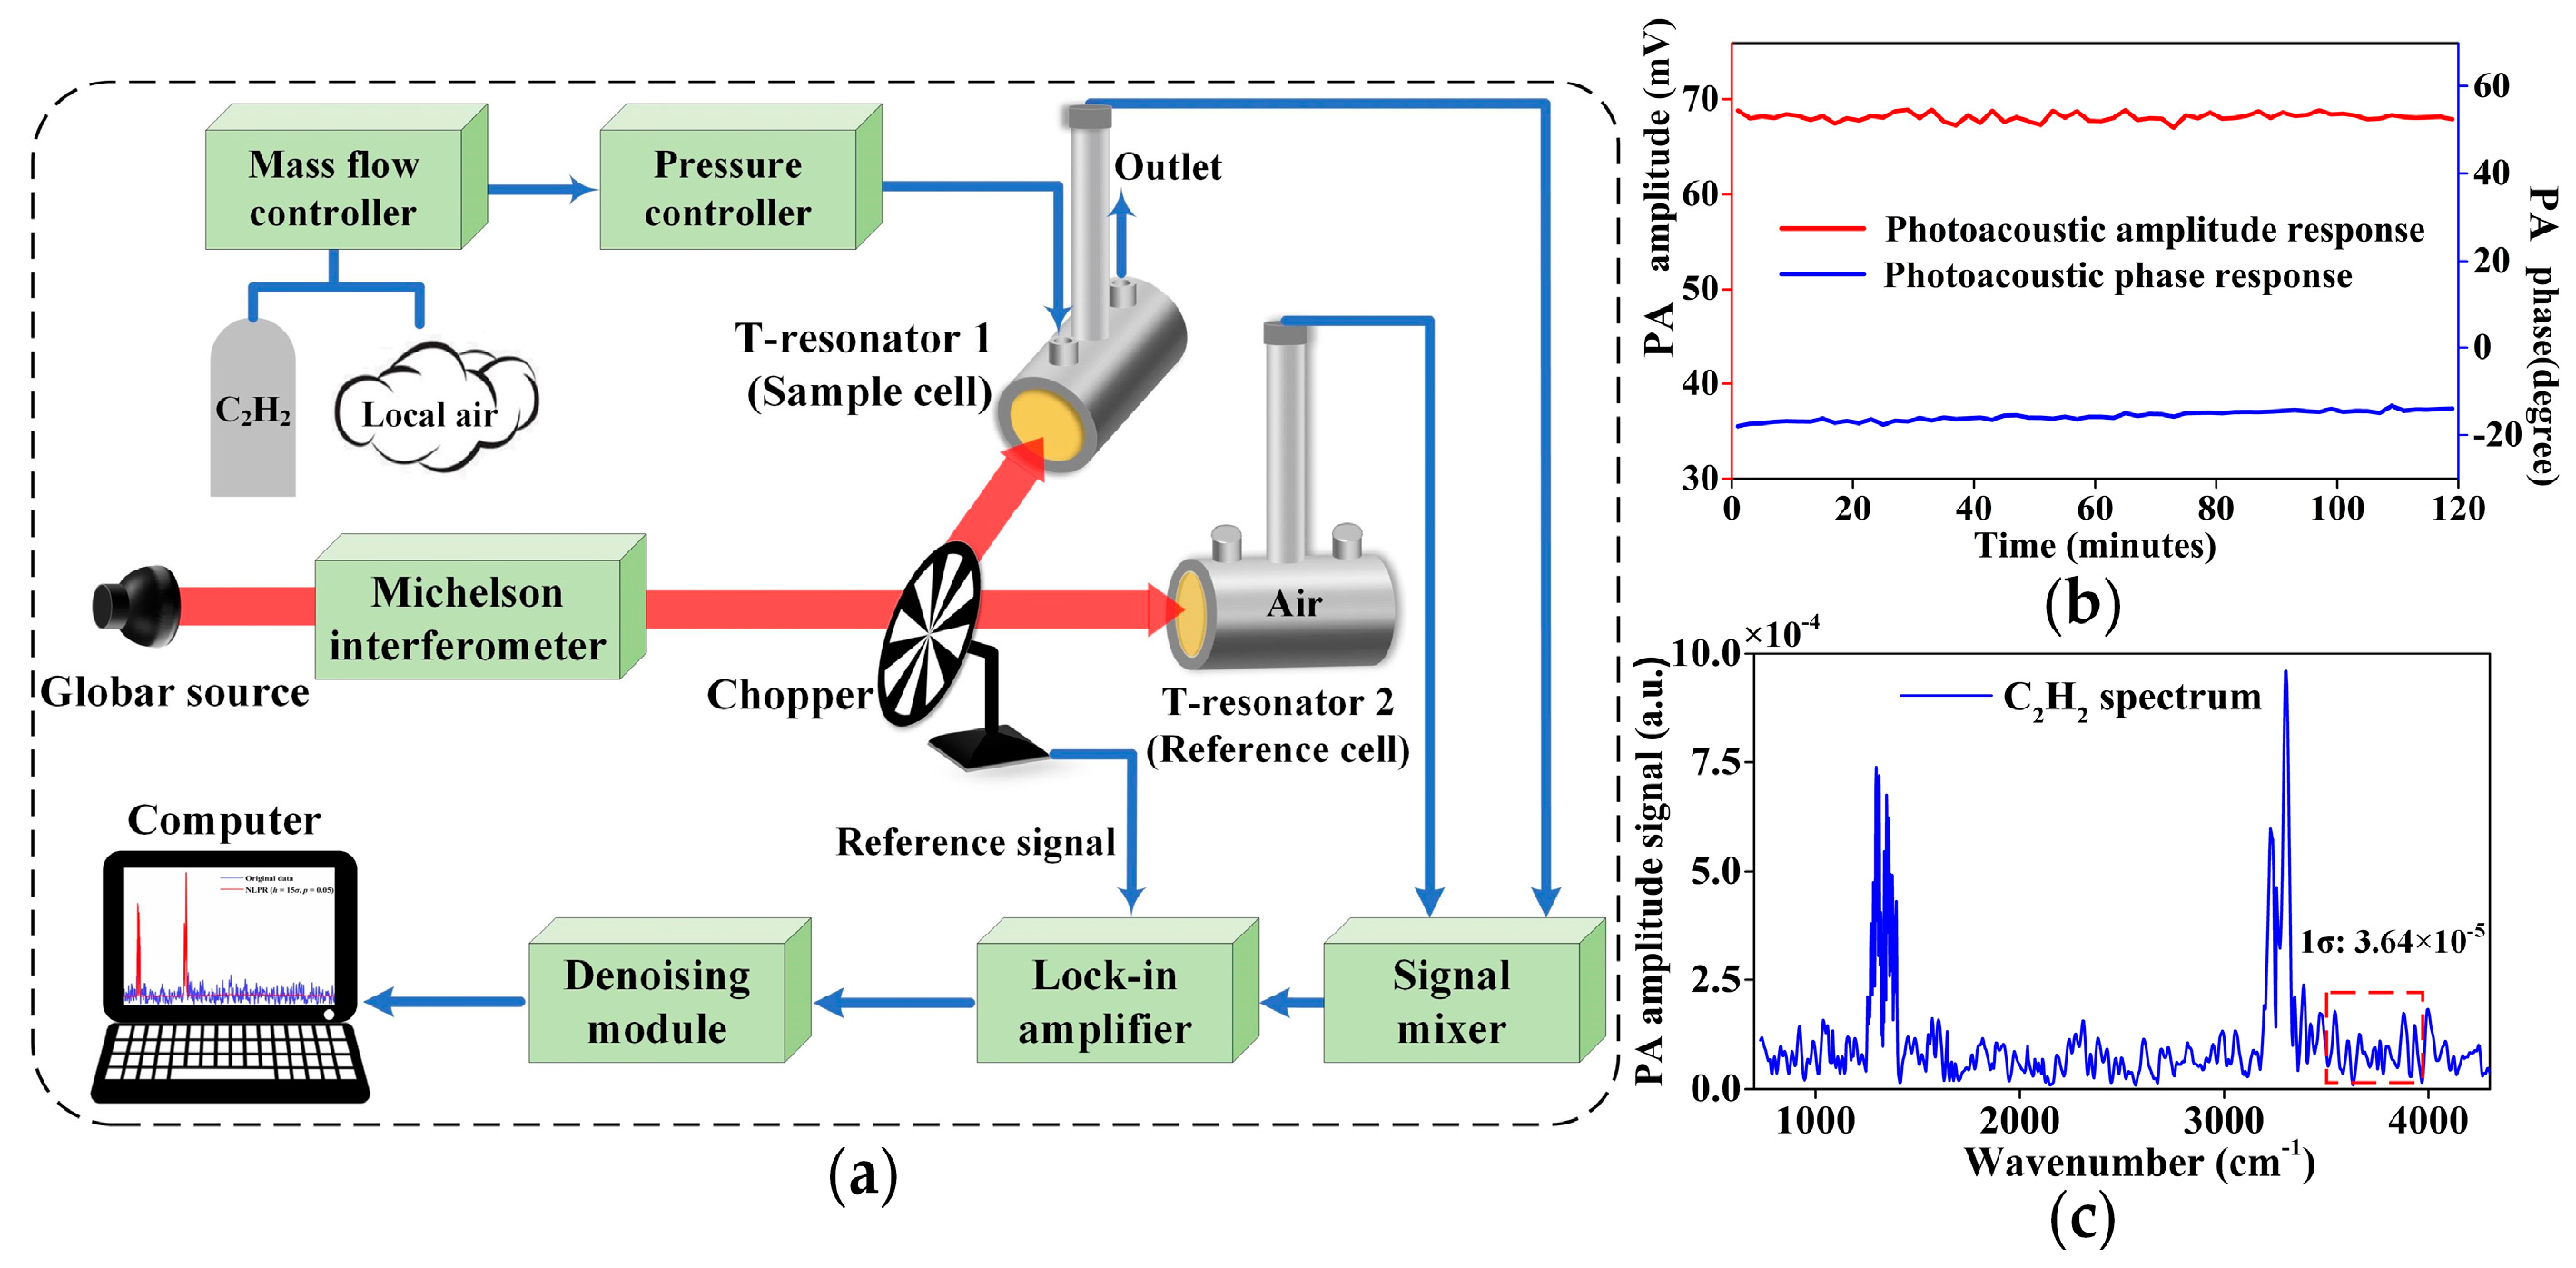
Figure 1. (a) Schematic of NLPR denoising enhanced DFTIR−PAS trace gas sensor system; (b) time stability of the PAS−based gas sensor; (c) differential photoacoustic signal of 100 ppm C2H2 based on DFTIR without denoising.
Chemosensors 09 00268 g001
Figure 2. Illustration of the NLPR execution. The half−width of the blue search window is D. The half−width of neighborhood patches is P, which is equal to the length of the symmetric padding patches.
Chemosensors 09 00268 g002
Figure 3. Comparison of 100 ppm C2H2 PA signal denoising results based on basic NLM using different smoothing parameters: (a) denoised spectra using NLM with h = 6 σ and h = 15 σ ; (b) enlargement of region 1: comparison of absorption peaks; (c) enlargement of region 2: comparison of background noise.
Chemosensors 09 00268 g003
Figure 4. Comparison of evaluation results with variable h and p: (a) the change of EPI with h at different p. Insert: the apparent EPI value error when p = 0.01 and h = 13 σ ; (b) the change of SNR with h at different p.
Chemosensors 09 00268 g004
Figure 5. (a) Comparison of denoised 100 ppm C2H2 PA signals with NLPR algorithm and wavelet hard threshold denoising method. (b) Enlargement of region 1 for the comparison of the absorption peak fidelity; (c) enlargement of region 2 for the comparison of background noise removal performance.
Chemosensors 09 00268 g005
Figure 6. (a) The PA spectrum of 25 ppm C2H2; (b) the denoised PA spectrum of 25 ppm C2H2 by the NLPR algorithm.
Chemosensors 09 00268 g006
Figure 7. The main multi-component gas detection procedure based on NLPR algorithm-enhanced DFTIR-PAS configuration.
Chemosensors 09 00268 g007
Figure 8. (a) Multi−component PA spectrum based on the DFTIR−PAS without denoising. (b) Top: denoised PA spectrum using the wavelet hard threshold method with the optimized parameters (“sym14”, “sqtwolog”, 6). Bottom: absorption peak residuals between wavelet denoised result and raw data. (c) Top: denoised PA spectrum using basic NLM with h = 14 σ . Bottom: absorption peak residuals between NLM denoised result and raw data. (d) Top: denoised PA spectrum using NLPR with p = 0.05 and h = 14 σ . Bottom: absorption peak residuals between NLPR denoised result and raw data.
Chemosensors 09 00268 g008
Figure 9. Multi-component gas calibration results. Denoised data: PA amplitudes processed by NLPR denoising. (a) C2H2 signals vs. concentration; (b) H2O signals vs. concentration. (c) CO2 signals vs. concentration.
Chemosensors 09 00268 g009
Table 1. PA spectrum signal denoising procedure based on NLPR algorithm.
Algorithm 1. PA Spectrum Signal Denoising Based on NLPR
Input: Noisy differential PA spectrum signal u = u s , and parameters D , P , h , p
Output: Denoised spectrum signal u ^ = u ^ s
1 Extend the PA signal by symmetrical padding with the length of P around the boundary points and extract patch U ( s ) of length 2 × P + 1 at every sampling point s.
2 For every sampling point s, the following should be completed:
(a) Set w s , t = exp ( U ( s ) U ( t ) 2 / h 2 ) for every t D ( s ) in the search window.
(b) Find a patch U ^ with the IRLS method to minimize t D ( s ) w s , t U U ( t ) p .
(c) Set u ^ s to be the center point in the patch U ^ .
Table 2. Comparison of detection precision performance with laser-based PAS methodologies.
Incident Light Intensity
(at Target Wavenumber)
Target GasNNEA Coefficient
(cm−1·W·Hz−1/2)
Reference
15 mWC2H21.4 × 10−9[33]
4 mWCH2O2.0 × 10−8[34]
1.8 mWCH44.1 × 10−9[35]
30 μWC2H25.50 × 10−11This paper
Table 3. Evaluation results of multi-component gas spectrum using different denoising methods.
IndexWithout DenoisingWTNLM (h = 14σ)NLPR (h = 14σ)
EPI10.91800.71550.9599
Noise level3.64 × 10−58.92 × 10−62.09 × 10−61.74 × 10⁻⁶
SNR improvement factor-31520
Publisher’s Note: MDPI stays neutral with regard to jurisdictional claims in published maps and institutional affiliations.