Article

Identification of Biomarkers Related to Metabolically Unhealthy Obesity in Korean Obese Adolescents: A Cross-Sectional Study

Division of Endocrine and Kidney Disease Research, Department of Chronic Disease Convergence Research, Korea National Institute of Health, Korea Disease Control and Prevention Agency, 187 Osongsaengmyeong 2-ro, Osong-eup, Cheongju-si 28159, Republic of Korea
*
Author to whom correspondence should be addressed.
Children 2023, 10(2), 322; https://doi.org/10.3390/children10020322
Submission received: 26 December 2022 / Revised: 25 January 2023 / Accepted: 2 February 2023 / Published: 8 February 2023
(This article belongs to the Section Pediatric Endocrinology & Diabetes)

Abstract

:
Background: The current study aimed to screen for relationships and different potential metabolic biomarkers involved between metabolically healthy obesity (MHO) and metabolically unhealthy obesity (MUO) in adolescents. Methods: The study included 148 obese adolescents aged between 14 and 16. The study participants were divided into MUO and MHO groups based on the age-specific adolescent metabolic syndrome (MetS) criteria of the International Diabetes Federation. The current study was conducted to investigate the clinical and metabolic differences between the MHO and MUO groups. Multivariate analyses were conducted to investigate the metabolites as independent predictors for the odds ratio and the presence of the MetS. Results: There were significant differences in the three acylcarnitines, five amino acids, glutamine/glutamate ratio, three biogenic amines, two glycerophospholipids, and the triglyceride-glucose index between the MUO group and those in the MHO group. Moreover, several metabolites were associated with the prevalence of MUO. Additionally, several metabolites were inversely correlated with MHO in the MUO group. Conclusions: In this study, the biomarkers found in this study have the potential to reflect the clinical outcomes of the MUO group. These biomarkers will lead to a better understanding of MetS in obese adolescents.

1. Introduction

Despite growing health concerns, the prevalence of obesity in adults and children remains high worldwide [1]. Obesity is defined as excessive body fat accumulation [2]. Obesity is associated with cardiovascular disease (CVD) [3] and metabolic syndrome (MetS—diabetes mellitus (DM), hypertension (HTN), and dyslipidemia). In addition, MetS is associated with obesity [4] and insulin resistance (IR) [5]. However, obesity and MetS have different clinical features [6]. Therefore, it is important to understand and control obesity and MetS.
The prevalence of obese adolescents has an increasing trend [7]. According to the 2013–2017 obesity fact sheet of the Korea Health Promotion Institute, the prevalence of Korean obese adolescents increased from 11.6% in 2007 to 17.3% in 2017 [8]. Furthermore, obese adolescents are at a higher risk of MetS and CVD than non-obese adolescents [9]. Clinical factors are very important factors related to obesity and atherosclerosis [10]. Several previous studies have suggested that metabolic biomarkers are related to obesity [11], MetS [12], and CVD in adolescents [13]. However, periodic studies in adolescents are required because adolescence is a growing period that is sensitive to environmental and temporal changes [14]. Thus, more detailed research about sensitive biomarkers and regulatory pathways concerning obesity and MetS in adolescents is required. There are a few studies about biomarkers or regulatory pathways that are atherogenic or related to obesity. However, not all obese populations develop MetS [6]. In general, height and weight measurements are considered in obesity diagnosis [2]. Therefore, the diagnosis of MetS in the obese population requires consideration of other factors such as body fat composition, laboratory measurements, and metabolites. In this regard, obesity is classified as metabolically unhealthy obesity (MUO) and metabolically healthy obesity (MHO) [15].
Metabolites are crucial biomarkers that can be potentially used to observe dynamic physiological conditions corresponding to the clinical outcome of the patient [16]. Therefore, it is material to identify and/or quantify tools in adolescents to investigate the difference between MHO and MUO of biomarkers and regulatory pathways in obese adolescents.
The current study aimed to screen for relationships and different potential metabolic biomarkers involved between MHO and MUO in adolescents. We analyzed the difference between the two groups after adjusting for factors, such as age, sex, and body mass index (BMI) to exclude the effect of severe change by growth phase. Thus, the current study was conducted to investigate the clinical and metabolic differences between the adolescents in the MHO group and the adolescents in the MUO group.

2. Materials and Methods

2.1. Study Participants

The data were obtained from the Korean Children-Adolescents Study (KoCAS), conducted by the Korean National Institute of Health. The KoCAS subjects in this study were adolescents aged 14–16 years from Seoul and Gyeonggi provinces for whom clinical biomarker data were collected in 2012. Obesity was defined as a body mass index (BMI) >25 kg/m2 or being in the 95th percentile for age and sex according to the 2017 Korean growth standard [2] for children and adolescents. Among the adolescents, 143 who were severely obese adolescents aged 14–16 years with BMIs ≥ 99th percentile (or ≥30 kg/m2) were used in present study. Adolescents who participated in this study participated only with parental informed consent. The overall objective of this cross-sectional study was to identify early risk factors for obesity and associated metabolic disease in Korean adolescents. The current study excluded participants who did not have the data on confounding variables, such as nutrition intakes, biochemicals, and metabolites. The study participants were divided into MUO and MHO groups based on the age-specific adolescent MetS criteria of the International Diabetes Federation (IDF) [17]. The Institutional Review Board (IRB) of Korea National Institute of Health (KNIH; IRB No. 2020-07-05-P-A) approved the study protocol which complied with the Declaration of Helsinki.

2.2. Anthropometric Parameters

The anthropometric parameters of the study participants were measured in absence of clothing and shoes in the morning after overnight fasting for 12 h. The body weight and body fat percentage (BF%) were measured using a body composition analyzer (BC418; Tanita, Tokyo, Japan). The height was measured to the nearest 0.1 cm with a wall-mounted stadiometer (DS-102; Jenix, Seoul, Korea). The BMI was calculated as weight in kilograms divided by height in meters squared (kg/m2). The BMI z-score was calculated by BMI-for-age percentiles together with the Lambda-Mu-Sigma method of Cole and Green, which provides a way of obtaining normalized growth percentile standards based on The 2017 Korean National Growth Charts for Children and Adolescents [2]. The waist circumference (WC) was measured, with participants standing straight, using a flexible tapeline at the midpoint of the lower rib and the iliac crest to the nearest 0.1 cm. The hip circumference (HC) was measured using a flexible tapeline at the horizontal circumference of the highest point of the buttocks to the nearest 0.1 cm. The waist–hip ratio was calculated based on recorded WC and HC measurements. The systolic blood pressure (SBP) and diastolic blood pressure (DBP) were measured twice on the arm of participants in a seated position following a rest of at least 5 min using an automatic sphygmomanometer (HEM-907, OMRON Healthcare Co., Kyoto, Japan); the two measurements were then averaged. The basal metabolic rate (BMR; Kcal) was calculated using the equation of the Harris–Benedict formula: BMR = [66.47 (for males) or 65.51 (for females)] + [9.6 × weight (kg)] + [1.8 × height (cm)] − [4.7 × age] [18].

2.3. Biochemical Analysis

The blood samples were collected after an overnight fast of at least 12 h. The antecubital vein blood was collected in a vacutainer tube. The blood samples were centrifuged to obtain the plasma and serum samples, then stored at −80 °C. The levels of triglycerides (TGs), total cholesterol (T-cholesterol), high-density lipoprotein cholesterol (HDL-cholesterol), alanine aminotransferase (ALT), aspartate aminotransferase (AST), and glucose were measured using an autoanalyzer (model 7600Ⅱ; Hitachi, Tokyo, Japan). The low-density lipoprotein cholesterol (LDL-cholesterol) levels calculated using the equation of the Friedewald formula: LDL-cholesterol = total cholesterol—[HDL-cholesterol + (TG/5)].

2.4. MetS Diagnosis

In the present study, MetS was diagnosed using adolescent criteria of IDF [17]; the definition ages were 10–16 years. MetS was defined as central obesity (defined as WC but can assumed if BMI >30 kg/m2) plus at least 2 out of 4 criteria (No. 2–5). The MetS diagnostic criteria are as follows:
  • WC ≥ 90th percentile or adult cut-off if lower
  • SBP of 130 mmHg or DBP of 85 mmHg or treatment with anti-hypertensive medication
  • TG ≥ 150 mg/dL
  • HDL-cholesterol < 40 mg/dL
  • Fasting plasma glucose ≥ 100 mg/dL or known type 2 (T2) DM

2.5. Assessment of Nutrition Intake

In this study, participants were interviewed to obtain information about their nutrient intake. The dietary intake was assessed using a 3-day food record method. The data of food records were validated through their parents or caregiver. The study participants were asked to record their intake of meals and snacks, including beverages during a nonconsecutive period of 3 days (1 day of the weekend and 2 days of the weekdays). Furthermore, ingredients of meals, as well as portion sizes, were also recorded. A well-trained dietician reviewed and confirmed the written 3-day food record using food models during face-to-face interviews to increase precision in reporting. The research-based typical food intake data were used to calculate averages of energy, macronutrients, and micronutrients were analyzed through a food consumption survey database of the Korean National Health and Nutrition Examination Survey.

2.6. Metabolite Measurements

A total of 186 metabolites in the plasma of 148 participants were measured using AbsoluteIDQ p180 kit (Biocrates Life Sciences AG, Innsbruck, Austria). The data quality of each metabolite was checked based on the following criteria: (1) half of the analyzed metabolite concentrations in the reference standards > limit of detection and (2) half of the analyzed metabolite concentrations in the experimental samples. We excluded 32 metabolites that failed the quality criteria. Finally, a total of 154 metabolites (37 acylcarnitines (ACs), 20 amino acids (AAs), 8 biogenic amines (BAs), 81 glycerophospholipids (GPLs), and 8 sphingolipids (SPLs)) were analyzed with the AbsoluteIDQ™ p180 kit using the protocol described in the AbsoluteIDQ™ p180 user manual. The ACs, GPLs, and SPLs were quantified by flow injection analysis by tandem mass spectrometry using an ABI 4000 Q-Trap mass spectrometer (Applied Biosystems/MDS Sciex, Foster city, CA). The AAs and BAs were quantified by stable isotope dilution in a liquid chromatography-tandem mass spectrometry. The biocrates MetIQ software was used to control the entire assay workflow, from sample registration to the automated calculation of metabolite concentrations to the export of data into other data analysis programs. The metabolite concentration measurements in μmol/L (μM) units were automatically carried out with the MetVal™ software package (Biocrates Life Sciences AG, Innsbruck, Austria).

2.7. The Calculation of Homeostasis Model Assessment of Insulin Resistance (HOMA-IR) Index and Triglyceride-Glucose (TyG) Index

The HOMA-IR was calculated as the fasting glucose (mg/dL) × fasting insulin (μIU/mL)/405 [19]. The TyG index was calculated as the Ln [fasting glucose (mg/dL) × fasting TG (mg/dL)/2] [20].

2.8. Data Processing and Statistical Analysis

The statistical analyses were conducted using the Statistical Analysis System software version 9.4 (SAS Institute, Cary, NC, USA). The skewed variables were transformed logarithmically. For the comparison of categorical variables, a chi-squared test was conducted. The general linear model with a Bonferroni correction adjusting for confounding factors was used to compare the parameters collected from each group. Multivariate logistic regressions were conducted to investigate the metabolites as independent predictors for the odds ratio (OR) and the presence of the MetS in adolescents. The results are expressed as the means ± standard errors (SE). A two-tailed p-value of <0.05 was considered to be statistically significant. The Pearson’s correlation coefficients were calculated to measure the extent of correlation between pairs of variables.

3. Results

3.1. Participants

A total of 148 obese adolescents between the ages of 14–16 years and both sexes (male; n = 82 and female; n = 66) participated in the current study. Among the total participants, 74 adolescents belonged to the MUO group, while the other 74 adolescents belonged to the MHO group.

3.2. Anthropometric Parameters, Characteristics, and Laboratory Measurements of MUO and MHO in Adolescents

The anthropometric parameters, characteristics, and laboratory measurements of MUO and MHO in adolescents are shown in Table 1. Sex was not significantly different between the MUO and MHO groups. Weight, BMI, WC, HC, and body fat in the MUO group was higher than in the MHO group. However, the difference was not significant. The mean of height, SBP, DBP, fat-free mass (FFM), BMI percentage (BMI%), weight per age percentile (weightth), and BMR in the MUO group was significantly higher than in the MHO group (p = 0.0148, p < 0.0001, p < 0.0001, p = 0.0169, p = 0.0164, p = 0.0073, and p = 0.0480, respectively). The mean value of AST, ALT, red blood cell (RBC), hemoglobin (Hb), hematocrit (Hct), platelet (Plt), and insulin was not significantly different between the two groups. The white blood cell count and glucose levels in the MUO group were significantly higher than in the MHO group; however, these levels were in a normal range for adolescents. We adjusted for factors such as age, sex, and BMI variable, except for self-correction.

3.3. Plasma Lipid Profiles of MUO and MHO in Adolescents

The TGs in the adolescents in the MUO group were higher than those in the MHO group (p < 0.0001, Table 1). On the contrary, there was no significant difference in the T-cholesterol, LDL-cholesterol, and HDL-cholesterol levels between adolescents in the MUO group and those in the MHO group. We adjusted for factors such as age, sex, and BMI variable.

3.4. IR Assessment Index of MUO and MHO in Adolescents

The TyG index of the IR assessment index was significantly higher in the MUO group than in the MHO group (p < 0.0001, Table 1). However, the HOMA-IR was not significantly different between the two groups. We adjusted for factors such as age, sex, and BMI variable.

3.5. The Metabolites of MUO and MHO in Adolescents

When individual metabolites were considered, three ACs, five AAs, glutamine/glutamate (Gln/Glu) ratio, three BAs, and two GPLs were observed, which were significantly associated with a higher incidence of MUO in adolescents (Table 2). The acetylcarnitine (C2), hydroxy propionyl carnitine (C3-OH), and methyl glutaryl carnitine (C5-M-DC) of ACs were significantly different between the adolescents of the MUO group and those of the MHO group (p = 0.0184, p < 0.0001, and p = 0.0273, respectively). AAs such as alanine (Ala), glutamine (Gln), histidine (His), lysine (Lys), and serine (Ser) were significantly different between the adolescents of the MUO group and those of the MHO group (p = 0.0125, p = 0.0041, p = 0.0322, p = 0.0371, and p = 0.0061, respectively). The Gln/Glu ratio in the MUO group was significantly higher than in the MHO group (p = 0.0179). The BAs, such as kynurenine, methionine-sulfoxide (Met-SO), and spermidine, were significantly different between the adolescents of the MUO group and the adolescents of the MHO group (p = 0.0003, p = 0.0194, and p = 0.0346, respectively). The phosphatidylcholine (PC) diacyl (aa) (C32:2 and C34:1) of GPLs were significantly different between the adolescents of the MUO group and the adolescents of the MHO group (p = 0.0397 and p = 0.0402, respectively). The SPLs were not significantly different between the adolescents of the two groups.

3.6. Predictors of the MUO Adolescents’ Prevalence ORs on Significantly Different Metabolites

Predictors of the MUO adolescents’ prevalence ORs on significantly different metabolites are shown in Table 3. ORs for MUO prevalence were each fold higher in the upper quartiles of the C2 [OR; 1.606; 95% confidence interval (CI): 1.191–2.165; p = 0.0014], Ala [OR; 1.621; 95% CI: 1.194–2.200; p = 0.0014], Glu [OR; 1.364; 95% CI: 1.024–1.818; p = 0.0316], Gln/Glu ratio [OR; 0.735; 95% CI: 0.547–0.988; p = 0.0388], kynurenine [OR; 1.661; 95% CI: 1.222–2.259; p = 0.0008], Met-SO [OR; 1.983; 95% CI: 1.371–2.867; p = 0.0001], C34:1 [OR; 1.424; 95% CI: 1.057–1.917; p = 0.0180], HOMA-IR [OR; 1.360; 95% CI: 1.012–1.827; p = 0.0388], and TyG index [OR; 2.046; 95% CI: 1.476–2.835; p < 0.0001]. On the other hand, every other metabolite, except for these metabolites, showed no significant difference between the adolescents in the MUO group and the adolescents in the MHO group.

3.7. The Nutrition Intakes of MUO and MHO in Adolescents

The nutrition intakes of MUO and MHO in adolescents are shown in Table 4. All factors of nutrition intake were not significantly different between adolescents in the MUO group and those in the MHO group.

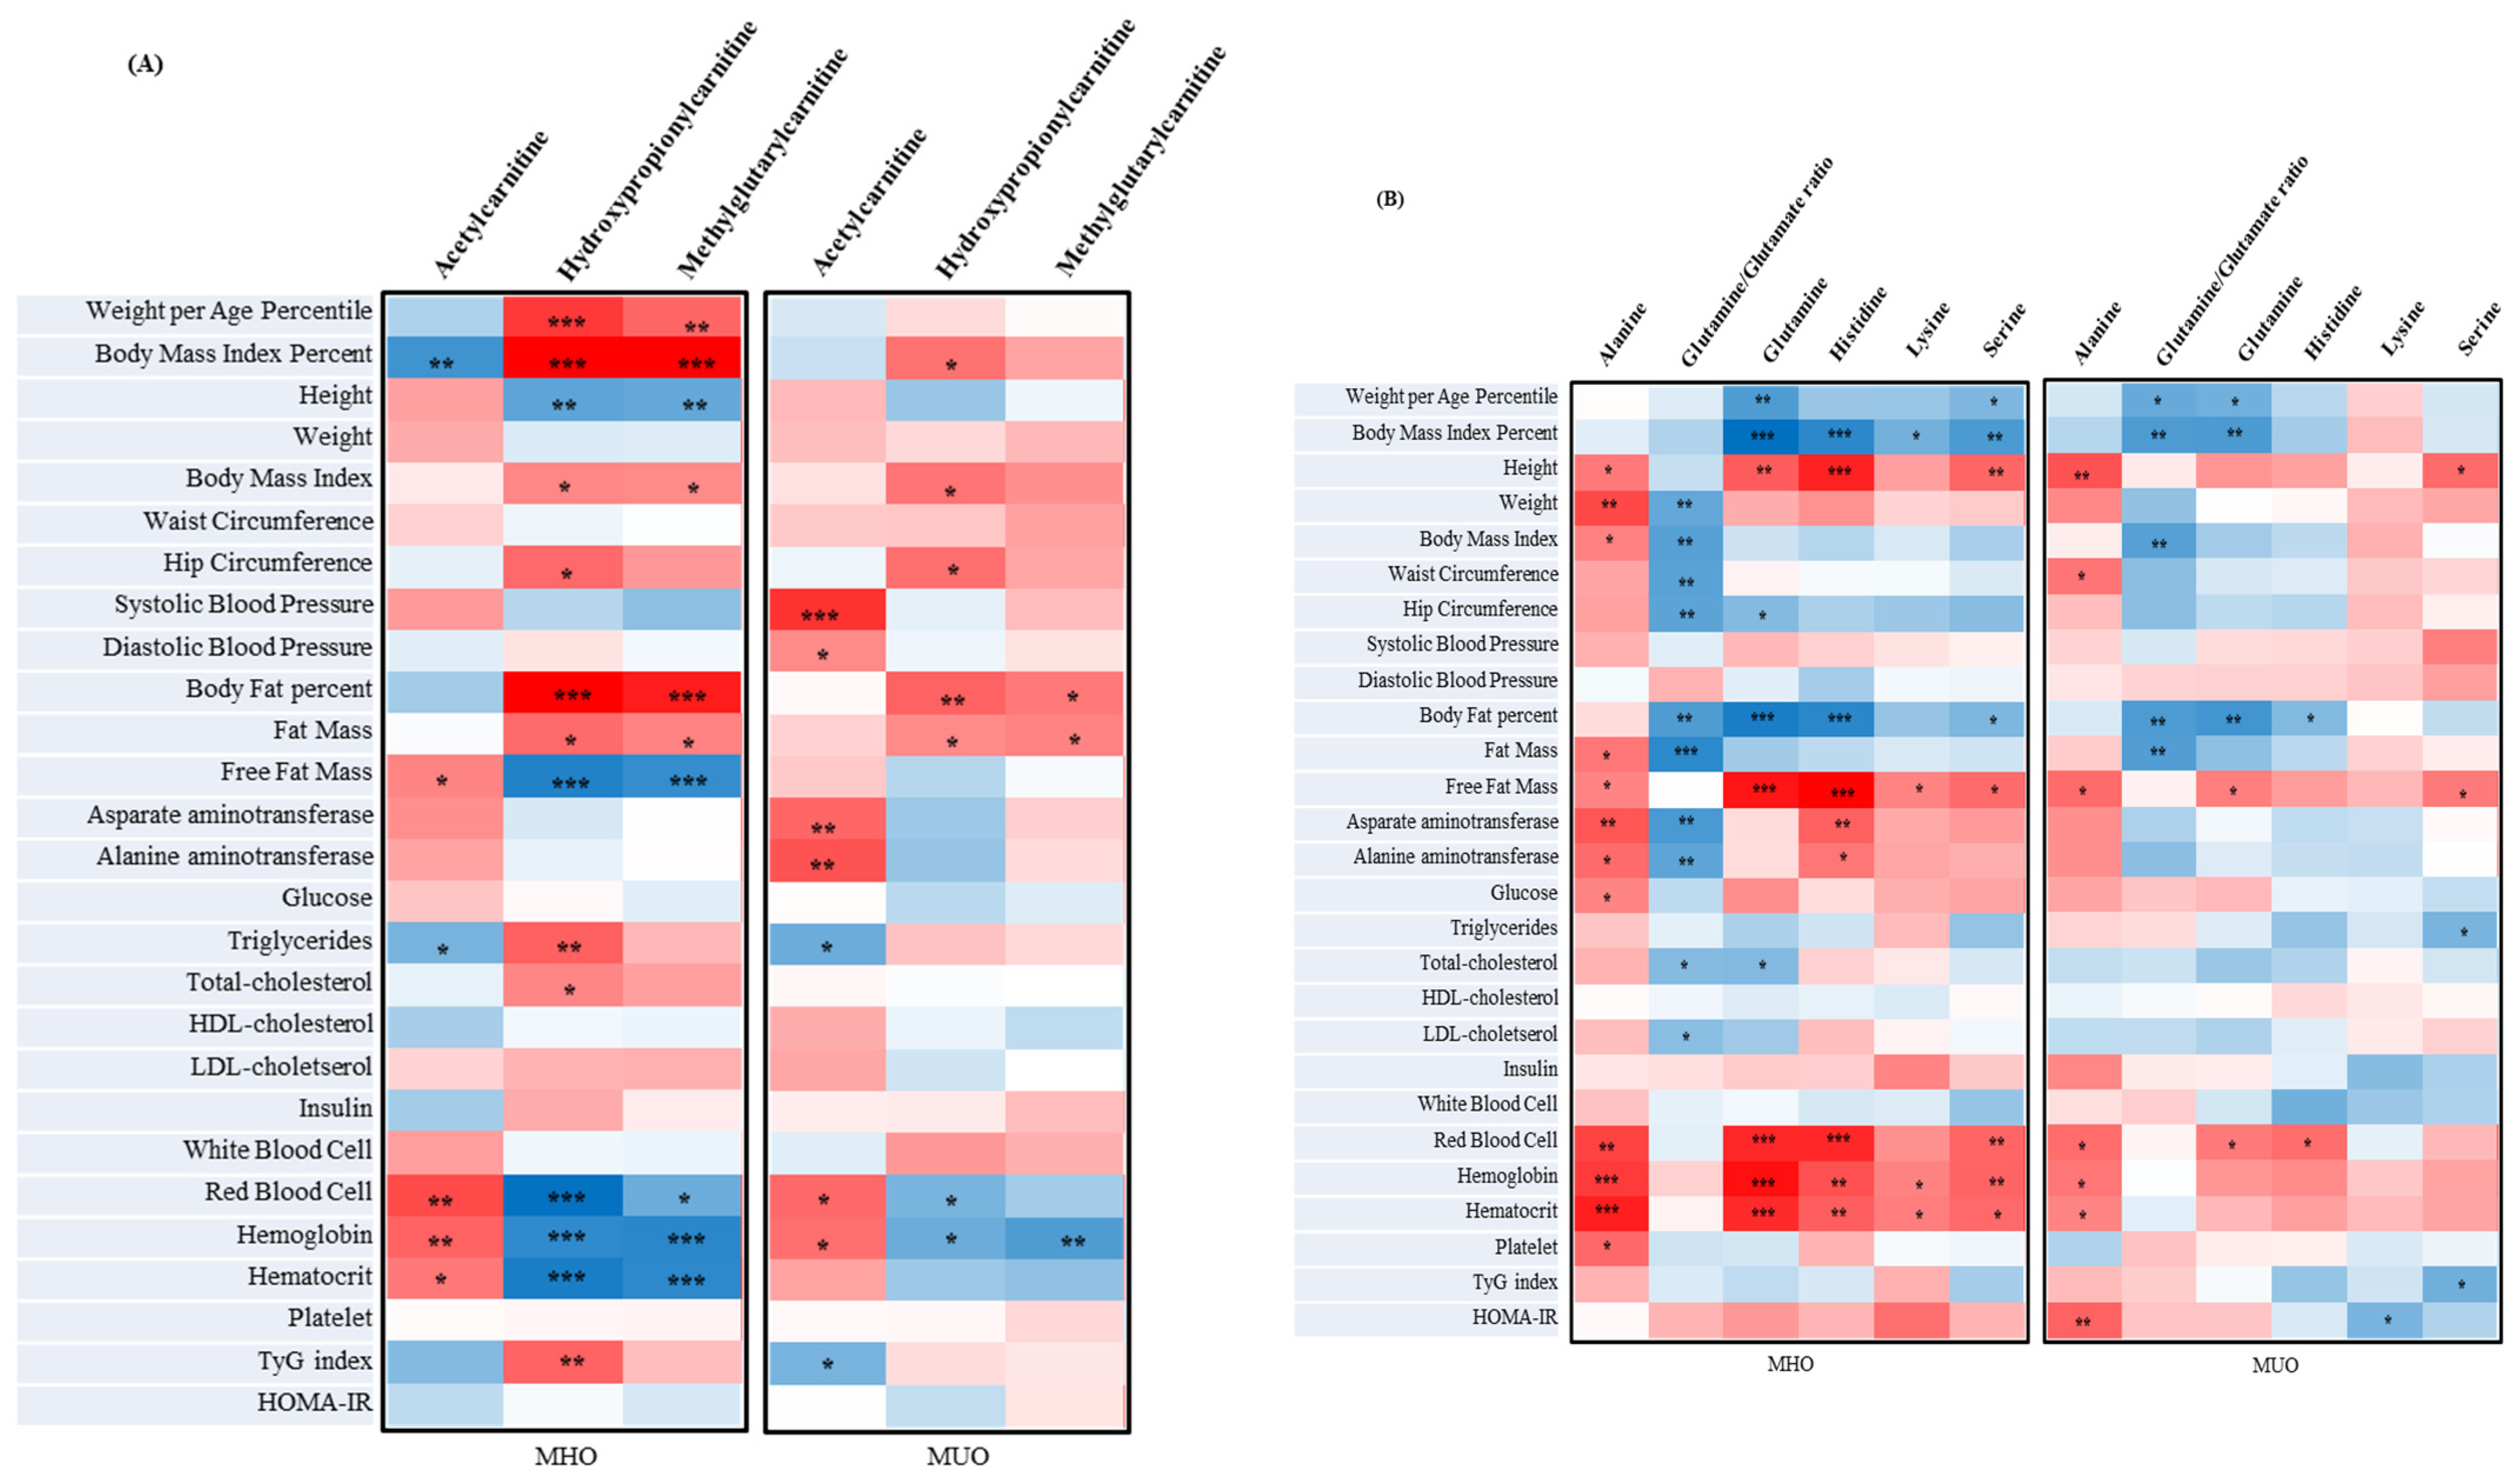
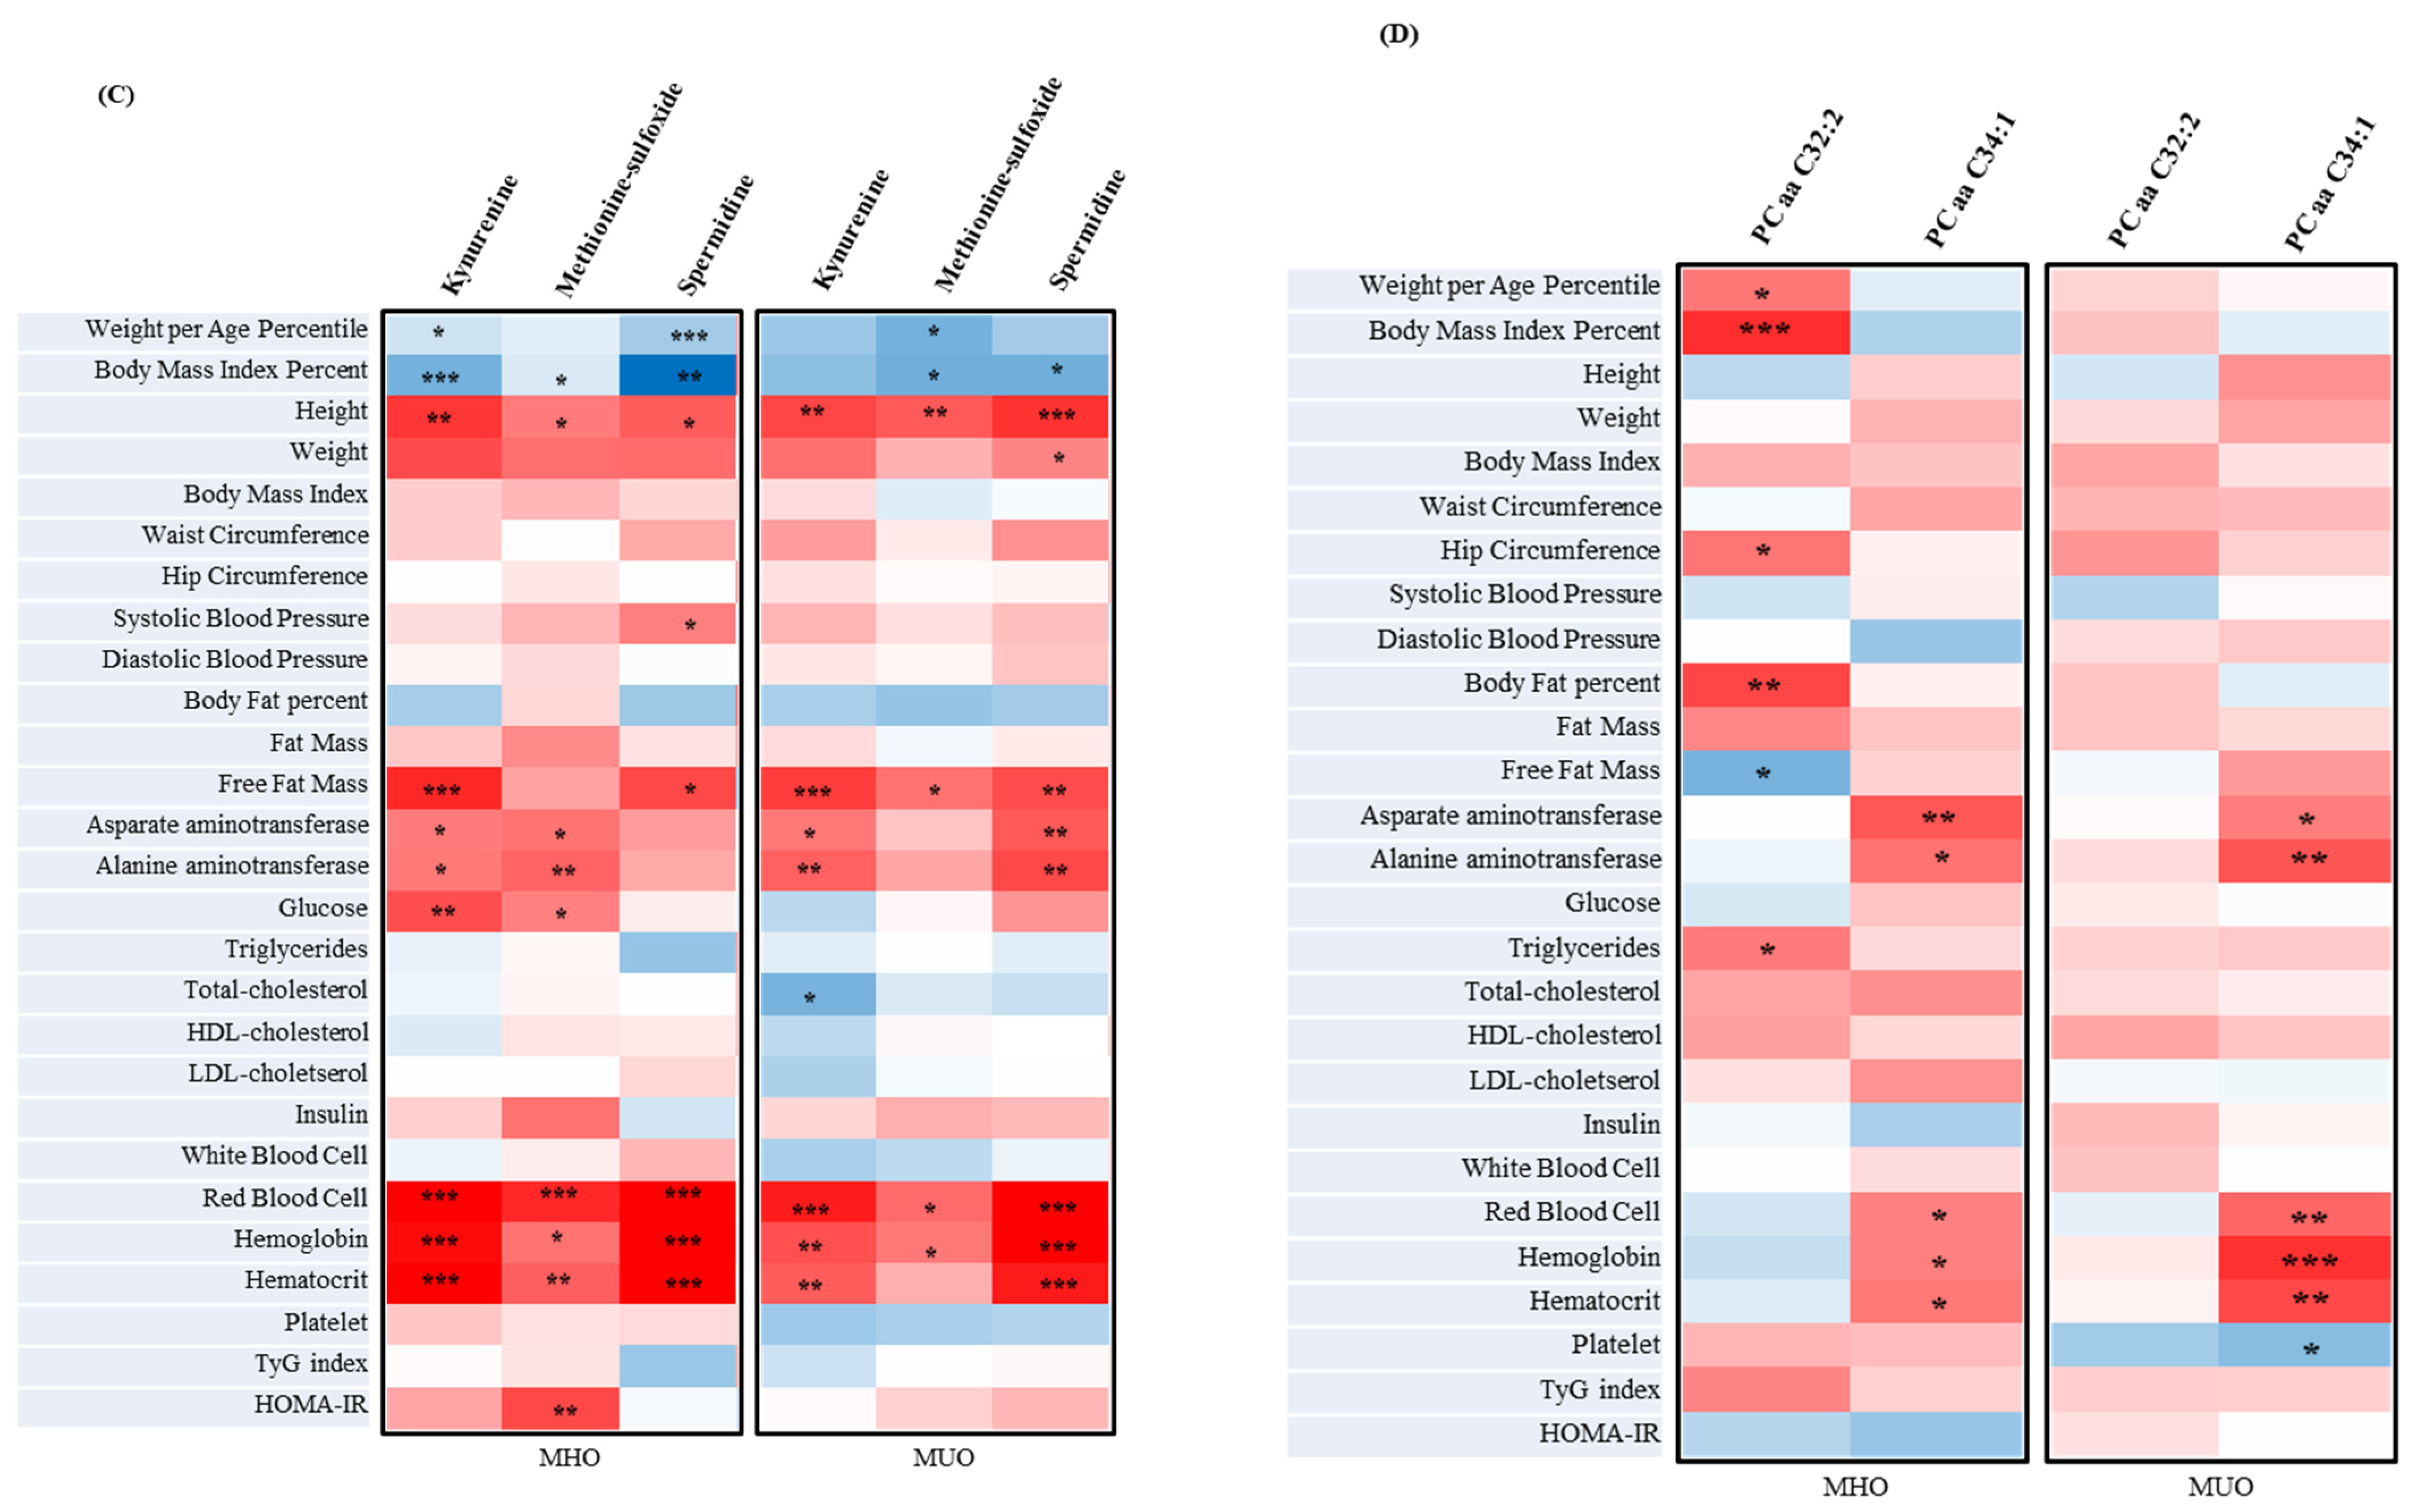
3.8. The Correlation between Metabolites Associated with Clinical Parameters and IR Assessment Index of MUO and MHO in Adolescents

The current study expressed a correlation heatmap containing the metabolites, clinical parameters and IR assessment index of MUO and MHO in adolescents (Figure 1A–D). For example, C3-OH correlated positively with the weightth, BMI%, BMI, HC, BF%, fat mass, TGs, T-cholesterol, and TyG index and correlated negatively with height, FFM, RBC, Hb, and Hct (Figure 1A) in the adolescents of the MHO group. In addition, Figure 1A shows that C3-OH significantly positively correlated with BMI%, BMI, HC, BF%, and body fat mass (r = 0.27735, p = 0.0167, r = 0.27335, p = 0.0184, r = 0.28242, p = 0.0148, r = 0.30879, p = 0.0074, and r = 0.23006, p = 0.0486, respectively) and correlated negatively with RBC and Hb in the adolescents of the MUO group (r = −0.26086, p = 0.0248, and r = 0.28790, p = 0.0129, respectively). Moreover, Figure 1A shows that C2 significantly positively correlated with DBP (r = 0.23090, p = 0.0478, respectively), Lys correlated negatively with HOMA-IR (Figure 1B; r = −0.26173, p = 0.0243), and PCaaC34:1 correlated negatively with Plt (Figure 1D; r = −0.23320, p = 0.0455) in the adolescents of the MUO group. His correlated positively with AST and ALT in the adolescents of the MHO group (Figure 1B; r = 0.31157, p = 0.0069 and r = −0.27001, p = 0.0200, respectively). These were inverse correlations in each group.

4. Discussion

This study investigated the difference or/and relationship of clinical features and metabolites between MHO and MUO in adolescents. To investigate the clinical features of MetS in obese adolescents, this study divided the participants into MHO and MUO groups, according to the IDF criteria. The results reveal that there were significant differences between the adolescents in the MHO group and those in the MUO group in terms of laboratory measurements, IR assessment index, and lipid profiles. Furthermore, there were significant differences in the three ACs, five AAs, Gln/Glu ratio, three BAs, and two GPLs between the adolescents in the MHO group and those in the MUO group. The results show that several metabolites were associated with the prevalence of MUO in adolescents. Additionally, several metabolites were inversely correlated with MHO in adolescents of the MUO group. Thus, MUO adolescents have metabolic characteristics despite the same obesity.
Despite the same obese adolescents (even nutrition intake was not significantly different), the obesity or MetS diagnosis factors were significantly different between the adolescents of the MHO group and the adolescents of the MUO group. These factors are known to be good biomarkers of obesity and MetS [21]. In the current study, AST and ALT were positively correlated with His in the adolescents of the MHO group, whereas in the adolescents of the MUO group, an inverse correlation was found. Obese individuals or those with T2DM or IR had a high level of AST and ALT [22]. Some research has shown that although levels of AST and ALT are increased [23], His concentrations are lower [24] in patients with CVD. However, research reported that there was an increase in liver AST following an intake of His supplementation by obese women with MetS [25]. Further research is warranted to understand the correlation between AST, ALT, and His in obese or MetS adolescents.
Unlike the HOMA-IR, the TyG index was significantly higher in the adolescents of the MUO group than in the adolescents of the MHO group. Moreover, the OR for MUO prevalence was 2.046-fold higher for higher quartiles of the TyG index. Recently, the TyG index is being considered an IR assessment index along with HOMA-IR [26]. In addition, studies have reported that the TyG index is more appropriate for the diagnosis of T2DM than weight gain [27]. Thus, the TyG index could be a good biomarker of MetS in obese adolescents.
The C2, C3-OH, and C5-M-DC of ACs were significantly different between the adolescents of the MHO group and those of the MUO group. Unlike in adolescents of the MHO group, the C2 was positively correlated with DBP in adolescents of the MUO group. Additionally, the OR for MUO prevalence was 1.606-fold higher for higher quartiles of the C2. ACs have a trend to increase the level of individuals who have a risk of obesity and MetS [28]. ACs are divided by the length of carbon chains in the molecular structure, such as free carnitine; C0, short-chain; C2–C5, medium-chain; C6–C12, and long-chain C14–C18 [29]. C2 of short-chain ACs has a positive correlation with BMI in patients with T2DM [30]. Furthermore, C2 has been associated with SBP [31]. Some research showed that the level of C3-OH was significantly higher in patients with peripheral artery disease, diabetic nephropathy, and DM than in the control group [32,33]. A study showed that C5-M-DC was associated with IR, in mice with DM [34]. In addition, C5-M-DC has a strong relationship between glomerular filtrating rate and creatinine in patients with CVD [35]. Furthermore, the current study investigated the predictors of the MUO adolescent prevalence as ACs by length. As a result of the odds ratio for each length of the AC quartile and the occurrence of MUO, there was a significant difference only in the quartile of short-chain AC (Table S2, Supplementary Meterials). Some research suggested that an increase in short-chain ACs was associated with MetS such as T2DM and obesity [36,37]. Therefore, C2, C3-OH, and C5-M-DC of ACs may be metabolic biomarkers of related MetS in obese adolescents.
The Gln, His, Lys, Ser, and Gln/Glu ratios were significantly lower in the adolescents of the MUO group than in the adolescents of the MHO group. On the contrary, Ala was significantly higher in the adolescents of the MUO group compared with the adolescents of the MHO group. According to a study, levels of Ala were higher in obese individuals than in normal-weight individuals [38]. Furthermore, Ala is a gluconeogenic substrate secreted by skeletal muscle at higher levels in patients with DM [39]. Some studies have suggested that Ser has therapeutic potential for DM [40], such as improved regulation of blood glucose [41] and insulin secretion [42]. Lys levels were decreased in MetS individuals (in particular, cardio-metabolic features and inflammatory biomarkers), as per a study [43]. Another study suggested that Lys has potential protective effects against MetS [44]. These results are in line with the results of our study. Therefore, Ala, Gln, His, Lys, and Ser might be good biomarkers of MetS in obese adolescents. According to Cheng et al. [45], individuals with MetS have increased levels of the Gln/Glu ratio. Moreover, some researchers have suggested that Gln/Glu ratios [46,47] are associated with MetS such as DM, CVD, and IR. In addition, in the present study, the level of Glu was higher in the MUO group than in the MHO group; however, it was not significant (Table 2). Thus, Glu, Gln, and Gln/Glu ratios are useful biomarkers of MetS in adolescents. However, Gln was significantly lower in hyperuricemia patients with MetS [48]. Therefore, detailed studies and research regarding MetS and other diseases in individuals, are required in the future.
The kynurenine, Met-SO, and spermidine were significantly higher in the adolescents of the MUO group than in those of the MHO group. Some researchers reported that high levels of kynurenine are associated with obesity [49], idiopathic pulmonary arterial hypertension [50], and IR [51]. Met-SO was significantly lower in patients with HTN who were on a low-sodium diet [52] and significantly higher in patients with DM [53]. Thus, the results of this study suggest that kynurenine and Met-SO are associated with MetS in obese adolescents. According to Choksomngam et al. [54], in animal models, spermidine supplementation has been shown to protect against diet-induced obesity. Furthermore, in humans [55] and mice [56], spermidine intake correlates with reduced blood pressure and decreased risk of CVD. In the current study, the levels of spermidine were higher in the adolescents of the MUO group than in adolescents of the MHO group. The results of this study are the opposite of the results of some studies. Therefore, further studies are needed to understand the effects of spermidine in MUO and MHO in adolescents.
The results of the present study show that two GPLs were significantly higher in the adolescents of the MUO group than in the adolescents of the MHO group. According to Jové et al. [57], levels of GPLs were higher in the overweight and obese group with MetS than in the overweight and obese group without MetS. Furthermore, GPLs are associated with related MetS factors such as LDL-cholesterol, glucose, and IR in humans [58] and rats [59]. However, for each length or double bond, the GPLs may be different in the individuals with MetS. In this study, PCaaC34:1 as a significant biomarker had a significantly higher prevalence OR of MUO in adolescents as against PCaaC32:2. There is research that PCaaC34:1 reduction in type 1 DM [60], an increase in Alzheimer’s disease [61] and sepsis could occur in the event of community-acquired pneumonia [60]. However, there is insufficient research regarding PCaaC34:1 in individuals with MetS or obesity. Despite the need for further studies of GPLs in adolescents with MetS, the results of this study suggest that GPLs have the potential as MetS biomarkers in obese adolescents.
In particular, this study focused on two results. First, MetS associated an increase in short-chain ACs in obese adolescents. Second, the correlation results of Lys (with HOMA-IR) and PCaaC34:1 (with Plt) in adolescents in the MUO group and His (with AST and ALT) correlation results in adolescents in the MHO group. Furthermore, the TyG index also indicated a deeper relationship with the adolescents in the MUO group than with the adolescents in the MHO group. By showing differences from the results of the MHO group, these results suggest biomarkers associated with MetS in obese adolescents. However, this study had certain limitations. Due to the cross-sectional design of the study, it was difficult to establish a causal relationship between metabolites and MetS in adolescents. Another limitation of this study is that it was conducted with a small number of Korean adolescents aged 14–16 years. Hence, the application of general metabolite properties for MetS obtained in the present study may be limited in adolescents of other ages, such as preschool children or adolescents aged 17 years and older, and could not be a population of all races. Therefore, further studies using large sample sizes or more varied races are required to investigate the interaction between metabolites and MetS in adolescents.
Nevertheless, the strength of this study is that it thoroughly measured and analyzed various clinical and metabolic parameters of the participants, and investigated independent predictors of the odds ratio and the presence or absence of MetS. Furthermore, the study’s findings add to the evidence of the potential use of these biomarkers to identify and characterize MUO adolescents. Obesity in children and adolescents is caused by an imbalance in energy intake and physiological activity [62], or a complex factor of environment and genetics [63], which is why comprehensive and in-depth research on metabolic syndrome caused by obesity is necessary. Metabolites are useful biomarkers that reflect the clinical state of these metabolic syndromes [64,65]. That is the reason why biomarker discovery will play an essential role in the prediction, diagnosis, and management of metabolic syndrome in the future. It is important to define obesity using biochemical factors in addition to anthropometric and clinical factors. As shown in the results of this study, clinically, the same obesity clearly exists as healthy obesity and unhealthy obesity, but the differences were seen in biomarkers predicting metabolic syndrome. In other words, several metabolites found in this study will function as predictive biomarkers for being metabolically unhealthy in obese adolescents.
Ultimately, the present study suggests that several metabolite biomarkers of MetS found in this study are characteristic of MUO adolescents. Additionally, these metabolites and the TyG index proved to be excellent biomarkers reflecting the presence of MetS clinical symptoms and IR-related diseases. Consequently, the results of this study will be a reliable reference for specific biomarkers related to metabolic syndrome in MUO adolescents.

5. Conclusions

The current study found significant differences in certain AAs, ACs, BAs, GPLs, and the Gln/Glu ratio between the MUO and MHO groups. In addition, the study observed that His, Lys, PCaaC34:1, and several clinical factors in adolescents of the MUO group were reverse correlated with the results in adolescents of the MHO group. The TyG index also was related to MUO in adolescents compared with HOMA-IR. In particular, it was associated with C2, Ala, Glu, Gln/Glu ratio, kynurenine, Met-SO, C34:1, HOMA-IR, and TyG index in MUO adolescents. Therefore, these biomarkers found in this study have the potential to reflect the clinical outcomes of MUO in adolescents. These biomarkers will lead to a better understanding of the specificity and properties of MetS in obese adolescents.

Supplementary Materials

The following supporting information can be downloaded at: https://www.mdpi.com/article/10.3390/children10020322/s1.

Author Contributions

S.J. conceptualized the study, curated and analyzed the data, wrote the original draft, reviewed and edited the manuscript, and administered the project. H.-B.J. reviewed and edited the manuscript and contributed to the discussion. H.-J.K. contributed to the curation, investigation, acquisition, and analysis of the data. H.-J.L. contributed to the conceptualization and interpretation of the data, project administration, and supervision. All authors critically revised the manuscript, read and approved the final manuscript, and agreed to be held fully accountable for the integrity and accuracy of the work. All authors have read and agreed to the published version of the manuscript.

Funding

This research was supported by a fund (2020-NG-012 and 2019-NI-088) in the research of Korea Disease Control and Prevention Agency.

Institutional Review Board Statement

The study was conducted in accordance with the Declaration of Helsinki and approved by the Institutional Ethics Committee of the Institutional Review Board (IRB) of the Korea National Institute of Health (KNIH; IRB No. 2020-07-05-P-A), 5 July 2020.

Informed Consent Statement

Informed consent was obtained from all subjects involved in the study.

Data Availability Statement

All data generated or analyzed during this study are included in this article. The datasets generated and/or analyzed during the current study are not publicly available due [reason for research ethics] but are available from the corresponding author on reasonable request.

Conflicts of Interest

The authors declare no conflict of interest.

Abbreviation

AAAmino acid
ACAcylcarnitine
AlaAlanine
ALTAlanine aminotransferase
ASTAspartate aminotransferase
BABiogenic amine
BMRBasal Metabolic Rate
BF%Body fat percentage
BMIBody mass index
C2Acetylcarnitine
C3-OHHydroxy propionyl carnitine
C5-M-DCMethyl glutaryl carnitine
CIConfidence interval
CVDCardiovascular disease
DBPDiastolic blood pressure
DMDiabetes mellitus
FFMFree fat mass
GlnGlutamine
GluGlutamate
GPLGlycerophospholipid
HCHip circumference
HctHematocrit
HDL-cholesterolHigh-density lipoprotein cholesterol
HbHemoglobin
HisHistidine
HOMA-IRHomeostasis model assessment of insulin resistance
HTNHypertension
IDFInternational Diabetes Foundation
IRInsulin resistance
IRBInstitutional Review Board
KNIHKorea National Institute of Health
LDL-cholesterolLow-density lipoprotein cholesterol
LysLysine
MetS Metabolic syndrome
Met-SOMethionine-sulfoxide
MHOMetabolically healthy obesity
MUOMetabolically unhealthy obesity
OROdds ratio
PCaaPhosphatidylcholine diacyl
PltPlatelet
RBCRed blood cell
SAS Statistical Analysis System
SBPSystolic blood pressure
SEStandard errors
SerSerine
SPLSphingolipid
T2DMType 2 diabetes mellitus
T-cholesterolTotal cholesterol
TGTriglyceride
TyGTriglycerid-glucose
WCWaist circumference
weightthWeight per age percentile

References

  1. WHO. Obesity and Overweight. Available online: https://www.who.int/news-room/fact-sheets/detail/obesity-and-overweight (accessed on 9 June 2021).
  2. Division of Health and Nutrition Survey; Center for Disease Prevention; KCDC. The 2017 Korean National Growth Charts for Children and Adolescents; KCDC: Chungcheongbuk-do, Korea, 2017; pp. 1–78. [Google Scholar]
  3. Nikolopoulou, A.; Kadoglou, N.P. Obesity and metabolic syndrome as related to cardiovascular disease. Expert Rev. Cardiovasc. Ther. 2012, 10, 933–939. [Google Scholar] [CrossRef]
  4. Guasch, A.; Bulló, M.; Rabassa, A.; Bonada, A.; Del Castillo, D.; Sabench, F.; Salas-Salvadó, J. Plasma vitamin D and parathormone are associated with obesity and atherogenic dyslipidemia: A cross-sectional study. Cardiovasc. Diabetol. 2012, 11, 149. [Google Scholar]
  5. Lorenzo, C.; Okoloise, M.; Williams, K.; Stern, M.P.; Haffner, S.M. The metabolic syndrome as predictor of type 2 diabetes: The San Antonio heart study. Diabetes Care 2003, 26, 3153–3159. [Google Scholar]
  6. Lonardo, A.; Mantovani, A.; Lugari, S.; Targher, G. Epidemiology and pathophysiology of the association between NAFLD and metabolically healthy or metabolically unhealthy obesity. Ann. Hepatol. 2020, 19, 359–366. [Google Scholar]
  7. American college of obstetricians and gynecologists. ACOG committee opinion No. 714: Obesity in adolescents. Obstet. Gynecol. 2017, 130, e127–e140. [Google Scholar]
  8. Oh, A.C.Y.; Lee, D. 2013–2017 Obesity Fact Sheet; Korea Health Promotion Institute: Seoul, Republic of Korea, 2018; pp. 1–53. [Google Scholar]
  9. Umer, A.; Kelley, G.A.; Cottrell, L.E.; Giacobbi, P.; Innes, K.E.; Lilly, C.L. Childhood obesity and adult cardiovascular disease risk factors: A systematic review with meta-analysis. BMC Public Health 2017, 17, 1–24. [Google Scholar] [CrossRef]
  10. Kaur, J. Assessment and screening of the risk factors in metabolic syndrome. Med. Sci. 2014, 2, 140–152. [Google Scholar]
  11. Socha, P.; Hellmuth, C.; Gruszfeld, D.; Demmelmair, H.; Rzehak, P.; Grote, V.; Weber, M.; Escribano, J.; Closa-Monasterolo, R.; Dain, E. Endocrine and metabolic biomarkers predicting early childhood obesity risk. Prev. Asp. Early Nutr. 2016, 85, 81–88. [Google Scholar]
  12. de Rocha, A.R.F.; de Morais, N.S.; Priore, S.E.; do CC Franceschini, S. Inflammatory Biomarkers and Components of Metabolic Syndrome in Adolescents: A Systematic Review. Inflammation 2021, 45, 14–30. [Google Scholar]
  13. Balagopal, P.; De Ferranti, S.D.; Cook, S.; Daniels, S.R.; Gidding, S.S.; Hayman, L.L.; McCrindle, B.W.; Mietus-Snyder, M.L.; Steinberger, J. Nontraditional risk factors and biomarkers for cardiovascular disease: Mechanistic, research, and clinical considerations for youth: A scientific statement from the American Heart Association. Circulation 2011, 123, 2749–2769. [Google Scholar]
  14. Silverstein, J.; Klingensmith, G.; Copeland, K.; Plotnick, L.; Kaufman, F.; Laffel, L.; Deeb, L.; Grey, M.; Anderson, B.; Holzmeister, L.A. Care of children and adolescents with type 1 diabetes: A statement of the American Diabetes Association. Diabetes Care 2005, 28, 186–212. [Google Scholar] [CrossRef]
  15. Iacobini, C.; Pugliese, G.; Fantauzzi, C.B.; Federici, M.; Menini, S. Metabolically healthy versus metabolically unhealthy obesity. Metabolism 2019, 92, 51–60. [Google Scholar]
  16. Smolinska, A.; Blanchet, L.; Buydens, L.M.; Wijmenga, S.S. NMR and pattern recognition methods in metabolomics: From data acquisition to biomarker discovery: A review. Anal. Chim. Acta 2012, 750, 82–97. [Google Scholar]
  17. Al-Hamad, D.; Raman, V. Metabolic syndrome in children and adolescents. Transl. Pediatr. 2017, 6, 397. [Google Scholar] [CrossRef]
  18. Valainathan, S.; Boukris, A.; Arapis, K.; Schoch, N.; Goujon, G.; Konstantinou, D.; Bécheur, H.; Pelletier, A. Energy expenditure in acute pancreatitis evaluated by the Harris–Benedict equation compared with indirect calorimetry. Clin. Nutr. ESPEN 2019, 33, 57–59. [Google Scholar]
  19. Wallace, T.M.; Levy, J.C.; Matthews, D.R. Use and abuse of HOMA modeling. Diabetes Care 2004, 27, 1487–1495. [Google Scholar]
  20. Nor, N.S.M.; Lee, S.; Bacha, F.; Tfayli, H.; Arslanian, S. Triglyceride glucose index as a surrogate measure of insulin sensitivity in obese adolescents with normoglycemia, prediabetes, and type 2 diabetes mellitus: Comparison with the hyperinsulinemic–euglycemic clamp. Pediatr. Diabetes 2016, 17, 458–465. [Google Scholar]
  21. Sagun, G.; Oguz, A.; Karagoz, E.; Filizer, A.T.; Tamer, G.; Mesci, B. Application of alternative anthropometric measurements to predict metabolic syndrome. Clinics 2014, 69, 347–353. [Google Scholar]
  22. Ong, J.P.; Elariny, H.; Collantes, R.; Younoszai, A.; Chandhoke, V.; Reines, H.D.; Goodman, Z.; Younossi, Z.M. Predictors of nonalcoholic steatohepatitis and advanced fibrosis in morbidly obese patients. Obes. Surg. 2005, 15, 310–315. [Google Scholar]
  23. Kunutsor, S.K.; Bakker, S.J.; Kootstra-Ros, J.E.; Blokzijl, H.; Gansevoort, R.T.; Dullaart, R.P. Inverse linear associations between liver aminotransferases and incident cardiovascular disease risk: The PREVEND study. Atherosclerosis 2015, 243, 138–147. [Google Scholar] [CrossRef]
  24. Watanabe, M.; Suliman, M.E.; Qureshi, A.R.; Garcia-Lopez, E.; Bárány, P.; Heimbürger, O.; Stenvinkel, P.; Lindholm, B. Consequences of low plasma histidine in chronic kidney disease patients: Associations with inflammation, oxidative stress, and mortality. Am. J. Clin. Nutr. 2008, 87, 1860–1866. [Google Scholar] [CrossRef]
  25. Feng, R.N.; Niu, Y.C.; Sun, X.W.; Li, Q.; Zhao, C.; Wang, C.; Guo, F.C.; Sun, C.H.; Li, Y. Histidine supplementation improves insulin resistance through suppressed inflammation in obese women with the metabolic syndrome: A randomised controlled trial. Diabetologia 2013, 56, 985–994. [Google Scholar]
  26. Guerrero-Romero, F.; Simental-Mendía, L.E.; González-Ortiz, M.; Martínez-Abundis, E.; Ramos-Zavala, M.G.; Hernaández-Gonzaález, S.O.; Jacques-Camarena, O.; Rodríguez-Morán, M. The product of triglycerides and glucose, a simple measure of insulin sensitivity. Comparison with the euglycemic-hyperinsulinemic clamp. J. Clin. Endocrinol. Metab. 2010, 95, 3347–3351. [Google Scholar]
  27. Navarro-González, D.; Sánchez-Íñigo, L.; Fernández-Montero, A.; Pastrana-Delgado, J.; Martinez, J.A. TyG index change is more determinant for forecasting type 2 diabetes onset than weight gain. Medicine 2016, 95, e3646. [Google Scholar]
  28. Müllner, E.; Röhnisch, H.E.; Von Brömssen, C.; Moazzami, A.A. Metabolomics analysis reveals altered metabolites in lean compared with obese adolescents and additional metabolic shifts associated with hyperinsulinaemia and insulin resistance in obese adolescents: A cross-sectional study. Metabolomics 2021, 17, 1–13. [Google Scholar]
  29. Cao, B.; Wang, D.; Pan, Z.; Brietzke, E.; McIntyre, R.S.; Musial, N.; Mansur, R.B.; Subramanieapillai, M.; Zeng, J.; Huang, N.; et al. Characterizing acyl-carnitine biosignatures for schizophrenia: A longitudinal pre-and post-treatment study. Transl. Psychiatry 2019, 9, 1–13. [Google Scholar]
  30. Mihalik, S.J.; Goodpaster, B.H.; Kelley, D.E.; Chace, D.H.; Vockley, J.; Toledo, F.G.S.; Delany, J.P. Increased levels of plasma acylcarnitines in obesity and type 2 diabetes and identification of a marker of glucolipotoxicity. Obesity 2010, 18, 1695–1700. [Google Scholar] [CrossRef]
  31. Mey, J.T.; Hari, A.; Axelrod, C.L.; Fealy, C.E.; Erickson, M.L.; Kirwan, J.P.; Dweik, R.A.; Heresi, G.A. Lipids and ketones dominate metabolism at the expense of glucose control in pulmonary arterial hypertension: A hyperglycaemic clamp and metabolomics study. Eur. Respir. J. 2020, 55, 1901700. [Google Scholar]
  32. Devi, S.; Nongkhlaw, B.; Limesh, M.; Pasanna, R.M.; Thomas, T.; Kuriyan, R.; Kurpad, A.V.; Mukhopadhyay, A. Acyl ethanolamides in Diabetes and Diabetic Nephropathy: Novel targets from untargeted plasma metabolomic profiles of South Asian Indian men. Sci. Rep. 2019, 9, 1–11. [Google Scholar]
  33. Ismaeel, A.; Franco, M.E.; Lavado, R.; Papoutsi, E.; Casale, G.P.; Fuglestad, M.; Mietus, C.J.; Haynatzki, G.R.; Smith, R.S.; Bohannon, W.T.; et al. Altered metabolomic profile in patients with peripheral artery disease. J. Clin. Med. 2019, 8, 1463. [Google Scholar] [CrossRef]
  34. Altmaier, E.; Ramsay, S.L.; Graber, A.; Mewes, H.-W.; Weinberger, K.M.; Suhre, K. Bioinformatics analysis of targeted metabolomics—Uncovering old and new tales of diabetic mice under medication. Endocrinology 2008, 149, 3478–3489. [Google Scholar]
  35. Haase, D.; Bäz, L.; Bekfani, T.; Neugebauer, S.; Kiehntopf, M.; Möbius-Winkler, S.; Franz, M.; Schulze, P.C. Metabolomic profiling of patients with high gradient aortic stenosis undergoing transcatheter aortic valve replacement. Clin. Res. Cardiol. 2021, 110, 399–410. [Google Scholar]
  36. Bene, J.; Márton, M.; Mohás, M.; Bagosi, Z.; Bujtor, Z.; Oroszlán, T.; Gasztonyi, B.; Wittmann, I.; Melegh, B. Similarities in serum acylcarnitine patterns in type 1 and type 2 diabetes mellitus and in metabolic syndrome. Ann. Nutr. Metab. 2013, 62, 80–85. [Google Scholar]
  37. Ma, Y.; Sun, L.; Li, J.; Hu, Y.; Gan, Z.; Zong, G.; Zheng, H.; Jin, Q.; Li, H.; Hu, F.B. Erythrocyte PUFAs, circulating acylcarnitines, and metabolic syndrome risk: A prospective study in Chinese. J. Lipid Res. 2019, 60, 421–429. [Google Scholar]
  38. Lee, A.; Jang, H.B.; Ra, M.; Choi, Y.; Lee, H.-J.; Park, J.Y.; Kang, J.H.; Park, K.-H.; Park, S.I.; Song, J. Prediction of future risk of insulin resistance and metabolic syndrome based on Korean boy’s metabolite profiling. Obes. Res. Clin. Pract. 2015, 9, 336–345. [Google Scholar] [CrossRef]
  39. Okun, J.G.; Rusu, P.M.; Chan, A.Y.; Wu, Y.; Yap, Y.W.; Sharkie, T.; Schumacher, J.; Schmidt, K.V.; Roberts-Thomson, K.M.; Russell, R.D. Liver alanine catabolism promotes skeletal muscle atrophy and hyperglycaemia in type 2 diabetes. Nat. Metab. 2021, 3, 394–409. [Google Scholar] [CrossRef]
  40. Holm, L.J.; Buschard, K. L-serine: A neglected amino acid with a potential therapeutic role in diabetes. APMIS 2019, 127, 655–659. [Google Scholar] [CrossRef]
  41. Holm, L.J.; Krogvold, L.; Hasselby, J.P.; Kaur, S.; Claessens, L.A.; Russell, M.A.; Mathews, C.E.; Hanssen, K.F.; Morgan, N.G.; Koeleman, B.P.C.; et al. Abnormal islet sphingolipid metabolism in type 1 diabetes. Diabetologia 2018, 61, 1650–1661. [Google Scholar] [CrossRef]
  42. Vangipurapu, J.; Stancáková, A.; Smith, U.; Kuusisto, J.; Laakso, M. Nine amino acids are associated with decreased insulin secretion and elevated glucose levels in a 7.4-year follow-up study of 5,181 Finnish men. Diabetes 2019, 68, 1353–1358. [Google Scholar]
  43. Reddy, P.; Leong, J.; Jialal, I. Amino acid levels in nascent metabolic syndrome: A contributor to the pro-inflammatory burden. J. Diabetes Complicat. 2018, 32, 465–469. [Google Scholar]
  44. Patel, A.; Abdelmalek, L.; Thompson, A.; Jialal, I. Decreased homoserine levels in metabolic syndrome. Diabetes Metab. Syndr. Clin. Res. Rev. 2020, 14, 555–559. [Google Scholar] [CrossRef]
  45. Cheng, S.; Rhee, E.P.; Larson, M.G.; Lewis, G.D.; McCabe, E.L.; Shen, D.; Palma, M.J.; Roberts, L.D.; Dejam, A.; Souza, A.L.; et al. Metabolite profiling identifies pathways associated with metabolic risk in humans. Circulation 2012, 125, 2222–2231. [Google Scholar] [CrossRef]
  46. Papandreou, C.; Hernández-Alonso, P.; Bulló, M.; Ruiz-Canela, M.; Li, J.; Guasch-Ferré, M.; Toledo, E.; Clish, C.; Corella, D.; Estruch, R.; et al. High Plasma Glutamate and a Low Glutamine-to-Glutamate Ratio Are Associated with Increased Risk of Heart Failure but Not Atrial Fibrillation in the Prevención con Dieta Mediterránea (PREDIMED) Study. J. Nutr. 2020, 150, 2882–2889. [Google Scholar] [CrossRef]
  47. Liu, X.; Zheng, Y.; Guasch-Ferré, M.; Ruiz-Canela, M.; Toledo, E.; Clish, C.; Liang, L.; Razquin, C.; Corella, D.; Estruch, R.; et al. High plasma glutamate and low glutamine-to-glutamate ratio are associated with type 2 diabetes: Case-cohort study within the PREDIMED trial. Nutr. Metab. Cardiovasc. Dis. 2019, 29, 1040–1049. [Google Scholar]
  48. Zhang, Y.; Zhang, H.; Rong, S.; Bian, C.; Yang, Y.; Pan, H. NMR spectroscopy based metabolomics confirms the aggravation of metabolic disorder in metabolic syndrome combined with hyperuricemia. Nutr. Metab. Cardiovasc. Dis. 2021, 31, 2449–2457. [Google Scholar]
  49. Mangge, H.; Summers, K.L.; Meinitzer, A.; Zelzer, S.; Almer, G.; Prassl, R.; Schnedl, W.J.; Reininghaus, E.; Paulmichl, K.; Weghuber, D.; et al. Obesity-related dysregulation of the Tryptophan–Kynurenine metabolism: Role of age and parameters of the metabolic syndrome. Obesity 2014, 22, 195–201. [Google Scholar]
  50. Nagy, B.M.; Nagaraj, C.; Meinitzer, A.; Sharma, N.; Papp, R.; Foris, V.; Ghanim, B.; Kwapiszewska, G.; Kovacs, G.; Klepetko, W. Importance of kynurenine in pulmonary hypertension. Am. J. Physiol. -Lung Cell. Mol. Physiol. 2017, 313, L741–L751. [Google Scholar]
  51. Oxenkrug, G. Insulin resistance and dysregulation of tryptophan–kynurenine and kynurenine–nicotinamide adenine dinucleotide metabolic pathways. Mol. Neurobiol. 2013, 48, 294–301. [Google Scholar]
  52. Derkach, A.; Sampson, J.; Joseph, J.; Playdon, M.C.; Stolzenberg-Solomon, R.Z. Effects of dietary sodium on metabolites: The Dietary Approaches to Stop Hypertension (DASH)–Sodium Feeding Study. Am. J. Clin. Nutr. 2017, 106, 1131–1141. [Google Scholar]
  53. Brock, J.W.; Jenkins, A.J.; Lyons, T.J.; Klein, R.L.; Yim, E.; Lopes-Virella, M.; Carter, R.E.; Thorpe, S.R.; Baynes, J.W. Increased methionine sulfoxide content of apoA-I in type 1 diabetes. J. Lipid Res. 2008, 49, 847–855. [Google Scholar]
  54. Choksomngam, Y.; Pattanakuhar, S.; Chattipakorn, N.; Chattipakorn, S.C. The metabolic role of spermidine in obesity: Evidence from cells to community. Obes. Res. Clin. Pract. 2021, 15, 315–326. [Google Scholar]
  55. Eisenberg, T.; Abdellatif, M.; Zimmermann, A.; Schroeder, S.; Pendl, T.; Harger, A.; Stekovic, S.; Schipke, J.; Magnes, C.; Schmidt, A.; et al. Dietary spermidine for lowering high blood pressure. Autophagy 2017, 13, 767–769. [Google Scholar]
  56. Eisenberg, T.; Abdellatif, M.; Schroeder, S.; Primessnig, U.; Stekovic, S.; Pendl, T.; Harger, A.; Schipke, J.; Zimmermann, A.; Schmidt, A.; et al. Cardioprotection and lifespan extension by the natural polyamine spermidine. Nat. Med. 2016, 22, 1428–1438. [Google Scholar] [CrossRef]
  57. Jové, M.; Naudí, A.; Portero-Otin, M.; Cabré, R.; Rovira-Llopis, S.; Bañuls, C.; Rocha, M.; Hernández-Mijares, A.; Victor, V.M.; Pamplona, R. Plasma lipidomics discloses metabolic syndrome with a specific HDL phenotype. FASEB J. 2014, 28, 5163–5171. [Google Scholar] [CrossRef]
  58. Sarkar, S.; Kumari, D.; Gupta, S.K.; Sharma, V.; Mukhi, S.; Kamboj, P.; Sasibhushan, V.; Rai, R.K.; Jatavallabhula, S.L.; Mahajan, D.; et al. Saroglitazar and Hepano treatment offers protection against high fat high fructose diet induced obesity, insulin resistance and steatosis by modulating various class of hepatic and circulating lipids. Biomed. Pharmacother. 2021, 144, 112357. [Google Scholar] [CrossRef]
  59. Gao, P.; Zhang, Y.; Gao, C.; Xiang, X.; Zhang, X.; Wang, Z. Effects of brown rice on metabolomics related to glucose and lipid in normal rats. Wei Sheng Yan Jiu J. Hyg. Res. 2021, 50, 600–608. [Google Scholar]
  60. Knebel, B.; Strassburger, K.; Szendroedi, J.; Kotzka, J.; Scheer, M.; Nowotny, B.; Müssig, K.; Lehr, S.; Pacini, G.; Finner, H.; et al. Specific metabolic profiles and their relationship to insulin resistance in recent-onset type 1 and type 2 diabetes. J. Clin. Endocrinol. Metab. 2016, 101, 2130–2140. [Google Scholar]
  61. Blasko, I.; Defrancesco, M.; Oberacher, H.; Loacker, L.; Kemmler, G.; Marksteiner, J.; Humpel, C. Plasma phosphatidylcholines and vitamin B12/folate levels are possible prognostic biomarkers for progression of Alzheimer’s disease. Exp. Gerontol. 2021, 147, 111264. [Google Scholar]
  62. Sanyaolu, A.; Okorie, C.; Qi, X.; Locke, J.; Rehman, S. Childhood and adolescent obesity in the United States: A public health concern. Glob. Pediatr. Health 2019, 6, 2333794X19891305. [Google Scholar]
  63. Ahmad, Q.I.; Ahmad, C.B.; Ahmad, S.M. Childhood obesity. Indian J. Endocrinol. Metab. 2010, 14, 19. [Google Scholar]
  64. Dubey, P.; Reddy, S.Y.; Singh, V.; Shi, T.; Coltharp, M.; Clegg, D.; Dwivedi, A.K. Association of Exposure to Phthalate Metabolites with Sex Hormones, Obesity, and Metabolic Syndrome in US Women. JAMA Network Open 2022, 5, e2233088. [Google Scholar] [CrossRef]
  65. Chapinal, N.; Carson, M.; Duffield, T.; Capel, M.; Godden, S.; Overton, M.; Santos, J.; LeBlanc, S. The association of serum metabolites with clinical disease during the transition period. J. Dairy Sci. 2011, 94, 4897–4903. [Google Scholar] [CrossRef] [Green Version]
Figure 1. Correlation heatmap between metabolites associated with clinical parameters and IR assessment index in MHO and MUO. Correlation heatmap between 3 acylcarnitines (A) and 6 amino acids (B) associated with anthropometric parameters, and laboratory measurements in metabolically healthy obesity (MHO) and metabolically unhealthy obesity (MUO) groups. Partial correlation coefficient at the MHO and MUO. * p < 0.05, ** p < 0.01, and *** p < 0.001. Correlation heatmap between 3 biogenic amines (C) and 2 glycerophospholipids (D) associated with anthropometric parameters, and laboratory measurements in metabolically healthy obesity (MHO) and metabolically unhealthy obesity (MUO) groups. Partial correlation coefficient at the MHO and MUO. * p < 0.05, ** p < 0.01, and *** p < 0.001 PC, phosphatidylcholine; aa, diacyl.
Children 10 00322 g001aChildren 10 00322 g001b
Table 1. Anthropometric parameters, characteristics, laboratory measurements, IR assessment index, and plasma lipid profiles of MUO and MHO in adolescents.
Total Participants (n = 148)
MHO (n = 74)MUO (n = 74)p
Anthropometric and Characteristics
Male/Female n, (%)82 (55.41)/66 (44.59)
36 (48.65)/38 (51.35)46 (62.16)/28 (37.84)0.0982
Age 14.08±0.09713.93±0.0890.2625
Heightcm163.7±0.809166.9±0.9440.0148
Weightkg91.12±1.26795.19±1.8160.0983
Body Mass Indexkg/m233.92±0.32934.06±0.4530.9531
Waist Circumferencecm102.3±0.912104.6±1.1130.1402
Hip Circumferencecm112.6±0.616113.2±0.9250.6343
Systolic Blood PressuremmHg118.2±1.168133.7±1.453<0.0001
Diastolic Blood PressuremmHg75.34±0.77284.19±1.050<0.0001
Body fat%45.42±0.62644.22±0.7410.1739
Fat Masskg41.56±0.96642.43±1.2390.8330
Free Fat Masskg49.57±0.76052.76±1.0140.0169
BMI percentage%99.59±0.03999.23±0.1460.0164
Weight per age percentilenth99.97±0.00499.77±0.0730.0073
Basal Metabolic RateKcal1169.3±13.281214.8±18.520.0480
Laboratory measurements
Asparate aminotransferase IU/L27.68±2.08929.57±1.8660.4439
Alanine aminotransferase IU/L36.81±4.25743.28±4.3360.1794
White Blood Cell×103/mm37.013±0.2027.485±0.1640.0490
Red Blood Cell×103/mm34.949±0.0365.043±0.0340.1841
Hemoglobing/dL14.19±0.11514.38±0.1160.6055
Hematocritg/dL43.59±0.30944.20±0.3140.3160
Platele×103/mm3311.9±7.332326.6±5.7330.0714
Insulinng/mL27.06±2.69729.53±1.9440.2221
Glucosemg/dL92.50±0.74498.65±2.4390.0146
Insulin resistance (IR) assessment index
Homeostasis model assessment of insulin resistance (HOMA-IR)6.218±0.6307.389±0.6160.2705
Triglyceride-Glucose Index (TyG index)8.417±0.0528.792±0.059<0.0001
Plasma lipid profiles
Triglyceridesmg/dL107.1±5.358150.4±8.202<0.0001
Total cholesterolmg/dL173.5±3.119180.5±3.4160.0878
LDL-cholesterolmg/dL106.2±2.834105.9±3.0710.9564
HDL-cholesterolmg/dL45.84±0.65744.51±1.1670.1281
Mean ± SE. tested in the following logarithmic transformation, p-values were derived from a general linear model with a Bonferroni correction adjusting for age, sex and body mass index of the adolescents in the metabolically unhealthy obesity (MUO) group and of the adolescents in the metabolically healthy obesity (MHO) group.
Table 2. The metabolites of MUO and MHO in adolescents.
Total Participants (n = 148)
MHO (n = 74)MUO (n = 74)p
Acylcarnitines
AcetylcarnitineC28.486±0.3719.796±0.3620.0184
HydroxypropionylcarnitineC3-OH0.072±0.0040.077±0.003<0.0001
MethylglutarylcarnitineC5-M-DC0.033±0.0010.035±0.0010.0273
Amino Acids
Alanine 421.3±10.45462.3±80.650.0125
Glutamine 569.4±13.19545.1±13.380.0041
Glutamate 108.3±4.889120.0±4.8770.1244
Glutamine/Glutamate ratio 5.926±0.2525.098±0.2300.0179
Histidine 94.64±1.64592.43±1.5390.0322
Lysine 229.7±4.593218.9±4.4630.0371
Serine 134.6±2.921126.9±2.7140.0061
Biogenic Amines
Kynurenine 2.168±0.0732.612±0.0860.0003
Methionine-sulfoxide 0.657±0.0280.761±0.0260.0194
Spermidine 0.202±0.0150.236±0.0120.0346
Glycerophospholipids
PC aa C32:2 2.901±0.1093.180±0.1170.0397
PC aa C34:1 163.1±4.379179.3±4.7030.0402
Mean ± SE. tested in the following logarithmic transformation, p-values were derived from a general linear model with a Bonferroni correction adjusting for age, sex and body mass index (BMI) of the adolescents in the metabolically unhealthy obesity (MUO) group and of the adolescents in the metabolically healthy obesity (MHO) group. PC, phosphatidylcholine; aa, diacyl.
Table 3. Predictors of the MUO adolescents’ prevalence ORs on significantly different metabolites.
VariablesTotal Subjects (n = 148)p
ORs (95% CI)
For MUO Adolescents
Quartile of Acylcarnitines
AcetylcarnitineC21.606 (1.191–2.165)0.0014
HydroxypropionylcarnitineC3-OH1.114 (0.835–1.488)0.4620
MethylglutarylcarnitineC5-M-DC1.114 (0.835–1.488)0.4620
Quartile of amino acids
Alanine1.621 (1.194–2.200)0.0014
Glutamine0.833 (0.624–1.112)0.2131
Glutamate1.364 (1.024–1.818)0.0316
Glutamine/Glutamate ratio0.735 (0.547–0.988)0.0388
Histidine0.948 (0.712–1.263)0.7146
Lysine0.839 (0.626–1.123)0.2363
Serine0.796 (0.599–1.058)0.1142
Quartile of biogenic amines
Kynurenine1.661 (1.222–2.259)0.0008
Methionine-sulfoxide1.983 (1.371–2.867)0.0001
Spermidine1.304 (0.971–1.751)0.0752
Quartile of glycerophospholipids
PC aa C32:21.258 (0.939–1.685)0.1214
PC aa C34:11.424 (1.057–1.917)0.0180
Quartile of insulin resistance assessment index
Homeostasis model assessment of insulin resistance (HOMA-IR)1.360 (1.012–1.827)0.0388
TyG index2.046 (1.476–2.835)<0.0001
p-values derived from a logistic regression analysis on the metabolically unhealthy obesity (MUO).
Table 4. The nutrition intakes of adolescents in MUO and MHO groups.
Total Participants (n = 148)
MHO (n = 74)MUO (n = 74)p
Nutrition Intakes
EnergyKcal1424.7±45.721523.0±40.640.0600
Carbohydrateg211.3±6.588229.1±6.6500.0827
Proteing56.44±2.11760.16±1.7510.0698
Fatg36.93±1.80138.24±1.3090.2151
Total fiberg9.163±0.4599.922±0.4590.2348
Soluble fiberg1.798±0.1292.020±0.1190.1700
Non-soluble fiberg6.703±0.3527.406±0.3530.1336
Cholesterolmg174.5±10.41186.0±11.750.3985
Calciummg366.7±19.89404.1±17.100.0677
Potassiummg1615.1±57.481776.7±61.320.0579
Sodiummg2529.6±100.32692.9±111.40.3018
Total amino acidsmg31,383.4±1340.832,567.8±1561.10.5081
Essencial amino acidsmg14,294.0±627.414,950.5±744.50.4711
Non-essencial amino acidsmg17,089.4±823.517,617.3±822.10.5450
Isoleucinemg1333.5±59.161378.2±67.690.4235
Leucinemg2533.9±110.72661.2±133.30.5552
Valinemg1554.5±71.391621.5±77.190.4277
Glutamic acidmg6212.1±279.16319.9±289.80.5778
Total fatty acidsg28.75±1.50428.75±1.2270.6784
Total trans-fatty acidsg0.368±0.0260.360±0.0180.4523
Total essential fatty acidsg7.836±0.3508.425±0.4360.4208
Total saturated fatty acidsg9.922±0.6699.702±0.4380.5272
Total mono-unsaturated fatty aicdsg10.201±0.6289.902±0.4550.8554
Total poly-unsaturated fatty acidsg8.260±0.3638.788±0.4510.5087
n-3 fatty acidsg0.861±0.0440.952±0.0570.2989
n-6 fatty acidsg7.161±0.3147.666±0.3880.4401
Mean ± SE. tested in the following logarithmic transformation, p-values were derived from a general linear model with a Bonferroni correction adjusting for age, sex and body mass index of the adolescents in the metabolically unhealthy obesity (MUO) group and of the adolescents in the metabolically healthy obesity (MHO) group.
Disclaimer/Publisher’s Note: The statements, opinions and data contained in all publications are solely those of the individual author(s) and contributor(s) and not of MDPI and/or the editor(s). MDPI and/or the editor(s) disclaim responsibility for any injury to people or property resulting from any ideas, methods, instructions or products referred to in the content.

