Correction: Okui, T. Analysis of an Association between Preterm Birth and Parental Educational Level in Japan Using National Data. Children 2023, 10, 342


Error in Figure/Table
Text Correction
| Page | Original | Corrected |
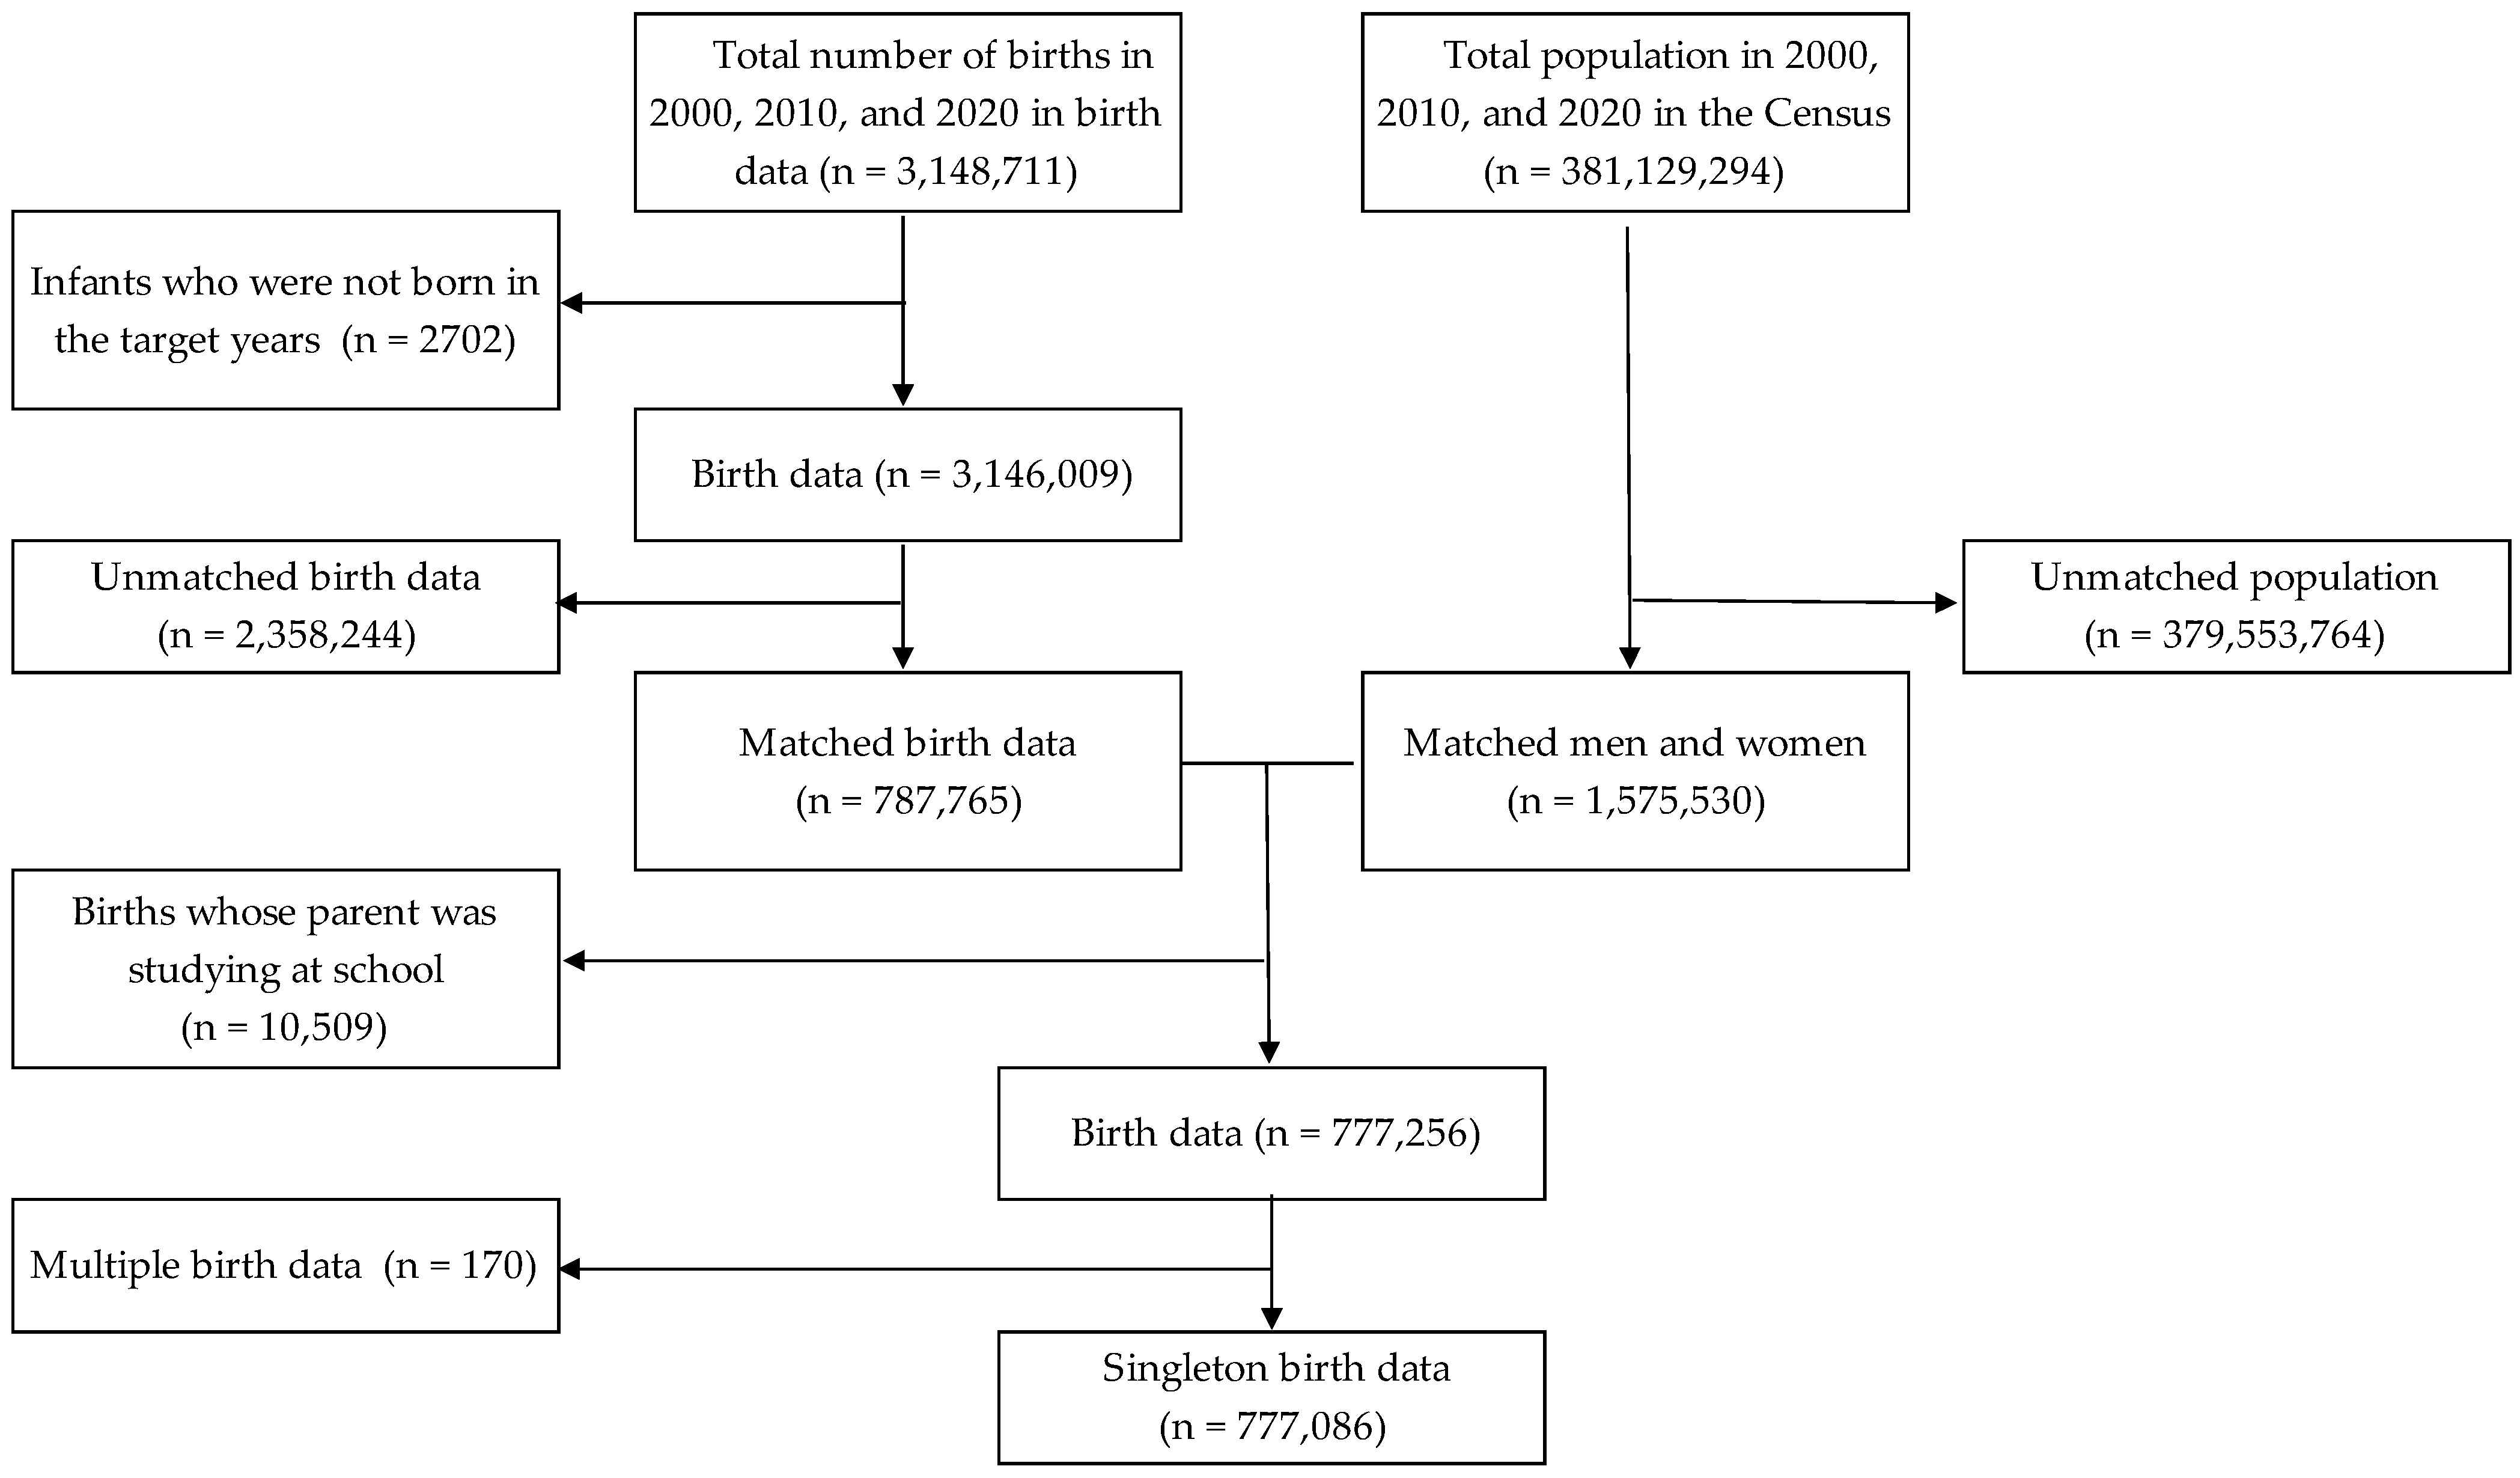
| Page 1, Abstract, line 8 | 782,536 | 777,086 |
| Page 1, Abstract, line 9 | 5.09 and 5.20 | 5.07 and 5.21 |
| Page 2, Data Linkage, line 15 | 782,536 | 777,086 |
| Page 4, Results, lines 2–3 | 311,050 in 2000 to 217,968 in 2020 | 308,994 in 2000 to 216,637 in 2020 |
| Page 4, Results, line 11 | 5.09 and 5.20 | 5.07 and 5.21 |
| Page 4, Results, line 24 | −0.618 | −0.609 |
| Page 4, Results, line 28 | 0.853 | 0.854 |

| Year | |||
|---|---|---|---|
| 2000 | 2010 | 2020 | |
| Total | 308,994 (100.0) | 251,455 (100.0) | 216,637 (100.0) |
| Maternal age group | |||
| 19 years or less | 9607 (3.1) | 5076 (2.0) | 2013 (0.9) |
| 20–24 years | 72,551 (23.5) | 50,407 (20.0) | 31,218 (14.4) |
| 25–29 years | 112,295 (36.3) | 82,313 (32.7) | 65,429 (30.2) |
| 30–34 years | 81,107 (26.2) | 69,971 (27.8) | 66,501 (30.7) |
| 35–39 years | 29,172 (9.4) | 36,087 (14.4) | 40,761 (18.8) |
| 40 years or more | 4262 (1.4) | 7601 (3.0) | 10,715 (4.9) |
| Gender | |||
| Female | 149,954 (48.5) | 122,360 (48.7) | 105,734 (48.8) |
| Male | 159,040 (51.5) | 129,095 (51.3) | 110,903 (51.2) |
| Parity | |||
| Primiparous | 156,453 (50.6) | 125,412 (49.9) | 104,657 (48.3) |
| Multiparous | 152,541 (49.4) | 126,043 (50.1) | 111,980 (51.7) |
| Household occupation | |||
| Farmer | 20,371 (6.6) | 8193 (3.3) | 4175 (1.9) |
| Self-employed | 30,261 (9.8) | 21,016 (8.4) | 17,089 (7.9) |
| Full-time worker 1 | 116,984 (37.9) | 96,872 (38.5) | 75,969 (35.1) |
| Full-time worker 2 | 100,111 (32.4) | 89,426 (35.6) | 92,264 (42.6) |
| Other occupations | 34,218 (11.1) | 25,703 (10.2) | 21,046 (9.7) |
| Unemployed | 3624 (1.2) | 3910 (1.6) | 1721 (0.8) |
| Missing | 3425 (1.1) | 6335 (2.5) | 4373 (2.0) |
| Paternal educational level | |||
| Junior high school | 36,536 (11.8) | 21,616 (8.6) | 13,555 (6.3) |
| High school | 167,938 (54.3) | 109,471 (43.5) | 75,470 (34.8) |
| Technical school or junior college | 34,399 (11.1) | 34,600 (13.8) | 27,607 (12.7) |
| University or graduate school | 66,594 (21.6) | 66,058 (26.3) | 72,419 (33.4) |
| Missing | 3527 (1.1) | 19,710 (7.8) | 27,586 (12.7) |
| Maternal educational level | |||
| Junior high school | 25,841 (8.4) | 16,964 (6.7) | 9896 (4.6) |
| High school | 173,690 (56.2) | 106,675 (42.4) | 71,571 (33.0) |
| Technical school or junior college | 83,233 (26.9) | 72,275 (28.7) | 54,595 (25.2) |
| University or graduate school | 22,671 (7.3) | 36,647 (14.6) | 53,626 (24.8) |
| Missing | 3559 (1.2) | 18,894 (7.5) | 26,949 (12.4) |
| Gestational age | |||
| Term birth | 294,936 (95.5) | 239,867 (95.4) | 206,784 (95.5) |
| Preterm birth | 13,969 (4.5) | 11,548 (4.6) | 9821 (4.5) |
| Missing | 89 (0.0) | 40 (0.0) | 32 (0.0) |
| Birthweight | |||
| >= 2, 500 g | 285,929 (92.5) | 230,548 (91.7) | 199,587 (92.1) |
| < 2500 g | 23,042 (7.5) | 20,876 (8.3) | 17,023 (7.9) |
| Missing | 23 (0.0) | 31 (0.0) | 27 (0.0) |
| Year | |||
|---|---|---|---|
| 2000 | 2010 | 2020 | |
| Total | 13,597 (4.51) | 10,246 (4.56) | 8357 (4.52) |
| Paternal educational level | |||
| Junior high school | 1892 (5.27) | 1045 (5.04) | 686 (5.21) |
| High school | 7446 (4.50) | 4959 (4.68) | 3366 (4.57) |
| Technical school or junior college | 1439 (4.24) | 1456 (4.33) | 1187 (4.39) |
| University or graduate school | 2820 (4.28) | 2786 (4.32) | 3118 (4.39) |
| Maternal educational level | |||
| Junior high school | 1397 (5.52) | 854 (5.28) | 488 (5.07) |
| High school | 7834 (4.58) | 4845 (4.72) | 3248 (4.70) |
| Technical school or junior college | 3438 (4.18) | 3055 (4.35) | 2388 (4.45) |
| University or graduate school | 928 (4.13) | 1492 (4.16) | 2233 (4.24) |
| 2000 | 2010 | 2020 | |
|---|---|---|---|
| Estimates (95%CI) | Estimates (95%CI) | Estimates (95%CI) | |
| Slope index of inequality | |||
| Paternal educational level | −0.609 (−0.924, −0.293) | −0.620 (−0.976, −0.264) | −0.489 (−0.876, −0.103) |
| Maternal educational level | −1.024 (−1.344, −0.705) | −1.061 (−1.422, −0.700) | −0.967 (−1.353, −0.580) |
| Relative index of inequality | |||
| Paternal educational level | 0.854 (0.795, 0.918) | 0.867 (0.800, 0.939) | 0.886 (0.812, 0.967) |
| Maternal educational level | 0.779 (0.723, 0.838) | 0.773 (0.713, 0.839) | 0.784 (0.719, 0.856) |
| CI, confidence intervals | |||
| 1. Gender, parity, household occupation, and maternal age group were adjusted in the analysis. | |||
| 2. Estimates for the slope index of inequality, which was calculated using a binomial model with an identity link function, can be interpreted as the absolute risk difference between the highest and lowest educational levels. | |||
| 3. Estimates for the relative index of inequality, which was calculated using a log-binomial model, can be interpreted as the risk ratio between the highest and lowest educational levels. | |||
| 2000 | 2010 | 2020 | |
|---|---|---|---|
| Estimates (95%CI) | Estimates (95%CI) | Estimates (95%CI) | |
| Slope index of inequality | |||
| Paternal educational level | −0.602 (−0.913, −0.290) | −0.542 (−0.879, −0.206) | −0.496 (−0.851, −0.141) |
| Maternal educational level | −0.975 (−1.291, −0.660) | −0.986 (−1.329, −0.644) | −0.734 (−1.092, −0.377) |
| Relative index of inequality | |||
| Paternal educational level | 0.855 (0.796, 0.918) | 0.882 (0.818, 0.950) | 0.885 (0.817, 0.959) |
| Maternal educational level | 0.788 (0.733, 0.847) | 0.789 (0.731, 0.852) | 0.832 (0.767, 0.901) |
| CI, confidence intervals | |||
| 1. Gender, parity, household occupation, and maternal age group were adjusted in the analysis. | |||
| 2. Estimates for the slope index of inequality, which was calculated using a binomial model with an identity link function, can be interpreted as the absolute risk difference between the highest and lowest educational levels. | |||
| 3. Estimates for the relative index of inequality, which was calculated using a log-binomial model, can be interpreted as the risk ratio between the highest and lowest educational levels. | |||
Reference
- Okui, T. Analysis of an Association between Preterm Birth and Parental Educational Level in Japan Using National Data. Children 2023, 10, 342. [Google Scholar]
Disclaimer/Publisher’s Note: The statements, opinions and data contained in all publications are solely those of the individual author(s) and contributor(s) and not of MDPI and/or the editor(s). MDPI and/or the editor(s) disclaim responsibility for any injury to people or property resulting from any ideas, methods, instructions or products referred to in the content. |
© 2023 by the author. Licensee MDPI, Basel, Switzerland. This article is an open access article distributed under the terms and conditions of the Creative Commons Attribution (CC BY) license (https://creativecommons.org/licenses/by/4.0/).
Share and Cite
Okui, T. Correction: Okui, T. Analysis of an Association between Preterm Birth and Parental Educational Level in Japan Using National Data. Children 2023, 10, 342. Children 2023, 10, 1034. https://doi.org/10.3390/children10061034
Okui T. Correction: Okui, T. Analysis of an Association between Preterm Birth and Parental Educational Level in Japan Using National Data. Children 2023, 10, 342. Children. 2023; 10(6):1034. https://doi.org/10.3390/children10061034
Chicago/Turabian StyleOkui, Tasuku. 2023. "Correction: Okui, T. Analysis of an Association between Preterm Birth and Parental Educational Level in Japan Using National Data. Children 2023, 10, 342" Children 10, no. 6: 1034. https://doi.org/10.3390/children10061034
APA StyleOkui, T. (2023). Correction: Okui, T. Analysis of an Association between Preterm Birth and Parental Educational Level in Japan Using National Data. Children 2023, 10, 342. Children, 10(6), 1034. https://doi.org/10.3390/children10061034