
Childhood Obesity Trends among 8–11-Year-Olds: Insights from a School Sample in Vienna, Austria (2017–2023)

Abstract
:
1. Introduction
2. Materials and Methods
2.1. Sample
2.2. Anthropometric Measurements
2.3. Statistical Analysis
3. Results
4. Discussion
5. Conclusions
Supplementary Materials
Author Contributions
Funding
Institutional Review Board Statement
Informed Consent Statement
Data Availability Statement
Acknowledgments
Conflicts of Interest
References
- World Obesity Federation. Homepage|World Obesity Day. 2024. Available online: https://www.worldobesityday.org/ (accessed on 28 February 2024).
- Lobstein, T.; Brinsden, H. Atlas of Childhood Obesity. London. 2019. Available online: www.worldobesity.org (accessed on 2 December 2023).
- WHO Regional Office for Europe. European Childhood Obesity Surveillance Initiative (COSI) Report on the Fourth Round of Data Collection, 2015–2017; WHO: Geneva, Switzerland, 2021.
- WHO Regional Office for Europe. Childhood Obesity Surveillance Initiative (COSI)—Bericht Österreich 2020; Bundesministerium für Soziales, Gesundheit, Pflege und Konsumentenschutz Österreich: Vienna, Austria, 2023. [Google Scholar]
- Rundle, A.G.; Factor-Litvak, P.; Suglia, S.F.; Susser, E.S.; Kezios, K.L.; Lovasi, G.S.; Cirillo, P.M.; Cohn, B.A.; Link, B.G. Tracking of Obesity in Childhood into Adulthood: Effects on Body Mass Index and Fat Mass Index at Age 50. Child. Obes. 2020, 16, 226–233. [Google Scholar] [CrossRef]
- Lister, N.B.; Baur, L.A.; Felix, J.F.; Hill, A.J.; Marcus, C.; Reinehr, T.; Summerbell, C.; Wabitsch, M. Child and Adolescent Obesity. Nat. Rev. Dis. Primers 2023, 9, 24. [Google Scholar] [CrossRef]
- Kirchengast, S.; Schober, E. Obesity Among Male Adolescent Migrants in Vienna, Austria. Econ. Hum. Biol. 2008, 6, 204–211. [Google Scholar] [CrossRef] [PubMed]
- I’allemand, D.; Wiegand, S.; Reinehr, T.; Müller, J.; Wabitsch, M.; Widhalm, K.; Holl, R.; APV-Study Group. Cardiovascular Risk in 26,008 European Overweight Children as Established by a Multicenter Database. Obesity 2008, 16, 1672–1679. [Google Scholar] [CrossRef] [PubMed]
- Bentham, J.; Di Cesare, M.; Bilano, V.; Bixby, H.; Zhou, B.; Stevens, G.A.; Riley, L.M.; Taddei, C.; Hajifathalian, K.; Lu, Y.; et al. Worldwide Trends in Body-Mass Index, Underweight, Overweight, and Obesity from 1975 to 2016: A Pooled Analysis of 2416 Population-Based Measurement Studies in 128·9 Million Children, Adolescents, and Adults. Lancet 2017, 390, 2627–2642. [Google Scholar]
- Wabitsch, M.; Moss, A.; Kromeyer-Hauschild, K. Unexpected Plateauing of Childhood Obesity Rates in Developed Countries. BMC Med. 2014, 12, 17. [Google Scholar] [CrossRef]
- Olds, T.I.; Maher, C.; Zumin, S.H.; Péneau, S.; Lioret, S.; Castetbon, K.; Bellisle de Wilde, J.; Hohepa, M.; Maddison, R.; Lissner, L. Evidence that the Prevalence of Childhood Overweight is Plateauing: Data From Nine Countries. Int. J. Pediatr. Obes. 2011, 6, 342–360. [Google Scholar] [CrossRef]
- de Bont, J.; Díaz, Y.; Casas, M.; García-Gil, M.; Vrijheid, M.; Duarte-Salles, T. Time Trends and Sociodemographic Factors Associated with Overweight and Obesity in Children and Adolescents in Spain. JAMA Netw. Open 2020, 3, e201171. [Google Scholar] [CrossRef]
- Chang, T.H.; Chen, Y.C.; Chen, W.Y.; Chen, C.Y.; Hsu, W.Y.; Chou, Y.; Chang, Y.H. Weight Gain Associated with COVID-19 Lockdown in Children and Adolescents: A Systematic Review and Meta-Analysis. Nutrients 2021, 13, 3668. [Google Scholar] [CrossRef]
- Weaver, R.G.; Hunt, E.T.; Armstrong, B.; Beets, M.W.; Brazendale, K.; Turner-McGrievy, G.; Pate, R.R.; Youngstedt, S.D.; Dugger, R.; Parker, H.; et al. COVID-19 Leads to Accelerated Increases in Children’s BMI z-Score Gain: An Interrupted Time-Series Study. Am. J. Prev. Med. 2021, 61, e161–e169. [Google Scholar] [CrossRef]
- Widhalm, K.; Rosenauer, H.; Gansterer, A.; Matjazic, J. Dramatic Increase of Body Weight during Covid-19 Breakdown: Data from the Austrian Prevention Project Eddy Kids 2018/19 and Eddy Kids 2019/20. Austin J. Nutr. Food Sci. 2021, 9, 2018–2019. [Google Scholar] [CrossRef]
- Shah, B.; Tombeau Cost, K.; Fuller, A.; Birken, C.S.; Anderson, L.N. Sex and Gender Differences in Childhood Obesity: Contributing to the Research Agenda. BMJ Nutr. Prev. Health 2020, 3, 387–390. [Google Scholar] [CrossRef] [PubMed]
- Stadt Wien|Wirtschaft A und S. Meidling in Zahlen—Statistiken zum 12. Bezirk. statistik.wien.gv.at. Wien. 2022. Available online: https://www.wien.gv.at/statistik/bezirke/meidling.html (accessed on 25 March 2024).
- Kromeyer-Hauschild, K.; Wabitsch, M.; Kunze, D.; Geller, F.; Geiß, H.C.; Hesse, V.; von Hippel, A.; Jaeger, U.; Johnsen, D.; Korte, W.; et al. Perzentile Fur den Body-Mass-Index Fur das Kindes-Und Jugendalter Unter Heranziehung Verschiedener Deutscher Stichproben. Monatsschr Kinderheilkd 2001, 149, 807–818. [Google Scholar] [CrossRef]
- Bundesministerium Soziales Gesundheit Pflege und Konsumentenschutz Österreich. Nationaler Aktionsplan Ernährung (NAP.e). 2020. Available online: https://www.sozialministerium.at/Themen/Gesundheit/Lebensmittel-Ernaehrung/Ernaehrungsstrategien-und-Gremien/Nationaler-Aktionsplan-Ernaehrung-(NAP.e).html (accessed on 23 November 2023).
- Bundesministerium Kunst Kultur Öffentlicher Dienst und Sport. Kinder Gesund bewegen 2.0. 2019. Available online: https://www.bmkoes.gv.at/sport/breitensport/sport-und-schule/kinder-gesund-bewegen.html (accessed on 19 March 2024).
- Bundesministerium Soziales Gesundheit Pflege und Konsumentenschutz Österreich. Healthy Eating for 4 to 10 Year Old. Richtig Essen von Anfang an. 2024. Available online: https://www.richtigessenvonanfangan.at/en/children-4-10-years (accessed on 25 February 2024).
- Fonds Gesundes Österreich. Abgeschlossene Projekte Pilotphase 2020–2023|Initiative Kinder Essen Gesund. 2024. Available online: https://kinderessengesund.at/projekte (accessed on 29 February 2024).
- WiG Wiener Gesundheitsförderung. Wiener Schulfruchtprogramm|WiG Wiener Gesundheitsförderung. 2024. Available online: https://www.wig.or.at/programme/gesunde-kinder/wiener-schulfruchtprogramm (accessed on 29 February 2024).
- Global Nutrition Report. Country Nutrition Profiles Austria. 2023. Available online: https://globalnutritionreport.org/resources/nutrition-profiles/europe/western-europe/austria/ (accessed on 14 November 2023).
- Haeusler, G.; Wrba, T.; Riedl, S.; Karall, D. Körpermessdaten bei Kindern. Pädiatrie Pädologie 2022, 57, 66–72. [Google Scholar] [CrossRef]
- Mayer, M.; Gleiss, A.; Häusler, G.; Borkenstein, M.; Kapelari, K.; Köstl, G.; Lassi, M.; Schemper, M.; Schmitt, K.; Blümel, P. Weight and Body Mass Index (BMI): Current Data for Austrian Boys and Girls Aged 4 to under 19 Years. Ann. Hum. Biol. 2015, 42, 45–55. [Google Scholar] [CrossRef] [PubMed]
- Tabacchi, G.; Giammanco, S.; La Guardia, M.; Giammanco, M. A Review of the Literature and a new Classification of the Early Determinants of Childhood Obesity: From Pregnancy to the First Years of Life. Nutr. Res. 2007, 27, 587–604. [Google Scholar] [CrossRef]
- Poskitt, E.M.E. Obesity: Childhood Obesity. In Encyclopedia of Human Nutrition, 3rd ed.; Caballero, B., Ed.; Elsevier: Amsterdam, The Netherlands, 2013; pp. 336–342. [Google Scholar]
- Bondyra-Wiśniewska, B.; Myszkowska-Ryciak, J.; Harton, A. Impact of Lifestyle Intervention Programs for Children and Adolescents with Overweight or Obesity on Body Weight and Selected Cardiometabolic Factors—A Systematic Review. Int. J. Environ. Res. Public Health 2021, 18, 2061. [Google Scholar] [CrossRef]
- Kubik, M.Y.; Fulkerson, J.A.; Sirard, J.R.; Garwick, A.; Temple, J.; Gurvich, O.; Lee, J.; Dudovitz, B. School-Based Secondary Prevention of Overweight and Obesity among 8- to 12-Year Old Children: Design And Sample Characteristics of The SNAPSHOT Trial. Contemp. Clin. Trials 2018, 75, 9–18. [Google Scholar] [CrossRef] [PubMed]
- Stadt Wien—Integration und Diversität. Integrations & Diversitäts monitor. Wien 2023. Wien; 2023. Available online: https://www.wien.gv.at/menschen/integration/daten-fakten/monitoring.html (accessed on 4 December 2023).
- Segna, D.; Widhalm, H.; Pandey, M.P.; Zehetmayer, S.; Dietrich, S.; Widhalm, K. Impact of Mother Tongue and Gender on Overweight, Obesity and Extreme Obesity in 24,989 Viennese Children/Adolescents (2–16 Years). Wien. Klin. Wochenschrift. 2012, 124, 782–788. [Google Scholar] [CrossRef]
- Statistks Austria. More than a Quarter of the Total Austrian Population Has a Migration Background. Statistical Yearbook Migration & Integration 2022. 2022; Volume 3. Available online: www.statistik.at (accessed on 21 November 2023).
- Jarnig, G.; Jaunig, J.; Kerbl, R.; Strenger, V.; Haeusler, G.; van Poppel, M.N.M. Acceleration in BMI Gain Following COVID-19 Restrictions. A Longitudinal Study with 7- to 10-Year-Old Primary School Children. Pediatr. Obes. 2022, 17, e12890. [Google Scholar] [CrossRef]
- Moliterno, P.; Gansterer, A.; Czernin, S.; Schönthaler, K.; Matjazic, J.; Neidenbach, R. 14-Months Follow-Up in 8- to 11-year-old Primary School Children from Vienna: Effects of the COVID-19 Pandemic on Weight and Body Mass Index. Ann. Pediatr. Res. 2021, 5, 1060. [Google Scholar]
- Jarnig, G.; Jaunig, J.; van Poppel, M.N.M. Association of COVID-19 Mitigation Measures with Changes in Cardiorespiratory Fitness and Body Mass Index Among Children Aged 7 to 10 Years in Austria. JAMA Netw. Open 2021, 4, e2121675. [Google Scholar] [CrossRef] [PubMed]
- Jarnig, G.; Kerbl, R.; van Poppel, M.N.M. Change in BMI and Fitness among Primary School Children in Austria: A 24-Month Follow-Up Study of 303 Children Measured before and during the Ongoing COVID-19 Pandemic. Sports 2022, 10, 78. [Google Scholar] [CrossRef] [PubMed]

| Investigation Year | N (%) | Sex (N, %) | Age | BMI (Median, 95% CI) | ||
|---|---|---|---|---|---|---|
| Female | Male | Median (95% CI) | Female | Male | ||
| 2017 | 98 | 44 (44.9) | 54 (55.1) | 9.1 (8.3–10.5) | 18.8 (14.6–25.9) | 20.6 (14.7–28.6) |
| 2018 | 64 | 26 (40.6) | 38 (59.4) | 9.0 (8.4–9.9) | 18.4 (14.3–24.6) | 18.1 (13.9–27.4) |
| 2020 | 46 | 20 (43.5) | 26 (56.5) | 9.6 (8.8–10.5) | 19.6 (16.3–28.6) | 21.2 (15.1–28.2) |
| 2021 | 30 | 17 (56.7) | 13 (43.3) | 9.3 (8.5–10.5) | 16.5 (13.6–27.3) | 19.4 (14.3–27.9) |
| 2022 | 44 | 17 (38.6) | 27 (61.4) | 9.6 (8.8–10.5) | 18.1 (14.3–24.2) | 19.2 (14.3–29.1) |
| 2023 | 44 | 21 (47.7) | 23 (52.3) | 8.9 (8.1–10.5) | 18.3 (14.7–25.1) | 17.2 (14.3–27.0) |
| Total | 326 | 145 (44.5) | 181 (55.5) | 9.3 (8.3–10.5) | 18.5 (14.6–25.9) | 19.2 (14.3–28.1) |
| p-value * | 0.70 | <0.00010 | 0.11 | 0.23 | ||
| Percentage (%) | ||||
|---|---|---|---|---|
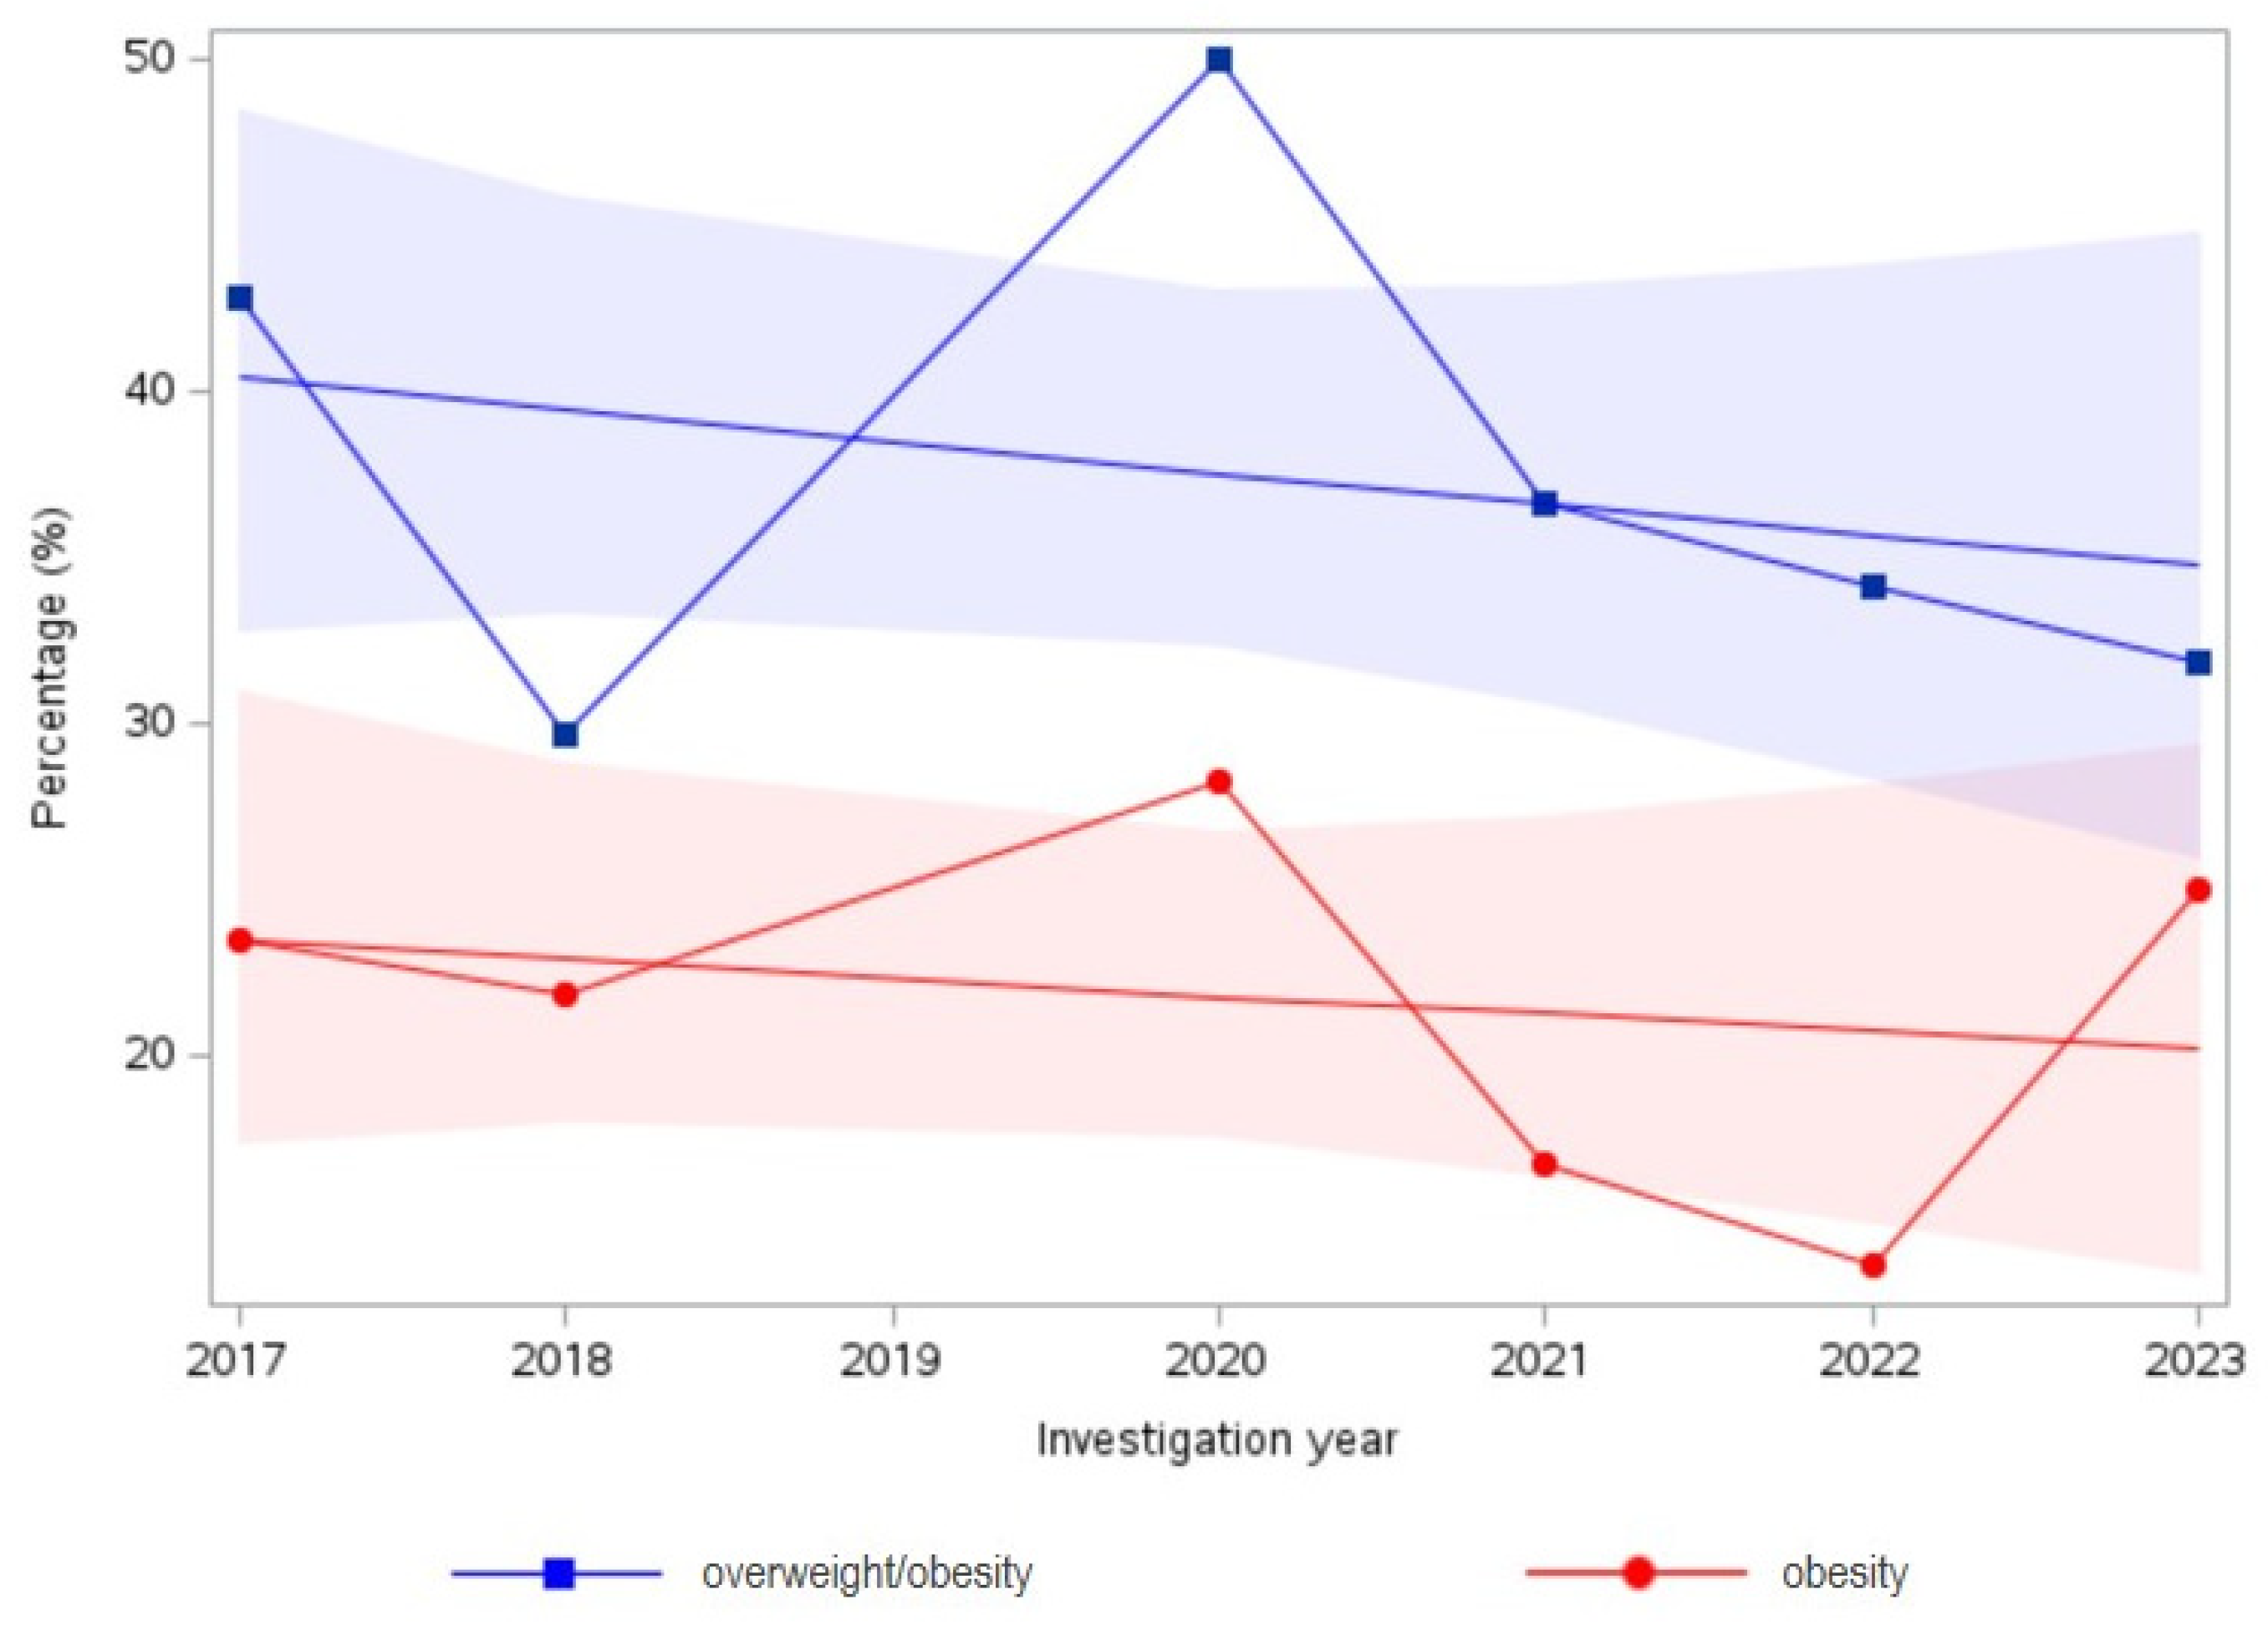
| Investigation Year | N | Overweight/Obesity (95% CI) | N | Obesity (95% CI) |
| 2017 | 42 | 42.9 (33.1–52.7) | 23 | 23.5 (15.1–31.9) |
| 2018 | 19 | 29.7 (18.5–40.9) | 14 | 21.9 (11.8–32.0) |
| 2020 | 23 | 50.0 (35.6–64.4) | 13 | 28.3 (15.3–41.3) |
| 2021 | 11 | 36.7 (19.5–53.9) | 5 | 16.7 (3.4–30.0) |
| 2022 | 15 | 34.1 (20.1–48.1) | 6 | 13.6 (3.5–23.7) |
| 2023 | 14 | 31.8 (18.0–45.6) | 11 | 25.0 (12.2–37.8) |
| p-value for trend * | 0.38 | 0.61 | ||
| Overweight/Obesity | Obesity | Overweight/Obesity | Obesity | |
|---|---|---|---|---|
| Change from 2017–2023 1 (95% CI) | Change from 2017–2023 1 (95% CI) | Change from 2018–2020 2 (95% CI) | Change from 2018–2020 2 (95% CI) | |
| All | −25.9% (−59.5–15.6) | 6.4% (−51.2–94.9) | 68.4% (5.6–187.9) | 29.2% (−37.3–166.8) |
| Female | 22.0% (−56.3–173.9) | 265.9% (16.7 ± ∞) * | 108% (−20.6 ± ∞) * | 30.4% (−∞ ± ∞) * |
| Male | −45.3% (−79.6–−4.9) | −50.6% (−94.7–7.7) | 57.0% (−7.7–188.0) | 32.8% (−39.0–193.2) |
Disclaimer/Publisher’s Note: The statements, opinions and data contained in all publications are solely those of the individual author(s) and contributor(s) and not of MDPI and/or the editor(s). MDPI and/or the editor(s) disclaim responsibility for any injury to people or property resulting from any ideas, methods, instructions or products referred to in the content. |
© 2024 by the authors. Licensee MDPI, Basel, Switzerland. This article is an open access article distributed under the terms and conditions of the Creative Commons Attribution (CC BY) license (https://creativecommons.org/licenses/by/4.0/).
Share and Cite
Moliterno, P.; Donhauser, V.; Widhalm, K. Childhood Obesity Trends among 8–11-Year-Olds: Insights from a School Sample in Vienna, Austria (2017–2023). Children 2024, 11, 431. https://doi.org/10.3390/children11040431
Moliterno P, Donhauser V, Widhalm K. Childhood Obesity Trends among 8–11-Year-Olds: Insights from a School Sample in Vienna, Austria (2017–2023). Children. 2024; 11(4):431. https://doi.org/10.3390/children11040431
Chicago/Turabian StyleMoliterno, Paula, Victoria Donhauser, and Kurt Widhalm. 2024. "Childhood Obesity Trends among 8–11-Year-Olds: Insights from a School Sample in Vienna, Austria (2017–2023)" Children 11, no. 4: 431. https://doi.org/10.3390/children11040431