
Association among Household Wealth, Maternal Employment, and Undernutrition in Children under Three Years of Age in Pakistan

 , , , ,
  and
and
Abstract
:1. Introduction
2. Materials and Methods
2.1. Theoretical Framework
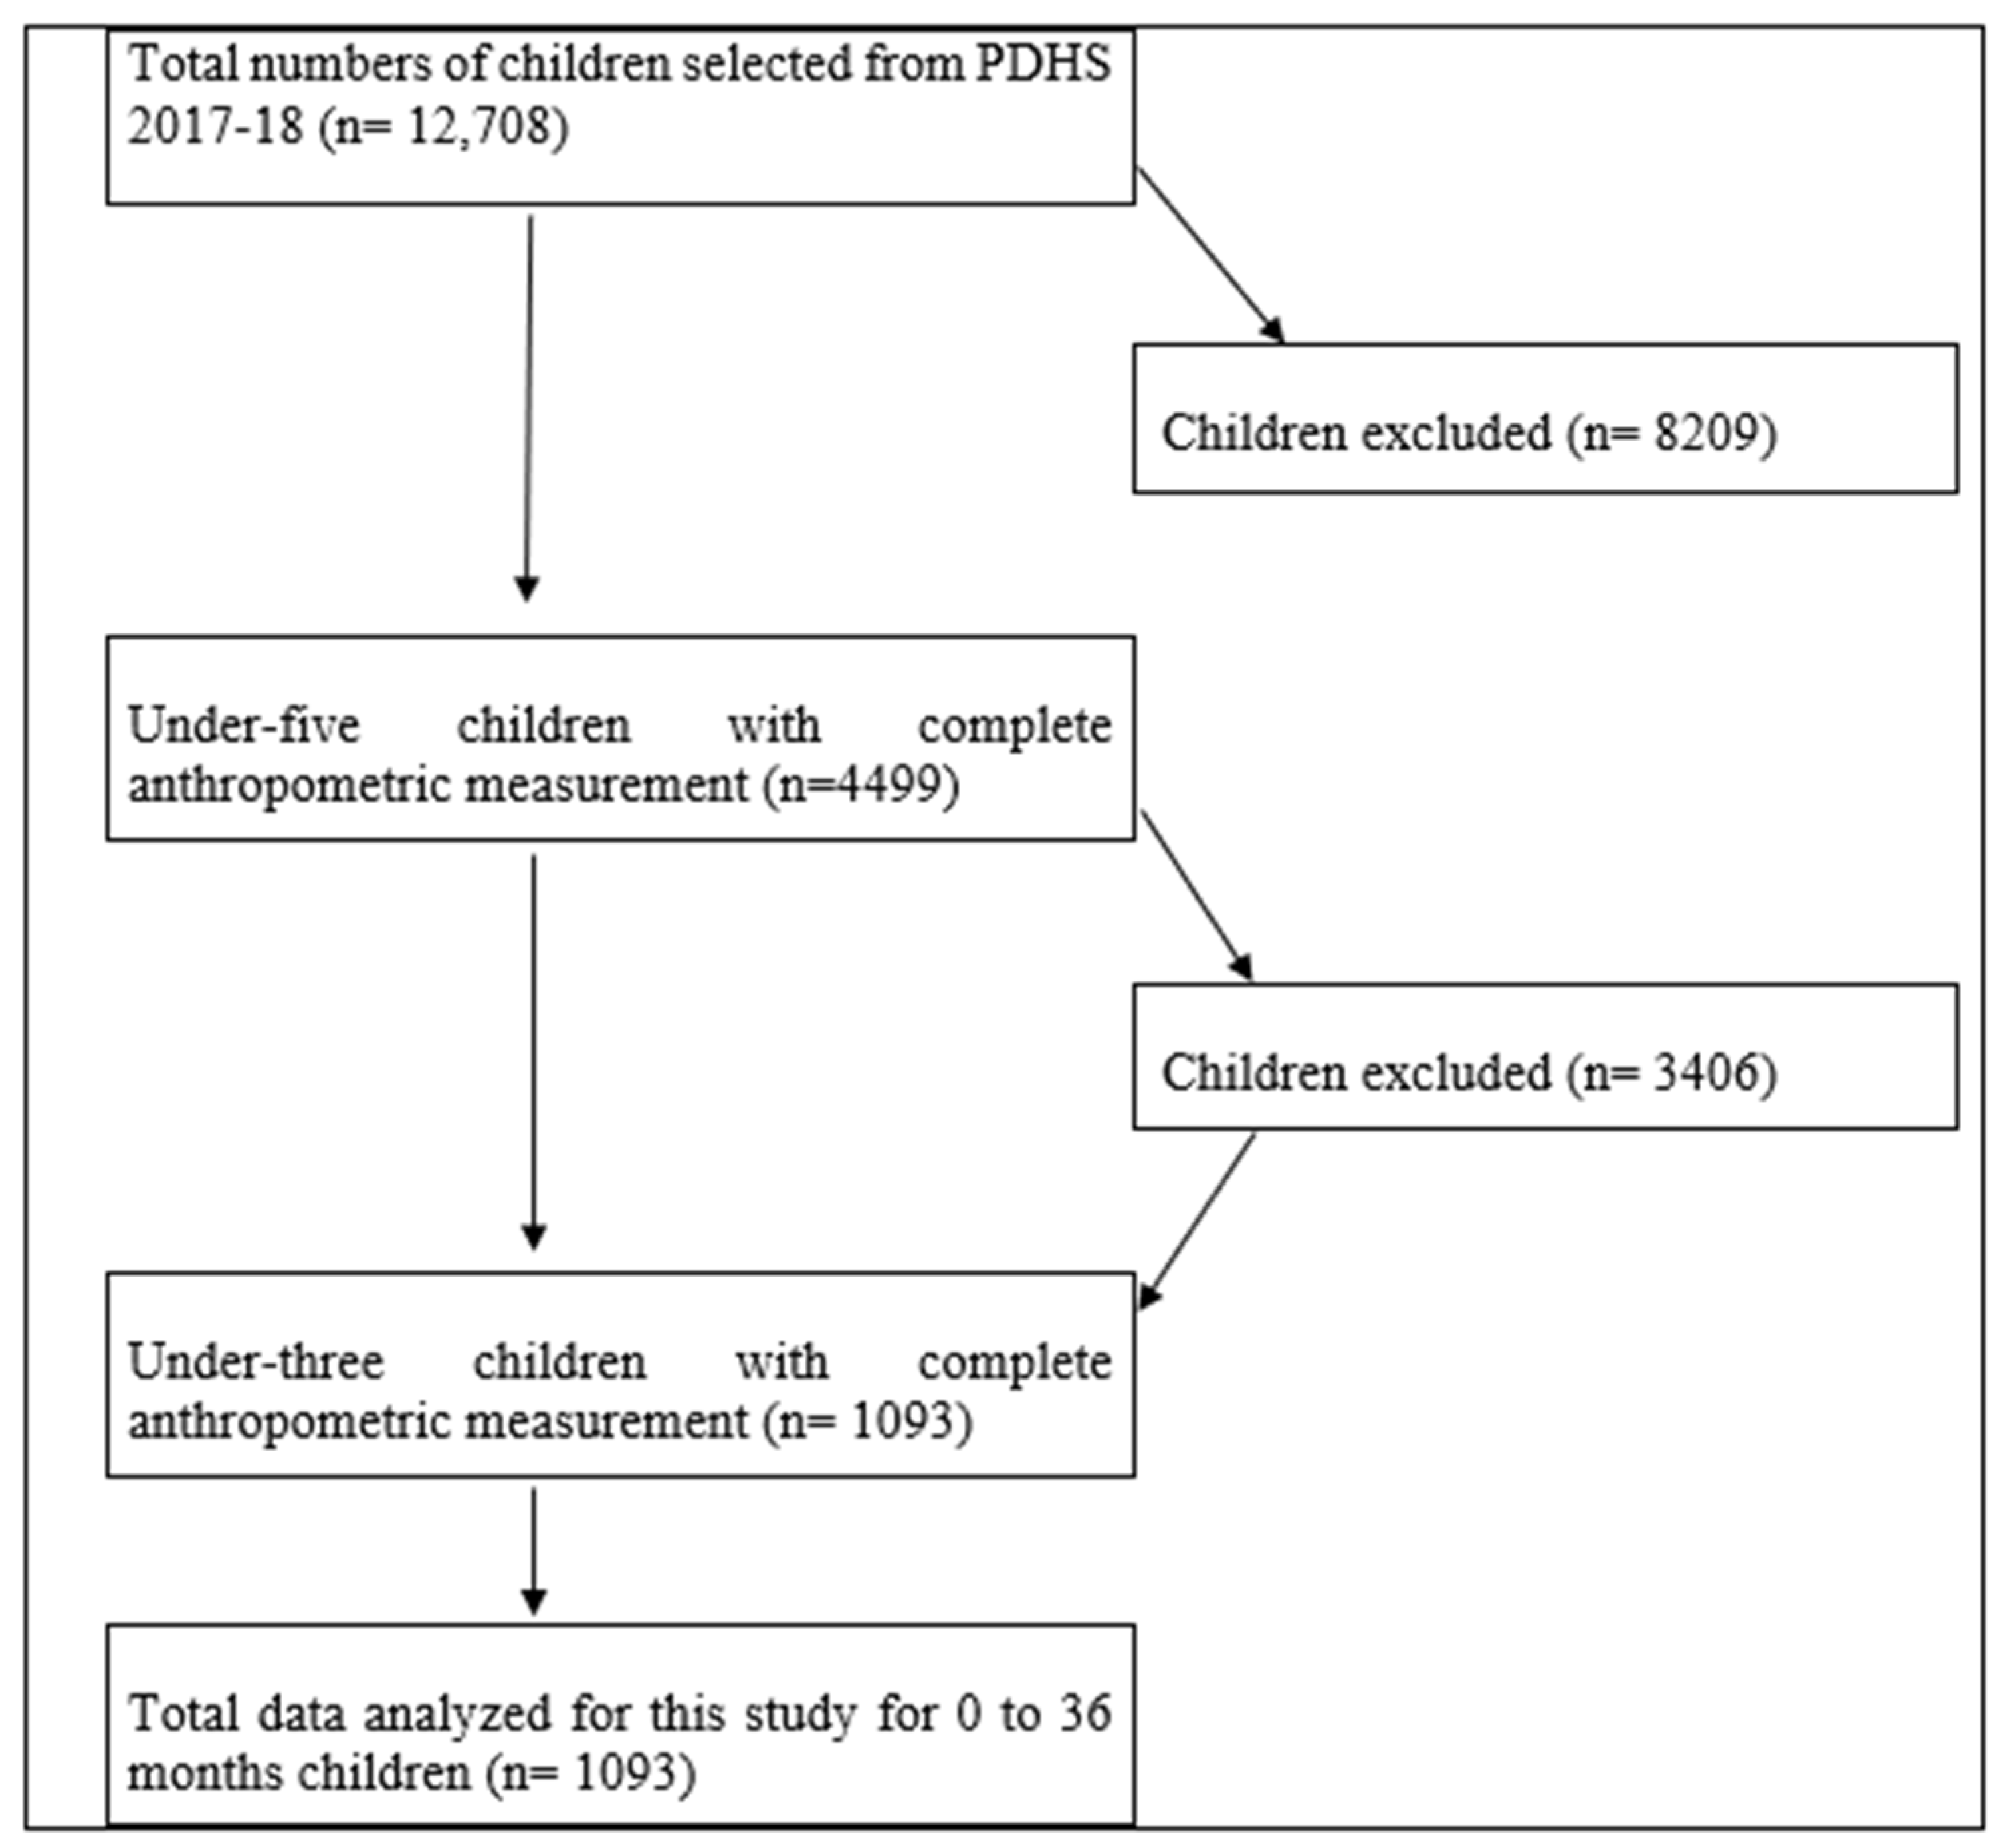
2.2. Data and Description
2.3. Response Variable of the Study
2.4. Data Analysis
3. Results
3.1. Descriptive Statistics
3.2. Binary Logistic Regression Estimates
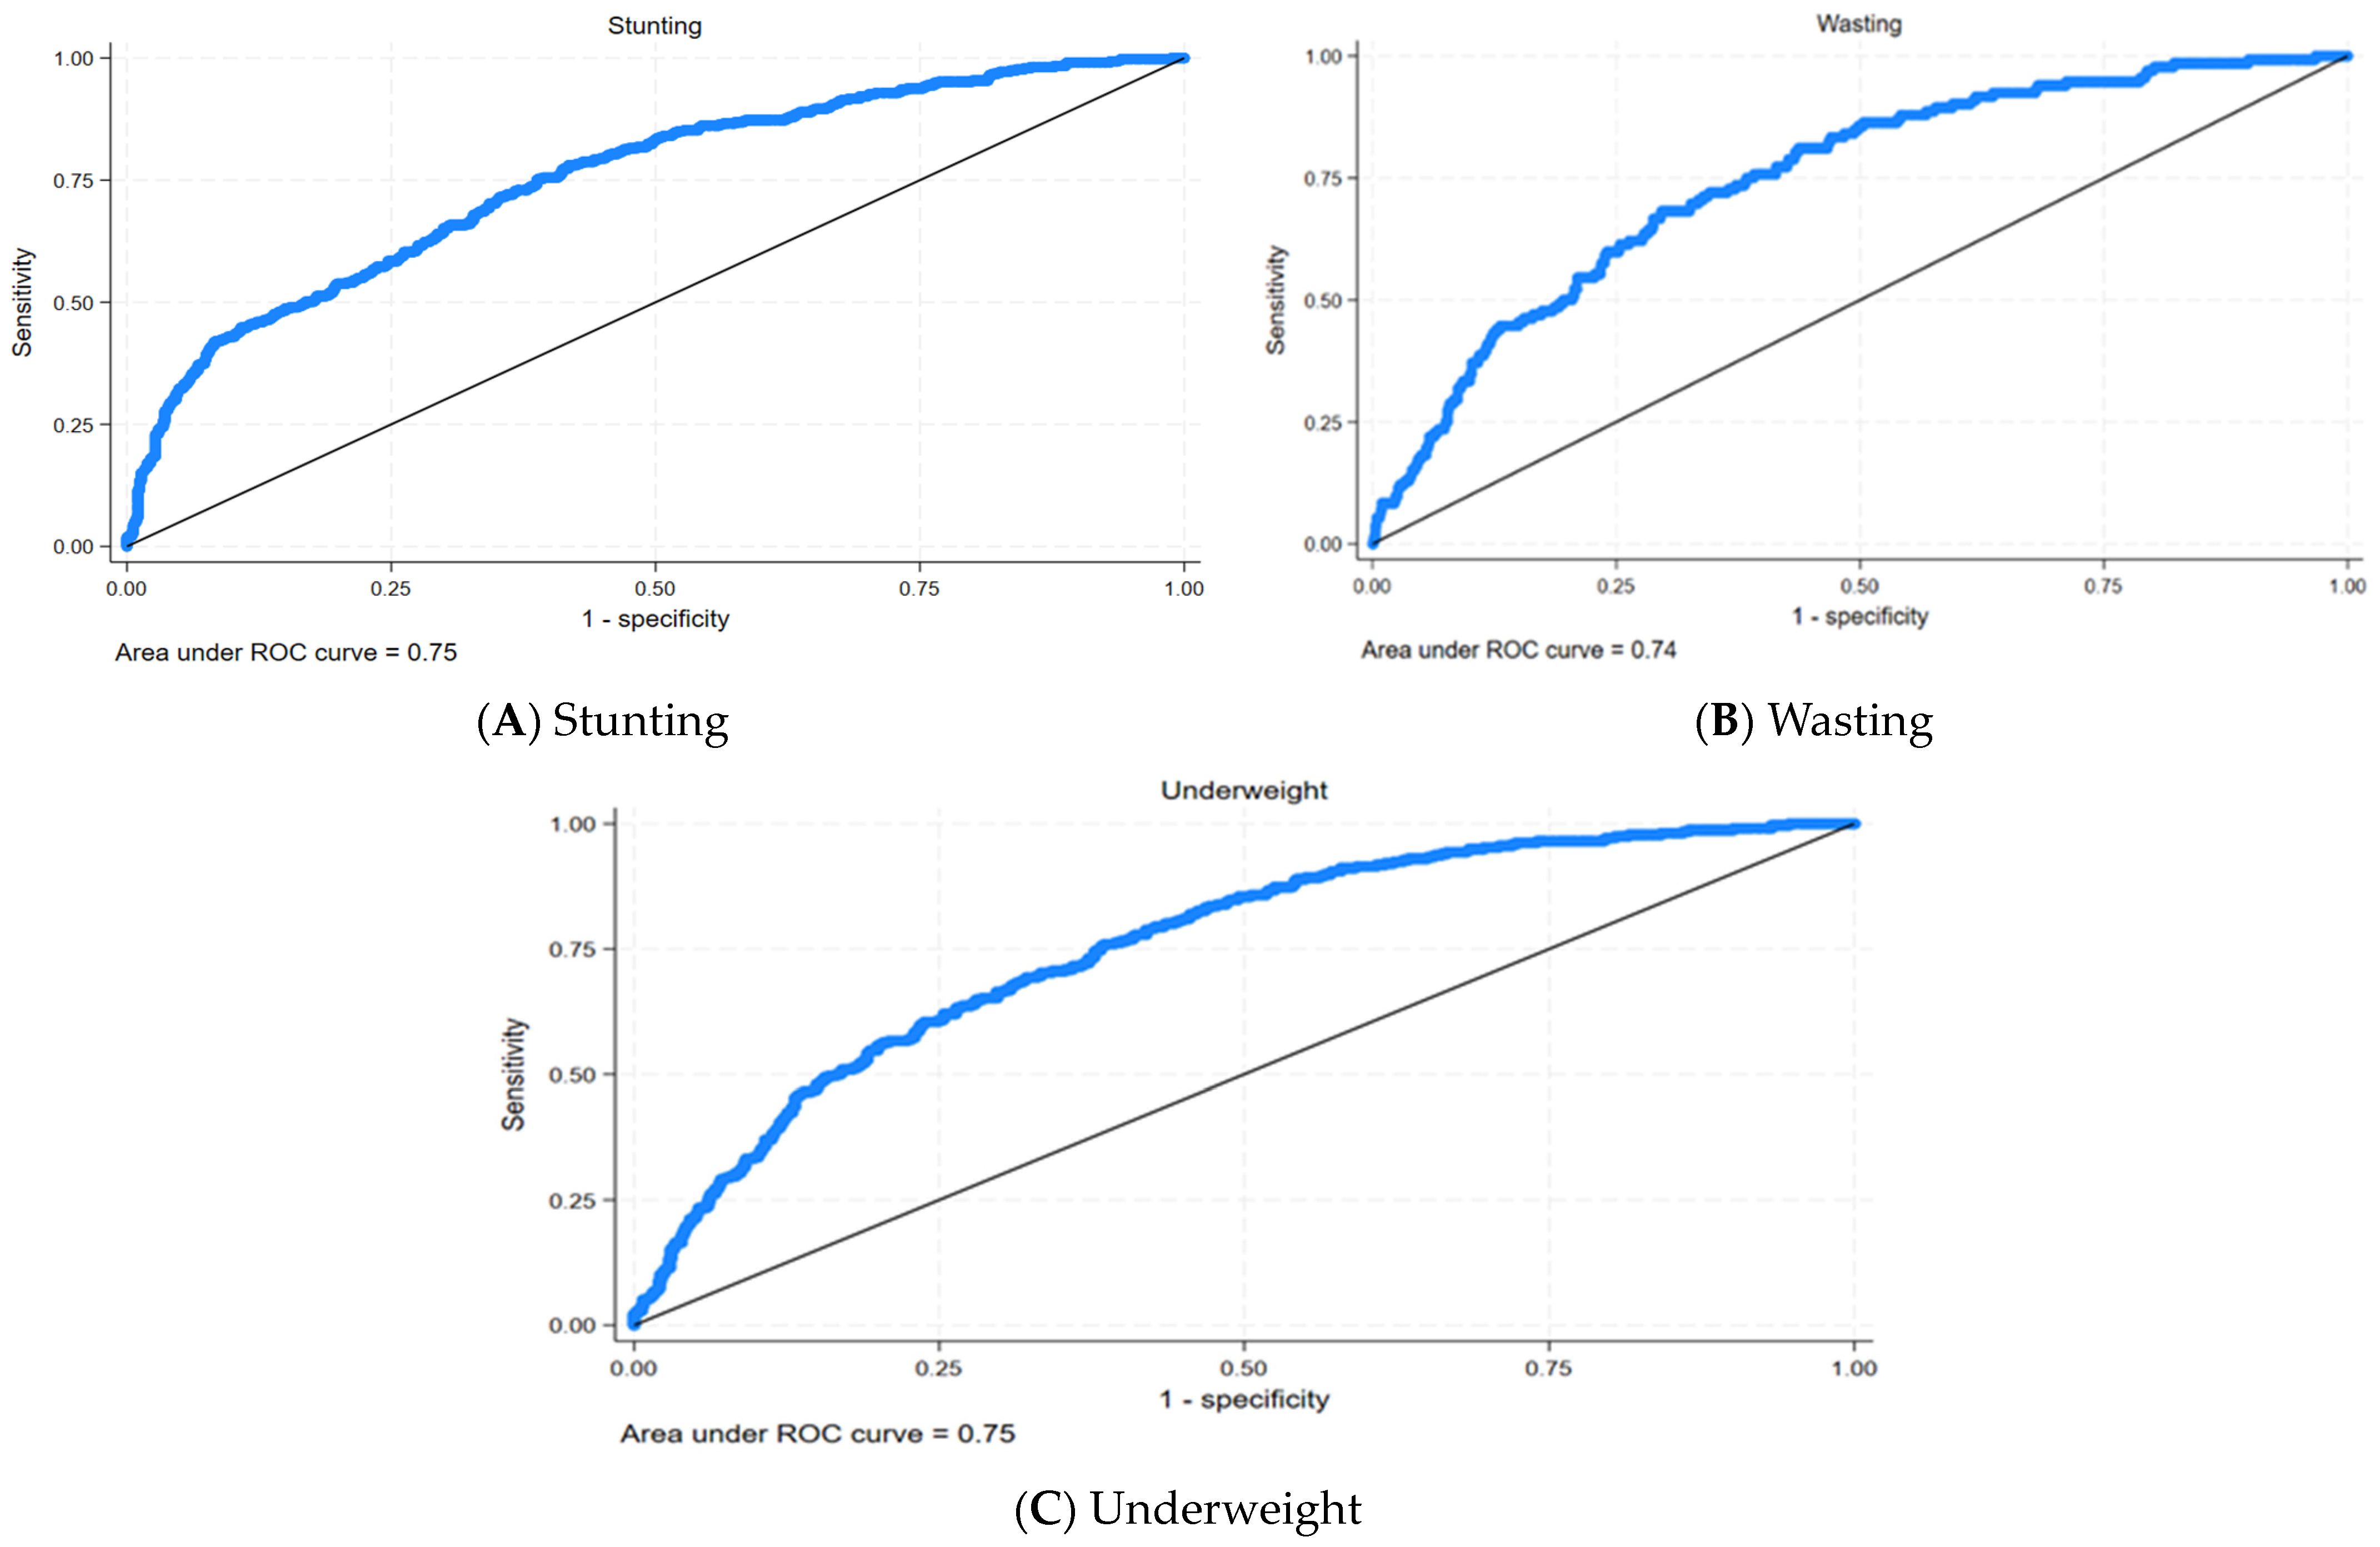
3.3. Post-Analysis Estimation for Model Performance
4. Discussion
Strengths and Limitations of the Study
5. Conclusions
Author Contributions
Funding
Institutional Review Board Statement
Informed Consent Statement
Data Availability Statement
Acknowledgments
Conflicts of Interest
References
- Cederholm, T.; Jensen, G.L.; Correia, M.I.; Gonzalez, M.C.; Fukushima, R.; Higashiguchi, T.; Baptista, G.; Barazzoni, R.; Blaauw, R.; Coats, A.J.; et al. GLIM criteria for the diagnosis of malnutrition–A consensus report from the global clinical nutrition community. J. Cachexia Sarcopenia Muscle 2019, 10, 207–217. [Google Scholar] [CrossRef]
- Ahmed, T.; Hossain, M.; Sanin, K.I. Global burden of maternal and child undernutrition and micronutrient deficiencies. Ann. Nutr. Metab. 2013, 61, 8–17. [Google Scholar] [CrossRef]
- Müller, O.; Krawinkel, M. Malnutrition and health in developing countries. Can. Med. Assoc. J. 2005, 173, 279–286. [Google Scholar] [CrossRef]
- Zhang, Y.-Q.; Li, H.; Wu, H.-H.; Zong, X.-N. Stunting, wasting, overweight and their coexistence among children under 7 years in the context of the social rapidly developing: Findings from a population-based survey in nine cities of China in 2016. PLoS ONE 2021, 16, e0245455. [Google Scholar] [CrossRef]
- Wali, N.; Agho, K.; Renzaho, A.M.N. Past drivers of and priorities for child undernutrition in South Asia: A mixed methods systematic review protocol. Syst. Rev. 2019, 8, 189. [Google Scholar] [CrossRef]
- Akhtar, S. Malnutrition in South Asia—A critical reappraisal. Crit. Rev. Food 2016, 56, 2320–2330. [Google Scholar] [CrossRef]
- World Health Organization. Nutrition Landscape Information System (NLIS) Country Profile Indicators: Interpretation Guide; World Health Organization: Geneva, Switzerland, 2019; Available online: https://www.who.int/publications/i/item/9789241516952 (accessed on 30 November 2021).
- McDonald, C.M.; Olofin, I.; Flaxman, S.; Fawzi, W.W.; Spiegelman, D.; Caulfield, L.E.; Black, R.E.; Ezzati, M.; Danaei, G. Nutrition Impact Model Study. The effect of multiple anthropometric deficits on child mortality: Meta-analysis of individual data in 10 prospective studies from developing countries. Am. J. Clin. Nutr. 2013, 97, 896–901. [Google Scholar] [CrossRef]
- Poirier, M.J.P.; Grépin, K.A.; Grignon, M. Approaches and alternatives to the wealth index to measure socioeconomic status using survey data: A critical interpretive synthesis. Soc. Indic. Res. 2020, 148, 1–46. [Google Scholar] [CrossRef]
- Brooks-Gunn, J.; Klebanov, P.; Liaw, F.-r.; Duncan, G. Toward an understanding of the effects of poverty upon children. In Children of Poverty; Routledge: Oxfordshire, UK, 2021; pp. 3–41. Available online: https://www.taylorfrancis.com/chapters/edit/10.4324/9781315861623-2/toward-understanding-effects-poverty-upon-children-jeanne-brooks-gunn-pamela-klebanov-fong-ruey-liaw-greg-duncan (accessed on 1 May 2023).
- Siponen, S.M.; Ahonen, R.S.; Savolainen, P.H.; Hämeen-Anttila, K.P. Children’s health and parental socioeconomic factors: A population-based survey in Finland. BMC Public Health 2011, 11, 457. [Google Scholar] [CrossRef]
- Fernald, L.C.; Neufeld, L.M. Overweight with concurrent stunting in very young children from rural Mexico: Prevalence and associated factors. Eur. J. Clin. Nutr. 2007, 61, 623–632. [Google Scholar] [CrossRef] [PubMed]
- Keino, S.; Plasqui, G.; Ettyang, G.; van den Borne, B. Determinants of stunting and overweight among young children and adolescents in sub-Saharan Africa. Food Nutr. Bull. 2014, 35, 167–178. [Google Scholar] [CrossRef]
- Zhang, N.; Bécares, L.; Chandola, T. Patterns and determinants of double-burden of malnutrition among rural children: Evidence from China. PLoS ONE 2016, 11, e0158119. [Google Scholar] [CrossRef]
- Asim, M.; Nawaz, Y. Child malnutrition in Pakistan: Evidence from literature. Children 2018, 5, 60. [Google Scholar] [CrossRef]
- Shahid, M.; Ahmed, F.; Ameer, W.; Guo, J.; Raza, S.; Fatima, S.; Qureshi, G.M. Prevalence of child malnutrition and household socioeconomic deprivation: A case study of marginalized district in Punjab, Pakistan. PLoS ONE 2022, 17, e0263470. [Google Scholar] [CrossRef]
- Shahid, M.; Ameer, W.; Malik, N.I.; Alam, M.B.; Ahmed, F.; Qureshi, M.G.; Zhao, H.; Yang, J.; Zia, S. Distance to Healthcare Facility and Lady Health Workers’ Visits Reduce Malnutrition in under Five Children: A Case Study of a Disadvantaged Rural District in Pakistan. Int. J. Environ. Res. Public Health 2022, 19, 8200. [Google Scholar] [CrossRef]
- Cunningham, K.; Headey, D.; Singh, A.; Karmacharya, C.; Rana, P.P. Maternal and Child Nutrition in Nepal: Examining drivers of progress from the mid-1990s to 2010s. Glob. Food Secur. 2017, 13, 30–37. [Google Scholar] [CrossRef]
- Hoddinott, J.; Maluccio, J.; Behrman, J.R.; Martorell, R.; Melgar, P.; Quisumbing, A.R.; Yount, K.M. The Consequences of Early Childhood Growth Failure over the Life Course; Discussion Paper; International Food Policy Research Institute: Washington, DC, USA, 2011; Volume 1073, p. 5. Available online: https://www.almendron.com/tribuna/wp-content/uploads/2019/07/the-consequences-of-early-childhood-growth-failure-over-the-life-course.pdf. (accessed on 1 May 2018).
- Shekar, M.; Dayton Eberwein, J.; Kakietek, J. The costs of stunting in South Asia and the benefits of public investments in nutrition. Matern. Child Nutr. 2016, 12, 186–195. [Google Scholar] [CrossRef]
- Horton, S.; Steckel, R.H. Malnutrition: Global economic losses attributable to malnutrition 1900–2000 and projections to 2050. In How Much Have Global Problems Cost the Earth? A Scorecard from 1900 to 2050; Cambridge University: Cambridge, UK, 2013; pp. 247–272. Available online: https://copenhagenconsensus.com/sites/default/files/malnutrition.pdf (accessed on 1 June 2021).
- Hoddinott, J.; Alderman, H.; Behrman, J.R.; Haddad, L.; Horton, S. The economic rationale for investing in stunting reduction. Matern. Child Nutr. 2013, 9, 69–82. [Google Scholar] [CrossRef]
- Glick, P. Women’s Employment and Its Relation to Children’s Health and Schooling in Developing Countries: Conceptual Links, Empirical Evidence, and Policies. Cornell Food and Nutrition Policy Program Working Paper. 2022, p. 131. Available online: http://www.cfnpp.cornell.edu/images/wp131.pdf (accessed on 23 August 2023).
- Becker, G.S. A Theory of the Allocation of Time. Econ. J. 1965, 75, 493–517. [Google Scholar] [CrossRef]
- Strauss, J.; Thomas, D. Human Resources: Empirical Modeling of Household and Family Decisions. In Handbook of Development Economics; Behrman, J.B., Srinivasan, T.N., Eds.; Elsevier: Amsterdam, The Netherlands, 1995; p. 3. [Google Scholar] [CrossRef]
- World Health Organization (WHO). Child Growth Standards and the Identification of Severe Acute Malnutrition in Infants and Children: A Joint Statement by the World Health Organization and the United Nations Children’s Fund; World Health Organization: Geneva, Switzerland, 2009; Available online: https://apps.who.int/iris/bitstream/handle/10665/44129/9789241598163_eng.pdf?sequence=1&isAllowed=y (accessed on 2 May 2020).
- Alam, M.B.; Shahid, M.; Alzghoul, B.I.; Yang, J.; Zakar, R.; Malik, N.I.; Bibi, A.; Tang, K. The Effects of Financial Stress and Household Socio-Economic Deprivation on the Malnutrition Statuses of Children Under Five during the COVID-19 Lockdown in a Marginalized Region of South Punjab, Pakistan. Children 2023, 10, 12. [Google Scholar] [CrossRef] [PubMed]
- Das, S.; Rahman, R.M. Application of ordinal logistic regression analysis in determining risk factors of child malnutrition in Bangladesh. Nutr. J. 2011, 10, 124. [Google Scholar] [CrossRef] [PubMed]
- Shahid, M.; Cao, Y.; Ahmed, F.; Raza, S.; Guo, J.; Malik, N.I.; Rauf, U.; Qureshi, M.G.; Saheed, R.; Maryam, R. Does mothers’ awareness of health and nutrition matter? A case study of child malnutrition in marginalized rural community of Punjab, Pakistan. Front. Public Health 2022, 10, 792164. [Google Scholar] [CrossRef] [PubMed]
- Shahid, M.; Liu, Y.; Ameer, W.; Qureshi, M.G.; Ahmed, F.; Tang, K. Comparison of Different Nutritional Screening Approaches and the Determinants of Malnutrition in Under-Five Children in a Marginalized District of Punjab Province, Pakistan. Children 2022, 9, 1096. [Google Scholar] [CrossRef]
- Chatterjee, M.; Lumbert, J. Women and nutrition: Reflection from India and Pakistan. Food Nutr. Bull. 1989, 11, 90. [Google Scholar] [CrossRef]
- Khaliq, A.; Wraith, D.; Miller, Y.; Nambiar-Mann, S. Prevalence, Trends, and Socioeconomic Determinants of Coexisting Forms of Malnutrition Amongst Children under Five Years of Age in Pakistan. Nutrients 2021, 13, 4566. [Google Scholar] [CrossRef] [PubMed]
- Khan, S.; Zaheer, S.; Safdar, N.F. Determinants of stunting, underweight and wasting among children < 5 years of age: Evidence from 2012–2013 Pakistan demographic and health survey. BMC Public Health 2019, 19, 385. [Google Scholar] [CrossRef]
- Shahid, M.; Cao, Y.; Shahzad, M.; Saheed, R.; Rauf, U.; Qureshi, M.G.; Hasnat, A.; Bibi, A.; Ahmed, F. Socio-Economic and Environmental Determinants of Malnutrition in under Three Children: Evidence from PDHS-2018. Children 2022, 9, 361. [Google Scholar] [CrossRef] [PubMed]
- Saheed, R.; Shahid, M.; Wang, J.; Qureshi, M.G.; Sun, X.; Bibi, A.; Zia, S.; Tang, K. Impact of Drinking Water Source and Sanitation Facility on Malnutrition Prevalence in Children under Three: A Gender-Disaggregated Analysis Using PDHS 2017–18. Children 2022, 9, 1674. [Google Scholar] [CrossRef] [PubMed]
- Fakir, A.M.S.; Khan, M.W.R. Determinants of malnutrition among urban slum children in Bangladesh. Health Econ. Rev. 2015, 5, 22. [Google Scholar] [CrossRef]
- Ahmed, F.; Malik, N.I.; Shahzad, M.; Ahmad, M.; Shahid, M.; Feng, X.L.; Guo, J. Determinants of Infant Young Child Feeding Among Mothers of Malnourished Children in South Punjab, Pakistan: A Qualitative Study. Front. Public Health 2022, 10, 834089. [Google Scholar] [CrossRef]
- Ahmed, F.; Malik, N.I.; Malik, N.; Qureshi, M.G.; Shahzad, M.; Shahid, M.; Zia, S.; Tang, K. Key Challenges to Optimal Therapeutic Coverage and Maternal Utilization of CMAM Program in Rural Southern Pakistan: A Qualitative Exploratory Study. Nutrients 2022, 14, 2612. [Google Scholar] [CrossRef]
- Shafiq, A.; Hussain, A.; Asif, M.; Hwang, J.; Jameel, A.; Kanwel, S. The effect of “women’s empowerment” on child nutritional status in Pakistan. Int. J. Environ. Res. Public Health 2019, 16, 4499. [Google Scholar] [CrossRef] [PubMed]
- Anand, A.; Roy, N. Transitioning toward sustainable development goals: The role of household environment in influencing child health in Sub-Saharan Africa and South Asia using recent demographic health surveys. Front. Public Health 2016, 4, 87. [Google Scholar] [CrossRef] [PubMed]
- Dharod, J.M.; Nounkeu, C.D.; Paynter, L.; Labban, J.D.; Sastre, L.R. Examination of the Cameroon DHS data to investigate how water access and sanitation services are related to diarrhea and nutrition among infants and toddlers in rural households. J. Water Health 2021, 19, 1030–1038. [Google Scholar] [CrossRef] [PubMed]
- Azupogo, F.; Abizari, A.R.; Aurino, E.; Gelli, A.; Osendarp, S.; Bras, H.; Brouwer, I.D. Malnutrition, hypertension risk, and correlates: An analysis of the 2014 ghana demographic and health survey data for 15–19 years adolescent boys and girls. Nutrients 2020, 12, 2737. [Google Scholar] [CrossRef] [PubMed]
- Torlesse, H.; Cronin, A.A.; Sebayang, S.K.; Nandy, R. Determinants of stunting in Indonesian children: Evidence from a cross-sectional survey indicate a prominent role for the water, sanitation and hygiene sector in stunting reduction. BMC Public Health 2016, 16, 669. [Google Scholar] [CrossRef] [PubMed]
- Choudhary, N.; Schuster, R.; Brewis, A.; Wutich, A. Water insecurity potentially undermines dietary diversity of children aged 6–23 months: Evidence from India. Matern. Child Nutr. 2020, 16, e12929. [Google Scholar] [CrossRef]
- Baker, K.K.; Story, W.T.; Walser-Kuntz, E.; Zimmerman, M.B. Impact of social capital, harassment of women and girls, and water and sanitation access on premature birth and low infant birth weight in India. PLoS ONE 2018, 13, e0205345. [Google Scholar] [CrossRef] [PubMed]
- Ngure, F.M.; Reid, B.M.; Humphrey, J.H.; Mbuya, M.N.; Pelto, G.; Stoltzfus, R.J. Water, sanitation, and hygiene (WASH), environmental enteropathy, nutrition, and early child development: Making the links. Ann. N. Y. Acad. 2014, 1308, 118–128. [Google Scholar] [CrossRef]
- Ahmed, F.; Shahid, M.; Cao, Y.; Qureshi, M.G.; Zia, S.; Fatima, S.; Guo, J. A Qualitative Exploration in Causes of Water Insecurity Experiences, and Gender and Nutritional Consequences in South-Punjab, Pakistan. Int. J. Environ. Res. Public Health 2021, 18, 12534. [Google Scholar] [CrossRef]
- Jabeen, S.; Mahmood, Q.; Nawab, B. High economic impacts of poor water and sanitation in various communities in Pakistan (an environmental economic perspective). Cent. Asian J. Environ. Sci. Technol. Innov. 2020, 1, 53–60. [Google Scholar]
- Shahid, M. Interaction of Household Wealth and Women Working Status on Child Malnutrition: Evidence from PDHS-2013. Pak. Perspect. J. 2020, 25, 71–84. [Google Scholar]

| Variables | Stunting | Underweight | Wasting | |||
|---|---|---|---|---|---|---|
| % | p-Value | % | p-Value | % | p-Value | |
| Sex of the Child | ||||||
| Female | 48.28 | 0.18 | 48.12 | 0.40 | 45.11 | 0.305 |
| Male | 51.72 | 51.88 | 54.89 | |||
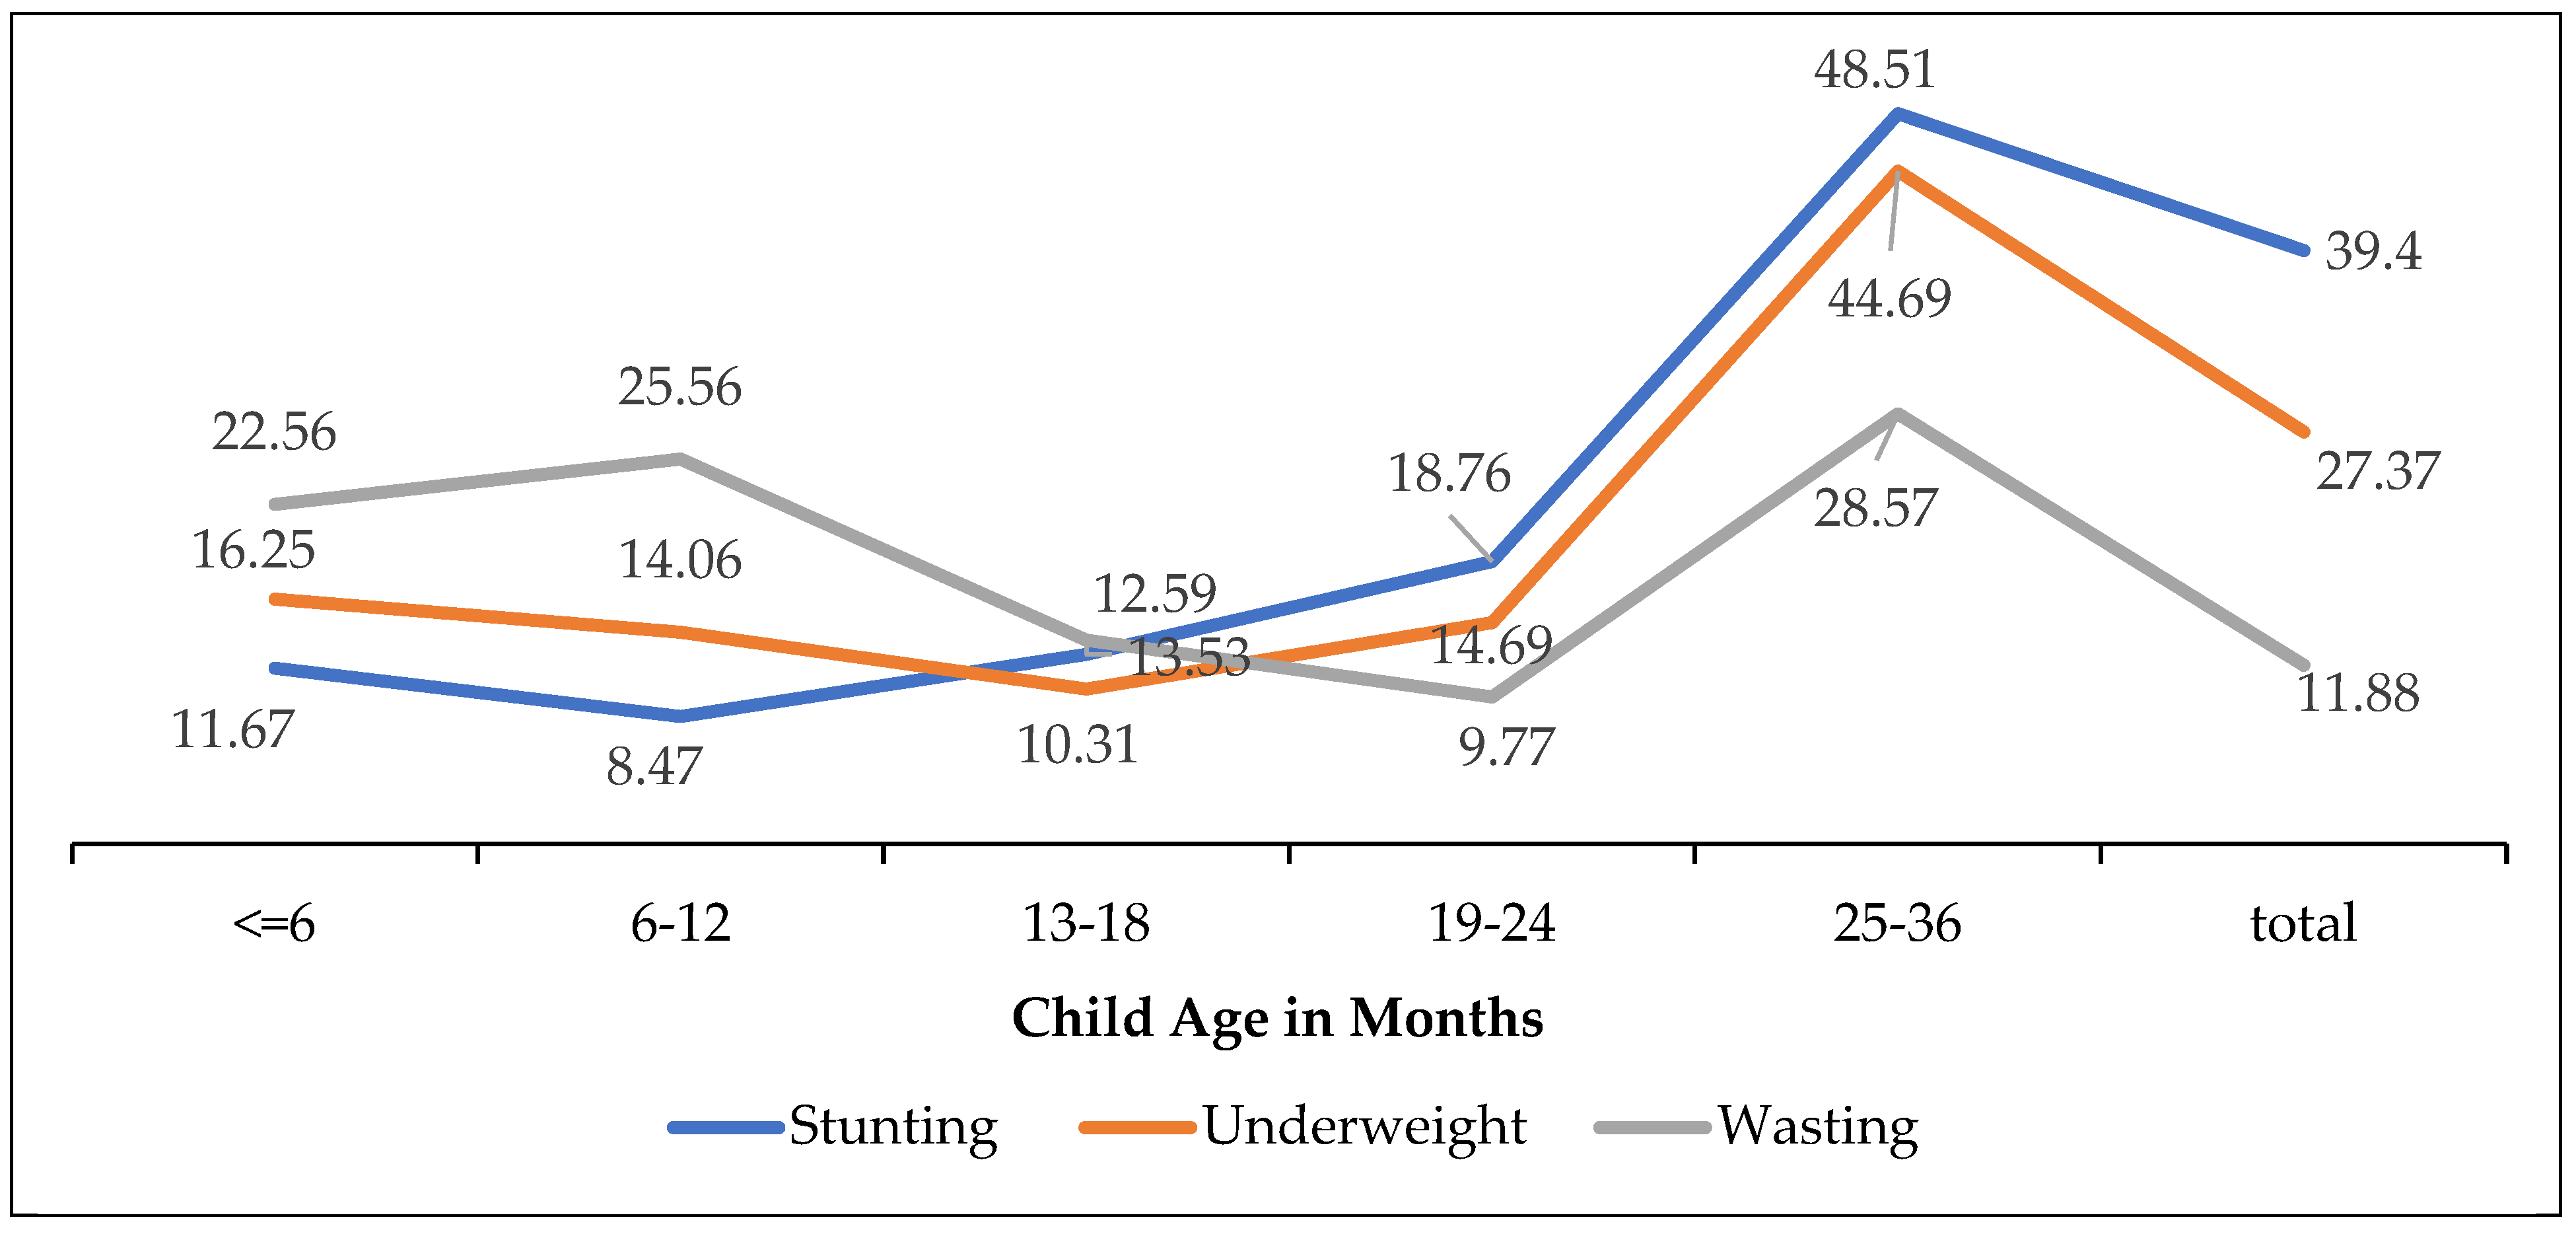
| Child’s Age | ||||||
| Less than 6 months | 11.67 | p < 0.001 | 16.25 | p < 0.05 | 22.56 | p < 0.001 |
| 6–12 months | 8.47 | 14.06 | 25.56 | |||
| 13–18 months | 12.59 | 10.31 | 13.53 | |||
| 19–24 months | 18.76 | 14.69 | 9.77 | |||
| 25–36 months | 48.51 | 44.69 | 28.57 | |||
| Birth’s Order Number | ||||||
| 1 | 39.82 | 0.208 | 34.06 | 0.57 | 33.08 | 0.113 |
| 2 | 27.92 | 30.31 | 36.09 | |||
| 3 | 23.80 | 26.25 | 20.30 | |||
| 4 or above | 8.47 | 9.38 | 10.53 | |||
| Mother body-mass-index (BMI) | ||||||
| <18.5 kg/m2 | 86.14 | p < 0.002 | 83.23 | p < 0.001 | 89.39 | 0.938 |
| ≥18.5 kg/m2 | 39.29 | 16.77 | 10.61 | |||
| Education level | ||||||
| Illiterate | 75.06 | p < 0.001 | 79.38 | p < 0.001 | 73.68 | p < 0.01 |
| Primary | 10.07 | 10.00 | 9.02 | |||
| Secondary/Middle | 10.76 | 7.19 | 8.27 | |||
| Higher | 4.12 | 3.44 | 9.02 | |||
| Residence | ||||||
| Rural | 64.30 | p < 0.004 | 66.56 | p < 0.001 | 63.16 | 0.379 |
| Urban | 35.70 | 33.44 | 36.84 | |||
| Regions | ||||||
| Punjab | 10.53 | p < 0.001 | 6.56 | p < 0.001 | 9.02 | p < 0.001 |
| Sindh | 24.94 | 30.31 | 22.56 | |||
| KPK | 13.96 | 14.37 | 20.30 | |||
| Balochistan | 22.43 | 29.69 | 33.08 | |||
| Gilgit Baltistan | 5.72 | 1.88 | 1.50 | |||
| Islamabad-Capital | 3.20 | 0.94 | 0.75 | |||
| Azad Jamu and Kahmir | 5.95 | 3.44 | 3.01 | |||
| FATA | 13.27 | 12.81 | 9.77 | |||
| Water Source | ||||||
| Improved | 28.15 | p < 0.05 | 29.38 | p < 0.001 | 27.07 | p < 0.05 |
| Un- improved | 71.85 | 70.62 | 72.93 | |||
| Sanitation Facility | ||||||
| Improved | 39.36 | p < 0.001 | 39.06 | p < 0.001 | 31.58 | p < 0.05 |
| Un- improved | 60.64 | 60.94 | 68.42 | |||
| Diarrhea | ||||||
| Yes | 73.23 | p < 0.05 | 75.0 | p < 0.001 | 75.94 | p < 0.05 |
| No | 26.77 | 25.0 | 24.06 | |||
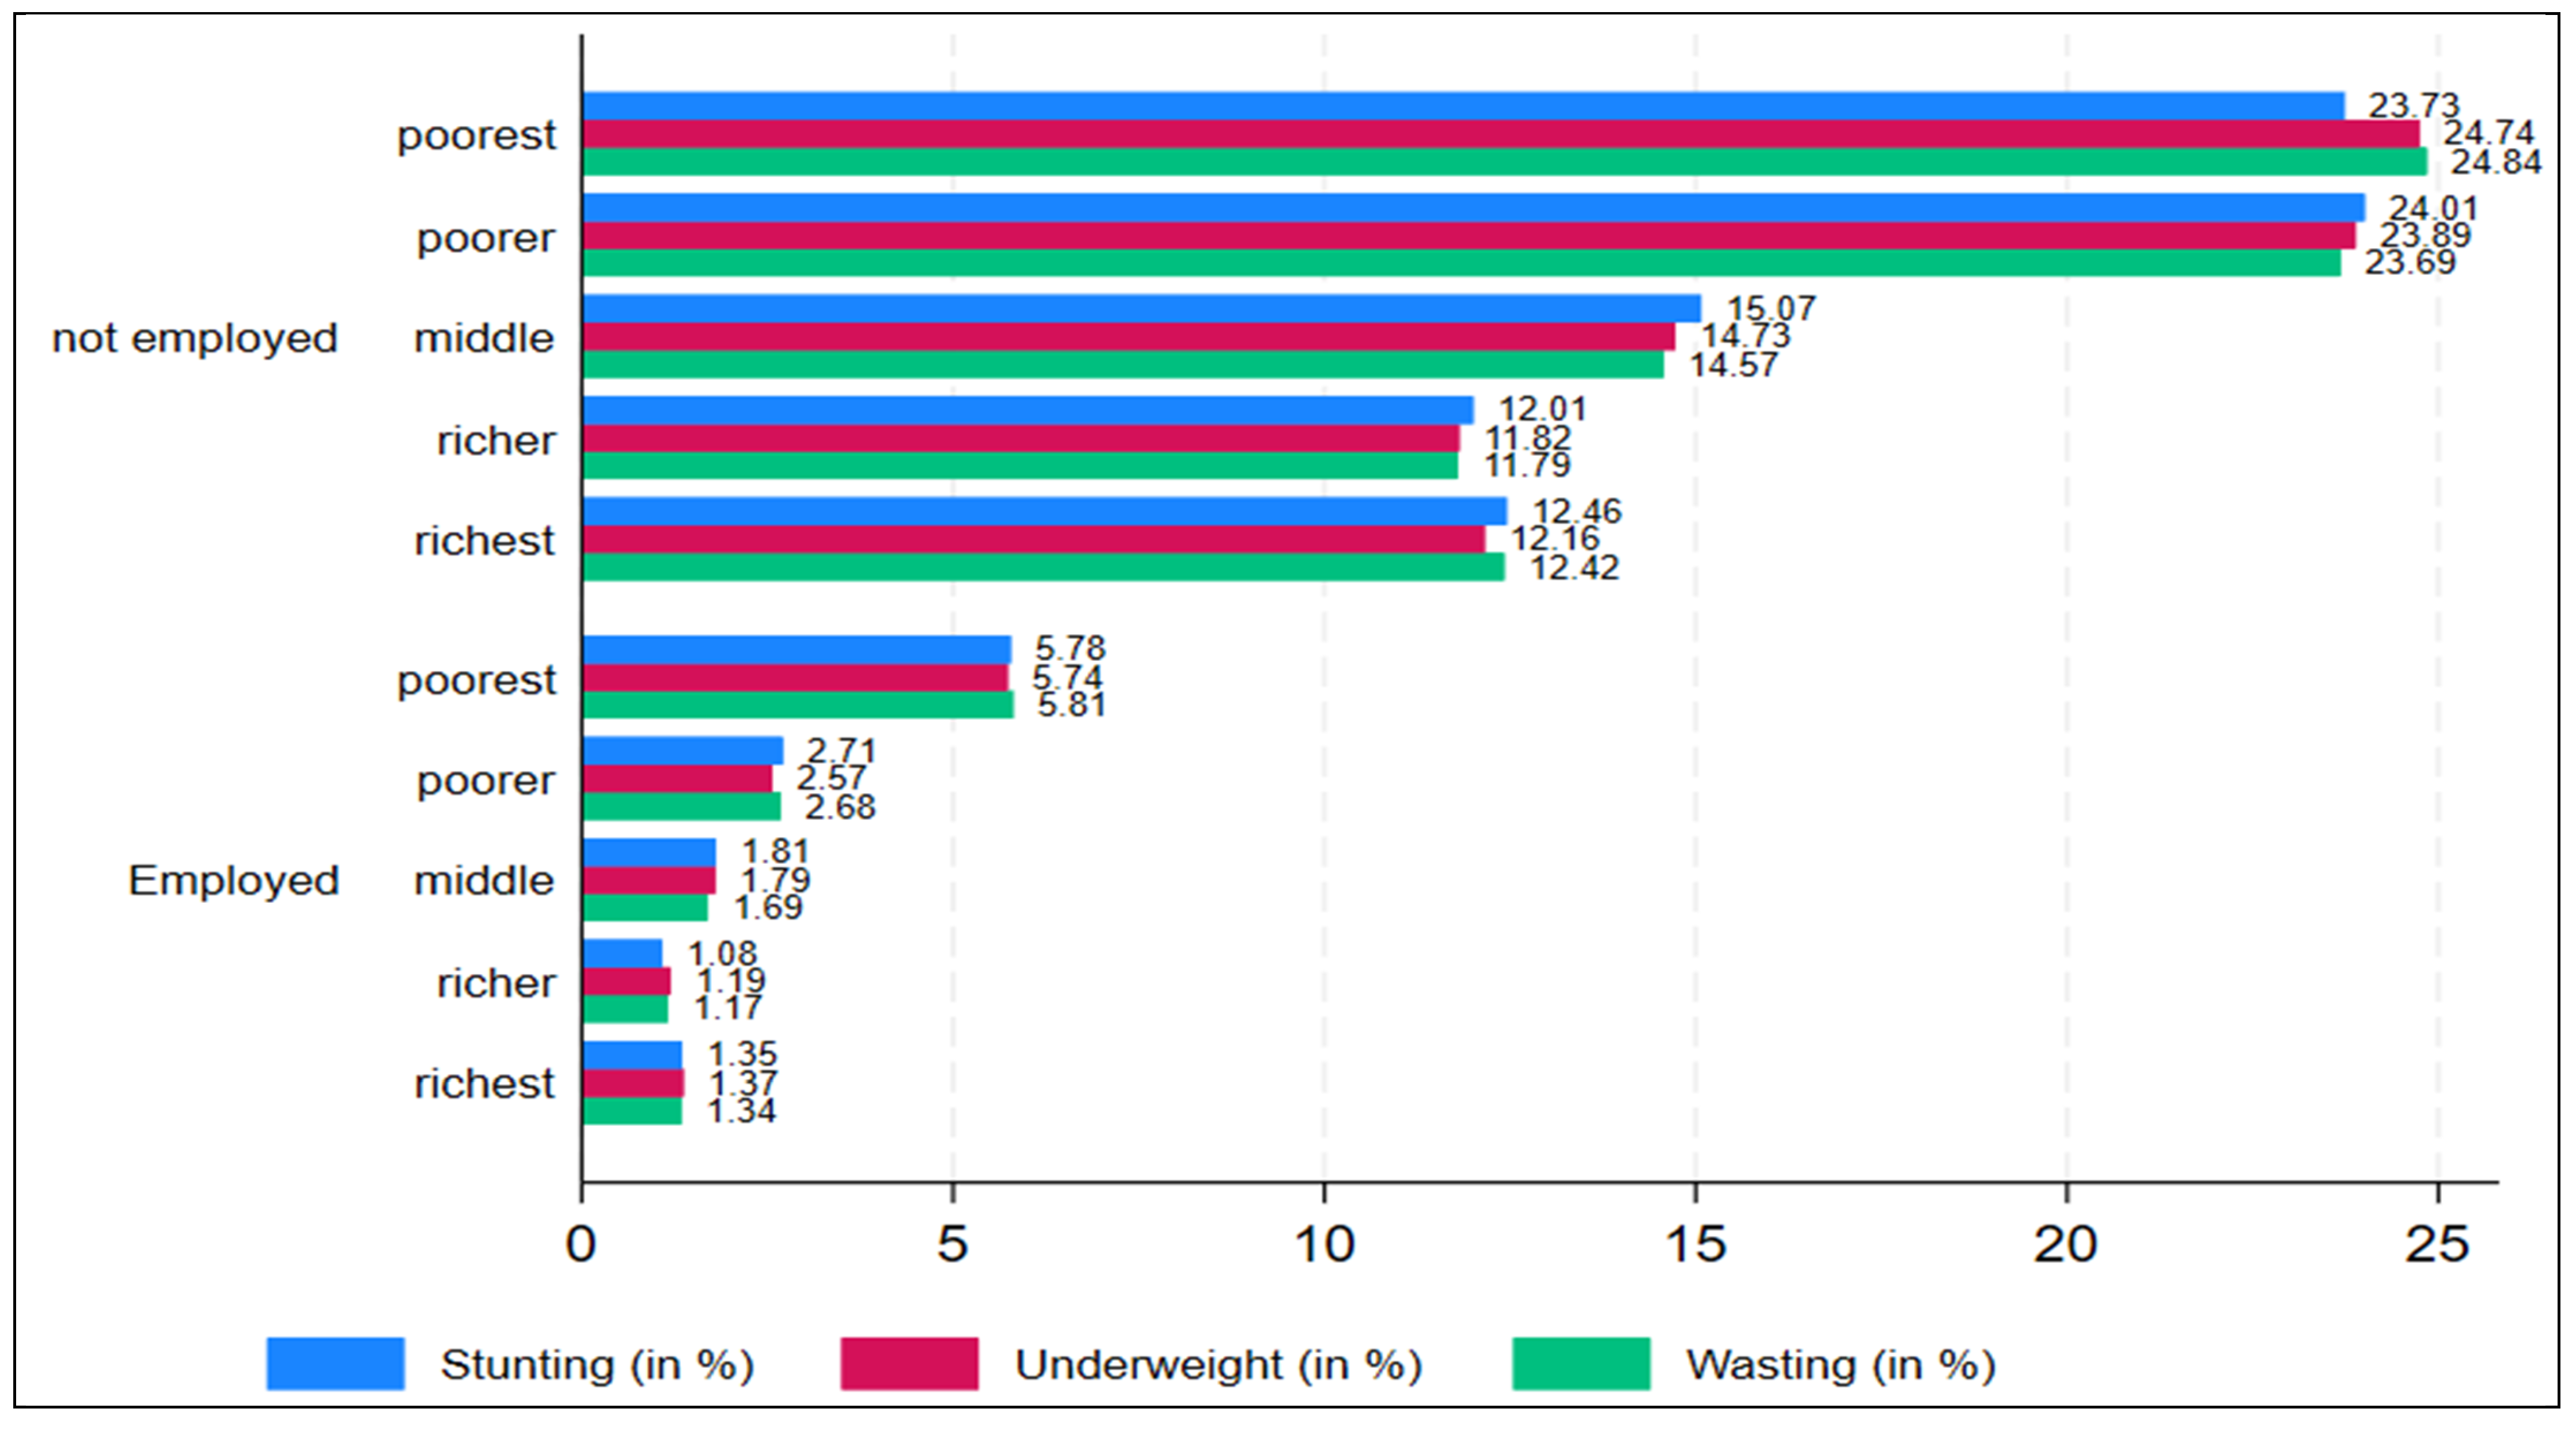
| Wealth Index | ||||||
| Poorest | 41.19 | p < 0.001 | 45.31 | p < 0.001 | 33.08 | p < 0.001 |
| Poorer | 28.38 | 28.12 | 34.59 | |||
| Middle | 14.19 | 15.0 | 12.78 | |||
| Richer | 9.38 | 8.44 | 12.78 | |||
| Richest | 6.86 | 3.12 | 6.77 | |||
| Mother Employment | ||||||
| Not-Employed | 85.13 | p < 0.01 | 83.44 | p < 0.01 | 87.22 | p < 0.05 |
| Employed | 14.87 | 16.56 | 12.78 | |||
| Total | 39.40 | 27.37 | 11.88 | |||
| Variables | Stunting | Underweight | Wasting | |||
|---|---|---|---|---|---|---|
| Odd Ratios | 95% CI | Odd Ratios | 95% CI | Odd Ratios | 95% CI | |
| Sex of the child | Female (R) | |||||
| Male | 1.15 | (0.89–1.49) | 1.08 | (0.81–1.44) | 0.72 | (0.49–1.07) |
| Child’s age | <6 months (R) | |||||
| 6–12 months | 1.34 | (0.84–2.11) | 1.22 | (0.73–2.02) | 1.70 | (0.96–3.04) |
| 13–18 months | 1.14 | (0.72–1.79) | 0.80 | (0.46–0.46) | 0.70 | (0.36–1.36) |
| 19–24 months | 2.56 *** | (1.61–4.07) | 1.64 * | (1.98–2.74) | 1.50 * | (1.24–1.47) |
| 25–36 months | 1.94 *** | (1.80–3.80) | 1.83 ** | (1.22–2.76) | 1.03 * | (1.33–1.96) |
| Age2 of the child | 0.96 * | (0.17–0.63) | 0.49 ** | (0.31–0.76) | 0.23 * | 0.29–0.36) |
| Birth’s Order Number | Birth order number = 1 (R) | |||||
| 2 | 1.03 | (0.76–1.42) | 1.28 | (0.89–1.83) | 1.73 | (1.08–2.78) |
| 3 | 0.96 | (0.67–1.37) | 1.31 | (0.89–1.92) | 1.15 | (0.66–2.00) |
| 4 or above | 0.75 | (0.46–1.23) | 1.14 | (0.67–1.94) | 1.60 | (0.79–3.25) |
| Mother body-mass-index (BMI) | <18.5 kg/m2 (R) | |||||
| ≥18.5 kg/m2 | 0.71 | (0.46–1.09) | 0.18 | (0.27–1.22) | 1.07 | (0.56–2.03) |
| Education level | Illiterate (R) | |||||
| Primary | 0.73 | (0.47–1.14) | 0.97 | (0.60–1.59) | 1.00 | (0.43–1.73) |
| Secondary/Middle | 0.57 ** | (0.42–0.86) | 0.56 ** | (0.32–0.98) | 0.65 * | (0.30–0.38) |
| Higher | 0.32 *** | (0.19–0.55) | 0.46 ** | (0.21–1.01) | 0.86 ** | (0.42–0.88) |
| Residence | Rural (R) | |||||
| Urban | 1.22 | (0.89–1.66) | 0.96 | (0.67–1.38) | 0.91 | (0.57–1.46) |
| Regions | Punjab (R) | |||||
| Sindh | 2.75 *** | (1.71–4.41) | 3.55 *** | (2.02–6.27) | 1.75 | (1.82–3.73) |
| KPK | 1.73 ** | (1.07–2.81) | 2.04 ** | (1.11–3.74) | 1.89 * | (1.88–4.05) |
| Balochistan | 2.98 *** | (1.82–4.91) | 3.48 *** | (1.94–6.22) | 3.04 ** | (1.43–6.45) |
| Gilgit Baltistan | 0.89 | (0.46–1.72) | 0.43 | (0.15–1.17) | 0.29 | (0.06–1.43) |
| Islamabad-Capital | 0.95 | (0.44–2.04) | 0.54 | (0.14–2.01) | 0.26 | (0.03–2.12) |
| Azad Jamu and Kahmir | 1.21 | (0.65–2.24) | 0.74 | (0.31–1.74) | 0.49 | (0.14–1.66) |
| FATA | 1.07 | (0.62–1.83) | 1.43 | (0.75–2.72) | 0.75 | (0.30–1.86) |
| Water source | Un-Improved (R) | |||||
| Improved | 0.65 ** | (0.47–0.92) | 0.53 *** | (0.37–0.76) | 0.70 ** | (0.08–0.82) |
| Sanitation facility | Un-Improved (R) | |||||
| Improved | 0.55 ** | (0.72–0.99) | 0.23 ** | (0.76–0.86) | 0.29 * | (0.35–0.43) |
| Diarrhea | No (R) | |||||
| Yes | 1.41 ** | (1.04–1.90) | 1.15 *** | (1.28–1.62) | 1.94 * | (1.49–1.59) |
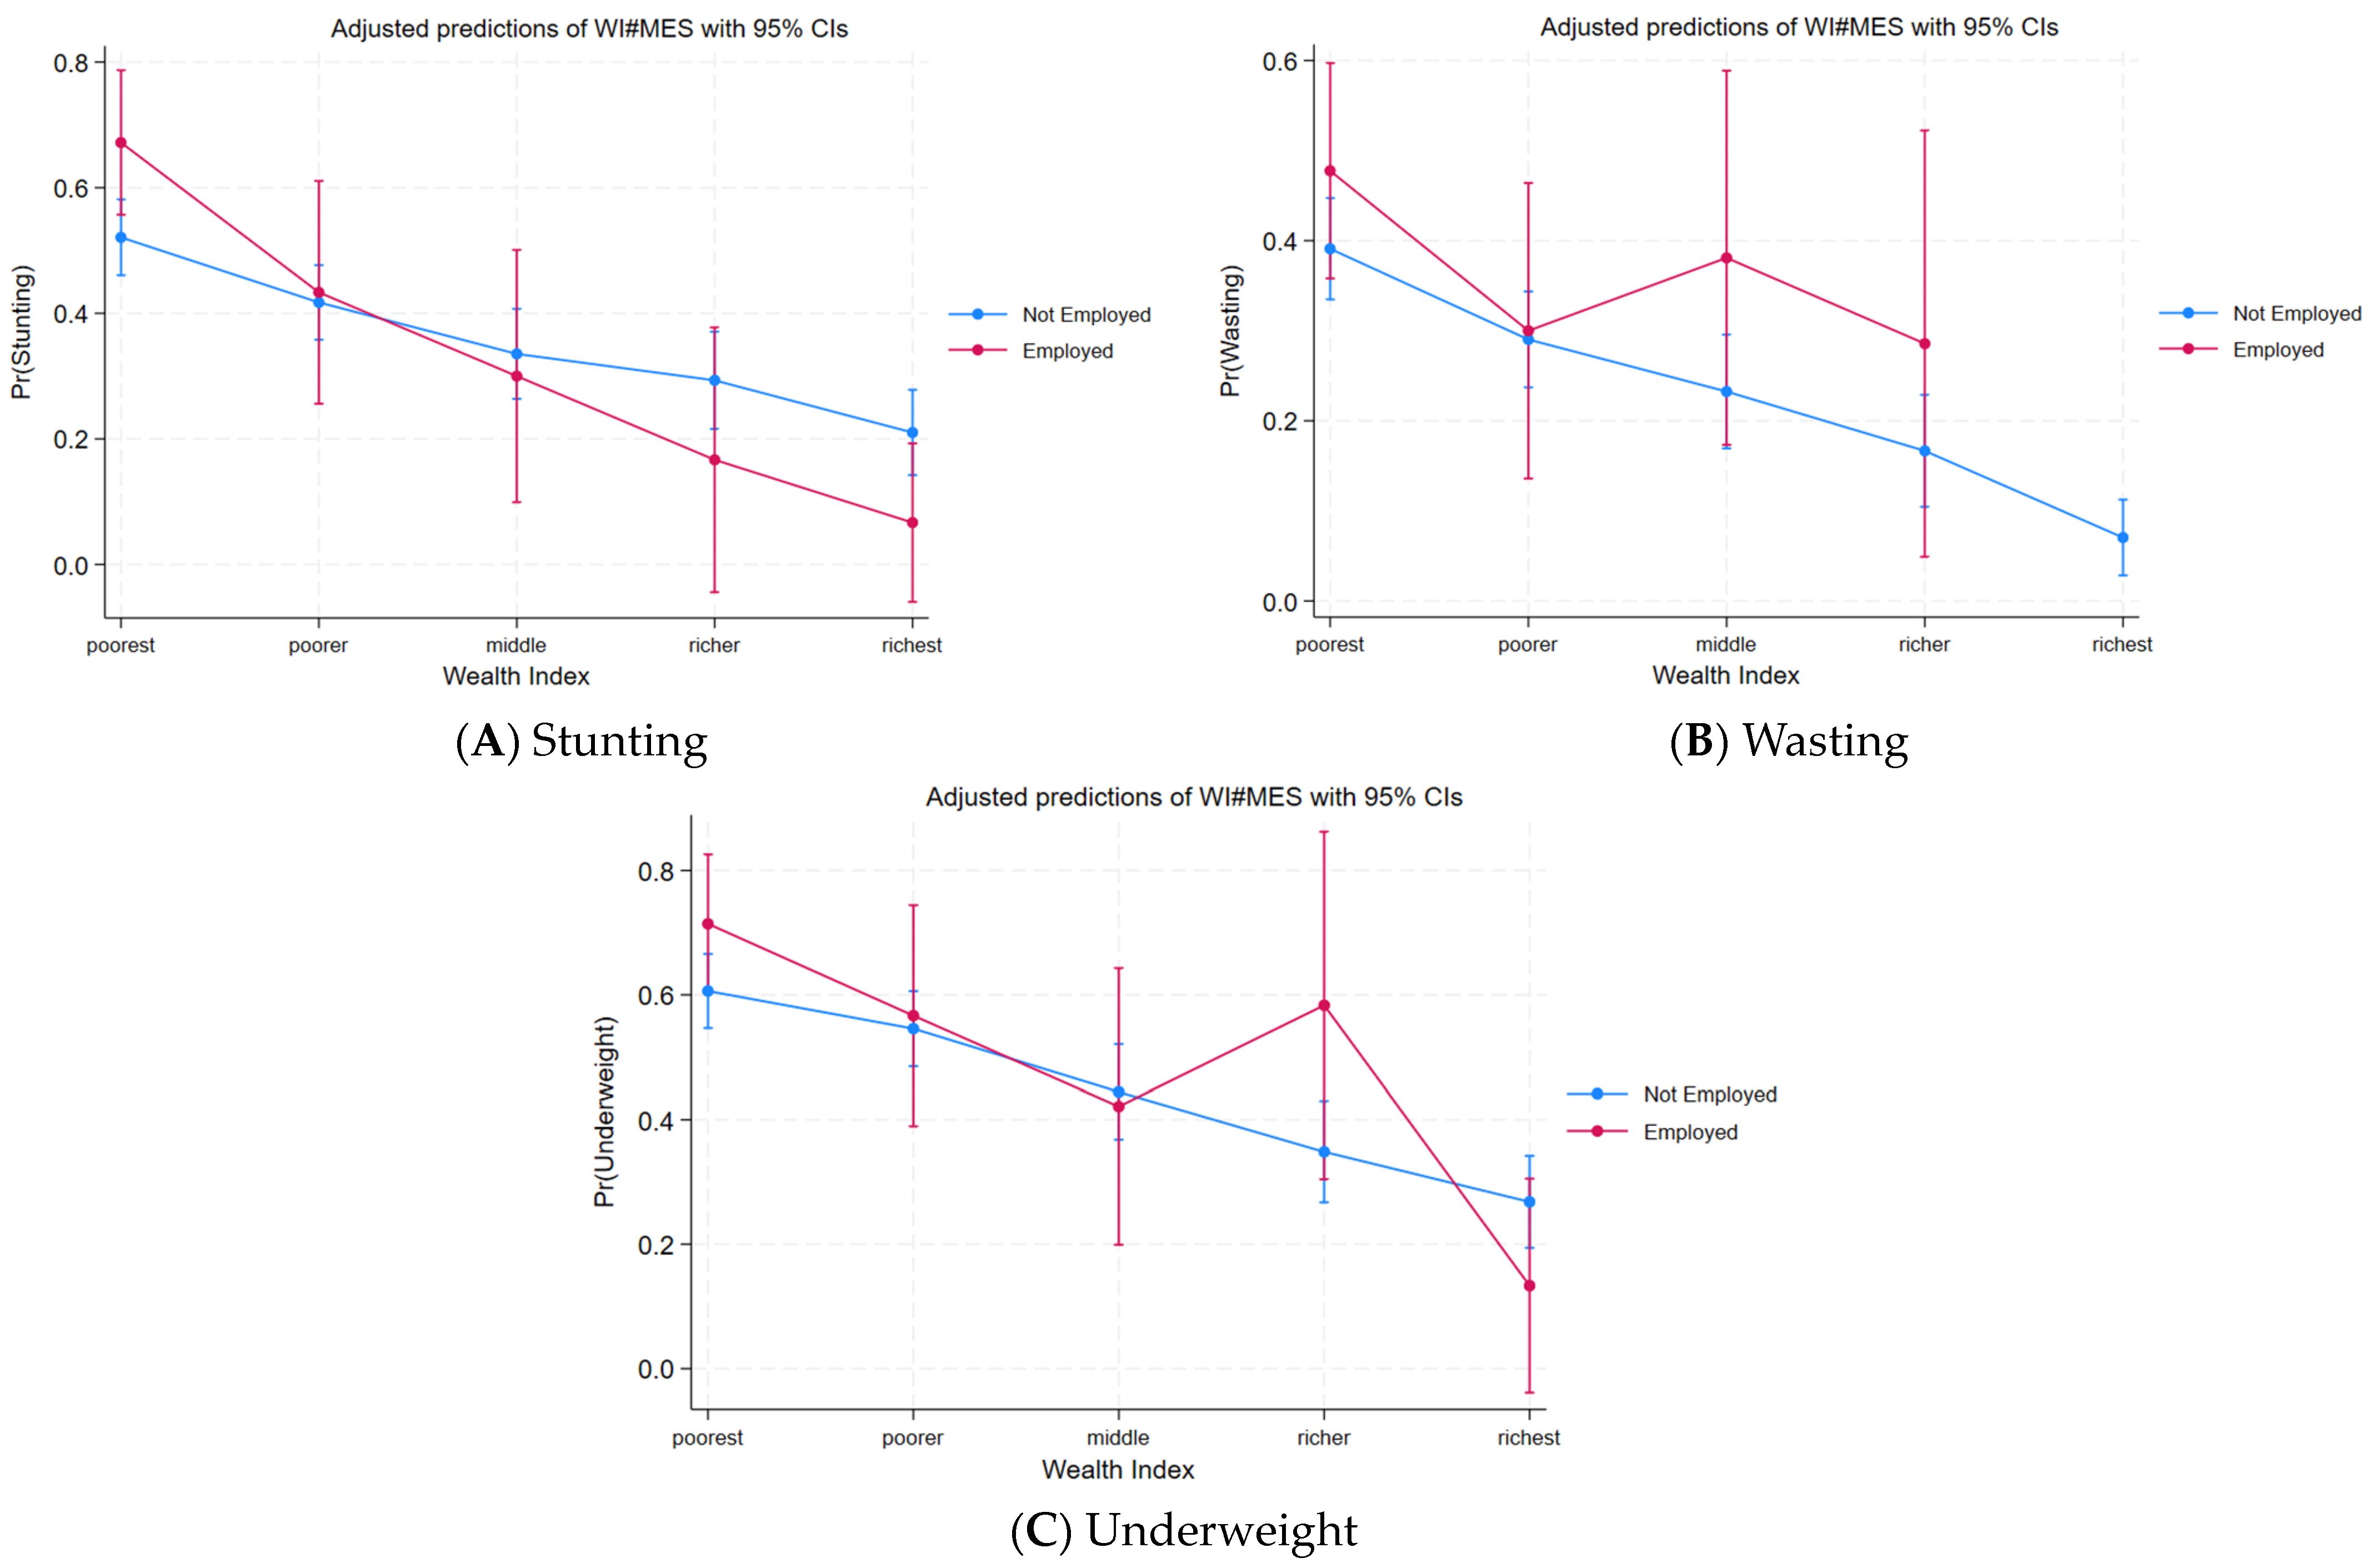
| Wealth Index * Mother Employment | Poorest # Not-Employed (R) | |||||
| Poorest # Employed | 1.67 | (0.89–3.09) | 1.55 | (0.53–4.62) | 0.45 | (0.17–1.16) |
| Poorer # Not-Employed | 0.82 | (0.56–1.17) | 0.78 | (0.51–1.18) | 1.28 | (0.74–2.23) |
| Poorer # Employed | 0.94 | (0.41–2.12) | 0.73 | (0.52–1.84) | 1.15 | (0.38–3.49) |
| Middle # Not-Employed | 0.59 | (1.38–0.93) | 0.63 | (0.29–1.08) | 0.84 | (0.64–1.73) |
| Middle # Employed | 0.59 ** | (0.22–0.64) | 0.91 * | (0.37- 0.48) | 0.73 *** | (0.40- 0.75) |
| Richer # Not-Employed | 0.41 *** | (0.25–0.69) | 0.49 ** | (0.25–0.94) | 0.86 | (0.37–0.45) |
| Richer # Employed | 0.46 * | (0.40–0.32) | 0.83 * | (0.20–0.36) | 0.61 ** | (0.33–0.57) |
| Richest # Not-Employed | 0.35 ** | (0.19–0.62) | 0.25 ** | (0.10–0.58) | 0.57 * | (0.20–0.58) |
| Richest # Employed | 0.17 *** | (0.03–0.87) | 0.21 ** | (0.05–0.21) | 0.67 ** | (0.06–0.86) |
| Number of observations = 1093 | ||||||
| Classification | Indication | Percentage | ||
|---|---|---|---|---|
| Stunting | Underweight | Wasting | ||
| Sensitivity | Pr(+|D) | 51.50% | 28.48% | 3.03% |
| Specificity | Pr(−|~D) | 81.14% | 92.87% | 99.69% |
| Positive predictive value | Pr(D|+) | 63.90% | 60.40% | 57.14% |
| Negative predictive value | Pr(~D|−) | 72.07% | 77.26% | 88.22% |
| False + rate for true ~D | Pr(+|~D) | 18.86% | 7.13% | 0.31% |
| False − rate for true D | Pr(−|D) | 48.50% | 71.52% | 96.97% |
| False + rate for classified + | Pr(~D|+) | 36.10% | 39.60% | 42.86% |
| False − rate for classified − | Pr(D|−) | 27.93% | 22.74% | 11.78% |
| Correctly classified | 69.48% | 75.07% | 88.03% | |
Disclaimer/Publisher’s Note: The statements, opinions and data contained in all publications are solely those of the individual author(s) and contributor(s) and not of MDPI and/or the editor(s). MDPI and/or the editor(s) disclaim responsibility for any injury to people or property resulting from any ideas, methods, instructions or products referred to in the content. |
© 2024 by the authors. Licensee MDPI, Basel, Switzerland. This article is an open access article distributed under the terms and conditions of the Creative Commons Attribution (CC BY) license (https://creativecommons.org/licenses/by/4.0/).
Share and Cite
Shahid, M.; Xie, Y.; Bashir, S.; Noureen, N.; Song, J.; Malik, N.I.; Tang, K. Association among Household Wealth, Maternal Employment, and Undernutrition in Children under Three Years of Age in Pakistan. Children 2024, 11, 872. https://doi.org/10.3390/children11070872
Shahid M, Xie Y, Bashir S, Noureen N, Song J, Malik NI, Tang K. Association among Household Wealth, Maternal Employment, and Undernutrition in Children under Three Years of Age in Pakistan. Children. 2024; 11(7):872. https://doi.org/10.3390/children11070872
Chicago/Turabian StyleShahid, Muhammad, Yuantao Xie, Shamshad Bashir, Nazia Noureen, Jiayi Song, Najma Iqbal Malik, and Kun Tang. 2024. "Association among Household Wealth, Maternal Employment, and Undernutrition in Children under Three Years of Age in Pakistan" Children 11, no. 7: 872. https://doi.org/10.3390/children11070872