
Cardiorespiratory Fitness Is an Indicator of Arterial Stiffness and Aortic Blood Pressure in Healthy Adolescents

 ,
,  ,
,
Abstract
1. Introduction
2. Materials and Methods
2.1. Participants
2.2. Anthropometrics and Body Composition
2.3. Cardiovascular Measurement
2.4. Cardiorespiratory Fitness Test
2.5. Aerobic and Anaerobic Thresholds
2.6. Statistical Analysis
3. Results
4. Discussion
5. Conclusions
Supplementary Materials
Author Contributions
Funding
Institutional Review Board Statement
Informed Consent Statement
Data Availability Statement
Acknowledgments
Conflicts of Interest
References
- Iannuzzi, A.; Licenziati, M.R.; Acampora, C.; Salvatore, V.; Auriemma, L.; Romano, M.L.; Panico, S.; Rubba, P.; Trevisan, M. Increased carotid intima-media thickness and stiffness in obese children. Diabetes Care 2004, 27, 2506–2508. [Google Scholar] [CrossRef]
- Litwin, M.; Feber, J.; Ruzicka, M. Vascular Aging: Lessons From Pediatric Hypertension. Can. J. Cardiol. 2016, 32, 642–649. [Google Scholar] [CrossRef] [PubMed]
- Berenson, G.S. Childhood risk factors predict adult risk associated with subclinical cardiovascular disease: The Bogalusa Heart Study. Am. J. Cardiol. 2002, 90, L3–L7. [Google Scholar] [CrossRef] [PubMed]
- Biro, F.M.; Wien, M. Childhood obesity and adult morbidities. Am. J. Clin. Nutr. 2010, 91, 1499S–1505S. [Google Scholar] [CrossRef] [PubMed]
- Dangardt, F.; Charakida, M.; Georgiopoulos, G.; Chiesa, S.T.; Rapala, A.; Wade, K.H.; Hughes, A.D.; Timpson, N.J.; Pateras, K.; Finer, N.; et al. Association between fat mass through adolescence and arterial stiffness: A population-based study from The Avon Longitudinal Study of Parents and Children. Lancet Child. Adolesc. Health 2019, 3, 474–481. [Google Scholar] [CrossRef]
- Calcaterra, V.; Vandoni, M.; Rossi, V.; Berardo, C.; Grazi, R.; Cordaro, E.; VTranfaglia Pellino, V.C.; Cereda, C.; Zuccotti, G. Use of physical activity and exercise to reduce inflammation in children and adolescents with obesity. Int. J. Environ. Res. Public Health 2022, 19, 6908. [Google Scholar] [CrossRef]
- Libby, P. Inflammation and cardiovascular disease mechanisms. Am. J. Clin. Nutr. 2006, 83, 456S–460S. [Google Scholar] [CrossRef]
- Ruiz, J.R.; Ortega, F.B.; Warnberg, J.; Sjöström, M. Associations of low-grade inflammation with physical activity, fitness and fatness in prepubertal children; the European Youth Heart Study. Int. J. Obes. 2007, 31, 1545–1551. [Google Scholar] [CrossRef]
- Roman, M.J.; Devereux, R.B.; Kizer, J.R.; Lee, E.T.; Galloway, J.M.; Ali, T.; Umans, J.G.; Howard, B.V. Central pressure more strongly relates to vascular disease and outcome than does brachial pressure: The Strong Heart Study. Hypertension 2007, 50, 197–203. [Google Scholar] [CrossRef]
- Kis, E.; Cseprekal, O.; Kerti, A.; Salvi, P.; Benetos, A.; Tisler, A.; Szabó, A.; Tulassay, T.; Reusz, G.S. Measurement of pulse wave velocity in children and young adults: A comparative study using three different devices. Hypertens. Res. 2011, 34, 1197–1202. [Google Scholar] [CrossRef]
- Laurent, S.; Boutouyrie, P.; Cunha, P.G.; Lacolley, P.; Nilsson, P.M. Concept of Extremes in Vascular Aging. Hypertension 2019, 74, 218–228. [Google Scholar] [CrossRef]
- Bongers, B.C.; Hulzebos, E.H.; Helbing, W.A.; Ten Harkel, A.; van Brussel, M.; Takken, T. Response profiles of oxygen uptake efficiency during exercise in healthy children. Eur. J. Prev. Cardiol. 2016, 23, 865–873. [Google Scholar] [CrossRef] [PubMed]
- Poole, D.C.; Rossiter, H.B.; Brooks, G.A.; Gladden, L.B. The anaerobic threshold: 50+ years of controversy. J. Physiol. 2021, 599, 737–767. [Google Scholar] [CrossRef]
- Haapala, E.A.; Laukkanen, J.A.; Takken, T.; Kujala, U.M.; Finni, T. Peak oxygen uptake, ventilatory threshold, and arterial stiffness in adolescents. Eur. J. Appl. Physiol. 2018, 118, 2367–2376. [Google Scholar] [CrossRef] [PubMed]
- Ruiz, J.R.; Cavero-Redondo, I.; Ortega, F.B.; Welk, G.J.; Andersen, L.B.; Martinez-Vizcaino, V. Cardiorespiratory fitness cut points to avoid cardiovascular disease risk in children and adolescents; what level of fitness should raise a red flag? A systematic review and meta-analysis. Br. J. Sports Med. 2016, 50, 1451–1458. [Google Scholar] [CrossRef] [PubMed]
- Ortega, F.B.; Lavie, C.J.; Blair, S.N. Obesity and Cardiovascular Disease. Circ. Res. 2016, 118, 1752–1770. [Google Scholar] [CrossRef] [PubMed]
- Fields, D.A.; Goran, M.I.; McCrory, M.A. Body-composition assessment via air-displacement plethysmography in adults and children: A review. Am. J. Clin. Nutr. 2002, 75, 453–467. [Google Scholar] [CrossRef]
- Tseh, W.; Caputo, J.L.; Keefer, D.J. Validity and Reliability of the BOD POD® S/T Tracking System. Int. J. Sports Med. 2010, 31, 704–708. [Google Scholar] [CrossRef]
- Pickering, T.G.; Hall, J.E.; Appel, L.J.; Falkner, B.E.; Graves, J.; Hill, M.N.; Jones, D.W.; Kurtz, T.; Sheps, S.G.; Roccella, E.J. Recommendations for blood pressure measurement in humans and experimental animals: Part 1: Blood pressure measurement in humans: A statement for professionals from the Subcommittee of Professional and Public Education of the American Heart Association Council on High Blood Pressure Research. Circulation 2005, 111, 697–716. [Google Scholar]
- Butlin, M.; Qasem, A. Large Artery Stiffness Assessment Using SphygmoCor Technology. Pulse 2017, 4, 180–192. [Google Scholar] [CrossRef]
- Guidetti, L.; Meucci, M.; Bolletta, F.; Emerenziani, G.P.; Gallotta, M.C.; Baldari, C. Validity, reliability and minimum detectable change of COSMED K5 portable gas exchange system in breath-by-breath mode. PLoS ONE 2018, 13, e0209925. [Google Scholar] [CrossRef] [PubMed]
- Meyer, T.; Lucía, A.; Earnest, C.P.; Kindermann, W. A conceptual framework for performance diagnosis and training prescription from submaximal gas exchange parameters—Theory and application. Int. J. Sports Med. 2005, 26, S38–S48. [Google Scholar] [CrossRef]
- Klasson-Heggebo, L.; Andersen, L.B.; Wennlof, A.H.; Sardinha, L.B.; Harro, M.; Froberg, K.; Anderssen, S.A. Graded associations between cardiorespiratory fitness, fatness, and blood pressure in children and adolescents. Br. J. Sports Med. 2006, 40, 25–29. [Google Scholar] [CrossRef]
- Stabouli, S.; Kollios, K.; Nika, T.; Chrysaidou, K.; Tramma, D.; Kotsis, V. Ambulatory hemodynamic patterns, obesity, and pulse wave velocity in children and adolescents. Pediatr. Nephrol. 2020, 35, 2335–2344. [Google Scholar] [CrossRef]
- Rodrigues, S.L.; Baldo, M.P.; Lani, L.; Nogueira, L.; Mill, J.G.; Sa Cunha, R. Body mass index is not independently associated with increased aortic stiffness in a Brazilian population. Am. J. Hypertens. 2012, 25, 1064–1069. [Google Scholar] [CrossRef] [PubMed]
- Aggoun, Y.; Farpour-Lambert, N.J.; Marchand, L.M.; Golay, E.; Maggio, A.B.; Beghetti, M. Impaired endothelial and smooth muscle functions and arterial stiffness appear before puberty in obese children and are associated with elevated ambulatory blood pressure. Eur. Heart J. 2008, 29, 792–799. [Google Scholar] [CrossRef] [PubMed]
- Beauloye, V.; Zech, F.; Tran, H.T.; Clapuyt, P.; Maes, M.; Brichard, S.M. Determinants of early atherosclerosis in obese children and adolescents. J. Clin. Endocrinol. Metab. 2007, 92, 3025–3032. [Google Scholar] [CrossRef]
- Chudek, J.; Wiecek, A. Adipose tissue, inflammation and endothelial dysfunction. Pharmacol. Rep. 2006, 58 (Suppl.), 81–88. [Google Scholar]
- Roth, C.L.; Kratz, M.; Ralston, M.M.; Reinehr, T. Changes in adipose-derived inflammatory cytokines and chemokines after successful lifestyle intervention in obese children. Metabolism 2011, 60, 445–452. [Google Scholar] [CrossRef] [PubMed]
- Sakuragi, S.; Abhayaratna, K.; Gravenmaker, K.J.; O’Reilly, C.; Srikusalanukul, W.; Budge, M.M.; Telford, R.D.; Abhayaratna, W.P. Influence of adiposity and physical activity on arterial stiffness in healthy children: The lifestyle of our kids study. Hypertension 2009, 53, 611–616. [Google Scholar] [CrossRef]
- Königstein, K.; Infanger, D.; Klenk, C.; Hinrichs, T.; Rossmeissl, A.; Baumann, S.; Hafner, B.; Hanssen, H.; Schmidt-Trucksäss, A. Does obesity attenuate the beneficial cardiovascular effects of cardiorespiratory fitness? Atherosclerosis 2018, 272, 21–26. [Google Scholar] [CrossRef] [PubMed]
- Lona, G.; Hauser, C.; Köchli, S.; Infanger, D.; Endes, K.; Schmidt-Trucksäss, A.; Hanssen, H. Association of blood pressure, obesity and physical activity with arterial stiffness in children: A systematic review and meta-analysis. Pediatr. Res. 2022, 91, 502–512. [Google Scholar] [CrossRef] [PubMed]
- Müller, J.; Meyer, J.; Elmenhorst, J.; Oberhoffer, R. Body Weight and Not Exercise Capacity Determines Central Systolic Blood Pressure, a Surrogate for Arterial Stiffness, in Children and Adolescents. J. Clin. Hypertens. 2016, 18, 762–765. [Google Scholar] [CrossRef] [PubMed]
- Hurtig-Wennlof, A.; Ruiz, J.R.; Harro, M.; Sjostrom, M. Cardiorespiratory fitness relates more strongly than physical activity to cardiovascular disease risk factors in healthy children and adolescents: The European Youth Heart Study. Eur. J. Cardiovasc. Prev. Rehabil. 2007, 14, 575–581. [Google Scholar] [CrossRef]
- Armstrong, N.; Welsman, J.; Winsley, R. Is peak VO2 a maximal index of children’s aerobic fitness? Int. J. Sports Med. 1996, 17, 356–359. [Google Scholar] [CrossRef]
- Kaczor, J.J.; Ziolkowski, W.; Popinigis, J.; Tarnopolsky, M.A. Anaerobic and aerobic enzyme activities in human skeletal muscle from children and adults. Pediatr. Res. 2005, 57, 331–335. [Google Scholar] [CrossRef]
- Wirth, A.; TrÄger, E.; Scheele, K.; Mayer, D.; Diehm, K.; Reischle, K.; Weicker, H. Cardiopulmonary adjustment and metabolic response to maximal and submaximal physical exercise of boys and girls at different stages of maturity. Eur. J. Appl. Physiol. Occup. Physiol. 1978, 39, 229–240. [Google Scholar] [CrossRef]
- Reybrouck, T.; Weymans, M.; Stijns, H.; Knops, J.; van der Hauwaert, L. Ventilatory anaerobic threshold in healthy children. Eur. J. Appl. Physiol. 1985, 54, 278–284. [Google Scholar] [CrossRef]
- Liu, J.; Zhu, L.; Su, Y. Comparative Effectiveness of High-Intensity Interval Training and Moderate-Intensity Continuous Training for Cardiometabolic Risk Factors and Cardiorespiratory Fitness in Childhood Obesity: A Meta-Analysis of Randomized Controlled Trials. Front. Physiol. 2020, 11, 214. [Google Scholar] [CrossRef]
- Armstrong, N.; Tomkinson, G.; Ekelund, U. Aerobic fitness and its relationship to sport, exercise training and habitual physical activity during youth. Br. J. Sports Med. 2011, 45, 849–858. [Google Scholar] [CrossRef]
- Meucci, M.; Curry, C.D.; Baldari, C.; Guidetti, L.; Cook, C.; Collier, S.R. Effect of play-based summer break exercise on cardiovascular function in adolescents. Acta Paediatr. 2013, 102, e24–e28. [Google Scholar] [CrossRef] [PubMed]
- Green, S.; Askew, C. V̇o(2peak) is an acceptable estimate of cardiorespiratory fitness but not V̇o(2max). J. Appl. Physiol. (1985) 2018, 125, 229–232. [Google Scholar] [CrossRef] [PubMed]
- Kaufman, C.; Kelly, A.S.; Kaiser, D.R.; Steinberger, J.; Dengel, D.R. Aerobic-exercise training improves ventilatory efficiency in overweight children. Pediatr. Exerc. Sci. 2007, 19, 82–92. [Google Scholar] [CrossRef] [PubMed]
- Cao, M.; Quan, M.; Zhuang, J. Effect of High-Intensity Interval Training versus Moderate-Intensity Continuous Training on Cardiorespiratory Fitness in Children and Adolescents: A Meta-Analysis. Int. J. Environ. Res. Public Health 2019, 16, 1533. [Google Scholar] [CrossRef] [PubMed]
- Flynn, J.T. What Level of Blood Pressure Is Concerning in Childhood? Circ. Res. 2022, 130, 800–808. [Google Scholar] [CrossRef] [PubMed]

| Characteristics | All (n = 60) | Males (n = 30) | Females (n = 30) |
|---|---|---|---|
| Age (years) | 14.9 ± 2.1 | 14.8 ± 2.2 | 15.0 ± 2.1 |
| Height (cm) | 165.5 ± 11.3 | 170.4 ± 12.0 | 160 ± 8.1 ** |
| Body mass (BM; kg) | 62.2 ± 19.8 | 69.1 ± 24.0 | 55.2 ± 10.9 ** |
| BMI (kg/m2) | 22.4 ± 5.4 | 23.5 ± 6.7 | 21.2 ± 3.6 |
| FM% (%) | 24.6 ± 11.4 | 22.5 ± 13.6 | 26.7 ± 8.4 |
| FFM% (%) | 75.4 ± 11.4 | 77.5 ± 13.6 | 73.3 ± 8.4 ** |
| cfPWV (m/s) | 4.9 ± 0.7 | 4.9 ± 0.7 | 4.8 ± 0.6 |
| ASBP (mmHg) | 97.2 ± 9.4 | 100 ± 10 | 94.2 ± 7.7 ** |
| ADBP (mmHg) | 64.6 ± 8.2 | 65 ± 9 | 64.4 ± 7.3 |
| VO2AerT (ml/kg/min) | 17.2 ± 4.4 | 17.1 ± 3.9 | 17.3 ± 4.9 |
| HRAerT (bpm) | 122 ± 16 | 116 ± 11 | 129 ± 18 ** |
| VO2AnT (ml/kg/min) | 26.4 ± 6.5 | 27.0 ± 6.8 | 25.8 ± 6.1 |
| HRAnT (bpm) | 158 ± 17 | 152 ± 17 | 163 ± 16 ** |
| VO2peak (ml/kg/min) | 33.6 ± 7.9 | 35.8 ± 8.7 | 31.4 ± 6.5 * |
| HRpeak (bpm) | 187 ± 12 | 188 ± 13 | 186 ± 12 |
| Test duration (min) | 11.5 ± 3.0 | 13.1 ± 3.0 | 9.9 ± 2.1 ** |
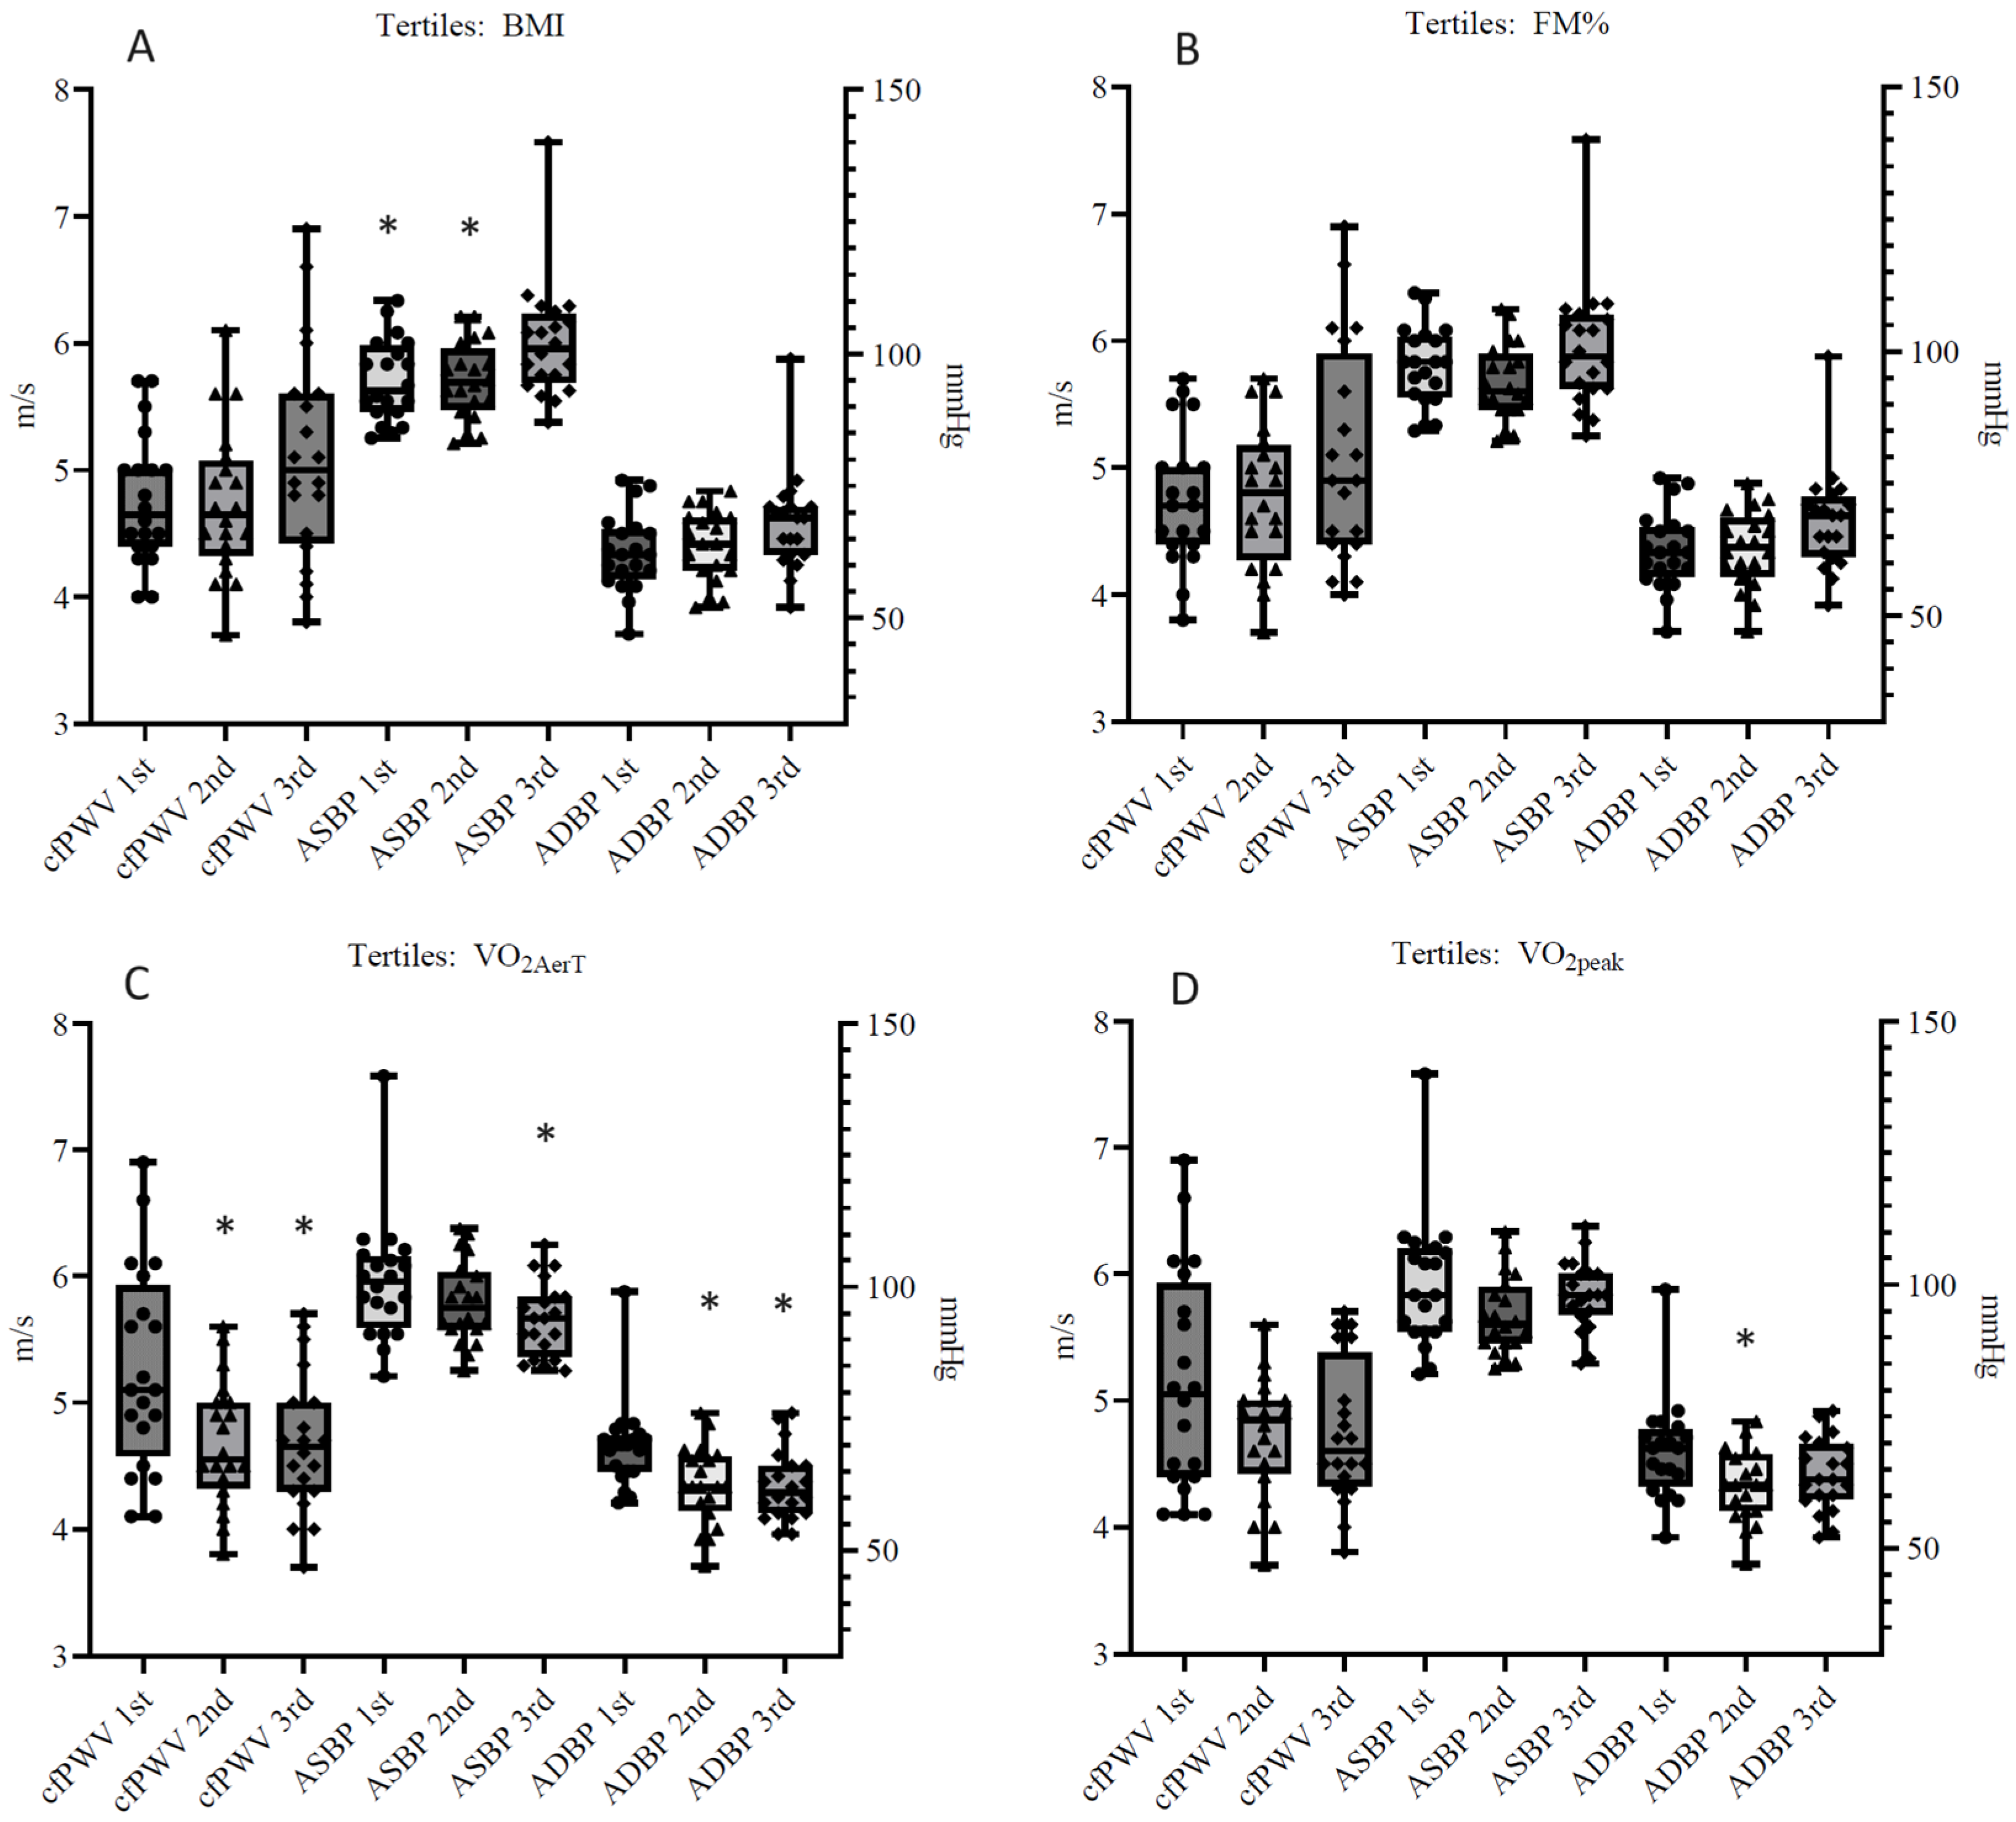
| First (n = 20) | Second (n = 20) | Third (n = 20) | |
|---|---|---|---|
| cfPWV (m/s) | 5.3 ± 0.8 | 4.7 ± 0.5 * | 4.7 ± 0.5 * |
| ASBP (mmHg) | 101 ± 12 | 97 ± 8 | 94 ± 7 * |
| ADBP (mmHg) | 70 ± 8 | 62 ± 7 * | 62 ± 7 * |
| First (n = 20) | Second (n = 20) | Third (n = 20) | |
|---|---|---|---|
| cfPWV (m/s) | 5.1 ± 0.9 | 4.7 ± 0.5 | 4.8 ± 0.6 |
| ASBP (mmHg) | 100 ± 13 | 94 ± 7 | 98 ± 7 |
| ADBP (mmHg) | 68 ± 9 | 62 ± 7 * | 64 ± 7 |
| First (n = 20) | Second (n = 20) | Third (n = 20) | |
|---|---|---|---|
| cfPWV (m/s) | 4.7 ± 0.5 | 4.8 ± 0.6 | 5.1 ± 0.9 |
| ASBP (mmHg) | 95 ± 8 * | 95 ± 7 * | 102 ± 11 |
| ADBP (mmHg) | 62 ± 7 | 64 ± 7 | 68 ± 10 |
| First (n = 20) | Second (n = 20) | Third (n = 20) | |
|---|---|---|---|
| cfPWV (m/s) | 4.8 ± 0.5 | 4.8 ± 0.6 | 5.1 ± 0.9 |
| ASBP (mmHg) | 97 ± 7 | 94 ± 7 | 101 ± 12 |
| ADBP (mmHg) | 63 ± 7 | 63 ± 7 | 68 ± 10 |
| Variables | Covariates | B | Adjusted R2 | t | p | 95% CI |
|---|---|---|---|---|---|---|
| FM% | Age, sex | −0.224 | 0.050 | −1.029 | 0.309 | −0.039 to 0.013 |
| BMI | Age, sex | 0.448 | 0.200 | 1.775 | 0.082 | −0.007 to 0.119 |
| VO2peak | Age, sex | −0.305 | 0.093 | −1.451 | 0.153 | −0.001 to 0.001 |
| VO2aerT | Age, sex | 0.014 | 0.000 | 0.092 | 0.927 | −0.001 to 0.000 |
Disclaimer/Publisher’s Note: The statements, opinions and data contained in all publications are solely those of the individual author(s) and contributor(s) and not of MDPI and/or the editor(s). MDPI and/or the editor(s) disclaim responsibility for any injury to people or property resulting from any ideas, methods, instructions or products referred to in the content. |
© 2024 by the authors. Licensee MDPI, Basel, Switzerland. This article is an open access article distributed under the terms and conditions of the Creative Commons Attribution (CC BY) license (https://creativecommons.org/licenses/by/4.0/).
Share and Cite
Kim, H.; Collier, S.R.; Bonavolontà, V.; Lassiter, A.; Wait, S.; Meucci, M. Cardiorespiratory Fitness Is an Indicator of Arterial Stiffness and Aortic Blood Pressure in Healthy Adolescents. Children 2024, 11, 1078. https://doi.org/10.3390/children11091078
Kim H, Collier SR, Bonavolontà V, Lassiter A, Wait S, Meucci M. Cardiorespiratory Fitness Is an Indicator of Arterial Stiffness and Aortic Blood Pressure in Healthy Adolescents. Children. 2024; 11(9):1078. https://doi.org/10.3390/children11091078
Chicago/Turabian StyleKim, Hwan, Scott R. Collier, Valerio Bonavolontà, Austin Lassiter, Seaver Wait, and Marco Meucci. 2024. "Cardiorespiratory Fitness Is an Indicator of Arterial Stiffness and Aortic Blood Pressure in Healthy Adolescents" Children 11, no. 9: 1078. https://doi.org/10.3390/children11091078
APA StyleKim, H., Collier, S. R., Bonavolontà, V., Lassiter, A., Wait, S., & Meucci, M. (2024). Cardiorespiratory Fitness Is an Indicator of Arterial Stiffness and Aortic Blood Pressure in Healthy Adolescents. Children, 11(9), 1078. https://doi.org/10.3390/children11091078