Abstract
Some studies have been conducted in order to assess the association between weight status (assessed by body mass index) and socio-demographic factors. Nevertheless, only a few of them have indicated these associations by other anthropometric parameters (e.g., skinfolds). The aim of this study was to determine, compare, and examine the influence of age, sex, type of the schooling, per capita income, area of residence, and immigrant status on obesity parameters in schoolchildren aged 6–13 from the Region of Murcia. A cross-sectional study was carried out in six different Primary schools of the Region of Murcia (Spain). A total sample of 370 children (166 girls) aged 6–13 (8.7 ± 1.8) were selected. In order to determine participants’ body composition, body mass index, waist circumference, waist-to-height ratio, and skinfold measurements were calculated. Higher associations of excess of weight (OR = 1.96; 95%CI = 1.19–3.20) and abdominal obesity (OR = 3.12; 95CI% = 1.49–6.94) were shown in the case of children from public schools. A greater association of high trunk fat mass was found in children from municipalities with high per capita income (OR = 3.20; 95%CI = 1.05–9.77). Therefore, lower association of having an inadequate %BF was found in the participants aged 6–9 (OR = 0.38; 95%CI = 0.24–0.54), and immigrant students (OR = 2.63; 95%CI = 1.69–4.10). Our study suggested that overweight/obesity among schoolchildren in the Region of Murcia is higher than the overall prevalence of Spain. The results of the adjusted analyses showed that age, type of schooling, per capita income, and immigrant status were associated with obesity parameters.
1. Introduction
Globally, overweight and obesity have reached worryingly high levels [1], especially in Europe, where this situation represents a major public health threat [2]. Thus, the last World Health Organization (WHO) European Childhood Obesity Surveillance (COSI) study has ranked Spain with the highest obesity prevalence rate in Europe (17.7%) [2]. The risk of morbidity and mortality in adult life increases in those who are overweight or obese (understood as excess weight) in their childhood or adolescence [3], which also increases the likelihood of having worse risk parameters for cardiovascular disease [4]. This is why the WHO Member States have committed to ensuring that childhood obesity figures do not increase by 2025 [5].
Regarding obesity identification, body mass index (BMI) is the most applied anthropometric parameter in children; existing several reference cut-off points, both internationally [6,7,8] and nationally [9]. However, even though BMI can be an assessment tool to help detect overweight or obese children, it has been advised that it does not identify the majority of children who will develop morbidities related to obesity in adult life [10]. Also, there is a great variability in the association of BMI and fat mass, which could be due to physiological changes, the level of pubertal maturation, and the sex of the children [11]. In the same way, during the process of growth and development, several changes occur in body composition, mainly in the storage and distribution of fat, muscle, and bone mass according to age and sex [12]. Thus, a recent systematic review performed by Orsso et al. [13] has suggested that skinfold measurements are one of the possible reliable methodologies for determining body composition in paediatric obesity. At the same time, Schröder et al. [14] found a large proportion of normal-weight Spanish children who present abdominal obesity. For these reasons, evaluation accompanied by other body composition variables is highly recommended, such as waist-to-height ratio (WHtR), waist circumference (WC), or skinfolds in order to effectively determine the risk in participants [15].
Following this line, some studies have been conducted in order to assess the association between weight status (assessed by BMI) and socio-demographic factors, such as sex [16], type of schooling [17], area of residence [18], immigrant status [19], or per capita income [20]. For example, children from public schools have been associated with a higher prevalence of overweight or obesity [17], as well as children belonging to an immigrant family [21]. Equally, the prevalence of obesity is significantly higher in school children from families with lower incomes compared to those with higher ones in Spain [22], being so in the case of children from rural areas [23]. Hence, some of these studies have shown certain degree of association between these variables. Notwithstanding, only a few of them have indicated these associations by other anthropometric parameters (e.g., skinfolds) [24], and there is a gap of knowledge in this sense.
In addition to this, children and adolescents who have obesity are about five times as likely to be obese in adulthood than their counterparts who do not present obesity [25]. Thus, because of the long-term implications of childhood obesity and the influence on their health in adulthood, studies to clarify the relationship between sociodemographic characteristics and the risk of overweight and obesity merits further consideration [26]. As a result, identifying those children at high risk of being obese in adulthood and its related factors could be a useful matter; particularly in the Region of Murcia, where the greatest figures of excess weight children has been pointed out [27].
According to the worrying situation of childhood obesity in Spain, particularly in the Region of Murcia, as well as the lack of information about those sociodemographic factors that could be related to childhood obesity, the aim of this research was to determine, compare and examine the influence of age, sex, type of the schooling, area of residence, immigrant status, and per capita income on obesity parameters in schoolchildren aged 6–13 from the Region of Murcia.
2. Materials and Methods
2.1. Sample
This study had a cross-sectional design. All nine primary schools from the Valley of Ricote (Region of Murcia, Spain) were invited to take part, with six schools agreeing to participate. Out of 972 possible participants, a total of 370 schoolchildren (166 girls and 204 boys) with ages between 6–13 years old (8.7 ± 1.8) participated, representing a response rate of 38.1%. For this study we used the non-probability sampling technique. In spite of this, all schoolchildren were likewise offered to join.
All the children involved in the study had to provide a signed consent form by their parents/legal guardians. Before the performance of the study, both parents and children were informed about the purpose of the research and the type of tests that would be carried out. Data was obtained in the 2017/2018 academic year. All the measurements were performed during Physical Education classes. As an inclusion criterion, only schoolchildren aged 6–13 who had obtained positive informed consent from their parents or legal guardians were included.
Regarding the origin of the immigrant students (n = 71), 61.1% are of South American origin, 29.1% of Arab origin, 5.6% from other European countries, 2.8% born in Asia, and 1.4% of African origin.
The Bioethics Committee of the University of Murcia (ID 2218/2018) approved the present study. It has been executed respecting the human rights of the participants and following the Helsinki Declaration.
2.2. Data Collection
Sex and age were self-reported. The type of schooling was dichotomised into two categories: (1) public and (2) private with public funds. Area of residence was divided into (1) urban (>5000 inhabitants) and (2) rural (≤5000 inhabitants) [28]. Students who met at least one of the following conditions were considered to be immigrant: (a) born outside Spain, (b) immigrant parents, or (c) at least one of their parents comes from another country. The socio-economic characteristics were determined by the per capita income of the different municipalities. Thus, this variable was dichotomised into two groups: (1) high per capita income (€20,000 or more) and (2) low per capita income (under €20,000). A portable height rod with an accuracy of 0.1 cm (Leicester Tanita HR 001, Tokyo, Japan) was used so as to determine participants’ height. Their bodyweight was measured with an electronic scale with an accuracy of 0.1 kg (Tanita BC-545, Tokyo, Japan). BMI was calculated from the ratio between body weight (kg) and the height squared of the participants (m2). Besides, weight status was determined using the age-specific and sex-specific thresholds provided by the WHO [6]. WC was measured with a precision of 0.1 cm at the level of the intersection between the last rib and the border of the iliac crest, using a constant tension tape. Children were split by “no high trunk fat mass” and “high trunk fat mass” according to sex- and age-specific cut-off values [29]. Moreover, the WHtR was calculated in order to determine the prevalence of abdominal obesity and children were classified as “no abdominal obesity” and “abdominal obesity” [30]. Skinfold measurements (subscapular, iliac crest, biceps and triceps) were taken using pre-calibrated steel callipers with a precision of 0.2 mm (Holtain, Crosswell, Crymych, United Kingdom) and following the guidelines of the International Society for the Advancement of Kinanthropometry (ISAK) [31]. To calculate the body density, the log of the sum of skinfolds measurements was considered [32]. Siri formula was used in order to compute body fat from body density [33], and fat-free mass was then determined minus total body mass and body fat (BF) mass. Likewise, participants were divided into “adequate adiposity” and “high adiposity” [34].
All the measurements were performed by the same trained researcher. Two measurements were taken and, if existed discrepancies exceeding 0.1 centimetres (cm) between measurements the procedure, was performed again. The relative technical error of measurement (TEM) was obtained by performing a number of repeated measurements on the same participant, taking the differences and inserting them into a correct equation. For intra-observer TEM of the two measurements taken the following equation was applied: √ΣD/2N, where “D” is the difference between measurements and “N” is the number of participants measures. Also, the absolute TEM was multiplied by 100 and divided by the variable average value in order to provide the relative TEM (%TEM). The %TEM were 0.3%, 0.2%, 0.5%, and 2.3%, for weight, height, WC, and skinfolds, respectively.
2.3. Data Management and Statistical Analysis
For all continuous variables, data was shown as mean (M) and standard deviation (SD). Conversely, all categorical variables were expressed as number (n) and percentage (%). Likewise, the confidence intervals (95%) were calculated. To assess the differences between groups of age, sex, type of schooling (public/private), per capita income (high/low), area of residence (urban/rural), and immigrant status (native/immigrant), the Chi-squared test was used or, if expected values were lower than 5, Fisher’s Exact test was applied. Furthermore, binary logistic regression analyses were performed to determine the association between sociodemographic characteristics and the different obesity parameters. Finally, data analysis was performed using the software SPSS (IBM Corp, Armonk, NY, USA) for Windows (v.24.0). Statistical significance was maintained at p-value ≤ 0.050.
3. Results
Data of age and continuous variables of anthropometric characteristics are shown in Table 1, as well as, the prevalence according to different obesity parameters are presented in Table 2. According to BMI, the prevalence of excess weight was 52.4% (WHO criteria). Moreover, when WC was considered, the values ranged from 14.6% to 20.3%, for abdominal obesity and high trunk mass fat, respectively. Conversely, a 45.4% presented high adiposity based on %BF.

Table 1.
Characteristics of age and anthropometric parameters of the analysed sample (n = 370).
Table 2.
Prevalence of different obesity parameters in the analysed simple.
Figure 1 shows the differences between the prevalence of obesity parameters according to the sociodemographic factors analysed. In relation to sex, boys had higher excess weight (43.6%) than girls (42.2%), with no statistically significant differences found. This absence of statistically significant differences was also shown in the case of WC, WHtR and %BF. On the other hand, no statistically significant differences were obtained for BMI, WC, and WHtR with regard to age group; not being so in the case of %BF (p < 0.001). So, a greater number of children aged 10–13 with great levels of %BF (22.3% higher) was identified. Regarding the type of schooling, children from public school showed greater values in all variables of obesity. Likewise, statistically significant differences were shown in most of obesity parameters that were examined (except for %BF). Also, higher prevalence of excess weight, abdominal obesity, high trunk fat mass, and high adiposity was found in the case of high per capita income group (only statistically significant for BMI). Finally, according to the area of residence, children from urban areas showed greater association with having higher obesity parameter (except for WC) without showing statistically significant differences for any obesity parameter. Data on absolute and relative frequencies is available in Table S1.
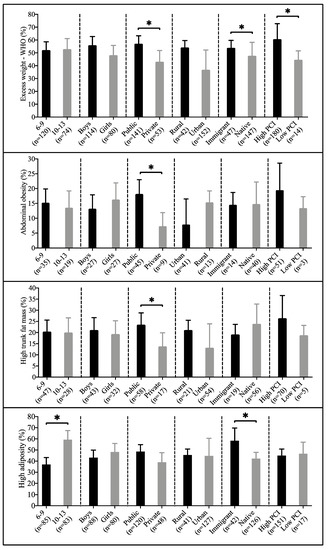
Figure 1.
Prevalence of having excess weight, abdominal obesity, high trunk fat mass, and high adiposity according to the different sociodemographic factors. Data presented as number (n) and percentage (%). PCI: per capita income. * p < 0.050.
Figure 2 indicates the association between different status in the anthropometric categorical variables of the study and the age group, sex, type of schooling, per capita income, area of residence and immigrant status. Therefore, no statistically significant association was shown in the case of BMI, WC, and WHtR according to age group and sex. Conversely, a higher association of excess weight was found in children from public schools, as well as of having abdominal obesity. Lower association of having an inadequate %BF were found in the participants aged 6–9 and in boys, in those from private schools, in the low per capita income group, in children from rural areas, and in native students (only statistical significance in the case of age group and immigration). Information on odds ratio and 95% confident intervals is presented in Table S2.
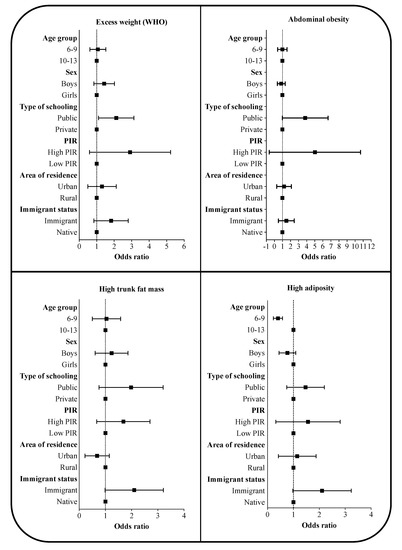
Figure 2.
Association of having excess weight, abdominal obesity, high trunk fat mass, and high adiposity according to the different sociodemographic factors. Data expressed as odds ratio (confident intervals 95%). BMI: body mass index; BF: body fat; PIR: per capita income; WHO: World Health Organization; WC: waist circumference; WHtR: waist-to-height ratio. Adjusted by age group, sex, type of schooling, PIR, area of residence, and immigrant status.
4. Discussion
The aim of the present study was to determine, compare, and examine the influence of age, sex, type of the schooling, per capita income, area of residence, and immigrant status on obesity parameters in schoolchildren aged 6–13 from the Region of Murcia. In this line, this study revealed that a great number of schoolchildren are overweight/obese in the analysed sample. Our results are higher than those reported by the last Estudio ALADINO [22], which reported a prevalence of excess weight of 41.3% for boys and 39.7% for girls, and by the Estudio PASOS [35], which reported an 34.9% of excess weight. According to the Estudio ALADINO (2019), the obesity trends seem to be stabilising in Spain. However, despite this apparent stabilisation, Spain has been pointed out as the European country with the highest prevalence rate of obesity in children (17.7%) in the latest data (2015–2017) from the Childhood Obesity Surveillance Initiative (COSI) led by the WHO [2]. One possible reason for this higher prevalence could be the fact that the municipality with greater per capita income of this study was slightly over 20,000€ and it has been recently shown that the prevalence of obesity is significantly greater in schoolchildren with family incomes below €18,000 per year [22]. Also, a further explanation could be that one out of three children is at risk of child poverty and social exclusion in the Region of Murcia [27], which could at least partially explain these superior figures. However, we must consider that, as reported in the scientific literature, the etiology of obesity is multifactorial [3], so other factors could influence this greater prevalence.
In addition, in relation to age, our adjusted model did not show statistical significance in order to have excess weight. Obesity prevalence rises as children grow older [36], and age is the single major predictor of obesity in children [37]. However, it was remarkable that we did not observe any association between obesity (assessed by BMI) and age in contrast to the findings of other authors who reported that obesity significantly increased with age [38,39]. This fact was not verified in the case of %BF, which indicated higher prevalence of older children (aged 10–13) with high adiposity. These differences among methods could be explained by the different procedures that they use to examine the obesity levels. For example, BMI is not able to differentiate the amount of fat mass and free-fat mass to body weight and could cause the wrong identification of obesity status when used in children [40]. At the same time, the so-called “adiposity rebound” phenomenon in the scientific literature, characterised by an increase in body fat at around the age of 8, continues until the end of the growth process [41].
Concerning sex, the categorisation of BMI reported very close prevalence of excess weight between boys and girls. Thus, we observed that being a girl or boy did not predict the likelihood of having excess weight/obesity, a finding that is consistent with some previous studies conducted [42,43]. However, contrary to our results, some other studies either reported differences in obesity prevalence between the sexes [17,21,44] or found girls to be at increased risk for childhood obesity [39]. In the case of %BF, we found a greater number of girls with higher adiposity than boys. Our results agree with other previous studies [45,46] and was able to verify the long differences well-known for %BF [47]. Nevertheless, we must consider that we used the Siri’s equation [33] that measures four skinfolds of upper body (biceps, triceps, subscapular, and suprailiac) without considering the lower body, which could modify this results. At the same time, another aspect that could have influenced this is the fact that the Siri’s equation [33] seems to overestimate the %BF between boys and girls, according to some studies [46,48].
Regarding the type of schooling, children from public school were more likely to have excess weight when compared to children of private schools. This fact matches with the findings of other studies which evaluated children and adolescent’s excess weight in different countries [49,50] and in Spain [17]. Therefore, it must be remarkable that public school children were more than three times likely to have abdominal obesity. These results seem to point out to the remarkable difference between public and private schools. This might be due to the fact that, in Spain, public schools are funded by the government, while private schools can charge considerably higher fees (tuition, uniform, or school materials). For this reason, only parents who can afford the fees would choose to enrol their children in private schools; the influence of socioeconomic factors in childhood obesity has already been indicated in Spain [22]. At the same time, families with low socioeconomic status may have less access or are not able to afford healthy foods and beverages compared to wealthier homes [51].
Conversely, a higher prevalence of excess weight, abdominal obesity, and especially of high trunk fat mass were shown in children from high per capita income. Our findings match with those reported by Arruda et al. [52], who reported a greater proportion of excess weight among children from families with more favourable living environments (e.g., greater per capita income). Similarly, Beal et al. [20] have recently found that higher per capita income was linked to a greater prevalence of childhood excess weight in Vietnam. Thus, income inequality could affect childhood obesity, through an increase in excessive food intake, as well as in a more sedentary lifestyle which could favour the development of overweight/obesity [1,53,54]. However, caution is needed when interpreting the results because of certain aspects. First, per capita income is referred to the municipality and not to the individual’s socioeconomic status. Second, these authors used different criteria to determine per capita income, as well as different cut-off points. Third, the per capita income indicator may vary depending on the analysed country and presents certain limitations to describe wealth inequalities (e.g., gross national income or Gini index) [53].
Concerning the area of residence, the evidence available on this relationship is inconclusive [26]. For example, Bel-Serrat et al. [26] indicated no association with obesity in a large and representative sample of Irish children aged 8–12. In a systematic review of Chinese studies, Guo et al. [18] showed that the prevalence of excess weight was greater in urban areas. Conversely, other studies have indicated that children living in cities with less density of population present higher rates of childhood obesity than children who reside in urban areas, both in North America [39] and Europe [54]. Moreover, one study carried out by Vaquero-Álvarez et al. [23] found a prevalence of 48.5% of excess weight in a sample of Spanish children from rural areas. One explanation could lie in the fact that, although it is thought that a rural life implies physically demanding activities, it is not always the case, and it could have an influence in the greater prevalence of obesity in rural areas [55]. Despite the above, we found higher obesity prevalence in children from urban areas. This fact could be explained (at least in part) because the analysed schools in our study belonged to adjacent cities, so there might not be much differences between the schoolchildren. Furthermore, the total population reached in the city with the largest number of inhabitants was only around 20,000 inhabitants. These aspects, together with the criterion used for the categorisation of the area of residence [28], could have influenced the results obtained. Moreover, obesity rates by area of residence have not yet been well studied in depth [39].
In the case of immigration, we observed that immigrant children had a higher prevalence of excess weight and high adiposity. This fact is consistent with others studies performed both in Europe [56] and Spain [16,57], suggesting that belonging to an immigrant family has a higher prevalence of excess of weight. In this sense, immigrant children are more likely to suffer from social exclusion, which seems to lead to unhealthy behaviour [58] and probably to increased body weight. However, it has been pointed out that the level of adiposity may differ due to the level of integration of the local culture rather than the fact of being an immigrant itself [59]. On the other hand, the recent study by de Bont et al. [19] also found lower figures among children of African and Asian nationalities. Moreover, these same authors showed that the risk of having excess weight increased over time, according to the cumulative ages of residence in Spain. This tendency has been identified in other studies, in which it was considered that exposure and acculturation to the Western lifestyle among the immigrant population led to this increase [60]. Nonetheless, data on childhood obesity in immigrant population in Europe and Spain are limited and may fluctuate considerably in relation to what is described in the United States [19].
In this study, we found some strengths that characterise our study, we assessed several obesity-related parameters such as WC, WHtR, or %BF, apart from the most commonly used BMI. This choice is based on the intention to offer a better understanding of the childhood obesity problem since, according to previously recommendations, BMI should be complemented by other anthropometric parameters (WC, for instance) to establish efficiently the risk in individuals [14,15]. Furthermore, the inclusion of several sociodemographic factors resulted in two essential aspects: on the one hand, a better understanding of the influence of these factors on the differences in childhood obesity in the region of Spain with the highest number of obese children [27]; on the other hand, a call for both regional and national government institutions to assume responsibility, leadership, political commitment, and take action in line with the recommendations of the WHO to address childhood obesity in the long term [5]. Contrariwise, there are certain limitations that must be declared. First, because of the cross-sectional design of this study, we are not able to establish cause-effect associations. Another limitation that we found is related to the lack of information on the individual’s developmental stage—for example, Tanner Stage, as an indicator of sexual maturation. In this line, differences in the distribution of BF begin at the age of the puberty, with boys developing a distribution which favours central deposition of fat, irrespective of their total BF [47]. Moreover, although we reported on per capita income of the different cities, information on the individual’s socioeconomic status could provide more accurate information about this variable.
Finally, our study suggested that overweight/obesity among schoolchildren in the Region of Murcia is higher than the overall prevalence of Spain. The result of the adjusted analyses showed that age, type of schooling, per capita income, and immigrant status were associated with obesity parameters. The identification of socio-demographic variables related to paediatric obesity can be an appropriate tool for possible early prevention and intervention. Public health policies and interventions aimed at the prevention and treatment of childhood obesity should incorporate a sensitive and clear focus on social and economic inequalities; emphasising on the groups most at risk.
Supplementary Materials
The following are available online at https://www.mdpi.com/2227-9067/7/11/201/s1, Table S1. Prevalence of having excess weight, abdominal obesity, high trunk fat mass, and high adiposity according to the different sociodemographic factors; Table S2. Association of having excess weight, abdominal obesity, high trunk fat mass and high adiposity according to different sociodemographic factors.
Author Contributions
J.F.L.-G. and J.L.Y.L. designed the study; J.F.L.-G. and A.L.-B. contributed to the analysis of the data and writing of the draft; J.F.L.-G. contributed to the analysis and interpretation of the data; A.L.-B., P.J.T.L. and J.L.Y.L. contributed to the revision of the manuscript. All authors have read and agreed to the published version of the manuscript.
Funding
This research received no external funding.
Acknowledgments
We are thankful for the participation of all the students, physical education teachers, parents/legal guardians, schools, and staff members who were involved, as well as the Ayuntamiento de Archena and the Universidad de Murcia for supporting this research.
Conflicts of Interest
The authors declare no conflict of interest.
References
- Abarca-Gómez, L.; Abdeen, Z.A.; Hamid, Z.A.; Abu-Rmeileh, N.M.; Acosta-Cazares, B.; Acuin, C.; Adams, R.J.; Aekplakorn, W.; Afsana, K.; Aguilar-Salinas, C.A.; et al. Worldwide trends in body-mass index, underweight, overweight, and obesity from 1975 to 2016: A pooled analysis of 2416 population-based measurement studies in 128.9 million children, adolescents, and adults. Lancet 2017, 390, 2627–2642. [Google Scholar] [CrossRef]
- Rito, A.I.; Buoncristiano, M.; Spinelli, A.; Salanave, B.; Kunešová, M.; Hejgaard, T.; García Solano, M.; Fijałkowska, A.; Sturua, L.; Hyska, J.; et al. Association between Characteristics at Birth, Breastfeeding and Obesity in 22 Countries: The WHO European Childhood Obesity Surveillance Initiative—COSI 2015/2017. Obes. Facts 2019, 12, 226–243. [Google Scholar] [CrossRef] [PubMed]
- Kumar, S.; Kelly, A.S. Review of Childhood Obesity. Mayo Clin. Proc. 2017, 92, 251–265. [Google Scholar] [CrossRef] [PubMed]
- Friedemann, C.; Heneghan, C.; Mahtani, K.; Thompson, M.; Perera, R.; Ward, A.M. Cardiovascular disease risk in healthy children and its association with body mass index: Systematic review and meta-analysis. BMJ 2012, 345, e4759. [Google Scholar] [CrossRef] [PubMed]
- World Health Organization; Commission on Ending Childhood Obesity. Report of the Commission on Ending Childhood Obesity; World Health Organization: Geneva, Switzerland, 2016; ISBN 978-92-4-151006-6. [Google Scholar]
- De Onis, M.; Onyango, A.W.; Borghi, E.; Siyam, A.; Nishida, C.; Siekmann, J. Development of a WHO growth reference for school-aged children and adolescents. Bull. World Health Organ. 2007, 85, 660–667. [Google Scholar] [CrossRef] [PubMed]
- Cole, T.J.; Lobstein, T. Extended international (IOTF) body mass index cut-offs for thinness, overweight and obesity: Extended international BMI cut-offs. Pediatr. Obes. 2012, 7, 284–294. [Google Scholar] [CrossRef] [PubMed]
- Kuczmarski, R.J.; Ogden, C.L.; Guo, S.S. 2000 CDC Growth Charts for the United States: Methods and Development; Vital and Health Statistics. Series 11, Data from the National Health Survey; National Center for Biotechnology Information: Rockville Pike, MA, USA, 2002. [Google Scholar]
- Fernández, C.; Lorenzo, H.; Vrotsou, K.; Aresti, U.; Rica, I.; Sánchez, E. Estudio de Crecimiento de Bilbao: Curvas y Tablas de Crecimiento (Estudios Longitudinal y Transversal); Fundación Faustino Orbegozo: Bilbao, Spain, 2011. [Google Scholar]
- Llewellyn, A.; Simmonds, M.; Owen, C.G.; Woolacott, N. Childhood obesity as a predictor of morbidity in adulthood: A systematic review and meta-analysis: Childhood obesity and adult morbidity. Obes. Rev. 2016, 17, 56–67. [Google Scholar] [CrossRef]
- De Arruda, G.A.; Fernandes, R.A.; Christófaro, D.G.D.; de Oliveira, A.R. Relação entre idade cronológica, indicadores de adiposidade corporal e aptidão física relacionada à saúde em meninos e meninas. Rev. Andal. Med. Deporte 2013, 6, 24–29. [Google Scholar] [CrossRef][Green Version]
- Barnett, T.A.; Maximova, K.; Sabiston, C.M.; Van Hulst, A.; Brunet, J.; Castonguay, A.L.; Bélanger, M.; O’Loughlin, J. Physical activity growth curves relate to adiposity in adolescents. Ann. Epidemiol. 2013, 23, 529–533. [Google Scholar] [CrossRef][Green Version]
- Orsso, C.E.; Silva, M.I.B.; Gonzalez, M.C.; Rubin, D.A.; Heymsfield, S.B.; Prado, C.M.; Haqq, A.M. Assessment of body composition in pediatric overweight and obesity: A systematic review of the reliability and validity of common techniques. Obes. Rev. 2020, 21. [Google Scholar] [CrossRef]
- Schröder, H.; Ribas, L.; Koebnick, C.; Funtikova, A.; Gomez, S.F.; Fíto, M.; Perez-Rodrigo, C.; Serra-Majem, L. Prevalence of Abdominal Obesity in Spanish Children and Adolescents. Do We Need Waist Circumference Measurements in Pediatric Practice? PLoS ONE 2014, 9, e87549. [Google Scholar] [CrossRef] [PubMed]
- González-Muniesa, P.; Mártinez-González, M.-A.; Hu, F.B.; Després, J.-P.; Matsuzawa, Y.; Loos, R.J.F.; Moreno, L.A.; Bray, G.A.; Martinez, J.A. Obesity. Nat. Rev. Dis. Primer 2017, 3, 17034. [Google Scholar] [CrossRef] [PubMed]
- Serral, G.; Bru, R.; Sánchez-Martínez, F.; Ariza, C. Overweight and childhood obesity according to socioeconomic variables in schoolchildren of third grade in the city of Barcelona. Nutr. Hosp. 2019, 36, 1043–1048. [Google Scholar] [CrossRef]
- Arriscado, D.; Muros, J.J.; Zabala, M.; Dalmau, J.M. Influencia del sexo y el tipo de escuela sobre los índices de sobrepeso y obesidad. Rev. Pediatría Aten. Primaria 2014, 16, e139–e146. [Google Scholar] [CrossRef][Green Version]
- Guo, Y.; Yin, X.; Wu, H.; Chai, X.; Yang, X. Trends in Overweight and Obesity among Children and Adolescents in China from 1991 to 2015: A Meta-Analysis. Int. J. Environ. Res. Public Health 2019, 16, 4656. [Google Scholar] [CrossRef] [PubMed]
- De Bont, J.; Díaz, Y.; Casas, M.; García-Gil, M.; Vrijheid, M.; Duarte-Salles, T. Time Trends and Sociodemographic Factors Associated with Overweight and Obesity in Children and Adolescents in Spain. JAMA Netw. Open 2020, 3, e201171. [Google Scholar] [CrossRef]
- Beal, T.; Le, T.D.; Trinh, H.T.; Burra, D.D.; Béné, C.; Huynh, T.T.T.; Truong, M.T.; Nguyen, S.D.; Tran, D.T.; Nguyen, K.T.; et al. Child Overweight or Obesity Is Associated with Modifiable and Geographic Factors in Vietnam: Implications for Program Design and Targeting. Nutrients 2020, 12, 1286. [Google Scholar] [CrossRef] [PubMed]
- Hales, C.M.; Fryar, C.D.; Carroll, M.D.; Freedman, D.S.; Ogden, C.L. Trends in Obesity and Severe Obesity Prevalence in US Youth and Adults by Sex and Age, 2007–2008 to 2015–2016. JAMA 2018, 319, 1723. [Google Scholar] [CrossRef]
- Estudio ALADINO 2019 Estudio de Vigilancia del Crecimiento, Alimentación, Actividad Física, Desarrollo Infantil y Obesidad en España 2019; Ministerio de Sanidad, Servicios Sociales e Igualdad: Madrid, Spain, 2020.
- Vaquero-Álvarez, M.; Romero-Saldaña, M.; Valle-Alonso, J.; Llorente Cantarero, F.J.; Blancas-Sánchez, I.M.; Fonseca del Pozo, F.J. Estudio de la obesidad en una población infantil rural y su relación con variables antropométricas. Aten. Primaria 2019, 51, 341–349. [Google Scholar] [CrossRef]
- Vásquez, F.; Diaz, E.; Lera, L.; Vásquez, L.; Anziani, A.; Levton, B.; Burrows, R. Evaluación longitudinal de la composición corporal por diferentes. Nutr. Hosp. 2013, 28, 148–154. [Google Scholar] [CrossRef]
- Simmonds, M.; Llewellyn, A.; Owen, C.G.; Woolacott, N. Predicting adult obesity from childhood obesity: A systematic review and meta-analysis: Adult obesity from childhood obesity. Obes. Rev. 2016, 17, 95–107. [Google Scholar] [CrossRef] [PubMed]
- Bel-Serrat, S.; Heinen, M.M.; Mehegan, J.; O’Brien, S.; Eldin, N.; Murrin, C.M.; Kelleher, C.C. School sociodemographic characteristics and obesity in schoolchildren: Does the obesity definition matter? BMC Public Health 2018, 18, 337. [Google Scholar] [CrossRef] [PubMed]
- Ministerio de Sanidad, Consumo y Bienestar Social. Encuesta Nacional de Salud de España 2017; Ministerio de Sanidad, Consumo y Bienestar Social: Madrid, Spain, 2018.
- Ministerio de Medio Ambiente y Medio Rural y Marino. Población y Sociedad Rural; Serie AgrInfo; Unidad de Análisis y Prospectiva; Ministerio de Medio Ambiente y Medio Rural y Marino: Madrid, Spain, 2009.
- Taylor, R.W.; Jones, I.E.; Williams, S.M.; Goulding, A. Evaluation of waist circumference, waist-to-hip ratio, and the conicity index as screening tools for high trunk fat mass, as measured by dual-energy X-ray absorptiometry, in children aged 3–19 y. Am. J. Clin. Nutr. 2000, 72, 490–495. [Google Scholar] [CrossRef] [PubMed]
- Browning, L.M.; Hsieh, S.D.; Ashwell, M. A systematic review of waist-to-height ratio as a screening tool for the prediction of cardiovascular disease and diabetes: 0.5 could be a suitable global boundary value. Nutr. Res. Rev. 2010, 23, 247–269. [Google Scholar] [CrossRef] [PubMed]
- Stewart, A.; Sutton, L. (Eds.) Body Composition in Sport, Exercise, and Health; Routledge: Abingdon, UK; New York, NY, USA, 2012; ISBN 978-0-415-61497-9. [Google Scholar]
- Brook, C.G. Determination of body composition of children from skinfold measurements. Arch. Dis. Child. 1971, 46, 182–184. [Google Scholar] [CrossRef] [PubMed]
- Siri, W.E. Body composition from fluid spaces and density: Analysis of methods. In Techniques for Measuring Body Composition; National Academy of Sciences: Washington, DC, USA, 1961; pp. 223–244. [Google Scholar]
- Weststrate, J.A.; Deurenberg, P. Body composition in children: Proposal for a method for calculating body fat percentage from total body density or skinfold-thickness measurements. Am. J. Clin. Nutr. 1989, 50, 1104–1115. [Google Scholar] [CrossRef]
- Gasol Foundation Resultados Principales del Estudio PASOS 2019 Sobre la Actividad Física, los Estilos de vida y la Obesidad de la Población Española de 8 a 16 años; Gasol Foundation: Barcelona, Spain, 2019.
- Ogden, C.L.; Carroll, M.D.; Curtin, L.R.; McDowell, M.A.; Tabak, C.J.; Flegal, K.M. Prevalence of overweight and obesity in the United States, 1999–2004. JAMA 2006, 295, 1549–1555. [Google Scholar] [CrossRef]
- Long, J.M.; Mareno, N.; Shabo, R.; Wilson, A.H. Overweight and obesity among White, Black, and Mexican American children: Implications for when to intervene. J. Spec. Pediatr. Nurs. JSPN 2012, 17, 41–50. [Google Scholar] [CrossRef]
- Skinner, A.C.; Ravanbakht, S.N.; Skelton, J.A.; Perrin, E.M.; Armstrong, S.C. Prevalence of Obesity and Severe Obesity in US Children, 1999–2016. Pediatrics 2018, 141, e20173459. [Google Scholar] [CrossRef]
- Ogden, C.L.; Fryar, C.D.; Hales, C.M.; Carroll, M.D.; Aoki, Y.; Freedman, D.S. Differences in Obesity Prevalence by Demographics and Urbanization in US Children and Adolescents, 2013–2016. JAMA 2018, 319, 2410. [Google Scholar] [CrossRef]
- Ellis, K.J.; Abrams, S.A.; Wong, W.W. Monitoring Childhood Obesity: Assessment of the Weight/Height2 Index. Am. J. Epidemiol. 1999, 150, 939–946. [Google Scholar] [CrossRef] [PubMed]
- Rolland-Cachera, M.F.; Deheeger, M.; Bellisle, F.; Sempé, M.; Guilloud-Bataille, M.; Patois, E. Adiposity rebound in children: A simple indicator for predicting obesity. Am. J. Clin. Nutr. 1984, 39, 129–135. [Google Scholar] [CrossRef] [PubMed]
- Wang, Y.; Beydoun, M.A. The Obesity Epidemic in the United States Gender, Age, Socioeconomic, Racial/Ethnic, and Geographic Characteristics: A Systematic Review and Meta-Regression Analysis. Epidemiol. Rev. 2007, 29, 6–28. [Google Scholar] [CrossRef] [PubMed]
- Ogden, C.L.; Carroll, M.D.; Kit, B.K.; Flegal, K.M. Prevalence of Obesity and Trends in Body Mass Index among US Children and Adolescents, 1999–2010. JAMA 2012, 307, 483. [Google Scholar] [CrossRef]
- Yusuf, Z.I.; Dongarwar, D.; Yusuf, R.A.; Bell, M.; Harris, T.; Salihu, H.M. Social Determinants of Overweight and Obesity among Children in the United States. Int. J. MCH AIDS 2020, 9, 22–33. [Google Scholar] [CrossRef]
- Arriscado, D.; Muros, J.J.; Zabala, M.; Dalmau, J.M. Relación entre condición física y composición corporal en escolares de primaria del norte de España (Logroño). Nutr. Hosp. 2014, 30, 385–394. [Google Scholar] [CrossRef]
- Tovar-Galvez, M.I.; González-Jiménez, E.; Martí-García, C.; Schmidt-RioValle, J. Composición corporal en escolares: Comparación entre métodos antropométricos simples e impedancia bioeléctrica. Endocrinol. Diabetes Nutr. 2017, 64, 424–431. [Google Scholar] [CrossRef]
- Cowell, C.T.; Briody, J.; Lloyd-Jones, S.; Smith, C.; Moore, B.; Howman-Giles, R. Fat Distribution in Children and Adolescents & ndash; the Influence of Sex and Hormones. Horm. Res. 1997, 48, 93–100. [Google Scholar] [CrossRef]
- Nielsen, D.H.; Cassady, S.L.; Janz, K.F.; Cook, J.S.; Hansen, J.R.; Wu, Y.-T. Criterion methods of body composition analysis for children and adolescents. Am. J. Hum. Biol. 1993, 5, 211–223. [Google Scholar] [CrossRef]
- Mekonnen, T.; Tariku, A.; Abebe, S.M. Overweight/obesity among school aged children in Bahir Dar City: Cross sectional study. Ital. J. Pediatr. 2018, 44. [Google Scholar] [CrossRef]
- Elías-Boneta, A.R.; Toro, M.J.; Garcia, O.; Torres, R.; Palacios, C. High prevalence of overweight and obesity among a representative sample of Puerto Rican children. BMC Public Health 2015, 15. [Google Scholar] [CrossRef]
- Hirvonen, K.; Bai, Y.; Headey, D.; Masters, W.A. Affordability of the EAT–Lancet reference diet: A global analysis. Lancet Glob. Health 2020, 8, e59–e66. [Google Scholar] [CrossRef]
- De Arruda Moreira, M.; Coelho Cabral, P.; da Silva Ferreira, H.; Cabral de Lira, P.I. Prevalence and factors associated with overweight and obesity in children under five in Alagoas, Northeast of Brazil; a population-based study. Nutr. Hosp. 2014, 29, 1320–1326. [Google Scholar] [CrossRef]
- Murphy, R.; Stewart, A.W.; Hancox, R.J.; Wall, C.R.; Braithwaite, I.; Beasley, R.; Mitchell, E.A.; The ISAAC Phase Three Study Group. Obesity underweight and BMI distribution characteristics of children by gross national income and income inequality: Results from an international survey: BMI distribution by GNI and Gini. Obes. Sci. Pract. 2018, 4, 216–228. [Google Scholar] [CrossRef]
- Biehl, A.; Hovengen, R.; Grøholt, E.-K.; Hjelmesæth, J.; Strand, B.H.; Meyer, H.E. Adiposity among children in Norway by urbanity and maternal education: A nationally representative study. BMC Public Health 2013, 13, 842. [Google Scholar] [CrossRef]
- Joens-Matre, R.R.; Welk, G.J.; Calabro, M.A.; Russell, D.W.; Nicklay, E.; Hensley, L.D. Rural–Urban Differences in Physical Activity, Physical Fitness, and Overweight Prevalence of Children. J. Rural Health 2008, 24, 49–54. [Google Scholar] [CrossRef]
- Murer, S.B.; Saarsalu, S.; Zimmermann, J.; Herter-Aeberli, I. Risk factors for overweight and obesity in Swiss primary school children: Results from a representative national survey. Eur. J. Nutr. 2016, 55, 621–629. [Google Scholar] [CrossRef]
- Pardo Arquero, V.P.; Jiménez Pavón, D.; Guillén del Castillo, M.; Benítez Sillero, J.D. Actividad física, condición física y adiposidad: Inmigrantes versus escolares españoles. Rev. Int. Med. Cienc. Act. Física Deporte 2014, 14, 319–338. [Google Scholar]
- On behalf of the IDEFICS Consortium; Iguacel, I.; Fernández-Alvira, J.M.; Bammann, K.; Chadjigeorgiou, C.; De Henauw, S.; Heidinger-Felső, R.; Lissner, L.; Michels, N.; Page, A.; et al. Social vulnerability as a predictor of physical activity and screen time in European children. Int. J. Public Health 2018, 63, 283–295. [Google Scholar] [CrossRef]
- Renzaho, A.M.N.; Swinburn, B.; Burns, C. Maintenance of traditional cultural orientation is associated with lower rates of obesity and sedentary behaviours among African migrant children to Australia. Int. J. Obes. 2008, 32, 594–600. [Google Scholar] [CrossRef]
- Hao, L.; Kim, J.J.H. Immigration and the American Obesity Epidemic. Int. Migr. Rev. 2009, 43, 237–262. [Google Scholar] [CrossRef] [PubMed]


Publisher’s Note: MDPI stays neutral with regard to jurisdictional claims in published maps and institutional affiliations. |
© 2020 by the authors. Licensee MDPI, Basel, Switzerland. This article is an open access article distributed under the terms and conditions of the Creative Commons Attribution (CC BY) license (http://creativecommons.org/licenses/by/4.0/).