
The Relationship between Metabolic Syndrome and Smoking and Alcohol Experiences in Adolescents from Low-Income Households


Abstract
:1. Introduction
2. Materials and Methods
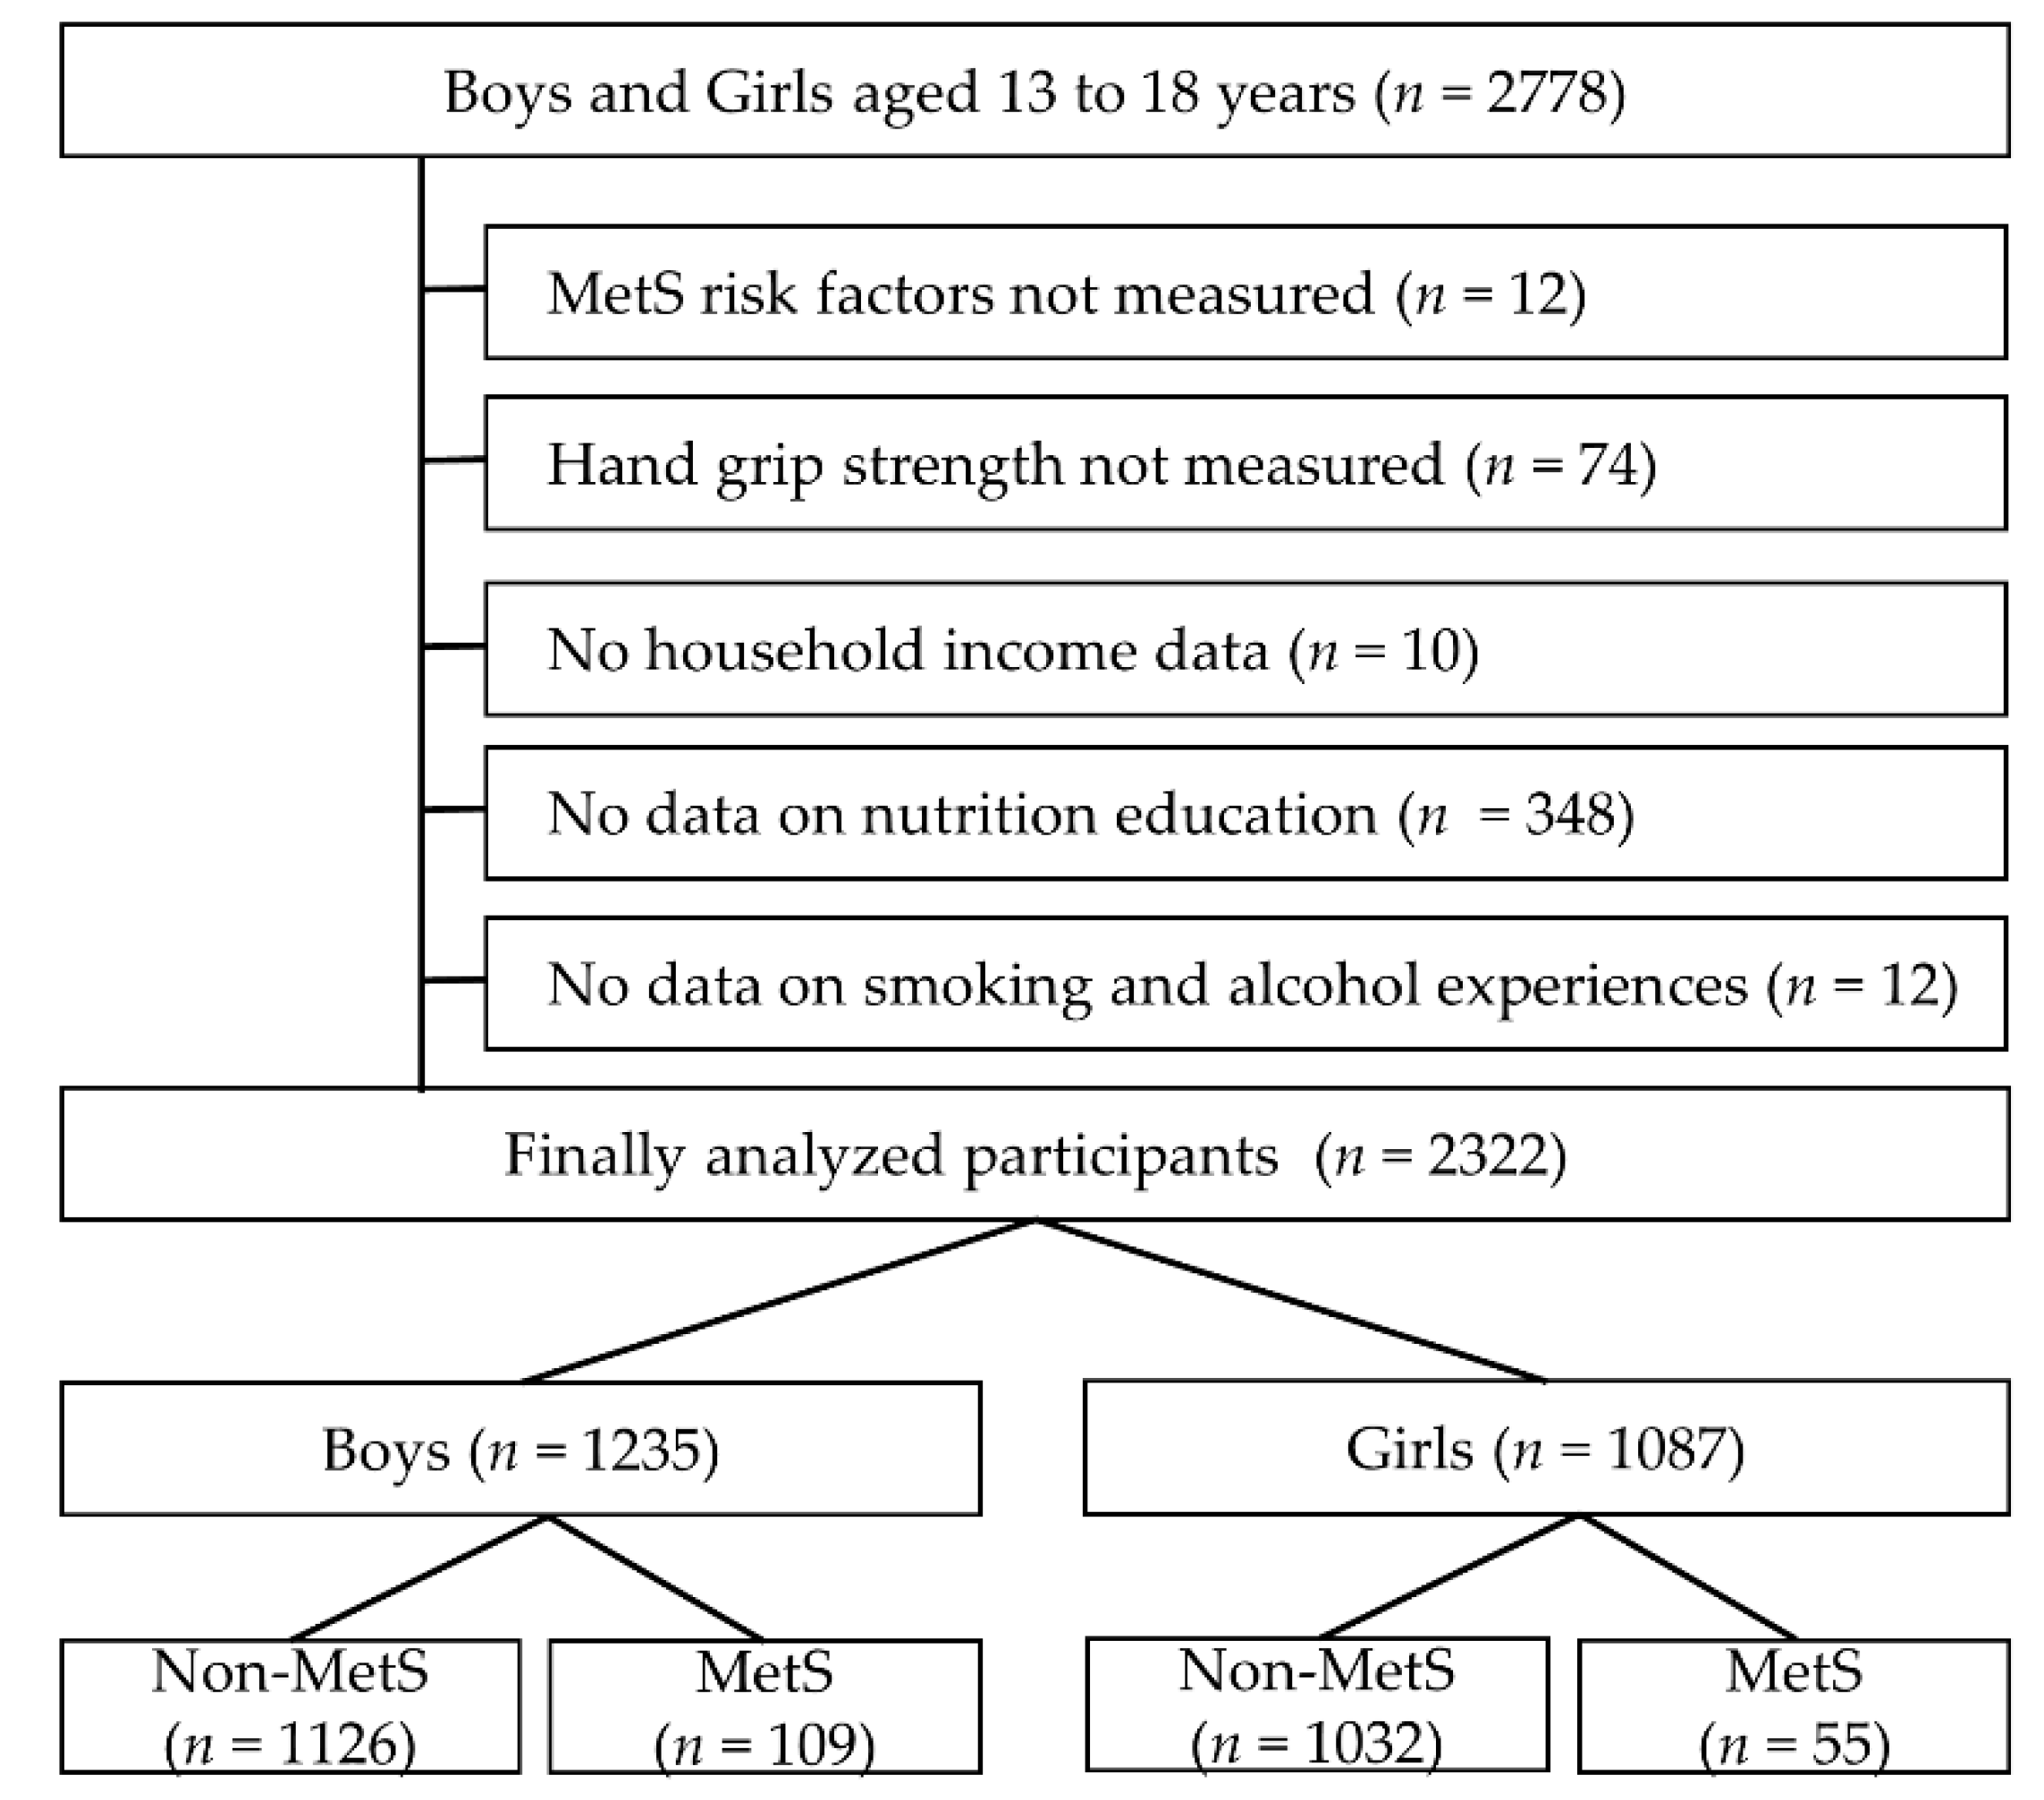
2.1. Participants
2.2. Metabolic Syndrome
2.3. Hand Grip Strength
2.4. Household Income and Health Behaviors
2.5. Data Analysis
3. Results
3.1. General Characteristics of Participants
3.2. MetS Prevalence According to Risk Factors, Household Income, HGS and Health Behaviors
3.3. MetS Odds Ratio According to Household Income, HGS and Health Behaviors
3.4. Relationship between Smoking and Alcohol Experience, and MetS Risk Factors
3.5. Smoking and Alcohol Consumption Odds Ratios according to Household Income
4. Discussion
5. Conclusions
Author Contributions
Funding
Institutional Review Board Statement
Informed Consent Statement
Data Availability Statement
Conflicts of Interest
References
- Alberti, K.; Eckel, R.H.; Grundy, S.M.; Zimmet, P.Z.; Cleeman, J.I.; Donato, K.A.; Fruchart, J.-C.; James, W.P.T.; Loria, C.M.; Smith, S.C., Jr. Harmonizing the metabolic syndrome: A joint interim statement of the International Diabetes Federation Task Force on Epidemiology and Prevention; National Heart, Lung, and Blood Institute; American Heart Association; World Heart Federation; International Atherosclerosis Society; and International Association for the Study of Obesity. Circulation 2009, 120, 1640–1645. [Google Scholar]
- Merchant, R.A.; Chan, Y.H.; Lim, J.Y.; Morley, J.E. Prevalence of metabolic syndrome and association with grip strength in older adults: Findings from the HOPE study. Diabetes Metab. Syndr. Obes. Targets Ther. 2020, 13, 2677. [Google Scholar] [CrossRef] [PubMed]
- Park, Y.-W.; Zhu, S.; Palaniappan, L.; Heshka, S.; Carnethon, M.R.; Heymsfield, S.B. The metabolic syndrome: Prevalence and associated risk factor findings in the US population from the Third National Health and Nutrition Examination Survey, 1988–1994. Arch. Intern. Med. 2003, 163, 427–436. [Google Scholar] [CrossRef] [PubMed] [Green Version]
- Ko, G.T.-C.; Cockram, C.S.; Chow, C.-C.; Yeung, V.; Chan, W.-B.; So, W.-Y.; Chan, N.N.; Chan, J.C.-N. High prevalence of metabolic syndrome in Hong Kong Chinese—Comparison of three diagnostic criteria. Diabetes Res. Clin. Pract. 2005, 69, 160–168. [Google Scholar] [CrossRef] [PubMed]
- Ogden, C.L.; Carroll, M.D.; Lawman, H.G.; Fryar, C.D.; Kruszon-Moran, D.; Kit, B.K.; Flegal, K.M. Trends in obesity prevalence among children and adolescents in the United States, 1988–1994 through 2013–2014. JAMA 2016, 315, 2292–2299. [Google Scholar] [CrossRef] [PubMed]
- Friend, A.; Craig, L.; Turner, S. The prevalence of metabolic syndrome in children: A systematic review of the literature. Metab. Syndr. Relat. Disord. 2013, 11, 71–80. [Google Scholar] [CrossRef]
- Cornier, M.-A.; Dabelea, D.; Hernandez, T.L.; Lindstrom, R.C.; Steig, A.J.; Stob, N.R.; Van Pelt, R.E.; Wang, H.; Eckel, R.H. The metabolic syndrome. Endocr. Rev. 2008, 29, 777–822. [Google Scholar] [CrossRef]
- Grundy, S.M. Metabolic syndrome pandemic. Arterioscler. Thromb. Vasc. Biol. 2008, 28, 629–636. [Google Scholar] [CrossRef] [Green Version]
- Pampel, F.C.; Krueger, P.M.; Denney, J.T. Socioeconomic disparities in health behaviors. Annu. Rev. Sociol. 2010, 36, 349–370. [Google Scholar] [CrossRef] [Green Version]
- Paek, K.-W.; Chun, K.-H.; Jin, K.-N.; Lee, K.-S. Do health behaviors moderate the effect of socioeconomic status on metabolic syndrome? Ann. Epidemiol. 2006, 16, 756–762. [Google Scholar] [CrossRef]
- Bogg, T.; Roberts, B.W. Conscientiousness and health-related behaviors: A meta-analysis of the leading behavioral contributors to mortality. Psychol. Bull. 2004, 130, 887. [Google Scholar] [CrossRef] [PubMed] [Green Version]
- Hampson, S.E.; Edmonds, G.W.; Goldberg, L.R.; Dubanoski, J.P.; Hillier, T.A. Childhood conscientiousness relates to objectively measured adult physical health four decades later. Health Psychol. 2013, 32, 925. [Google Scholar] [CrossRef] [Green Version]
- Cleland, V.; Timperio, A.; Salmon, J.; Hume, C.; Telford, A.; Crawford, D. A Longitudinal Study of the Family Physical Activity Environment and Physical Activity among Youth; SAGE Publications: Los Angeles, CA, USA, 2011. [Google Scholar]
- Syed-Abdul, M.M.; Soni, D.S.; Liu, X.; Wagganer, J.D. Effects of Eating While Walking on Blood Glucose Concentrations. Endocrines 2020, 1, 13–21. [Google Scholar] [CrossRef]
- Kim, G.; Lee, S.-E.; Jun, J.E.; Lee, Y.-B.; Ahn, J.; Bae, J.C.; Jin, S.-M.; Hur, K.Y.; Jee, J.H.; Lee, M.-K. Increase in relative skeletal muscle mass over time and its inverse association with metabolic syndrome development: A 7-year retrospective cohort study. Cardiovasc. Diabetol. 2018, 17, 1–13. [Google Scholar] [CrossRef] [PubMed] [Green Version]
- Park, S.-J.; Ryu, S.-Y.; Park, J.; Choi, S.-W. Association of sarcopenia with metabolic syndrome in Korean population using 2009–2010 Korea national health and nutrition examination survey. Metab. Syndr. Relat. Disord. 2019, 17, 494–499. [Google Scholar] [CrossRef] [Green Version]
- Weiss, R.; Bremer, A.A.; Lustig, R.H. What is metabolic syndrome, and why are children getting it? Ann. N. Y. Acad. Sci. 2013, 1281, 123. [Google Scholar] [CrossRef] [Green Version]
- Kang, Y.; Park, S.; Kim, S.; Koh, H. Handgrip strength among Korean adolescents with metabolic syndrome in 2014–2015. J. Clin. Densitom. 2020, 23, 271–277. [Google Scholar] [CrossRef] [PubMed]
- Ko, D.H.; Kim, Y.K. The Prevalence of Metabolic Syndrome According to Grip Strength in Teenagers. Children 2021, 8, 108. [Google Scholar] [CrossRef]
- Mainous, A.G.; Tanner, R.J.; Anton, S.D.; Jo, A. Low grip strength and prediabetes in normal-weight adults. J. Am. Board Fam. Med. 2016, 29, 280–282. [Google Scholar] [CrossRef] [Green Version]
- Sayer, A.A.; Syddall, H.; Dennison, E.; Martin, H.; Phillips, D.; Cooper, C.; Byrne, C. Grip strength and the metabolic syndrome: Findings from the Hertfordshire Cohort Study. QJM Int. J. Med. 2007, 100, 707–713. [Google Scholar] [CrossRef] [Green Version]
- Dodds, R.; Kuh, D.; Aihie Sayer, A.; Cooper, R. Physical activity levels across adult life and grip strength in early old age: Updating findings from a British birth cohort. Age Ageing 2013, 42, 794–798. [Google Scholar] [CrossRef] [PubMed] [Green Version]
- Hill, J.L.; Chau, C.; Luebbering, C.R.; Kolivras, K.K.; Zoellner, J. Does availability of physical activity and food outlets differ by race and income? Findings from an enumeration study in a health disparate region. Int. J. Behav. Nutr. Phys. Act. 2012, 9, 1–10. [Google Scholar] [CrossRef] [Green Version]
- Seefeldt, V.; Malina, R.M.; Clark, M.A. Factors affecting levels of physical activity in adults. Sports Med. 2002, 32, 143–168. [Google Scholar] [CrossRef] [PubMed]
- Duggan, K.A.; Jennings, J.R.; Matthews, K.A. Prospective associations of adolescent conscientiousness with psychological resources and metabolic syndrome in Black and White men. Psychosom. Med. 2019, 81, 341. [Google Scholar] [CrossRef]
- Gordon-Larsen, P.; Adair, L.S.; Popkin, B.M. The relationship of ethnicity, socioeconomic factors, and overweight in US adolescents. Obes. Res. 2003, 11, 121–129. [Google Scholar] [CrossRef]
- Kim, I.-G.; So, W.-Y. The relationship between household income and physical activity in Korea. J. Phys. Ther. Sci. 2014, 26, 1887–1889. [Google Scholar] [CrossRef] [Green Version]
- Wang, Y.; Beydoun, M.A. The obesity epidemic in the United States—Gender, age, socioeconomic, racial/ethnic, and geographic characteristics: A systematic review and meta-regression analysis. Epidemiol. Rev. 2007, 29, 6–28. [Google Scholar] [CrossRef]
- Riediger, N.D.; Clara, I. Prevalence of metabolic syndrome in the Canadian adult population. CMAJ 2011, 183, E1127–E1134. [Google Scholar] [CrossRef] [PubMed] [Green Version]
- Santos, A.C.; Ebrahim, S.; Barros, H. Gender, socio-economic status and metabolic syndrome in middle-aged and old adults. BMC Public Health 2008, 8, 1–8. [Google Scholar] [CrossRef] [Green Version]
- Cook, S.; Weitzman, M.; Auinger, P.; Nguyen, M.; Dietz, W.H. Prevalence of a metabolic syndrome phenotype in adolescents: Findings from the third National Health and Nutrition Examination Survey, 1988–1994. Arch. Pediatrics Adolesc. Med. 2003, 157, 821–827. [Google Scholar] [CrossRef] [PubMed] [Green Version]
- National Center for Farmworker Health Statistics. Centers for Disease Control and Prevention National Health and Nutrition Examination Survey; National Center for Health Statistics. Centers for Disease Control and Prevention: Atlanta, GA, USA, 2018. [Google Scholar]
- Hemingway, H.; Marmot, M. Evidence based cardiology: Psychosocial factors in the aetiology and prognosis of coronary heart disease: Systematic review of prospective cohort studies. Br. Med. J. 1999, 318, 1460. [Google Scholar] [CrossRef]
- Sutin, A.R.; Costa, P.T.; Uda, M.; Ferrucci, L.; Schlessinger, D.; Terracciano, A. Personality and metabolic syndrome. Age 2010, 32, 513–519. [Google Scholar] [CrossRef] [PubMed] [Green Version]
- Lee, W.-Y.; Jung, C.-H.; Park, J.-S.; Rhee, E.-J.; Kim, S.-W. Effects of smoking, alcohol, exercise, education, and family history on the metabolic syndrome as defined by the ATP III. Diabetes Res. Clin. Pract. 2005, 67, 70–77. [Google Scholar] [CrossRef] [PubMed]
- Pan, Y.; Pratt, C.A. Metabolic syndrome and its association with diet and physical activity in US adolescents. J. Am. Diet. Assoc. 2008, 108, 276–286. [Google Scholar] [CrossRef] [PubMed]
- Slagter, S.N.; van Vliet-Ostaptchouk, J.V.; Vonk, J.M.; Boezen, H.M.; Dullaart, R.P.; Kobold, A.C.M.; Feskens, E.J.; van Beek, A.P.; van der Klauw, M.M.; Wolffenbuttel, B.H. Combined effects of smoking and alcohol on metabolic syndrome: The LifeLines cohort study. PLoS ONE 2014, 9, e96406. [Google Scholar] [CrossRef] [Green Version]
- Park, M.J.; Yun, K.E.; Lee, G.E.; Cho, H.J.; Park, H.S. A cross-sectional study of socioeconomic status and the metabolic syndrome in Korean adults. Ann. Epidemiol. 2007, 17, 320–326. [Google Scholar] [CrossRef]
- Iguacel, I.; Michels, N.; Ahrens, W.; Bammann, K.; Eiben, G.; Fernández-Alvira, J.M.; Mårild, S.; Molnár, D.; Reisch, L.; Russo, P. Prospective associations between socioeconomically disadvantaged groups and metabolic syndrome risk in European children. Results from the IDEFICS study. Int. J. Cardiol. 2018, 272, 333–340. [Google Scholar] [CrossRef] [Green Version]
- Lantz, P.M.; House, J.S.; Mero, R.P.; Williams, D.R. Stress, life events, and socioeconomic disparities in health: Results from the Americans’ Changing Lives Study. J. Health Soc. Behav. 2005, 46, 274–288. [Google Scholar] [CrossRef] [PubMed] [Green Version]
- Siahpush, M.; McNeill, A.; Hammond, D.; Fong, G.T. Socioeconomic and country variations in knowledge of health risks of tobacco smoking and toxic constituents of smoke: Results from the 2002 International Tobacco Control (ITC) Four Country Survey. Tob. Control 2006, 15, iii65–iii70. [Google Scholar] [CrossRef] [Green Version]
- Rantanen, T.; Guralnik, J.M.; Foley, D.; Masaki, K.; Leveille, S.; Curb, J.D.; White, L. Midlife hand grip strength as a predictor of old age disability. JAMA 1999, 281, 558–560. [Google Scholar] [CrossRef] [Green Version]
- Farrell, S.W.; Cheng, Y.J.; Blair, S.N. Prevalence of the metabolic syndrome across cardiorespiratory fitness levels in women. Obes. Res. 2004, 12, 824–830. [Google Scholar] [CrossRef] [PubMed] [Green Version]


| Boys (n = 1235) | Girls (n = 1087) | p | |
|---|---|---|---|
| Age, years | 15.4 ± 1.7 | 15.5 ± 1.7 | 0.359 |
| Height, cm | 171.2 ± 7.0 | 160.5 ± 5.5 | <0.001 * |
| Weight, kg | 64.8 ± 13.9 | 55.1 ± 10.6 | <0.001 * |
| BMI, kg/m2 | 22 ± 4.1 | 21.3 ± 3.7 | <0.001 * |
| Boys | Girls | |||||
|---|---|---|---|---|---|---|
| Non-MetS | MetS | p | Non-MetS | MetS | p | |
| n (%) | 1126 (91.2%) | 109 (8.8%) | 1032 (94.9%) | 55 (5.1%) | ||
| Age, years | 15.4 ± 1.8 | 15.5 ± 1.7 | 0.603 | 15.4 ± 1.7 | 15.7 ± 1.8 | 0.226 |
| Height, cm | 171.0 ± 7.0 | 173.7 ± 6.5 | <0.001 * | 160.5 ± 5.4 | 162.2 ± 6.5 | 0.023 |
| Weight, kg | 62.9 ± 12.1 | 85.6 ± 13.3 | <0.001 * | 54.0 ± 9.2 | 74.0 ± 15.4 | <0.001 * |
| BMI, kg/m2 | 21.4 ± 3.6 | 28.3 ± 3.8 | <0.001 * | 21.0 ± 3.2 | 28.1 ± 5.5 | <0.001 * |
| MetS risk factors | ||||||
| Waist circumference, cm | 73.8 ± 9.5 | 92.9 ± 9.5 | <0.001 * | 68.6 ± 7.3 | 85.2 ± 12.2 | <0.001 * |
| SBP, mmHg | 111.2 ± 9.1 | 124.8 ± 8.9 | <0.001 * | 105.3 ± 8.3 | 117.6 ± 10.5 | <0.001 * |
| DBP, mmHg | 67.3 ± 8.6 | 76.3 ± 9.6 | <0.001 * | 66.8 ± 7.5 | 75.9 ± 7.8 | <0.001 * |
| TG, mg/dL | 81.3 ± 47.4 | 152.8 ± 67.4 | <0.001 * | 80.5 ± 39.3 | 153.9 ± 62.3 | <0.001 * |
| Glucose, mg/dL | 92.1 ± 7.3 | 96.5 ± 18.4 | 0.015 * | 89.2 ± 6.8 | 97 ± 12.7 | <0.001 * |
| HDL-C, mg/dL | 50.0 ± 9.0 | 39.7 ± 6.4 | <0.001 * | 53.9 ± 9.8 | 43.1 ± 8.3 | <0.001 * |
| Family income, Korean Won | 493.9 ± 293.8 | 523 ± 316.9 | 0.328 | 506.9 ± 308.5 | 426.6 ± 273.1 | 0.039 * |
| Grip strength, kg/BW, % | 53.8 ± 11.2 | 42.7 ± 10.2 | <0.001 * | 41.9 ± 8.2 | 33.5 ± 8.7 | <0.001 * |
| Nutrition education, Yes, % | 21.9 | 17.5 | 0.318 | 24.2 | 14.6 | 0.028 * |
| Smoking experience, Yes, % | 18.1 | 16.5 | 0.674 | 7.6 | 5.5 | 0.563 |
| Alcohol experience, Yes, % | 36.9 | 36.7 | 0.968 | 29.4 | 30.9 | 0.806 |
| Boys | Girls | |||||
|---|---|---|---|---|---|---|
| OR | 95% CI | p | OR | 95% CI | p | |
| Family income | ||||||
| G1 | Reference | - | - | Reference | - | - |
| G2 | 0.774 | 0.401–1.493 | 0.445 | 2.585 | 0.926–7.216 | 0.070 |
| G3 | 0.911 | 0.410–2.025 | 0.819 | 2.833 | 0.994–8.074 | 0.051 |
| G4 | 1.025 | 0.579–1.812 | 0.933 | 3.590 | 1.257–10.253 | 0.017 * |
| G5 | 1.450 | 1.030–2.933 | 0.041 * | 4.050 | 1.326–12.369 | 0.014 * |
| Grip strength | ||||||
| G1 | Reference | - | - | Reference | - | - |
| G2 | 3.466 | 1.115–7.769 | 0.032 | 0.787 | 0.209–2.965 | 0.724 |
| G3 | 8.568 | 2.972–14.699 | <0.001 * | 2.227 | 0.762–6.504 | 0.143 |
| G4 | 9.622 | 4.345–18.901 | <0.001 * | 7.792 | 3.002–13.223 | <0.001 * |
| Nutrition education | ||||||
| Yes | Reference | - | - | Reference | - | - |
| No | 1.543 | 0.667–3.573 | 0.311 | 1.668 | 1.036–2.974 | 0.043 * |
| Smoking experience | ||||||
| No | Reference | - | - | Reference | - | - |
| Yes | 1.035 | 0.519–2.067 | 0.922 | 1.135 | 0.302–4.264 | 0.851 |
| Alcohol experience | ||||||
| No | Reference | - | - | Reference | - | - |
| Yes | 1.184 | 0.710–1.974 | 0.518 | 1.029 | 0.501–2.113 | 0.938 |
| Non-Smoking | Smoking | p | Non-Alcohol | Alcohol | p | |
|---|---|---|---|---|---|---|
| Boys | ||||||
| Waist circumference, cm | 75.2 ± 10.8 | 76.7 ± 11.3 | 0.043 * | 74.7 ± 10.7 | 76.8 ± 11.2 | 0.001 * |
| SBP, mmHg | 112.1 ± 9.7 | 114.4 ± 10.5 | 0.041 * | 111.8 ± 9.8 | 113.3 ± 10 | 0.012 * |
| DBP, mmHg | 67.7 ± 9.1 | 70.1 ± 8.7 | <0.001 * | 67.1 ± 9.2 | 69.9 ± 8.7 | 0.001 * |
| TG, mg/dL | 87.3 ± 54.5 | 87.6 ± 46.5 | 0.943 | 85.7 ± 50.3 | 90.3 ± 57.5 | 0.043 * |
| Glucose, mg/dL | 92.6 ± 7.4 | 92.3 ± 14.0 | 0.640 | 92.8 ± 7.6 | 92.0 ± 11.0 | 0.134 |
| HDL-C, mg/dL | 49.0 ± 9.2 | 49.5 ± 9.8 | 0.465 | 49.1 ± 9.1 | 49.0 ± 9.5 | 0.836 |
| Girls | ||||||
| Waist circumference, cm | 69.4 ± 8.4 | 70.1 ± 9.3 | 0.528 | 69.1 ± 8.3 | 70.4 ± 8.8 | 0.022 * |
| SBP, mmHg | 106.0 ± 8.9 | 105.1 ± 8.2 | 0.340 | 106.0 ± 8.9 | 105.9 ± 8.9 | 0.818 |
| DBP, mmHg | 67.1 ± 7.9 | 69.4 ± 6.6 | 0.010 * | 67.0 ± 7.9 | 67.7 ± 7.5 | 0.235 |
| TG, mg/dL | 84.4 ± 43.8 | 83.5 ± 44.6 | 0.856 | 84.0 ± 41.1 | 85.2 ± 49.8 | 0.669 |
| Glucose, mg/dL | 89.7 ± 7.5 | 88.5 ± 6.0 | 0.098 | 89.8 ± 7.5 | 89.1 ± 7.1 | 0.112 |
| HDL-C, mg/dL | 53.4 ± 9.9 | 53.0 ± 10.6 | 0.767 | 53.5 ± 10.0 | 53.1 ± 10.0 | 0.602 |
| Smoking Experience | Alcohol Experience | |||||
|---|---|---|---|---|---|---|
| OR | 95% CI | p | OR | 95% CI | p | |
| boys | ||||||
| G1 (highest) | Reference | - | - | Reference | - | - |
| G2 | 0.758 | 0.494–1.163 | 0.204 | 0.837 | 0.601–1.165 | 0.292 |
| G3 | 0.692 | 0.438–1.094 | 0.115 | 0.776 | 0.547–1.101 | 0.155 |
| G4 | 1.147 | 0.745–1.766 | 0.533 | 1.134 | 0.926–1.671 | 0.854 |
| G5 (lowest) | 1.807 | 1.097–2.976 | 0.020 * | 1.351 | 1.073–2.090 | 0.017 * |
| Girls | ||||||
| G1 (highest) | Reference | - | - | Reference | - | - |
| G2 | 0.697 | 0.326–1.488 | 0.350 | 1.068 | 0.693–1.646 | 0.765 |
| G3 | 1.008 | 0.483–2.103 | 0.983 | 1.399 | 0.898–2.179 | 0.138 |
| G4 | 1.466 | 0.652–3.299 | 0.355 | 2.111 | 1.326–3.360 | 0.002 * |
| G5 (lowest) | 2.337 | 1.202–4.541 | 0.012 * | 2.365 | 1.406–3.979 | 0.001 * |
Publisher’s Note: MDPI stays neutral with regard to jurisdictional claims in published maps and institutional affiliations. |
© 2021 by the authors. Licensee MDPI, Basel, Switzerland. This article is an open access article distributed under the terms and conditions of the Creative Commons Attribution (CC BY) license (https://creativecommons.org/licenses/by/4.0/).
Share and Cite
Choi, M.; Han, J.; Kim, Y.; Chung, J. The Relationship between Metabolic Syndrome and Smoking and Alcohol Experiences in Adolescents from Low-Income Households. Children 2021, 8, 812. https://doi.org/10.3390/children8090812
Choi M, Han J, Kim Y, Chung J. The Relationship between Metabolic Syndrome and Smoking and Alcohol Experiences in Adolescents from Low-Income Households. Children. 2021; 8(9):812. https://doi.org/10.3390/children8090812
Chicago/Turabian StyleChoi, Moonyoung, Joungkyue Han, Yonghwan Kim, and Jinwook Chung. 2021. "The Relationship between Metabolic Syndrome and Smoking and Alcohol Experiences in Adolescents from Low-Income Households" Children 8, no. 9: 812. https://doi.org/10.3390/children8090812