
Circulatory Adipokines and Incretins in Adolescent Idiopathic Scoliosis: A Pilot Study
Abstract
:1. Introduction
2. Materials and Methods
2.1. Study Design and Participant Recruitment
2.2. Assessment of Anthropometric Parameters and Sexual Maturity
2.3. Body Composition and Bone Mineral Density
2.4. Assessment of Dietary Intakes
2.5. Assessment of Physical Activity
2.6. Assessment of Estimated Energy Requirement and Energy Balance
2.7. Biochemical Determinations
Statistical Analyses
3. Results
4. Discussion
5. Conclusions
Supplementary Materials
Author Contributions
Funding
Institutional Review Board Statement
Informed Consent Statement
Data Availability Statement
Conflicts of Interest
References
- Morais, T.; Bernier, M.; Turcotte, F. Age- and sex-specific prevalence of scoliosis and the value of school screening programs. Am. J. Public Health 1985, 75, 1377–1380. [Google Scholar] [CrossRef] [PubMed] [Green Version]
- Du, Q.; Zhou, X.; Negrini, S.; Chen, N.; Yang, X.; Liang, J.; Sun, K. Scoliosis epidemiology is not similar all over the world: A study from a scoliosis school screening on Chongming Island (China). BMC Musculoskelet. Disord. 2016, 17, 303. [Google Scholar] [CrossRef] [PubMed] [Green Version]
- Yawn, B.P.; Yawn, R.A.; Hodge, D.; Kurland, M.; Shaughnessy, W.J.; Ilstrup, D.; Jacobsen, S.J. A population-based study of school scoliosis screening. JAMA 1999, 282, 1427–1432. [Google Scholar] [CrossRef] [PubMed] [Green Version]
- Hresko, M.T. Idiopathic Scoliosis in Adolescents. N. Engl. J. Med. 2013, 368, 834–841. [Google Scholar] [CrossRef] [PubMed]
- Negrini, S.; Donzelli, S.; Aulisa, A.G.; Czaprowski, D.; Schreiber, S.; de Mauroy, J.C.; Diers, H.; Grivas, T.B.; Knott, P.; Kotwicki, T.; et al. 2016 SOSORT guidelines: Orthopaedic and rehabilitation treatment of idiopathic scoliosis during growth. Scoliosis Spinal Disord. 2018, 13, 3. [Google Scholar] [CrossRef] [PubMed] [Green Version]
- Canavese, F. Idiopathic scoliosis. Ann. Transl. Med. 2020, 8, 21. [Google Scholar] [CrossRef] [PubMed]
- Kaelin, A.J. Adolescent idiopathic scoliosis: Indications for bracing and conservative treatments. Ann. Transl. Med. 2020, 8, 28. [Google Scholar] [CrossRef]
- Ruf, M.; Drumm, J.; Jeszenszky, D. Anterior instrumented fusion for adolescent idiopathic scoliosis. Ann. Transl. Med. 2020, 8, 31. [Google Scholar] [CrossRef]
- Asher, M.A.; Burton, D.C. Adolescent idiopathic scoliosis: Natural history and long term treatment effects. Scoliosis 2006, 1, 2. [Google Scholar] [CrossRef] [Green Version]
- Sanders, A.E.; Andras, L.M.; Iantorno, S.E.; Hamilton, A.; Choi, P.D.; Skaggs, D.L. Clinically Significant Psychological and Emotional Distress in 32% of Adolescent Idiopathic Scoliosis Patients. Spine Deform. 2018, 6, 435–440. [Google Scholar] [CrossRef]
- Fadzan, M.; Bettany-Saltikov, J. Etiological Theories of Adolescent Idiopathic Scoliosis: Past and Present. Open Orthop. J. 2017, 11, 1466–1489. [Google Scholar] [CrossRef] [PubMed] [Green Version]
- Liu, Z.; Tam, E.M.; Sun, G.Q.; Lam, T.P.; Zhu, Z.Z.; Sun, X.; Lee, K.M.; Ng, T.B.; Qiu, Y.; Cheng, J.C.; et al. Abnormal leptin bioavailability in adolescent idiopathic scoliosis: An important new finding. Spine 2012, 37, 599–604. [Google Scholar] [CrossRef] [PubMed]
- Matusik, E.; Durmala, J.; Olszanecka-Glinianowicz, M.; Chudek, J.; Matusik, P. Association between Bone Turnover Markers, Leptin, and Nutritional Status in Girls with Adolescent Idiopathic Scoliosis (AIS). Nutrients 2020, 12, 2657. [Google Scholar] [CrossRef] [PubMed]
- Qiu, Y.; Sun, X.; Qiu, X.; Li, W.; Zhu, Z.; Zhu, F.; Wang, B.; Yu, Y.; Qian, B. Decreased circulating leptin level and its association with body and bone mass in girls with adolescent idiopathic scoliosis. Spine 2007, 32, 2703–2710. [Google Scholar] [CrossRef] [PubMed]
- Sales de Gauzy, J.; Gennero, I.; Delrous, O.; Salles, J.P.; Lepage, B.; Accadbled, F. Fasting total ghrelin levels are increased in patients with adolescent idiopathic scoliosis. Scoliosis 2015, 10, 33. [Google Scholar] [CrossRef] [Green Version]
- Tam, E.M.; Liu, Z.; Lam, T.P.; Ting, T.; Cheung, G.; Ng, B.K.; Lee, S.K.; Qiu, Y.; Cheng, J.C. Lower Muscle Mass and Body Fat in Adolescent Idiopathic Scoliosis Are Associated With Abnormal Leptin Bioavailability. Spine 2016, 41, 940–946. [Google Scholar] [CrossRef] [Green Version]
- Wang, Q.; Wang, C.; Hu, W.; Hu, F.; Liu, W.; Zhang, X. Disordered leptin and ghrelin bioactivity in adolescent idiopathic scoliosis (AIS): A systematic review and meta-analysis. J. Orthop. Surg. Res. 2020, 15, 502. [Google Scholar] [CrossRef]
- Yu, H.G.; Zhang, H.Q.; Zhou, Z.H.; Wang, Y.J. High Ghrelin Level Predicts the Curve Progression of Adolescent Idiopathic Scoliosis Girls. Biomed. Res. Int. 2018, 2018, 9784083. [Google Scholar] [CrossRef]
- Barrios, C.; Cortés, S.; Pérez-Encinas, C.; Escrivá, M.D.; Benet, I.; Burgos, J.; Hevia, E.; Pizá, G.; Domenech, P. Anthropometry and body composition profile of girls with nonsurgically treated adolescent idiopathic scoliosis. Spine 2011, 36, 1470–1477. [Google Scholar] [CrossRef]
- Cheung, C.S.K.; Lee, W.T.K.; Tse, Y.K.; Lee, K.M.; Guo, X.; Qin, L.; Cheng, J.C.Y. Generalized osteopenia in adolescent idiopathic scoliosis-association with abnormal pubertal growth, bone turnover, and calcium intake? Spine 2006, 31, 330–338. [Google Scholar] [CrossRef]
- Tarrant, R.C.; Queally, J.M.; Moore, D.P.; Kiely, P.J. Prevalence and impact of low body mass index on outcomes in patients with adolescent idiopathic scoliosis: A systematic review. Eur. J. Clin. Nutr. 2018, 72, 1463–1484. [Google Scholar] [CrossRef] [PubMed]
- Diarbakerli, E.; Savvides, P.; Wihlborg, A.; Abbott, A.; Bergström, I.; Gerdhem, P. Bone health in adolescents with idiopathic scoliosis. Bone Joint J. 2020, 102-B, 268–272. [Google Scholar] [CrossRef]
- Khor, E.C.; Wee, N.K.; Baldock, P.A. Influence of hormonal appetite and energy regulators on bone. Curr. Osteoporos. Rep. 2013, 11, 194–202. [Google Scholar] [CrossRef]
- Adeghate, E. Visfatin: Structure, function and relation to diabetes mellitus and other dysfunctions. Curr. Med. Chem. 2008, 15, 1851–1862. [Google Scholar] [CrossRef]
- Berti, L.; Gammeltoft, S. Leptin stimulates glucose uptake in C2C12 muscle cells by activation of ERK2. Mol. Cell. Endocrinol. 1999, 157, 121–130. [Google Scholar] [CrossRef]
- Borst, S.E.; Conover, C.F.; Bagby, G.J. Association of resistin with visceral fat and muscle insulin resistance. Cytokine 2005, 32, 39–44. [Google Scholar] [CrossRef]
- Brown, J.E.; Onyango, D.J.; Dunmore, S.J. Resistin down-regulates insulin receptor expression, and modulates cell viability in rodent pancreatic beta-cells. FEBS Lett. 2007, 581, 3273–3276. [Google Scholar] [CrossRef]
- Brown, J.E.; Onyango, D.J.; Ramanjaneya, M.; Conner, A.C.; Patel, S.T.; Dunmore, S.J.; Randeva, H.S. Visfatin regulates insulin secretion, insulin receptor signalling and mRNA expression of diabetes-related genes in mouse pancreatic beta-cells. J. Mol. Endocrinol. 2010, 44, 171–178. [Google Scholar] [CrossRef] [PubMed]
- Cheng, Q.; Dong, W.; Qian, L.; Wu, J.; Peng, Y. Visfatin inhibits apoptosis of pancreatic β-cell line, MIN6, via the mitogen-activated protein kinase/phosphoinositide 3-kinase pathway. J. Mol. Endocrinol. 2011, 47, 13–21. [Google Scholar] [CrossRef] [PubMed] [Green Version]
- Emilsson, V.; Liu, Y.L.; Cawthorne, M.A.; Morton, N.M.; Davenport, M. Expression of the functional leptin receptor mRNA in pancreatic islets and direct inhibitory action of leptin on insulin secretion. Diabetes 1997, 46, 313–316. [Google Scholar] [CrossRef]
- Gao, C.L.; Zhao, D.Y.; Qiu, J.; Zhang, C.M.; Ji, C.B.; Chen, X.H.; Liu, F.; Guo, X.R. Resistin induces rat insulinoma cell RINm5F apoptosis. Mol. Biol. Rep. 2009, 36, 1703–1708. [Google Scholar] [CrossRef] [PubMed]
- Mantzoros, C.S.; Magkos, F.; Brinkoetter, M.; Sienkiewicz, E.; Dardeno, T.A.; Kim, S.Y.; Hamnvik, O.P.; Koniaris, A. Leptin in human physiology and pathophysiology. Am. J. Physiol. Endocrinol. Metab. 2011, 301, E567–E584. [Google Scholar] [CrossRef] [PubMed]
- Minokoshi, Y.; Kim, Y.B.; Peroni, O.D.; Fryer, L.G.; Müller, C.; Carling, D.; Kahn, B.B. Leptin stimulates fatty-acid oxidation by activating AMP-activated protein kinase. Nature 2002, 415, 339–343. [Google Scholar] [CrossRef] [PubMed]
- Moon, B.; Kwan, J.J.; Duddy, N.; Sweeney, G.; Begum, N. Resistin inhibits glucose uptake in L6 cells independently of changes in insulin signaling and GLUT4 translocation. Am. J. Physiol. Endocrinol. Metab. 2003, 285, E106–E115. [Google Scholar] [CrossRef] [PubMed]
- Moschen, A.R.; Kaser, A.; Enrich, B.; Mosheimer, B.; Theurl, M.; Niederegger, H.; Tilg, H. Visfatin, an adipocytokine with proinflammatory and immunomodulating properties. J. Immunol. 2007, 178, 1748–1758. [Google Scholar] [CrossRef] [PubMed] [Green Version]
- Ohashi, K.; Ouchi, N.; Matsuzawa, Y. Anti-inflammatory and anti-atherogenic properties of adiponectin. Biochimie 2012, 94, 2137–2142. [Google Scholar] [CrossRef]
- Ohashi, K.; Parker, J.L.; Ouchi, N.; Higuchi, A.; Vita, J.A.; Gokce, N.; Pedersen, A.A.; Kalthoff, C.; Tullin, S.; Sams, A.; et al. Adiponectin promotes macrophage polarization toward an anti-inflammatory phenotype. J. Biol. Chem. 2010, 285, 6153–6160. [Google Scholar] [CrossRef] [Green Version]
- Qi, Y.; Takahashi, N.; Hileman, S.M.; Patel, H.R.; Berg, A.H.; Pajvani, U.B.; Scherer, P.E.; Ahima, R.S. Adiponectin acts in the brain to decrease body weight. Nat. Med. 2004, 10, 524–529. [Google Scholar] [CrossRef]
- Reilly, M.P.; Lehrke, M.; Wolfe, M.L.; Rohatgi, A.; Lazar, M.A.; Rader, D.J. Resistin is an inflammatory marker of atherosclerosis in humans. Circulation 2005, 111, 932–939. [Google Scholar] [CrossRef] [Green Version]
- Vázquez, M.J.; González, C.R.; Varela, L.; Lage, R.; Tovar, S.; Sangiao-Alvarellos, S.; Williams, L.M.; Vidal-Puig, A.; Nogueiras, R.; López, M.; et al. Central resistin regulates hypothalamic and peripheral lipid metabolism in a nutritional-dependent fashion. Endocrinology 2008, 149, 4534–4543. [Google Scholar] [CrossRef]
- Wijesekara, N.; Krishnamurthy, M.; Bhattacharjee, A.; Suhail, A.; Sweeney, G.; Wheeler, M.B. Adiponectin-induced ERK and Akt phosphorylation protects against pancreatic beta cell apoptosis and increases insulin gene expression and secretion. J. Biol. Chem. 2010, 285, 33623–33631. [Google Scholar] [CrossRef] [PubMed] [Green Version]
- Yamauchi, T.; Kamon, J.; Minokoshi, Y.; Ito, Y.; Waki, H.; Uchida, S.; Yamashita, S.; Noda, M.; Kita, S.; Ueki, K.; et al. Adiponectin stimulates glucose utilization and fatty-acid oxidation by activating AMP-activated protein kinase. Nat. Med. 2002, 8, 1288–1295. [Google Scholar] [CrossRef] [PubMed]
- Yang, Y.; Xiao, M.; Mao, Y.; Li, H.; Zhao, S.; Gu, Y.; Wang, R.; Yu, J.; Zhang, X.; Irwin, D.M.; et al. Resistin and insulin resistance in hepatocytes: Resistin disturbs glycogen metabolism at the protein level. Biomed. Pharmacother. 2009, 63, 366–374. [Google Scholar] [CrossRef] [PubMed]
- Zhao, A.Z.; Shinohara, M.M.; Huang, D.; Shimizu, M.; Eldar-Finkelman, H.; Krebs, E.G.; Beavo, J.A.; Bornfeldt, K.E. Leptin induces insulin-like signaling that antagonizes cAMP elevation by glucagon in hepatocytes. J. Biol. Chem. 2000, 275, 11348–11354. [Google Scholar] [CrossRef] [Green Version]
- Gordeladze, J.O.; Drevon, C.A.; Syversen, U.; Reseland, J.E. Leptin stimulates human osteoblastic cell proliferation, de novo collagen synthesis, and mineralization: Impact on differentiation markers, apoptosis, and osteoclastic signaling. J. Cell. Biochem. 2002, 85, 825–836. [Google Scholar] [CrossRef] [PubMed]
- Luo, X.H.; Guo, L.J.; Xie, H.; Yuan, L.Q.; Wu, X.P.; Zhou, H.D.; Liao, E.Y. Adiponectin stimulates RANKL and inhibits OPG expression in human osteoblasts through the MAPK signaling pathway. J. Bone Miner. Res. 2006, 21, 1648–1656. [Google Scholar] [CrossRef]
- Thommesen, L.; Stunes, A.K.; Monjo, M.; Grøsvik, K.; Tamburstuen, M.V.; Kjøbli, E.; Lyngstadaas, S.P.; Reseland, J.E.; Syversen, U. Expression and regulation of resistin in osteoblasts and osteoclasts indicate a role in bone metabolism. J. Cell. Biochem. 2006, 99, 824–834. [Google Scholar] [CrossRef]
- Xie, H.; Tang, S.Y.; Luo, X.H.; Huang, J.; Cui, R.R.; Yuan, L.Q.; Zhou, H.D.; Wu, X.P.; Liao, E.Y. Insulin-like effects of visfatin on human osteoblasts. Calcif. Tissue Int. 2007, 80, 201–210. [Google Scholar] [CrossRef]
- Tam, E.M.; Yu, F.W.; Hung, V.W.; Liu, Z.; Liu, K.L.; Ng, B.K.; Lee, S.K.; Qiu, Y.; Cheng, J.C.; Lam, T.P. Are volumetric bone mineral density and bone micro-architecture associated with leptin and soluble leptin receptor levels in adolescent idiopathic scoliosis?--A case-control study. PLoS ONE 2014, 9, e87939. [Google Scholar] [CrossRef] [Green Version]
- Yamauchi, T.; Kamon, J.; Waki, H.; Terauchi, Y.; Kubota, N.; Hara, K.; Mori, Y.; Ide, T.; Murakami, K.; Tsuboyama-Kasaoka, N.; et al. The fat-derived hormone adiponectin reverses insulin resistance associated with both lipoatrophy and obesity. Nat. Med. 2001, 7, 941–946. [Google Scholar] [CrossRef]
- Arita, Y.; Kihara, S.; Ouchi, N.; Takahashi, M.; Maeda, K.; Miyagawa, J.; Hotta, K.; Shimomura, I.; Nakamura, T.; Miyaoka, K.; et al. Paradoxical decrease of an adipose-specific protein, adiponectin, in obesity. Biochem. Biophys. Res. Commun. 1999, 257, 79–83. [Google Scholar] [CrossRef] [PubMed]
- Zhang, H.Q.; Wang, L.J.; Liu, S.H.; Li, J.; Xiao, L.G.; Yang, G.T. Adiponectin regulates bone mass in AIS osteopenia via RANKL/OPG and IL6 pathway. J. Transl. Med. 2019, 17, 64. [Google Scholar] [CrossRef] [PubMed] [Green Version]
- Rajala, M.W.; Qi, Y.; Patel, H.R.; Takahashi, N.; Banerjee, R.; Pajvani, U.B.; Sinha, M.K.; Gingerich, R.L.; Scherer, P.E.; Ahima, R.S. Regulation of resistin expression and circulating levels in obesity, diabetes, and fasting. Diabetes 2004, 53, 1671–1679. [Google Scholar] [CrossRef] [PubMed] [Green Version]
- Benomar, Y.; Taouis, M. Molecular Mechanisms Underlying Obesity-Induced Hypothalamic Inflammation and Insulin Resistance: Pivotal Role of Resistin/TLR4 Pathways. Front. Endocrinol. 2019, 10, 140. [Google Scholar] [CrossRef] [PubMed] [Green Version]
- Nourbakhsh, M.; Nourbakhsh, M.; Gholinejad, Z.; Razzaghy-Azar, M. Visfatin in obese children and adolescents and its association with insulin resistance and metabolic syndrome. Scand. J. Clin. Lab. Invest. 2015, 75, 183–188. [Google Scholar] [CrossRef]
- Otero, M.; Lago, R.; Gomez, R.; Lago, F.; Dieguez, C.; Gómez-Reino, J.J.; Gualillo, O. Changes in plasma levels of fat-derived hormones adiponectin, leptin, resistin and visfatin in patients with rheumatoid arthritis. Ann. Rheum. Dis. 2006, 65, 1198–1201. [Google Scholar] [CrossRef] [Green Version]
- Murphy, K.G.; Bloom, S.R. Gut hormones and the regulation of energy homeostasis. Nature 2006, 444, 854–859. [Google Scholar] [CrossRef]
- Holst, J.J.; Deacon, C.F.; Vilsboll, T.; Krarup, T.; Madsbad, S. Glucagon-like peptide-1, glucose homeostasis and diabetes. Trends Mol. Med. 2008, 14, 161–168. [Google Scholar] [CrossRef]
- Mabilleau, G.; Mieczkowska, A.; Irwin, N.; Flatt, P.R.; Chappard, D. Optimal bone mechanical and material properties require a functional glucagon-like peptide-1 receptor. J. Endocrinol. 2013, 219, 59–68. [Google Scholar] [CrossRef] [Green Version]
- Clowes, J.A.; Khosla, S.; Eastell, R. Potential role of pancreatic and enteric hormones in regulating bone turnover. J. Bone Miner. Res. 2005, 20, 1497–1506. [Google Scholar] [CrossRef]
- Xiao, L.; Zhang, H.; Wang, Y.; Li, J.; Yang, G.; Wang, L.; Liang, Z. Dysregulation of the ghrelin/RANKL/OPG pathway in bone mass is related to AIS osteopenia. Bone 2020, 134, 115291. [Google Scholar] [CrossRef] [PubMed]
- Sun, Z.J.; Jia, H.M.; Qiu, G.X.; Zhou, C.; Guo, S.; Zhang, J.G.; Shen, J.X.; Zhao, Y.; Zou, Z.M. Identification of candidate diagnostic biomarkers for adolescent idiopathic scoliosis using UPLC/QTOF-MS analysis: A first report of lipid metabolism profiles. Sci. Rep. 2016, 6, 22274. [Google Scholar] [CrossRef] [Green Version]
- Bjure, J.; Grimby, G.; Nachemson, A. Correction of body height in predicting spirometric values in scoliotic patients. Scand. J. Clin. Lab. Invest. 1968, 21, 191–192. [Google Scholar] [CrossRef] [PubMed]
- ISCD. Skeletal Health Assessment in Children from Infancy to Adolescence. Available online: https://iscd.org/learn/official-positions/pediatric-positions/ (accessed on 30 August 2021).
- VanItallie, T.B.; Yang, M.U.; Heymsfield, S.B.; Funk, R.C.; Boileau, R.A. Height-normalized indices of the body’s fat-free mass and fat mass: Potentially useful indicators of nutritional status. Am. J. Clin. Nutr. 1990, 52, 953–959. [Google Scholar] [CrossRef] [PubMed] [Green Version]
- Goulet, J.; Nadeau, G.; Lapointe, A.; Lamarche, B.; Lemieux, S. Validity and reproducibility of an interviewer-administered food frequency questionnaire for healthy French-Canadian men and women. Nutr. J. 2004, 3, 13. [Google Scholar] [CrossRef] [Green Version]
- Government of Canada. Dietary Reference Intakes Tables. Available online: https://www.canada.ca/en/health-canada/services/food-nutrition/healthy-eating/dietary-reference-intakes/tables.html (accessed on 6 April 2021).
- Bae, S.H.; Goh, T.S.; Kim, D.S.; Lee, J.S. Leptin in adolescent idiopathic scoliosis—A meta-analysis. J. Clin. Neurosci. 2020, 71, 124–128. [Google Scholar] [CrossRef]
- Maffei, M.; Halaas, J.; Ravussin, E.; Pratley, R.E.; Lee, G.H.; Zhang, Y.; Fei, H.; Kim, S.; Lallone, R.; Ranganathan, S.; et al. Leptin levels in human and rodent: Measurement of plasma leptin and ob RNA in obese and weight-reduced subjects. Nat. Med. 1995, 1, 1155–1161. [Google Scholar] [CrossRef]
- Demerath, E.W.; Schubert, C.M.; Maynard, L.M.; Sun, S.S.; Chumlea, W.C.; Pickoff, A.; Czerwinski, S.A.; Towne, B.; Siervogel, R.M. Do changes in body mass index percentile reflect changes in body composition in children? Data from the Fels Longitudinal Study. Pediatrics 2006, 117, e487–e495. [Google Scholar] [CrossRef] [Green Version]
- Rubin, D.A.; McMurray, R.G.; Harrell, J.S.; Thorpe, D.E.; Hackney, A.C. Vigorous physical activity and cytokines in adolescents. Eur. J. Appl. Physiol. 2008, 103, 495–500. [Google Scholar] [CrossRef]
- Owecki, M.; Miczke, A.; Nikisch, E.; Pupek-Musialik, D.; Sowiński, J. Serum resistin concentrations are higher in human obesity but independent from insulin resistance. Exp. Clin. Endocrinol. Diabetes 2011, 119, 117–121. [Google Scholar] [CrossRef]
- Geyikli, I.; Keskin, M.; Kör, Y.; Akan, M. Increased resistin serum concentrations in patientswith type 1 diabetes mellitus. J. Clin. Res. Pediatr. Endocrinol. 2013, 5, 189–193. [Google Scholar] [CrossRef] [PubMed]
- Walcher, D.; Hess, K.; Berger, R.; Aleksic, M.; Heinz, P.; Bach, H.; Durst, R.; Hausauer, A.; Hombach, V.; Marx, N. Resistin: A newly identified chemokine for human CD4-positive lymphocytes. Cardiovasc. Res. 2010, 85, 167–174. [Google Scholar] [CrossRef] [PubMed]
- Akoume, M.Y.; Elbakry, M.; Veillette, M.; Franco, A.; Nada, D.; Labelle, H.; Mac-Thiong, J.M.; Grimard, G.; Ouellet, J.; Parent, S.; et al. A Differential Hypofunctionality of Gαi Proteins Occurs in Adolescent Idiopathic Scoliosis and Correlates with the Risk of Disease Progression. Sci. Rep. 2019, 9, 10074. [Google Scholar] [CrossRef] [PubMed] [Green Version]
- Araki, S.; Dobashi, K.; Kubo, K.; Kawagoe, R.; Yamamoto, Y.; Kawada, Y.; Asayama, K.; Shirahata, A. Plasma visfatin concentration as a surrogate marker for visceral fat accumulation in obese children. Obesity 2008, 16, 384–388. [Google Scholar] [CrossRef] [PubMed]
- Gortan Cappellari, G.; Barazzoni, R. Ghrelin forms in the modulation of energy balance and metabolism. Eat. Weight Disord. 2019, 24, 997–1013. [Google Scholar] [CrossRef] [PubMed]
- Ferron, M.; Wei, J.; Yoshizawa, T.; Del Fattore, A.; DePinho, R.A.; Teti, A.; Ducy, P.; Karsenty, G. Insulin signaling in osteoblasts integrates bone remodeling and energy metabolism. Cell 2010, 142, 296–308. [Google Scholar] [CrossRef] [Green Version]
- Lee, N.K.; Sowa, H.; Hinoi, E.; Ferron, M.; Ahn, J.D.; Confavreux, C.; Dacquin, R.; Mee, P.J.; McKee, M.D.; Jung, D.Y.; et al. Endocrine regulation of energy metabolism by the skeleton. Cell 2007, 130, 456–469. [Google Scholar] [CrossRef] [Green Version]
- Ferron, M.; Hinoi, E.; Karsenty, G.; Ducy, P. Osteocalcin differentially regulates beta cell and adipocyte gene expression and affects the development of metabolic diseases in wild-type mice. Proc. Natl. Acad. Sci. USA 2008, 105, 5266–5270. [Google Scholar] [CrossRef] [Green Version]
- Ferron, M.; McKee, M.D.; Levine, R.L.; Ducy, P.; Karsenty, G. Intermittent injections of osteocalcin improve glucose metabolism and prevent type 2 diabetes in mice. Bone 2012, 50, 568–575. [Google Scholar] [CrossRef] [Green Version]
- Mizokami, A.; Yasutake, Y.; Gao, J.; Matsuda, M.; Takahashi, I.; Takeuchi, H.; Hirata, M. Osteocalcin induces release of glucagon-like peptide-1 and thereby stimulates insulin secretion in mice. PLoS ONE 2013, 8, e57375. [Google Scholar] [CrossRef]
- Kulis, A.; Gozdzialska, A.; Drag, J.; Jaskiewicz, J.; Knapik-Czajka, M.; Lipik, E.; Zarzycki, D. Participation of sex hormones in multifactorial pathogenesis of adolescent idiopathic scoliosis. Int. Orthop. 2015, 39, 1227–1236. [Google Scholar] [CrossRef] [PubMed]
- Cheng, J.C.; Qin, L.; Cheung, C.S.; Sher, A.H.; Lee, K.M.; Ng, S.W.; Guo, X. Generalized low areal and volumetric bone mineral density in adolescent idiopathic scoliosis. J. Bone Miner. Res. 2000, 15, 1587–1595. [Google Scholar] [CrossRef] [PubMed]
- Pourabbas Tahvildari, B.; Erfani, M.A.; Nouraei, H.; Sadeghian, M. Evaluation of bone mineral status in adolescent idiopathic scoliosis. Clin. Orthop. Surg. 2014, 6, 180–184. [Google Scholar] [CrossRef] [PubMed] [Green Version]
- Li, X.; Hung, V.W.Y.; Yu, F.W.P.; Hung, A.L.H.; Ng, B.K.W.; Cheng, J.C.Y.; Lam, T.P.; Yip, B.H.K. Persistent low-normal bone mineral density in adolescent idiopathic scoliosis with different curve severity: A longitudinal study from presentation to beyond skeletal maturity and peak bone mass. Bone 2020, 133, 115217. [Google Scholar] [CrossRef]
- Normand, E.; Franco, A.; Marcil, V. Nutrition and physical activity level of adolescents with idiopathic scoliosis: A narrative review. Spine J. 2019. [Google Scholar] [CrossRef]
- Lee, W.T.; Cheung, C.S.; Tse, Y.K.; Guo, X.; Qin, L.; Lam, T.P.; Ng, B.K.; Cheng, J.C. Association of osteopenia with curve severity in adolescent idiopathic scoliosis: A study of 919 girls. Osteoporos. Int. 2005, 16, 1924–1932. [Google Scholar] [CrossRef]
- Yu, W.S.; Chan, K.Y.; Yu, F.W.; Ng, B.K.; Lee, K.M.; Qin, L.; Lam, T.P.; Cheng, J.C. Bone structural and mechanical indices in Adolescent Idiopathic Scoliosis evaluated by high-resolution peripheral quantitative computed tomography (HR-pQCT). Bone 2014, 61, 109–115. [Google Scholar] [CrossRef]
- Cheuk, K.Y.; Zhu, T.Y.; Yu, F.W.; Hung, V.W.; Lee, K.M.; Qin, L.; Cheng, J.C.; Lam, T.P. Abnormal Bone Mechanical and Structural Properties in Adolescent Idiopathic Scoliosis: A Study with Finite Element Analysis and Structural Model Index. Calcif. Tissue Int. 2015, 97, 343–352. [Google Scholar] [CrossRef]
- Snyder, B.D.; Zaltz, I.; Breitenbach, M.A.; Kido, T.H.; Myers, E.R.; Emans, J.B. Does bracing affect bone density in adolescent scoliosis? Spine 1995, 20, 1554–1560. [Google Scholar] [CrossRef]
- Michaliszyn, S.F.; Lee, S.; Bacha, F.; Tfayli, H.; Farchoukh, L.; Mari, A.; Ferrannini, E.; Arslanian, S. Differences in beta-cell function and insulin secretion in Black vs. White obese adolescents: Do incretin hormones play a role? Pediatr. Diabetes 2017, 18, 143–151. [Google Scholar] [CrossRef]
- Oh, T.J.; Kim, M.Y.; Shin, J.Y.; Lee, J.C.; Kim, S.; Park, K.S.; Cho, Y.M. The incretin effect in Korean subjects with normal glucose tolerance or type 2 diabetes. Clin. Endocrinol. 2014, 80, 221–227. [Google Scholar] [CrossRef] [PubMed]
- Sun, E.W.; Martin, A.M.; Wattchow, D.A.; de Fontgalland, D.; Rabbitt, P.; Hollington, P.; Young, R.L.; Keating, D.J. Metformin Triggers PYY Secretion in Human Gut Mucosa. J. Clin. Endocrinol. Metab. 2019, 104, 2668–2674. [Google Scholar] [CrossRef] [PubMed]
- Tripathi, T.; Gupta, P.; Rai, P.; Sharma, J.; Gupta, V.K.; Singh, N. Osteocalcin and serum insulin-like growth factor-1 as biochemical skeletal maturity indicators. Prog. Orthod. 2017, 18, 30. [Google Scholar] [CrossRef] [PubMed] [Green Version]
- Wewer Albrechtsen, N.J.; Asmar, A.; Jensen, F.; Torang, S.; Simonsen, L.; Kuhre, R.E.; Asmar, M.; Veedfald, S.; Plamboeck, A.; Knop, F.K.; et al. A sandwich ELISA for measurement of the primary glucagon-like peptide-1 metabolite. Am. J. Physiol. Endocrinol. Metab. 2017, 313, E284–E291. [Google Scholar] [CrossRef] [Green Version]
- Yang, H.; Liu, H.; Jiao, Y.; Qian, J. Roux-en-Y Gastrointestinal Bypass Promotes Activation of TGR5 and Peptide YY. Endocr. Metab. Immune Disord. Drug Targets 2020, 20, 1262–1267. [Google Scholar] [CrossRef]
- Reverter-Branchat, G.; Eugster, P.J.; Kuenzli, C.; Rindlisbacher, B.; Stauffer, T.; Nakas, C.T.; Herzig, D.; Grouzmann, E.; Bally, L. Multiplexed Assay to Quantify the PP-Fold Family of Peptides in Human Plasma Using Microflow Liquid Chromatography-Tandem Mass Spectrometry. Clin. Chem. 2022, 68, 584–594. [Google Scholar] [CrossRef] [PubMed]
- Villano, D.; Zafrilla, P.; Garcia-Viguera, C.; Dominguez-Perles, R. A UHPLC/MS/MS method for the analysis of active and inactive forms of GLP-1 and GIP incretins in human plasma. Talanta 2022, 236, 122806. [Google Scholar] [CrossRef]
- Lawler, K.; Huang-Doran, I.; Sonoyama, T.; Collet, T.H.; Keogh, J.M.; Henning, E.; O’Rahilly, S.; Bottolo, L.; Farooqi, I.S. Leptin-Mediated Changes in the Human Metabolome. J. Clin. Endocrinol. Metab. 2020, 105, 2541–2552. [Google Scholar] [CrossRef]


| Controls (n = 19) | AIS (n = 19) | p Value 1 | |
|---|---|---|---|
| Family history of AIS (%) | 0 | 63 | <0.0001 * |
| Age (years) | 14.8 ± 2.1 | 14.8 ± 1.7 | 0.924 |
| Age at diagnosis (years) | - | 13.0 ± 1.7 | - |
| Highest Cobb angle (°) | - | 27.1 ± 10.5 | - |
| Risser score | - | 2.8 ± 1.8 | - |
| Age of menarche (years) | 12.0 (9.0–15.0) | 12.5 (11.0–14.0) | 0.969 |
| Tanner stage (breast) | 3.7 ± 1.0 | 3.4 ± 1.0 | 0.350 |
| Tanner stage (pubic hair) | 3.6 ± 1.1 | 3.3 ± 0.8 | 0.310 |
| Height (cm) | 160.8 ± 9.9 | 164.2± 9.3 | 0.142 |
| Height-for-age (z-score) | 0.33 ± 1.01 | 0.60 ± 1.14 | 0.419 |
| Weight (kg) | 54.2 ± 12.9 | 50.3 ± 9.0 | 0.158 |
| BMI (kg/m2) | 20.6 ± 3.6 | 18.5 ± 1.9 | 0.013 * |
| BMI-for-age (z-score) | 0.09 ± 1.11 | −0.59 ± 0.81 | 0.016 * |
| Waist circumference (cm) | 76.0 ± 9.1 | 71.9 ± 5.6 | 0.055 |
| Waist-to-height ratio | 0.47 ± 0.04 | 0.44 ± 0.03 | 0.009 * |
| Controls (n = 17) | AIS (n = 17) | p Value 1 | |
|---|---|---|---|
| BMD total body less head (z-score) | 0.32 ± 0.88 | −0.41 ± 0.80 | 0.044 * |
| BMC total body less head (g) | 1798.1 ± 414.6 | 1666.9 ± 293.9 | 0.286 |
| BMD lumbar spine (z-score) | −0.11 ± 0.87 | −0.48 ± 0.93 | 0.241 |
| BMD femoral neck (z-score) | 0.59 ± 1.59 | −0.54 ± 1.20 | 0.043 * |
| Fat (%) | 29.2 ± 7.2 | 24.4 ± 5.9 | 0.036 * |
| Fat mass (g) | 15676.1 ± 6106.9 | 12064.1 ± 3929.8 | 0.024 * |
| Fat mass index (g/m2) | 0.59 ± 0.21 | 0.44 ± 0.13 | 0.007 * |
| Lean mass (g) | 36558.5 ± 6466.2 | 36912.3 ± 5578.1 | 0.865 |
| Lean mass index (g/m2) | 1.40 ± 0.18 | 1.33 ± 0.11 | 0.273 |
| Controls (n = 19) | AIS (n = 19) | p Value 1 | |
|---|---|---|---|
| Caloric intake (kcal/day) | 2026.6 ± 599.2 | 2058.1 ± 463.4 | 0.868 |
| Estimated energy requirement (kcal/day) | 2063. 6 ± 341.8 | 1881.0 ± 221.2 | 0.066 |
| Energy balance (%) | 99.6 ± 28.9 | 109.1 ± 19.3 | 0.250 |
| Energy balance (kcal/day) | −36.9 ± 640.6 | 193.5 ± 360.1 | 0.178 |
| Moderate-to-intense physical activity (hrs/week) | 5.3 (0.3–15.0) | 0.8 (0.0–15.0) | 0.005 * |
| Screen time (hrs/day) | 2.5 (1.0–6.0) | 4.5 (1.5–10.0) | 0.006 * |
| Number of Pairs (n) | Controls | AIS | p Value 1 | |
|---|---|---|---|---|
| Glucose (mmol/L) | 19 | 4.9 (4.4–5.5) | 5.1 (4.5–6.3) | 0.160 |
| Insulin (pmol/mL) | 14 | 58.11 ± 20.14 | 60.01 ± 23.88 | 0.755 |
| HOMA-IR | 14 | 1.8 ± 0.7 | 2.0 ± 1.0 | 0.584 |
| C-peptide (pg/mL) | 17 | 1101 ± 287 | 1181 ± 295 | 0.348 |
| QUICKI | 14 | 0.35 ± 0.02 | 0.35 ± 0.03 | 0.615 |
| Triglycerides (mmol/L) | 19 | 0.75 (0.40–1.22) | 0.70 (0.49–1.42) | 0.868 |
| Cholesterol (mmol/L) | 19 | 3.78 ± 0.49 | 4.06 ± 0.63 | 0.111 |
| HDL-C (mmol/L) | 19 | 1.35 ± 0.20 | 1.36 ± 0.21 | 0.854 |
| LDL-C (mmol/L) | 19 | 2.07 ± 0.40 | 2.35 ± 0.53 | 0.063 |
| ApoB (g/L) | 19 | 0.63 ± 0.13 | 0.71 ± 0.15 | 0.108 |
| ApoA1 | 18 | 1.37 (1.11–1.73) | 1.42 (1.19–1.82) | 0.502 |
| ApoB/ApoA1 | 18 | 0.46 ± 0.10 | 0.50 ± 0.11 | 0.243 |
| Number of Pairs (n) | Controls (n = 19) | AIS (n = 19) | p Value 1 | |
|---|---|---|---|---|
| Leptin (ng/mL) | 16 | 4.6 (1.3–9.8) | 2.8 (0.4–10.3) | 0.083 |
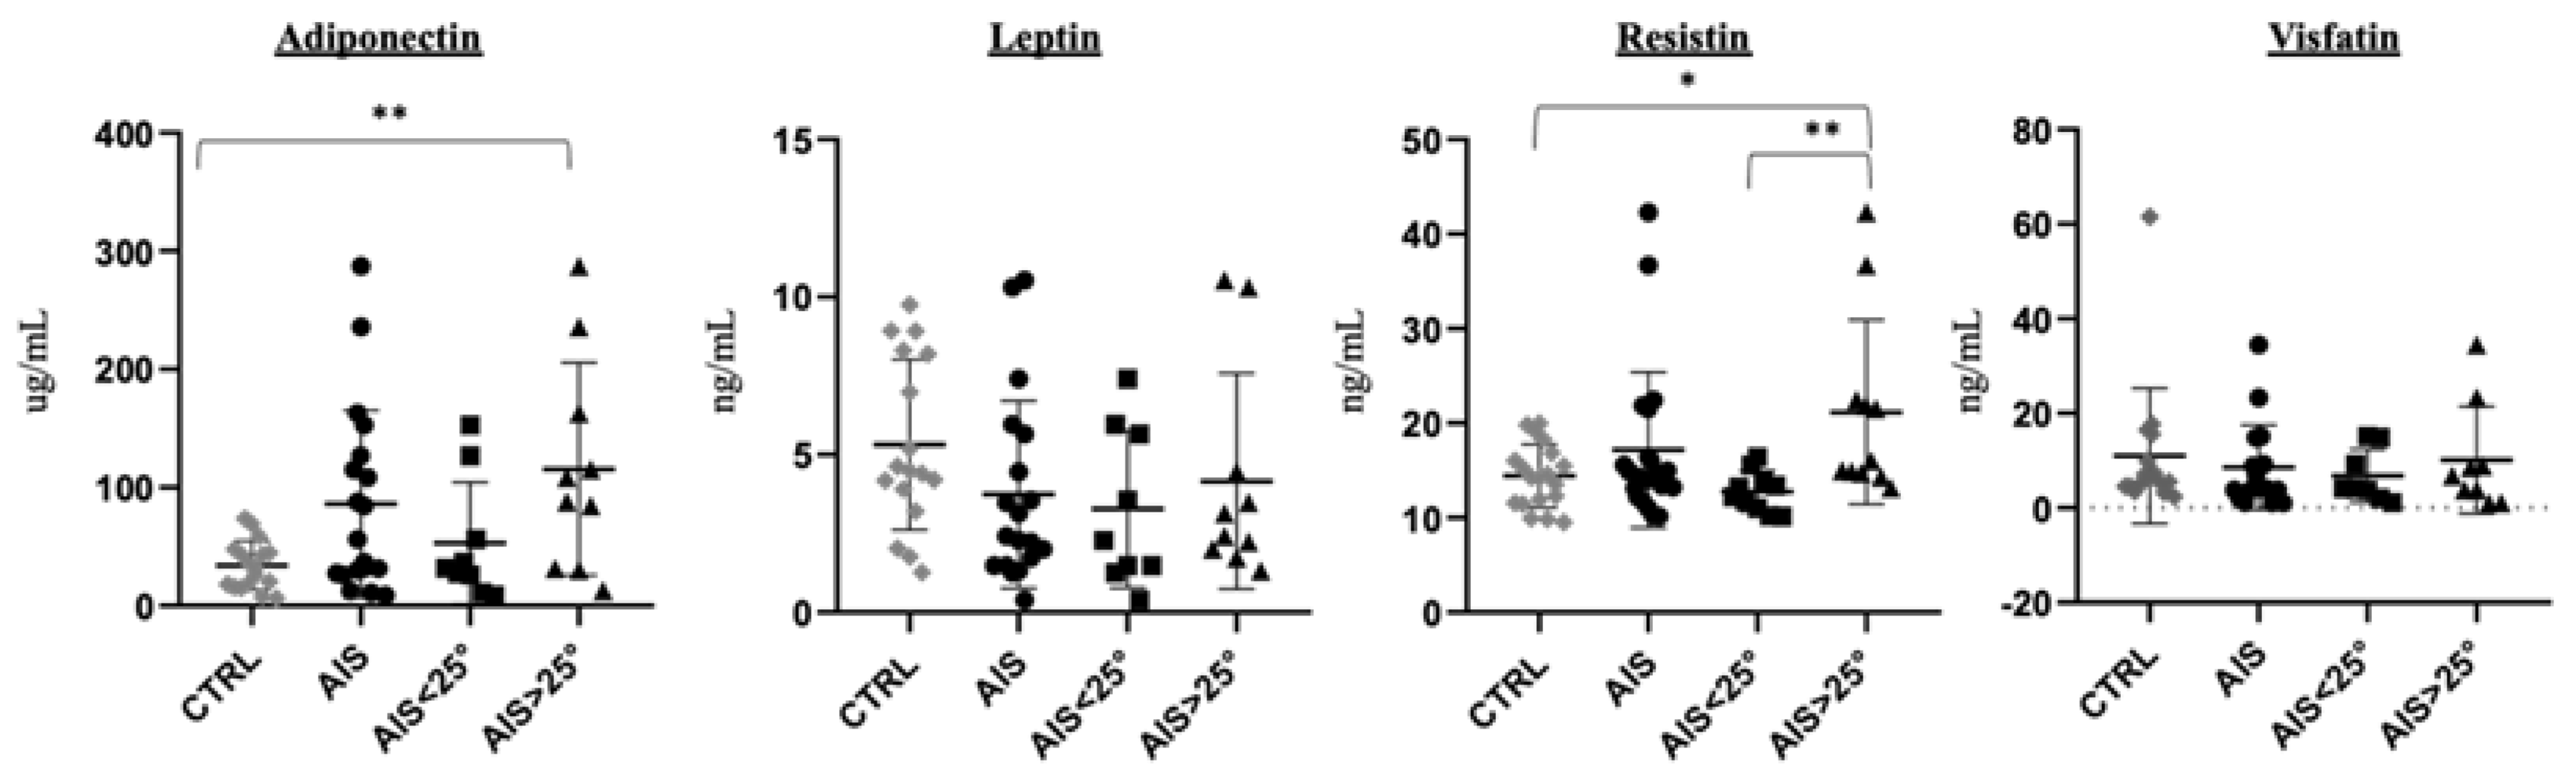
| Adiponectin (μg/mL) | 15 | 26.2 (6.6–73.8) | 84.7 (11.1–287.2) | 0.007 * |
| Leptin/adiponectin ratio | 12 | 0.258 (0.024–1.053) | 0.042 (0.005–0.320) | 0.005 * |
| Resistin (ng/mL) | 19 | 14.29 (9.52–19.98) | 14.90 (10.15–42.29) | 0.358 |
| Visfatin (ng/mL) | 13 | 5.93 (2.40–61.50) | 4.12 (1.00–34.46) | 0.787 |
| Active ghrelin (pg/mL) | 13 | 66.68 ± 39.48 | 81.10 ± 51.06 | 0.357 |
| Total ghrelin (pg/mL) | 19 | 384.5 ± 133.8 | 452.3 ± 265.6 | 0.160 |
| GIP (ng/mL) | 17 | 366.8 (149.4–660.6) | 415.2 (136.4–1408) | 0.182 |
| GLP-1 active (pmol/L) | 17 | 7.59 (5.95–18.71) | 7.63 (6.08–9.06) | 0.678 |
| GLP-1 total (pmol/L) | 19 | 25.33 ± 7.78 | 25.20 ± 10.58 | 0.970 |
| GLP-2 (ng/mL) | 17 | 1.90 ± 0.66 | 2.08 ± 0.65 | 0.460 |
| PYY (pg/mL) | 19 | 88.10 ± 55.99 | 76.38 ± 59.45 | 0.510 |
| DPP-4 activity (pmol/min) | 18 | 580.5 ± 169.0 | 551.8 ± 193.3 | 0.330 |
| OCN total (ng/mL) | 19 | 51.85 ± 14.83 | 46.62 ± 11.83 | 0.237 |
| ucOCN (ng/mL) | 18 | 10.09 (3.05–51.77) | 10.49 (1.73–39.21) | 0.832 |
| ucOCN/OCN ratio (%) | 18 | 28.22 ± 22.95 | 29.16 ± 19.23 | 0.841 |
Publisher’s Note: MDPI stays neutral with regard to jurisdictional claims in published maps and institutional affiliations. |
© 2022 by the authors. Licensee MDPI, Basel, Switzerland. This article is an open access article distributed under the terms and conditions of the Creative Commons Attribution (CC BY) license (https://creativecommons.org/licenses/by/4.0/).
Share and Cite
Normand, E.; Franco, A.; Alos, N.; Parent, S.; Moreau, A.; Marcil, V. Circulatory Adipokines and Incretins in Adolescent Idiopathic Scoliosis: A Pilot Study. Children 2022, 9, 1619. https://doi.org/10.3390/children9111619
Normand E, Franco A, Alos N, Parent S, Moreau A, Marcil V. Circulatory Adipokines and Incretins in Adolescent Idiopathic Scoliosis: A Pilot Study. Children. 2022; 9(11):1619. https://doi.org/10.3390/children9111619
Chicago/Turabian StyleNormand, Emilie, Anita Franco, Nathalie Alos, Stefan Parent, Alain Moreau, and Valérie Marcil. 2022. "Circulatory Adipokines and Incretins in Adolescent Idiopathic Scoliosis: A Pilot Study" Children 9, no. 11: 1619. https://doi.org/10.3390/children9111619