A Machine Learning-Based Multiple Imputation Method for the Health and Aging Brain Study–Health Disparities
Abstract
:1. Introduction
2. Materials and Methods
2.1. Blood Collection and Processing
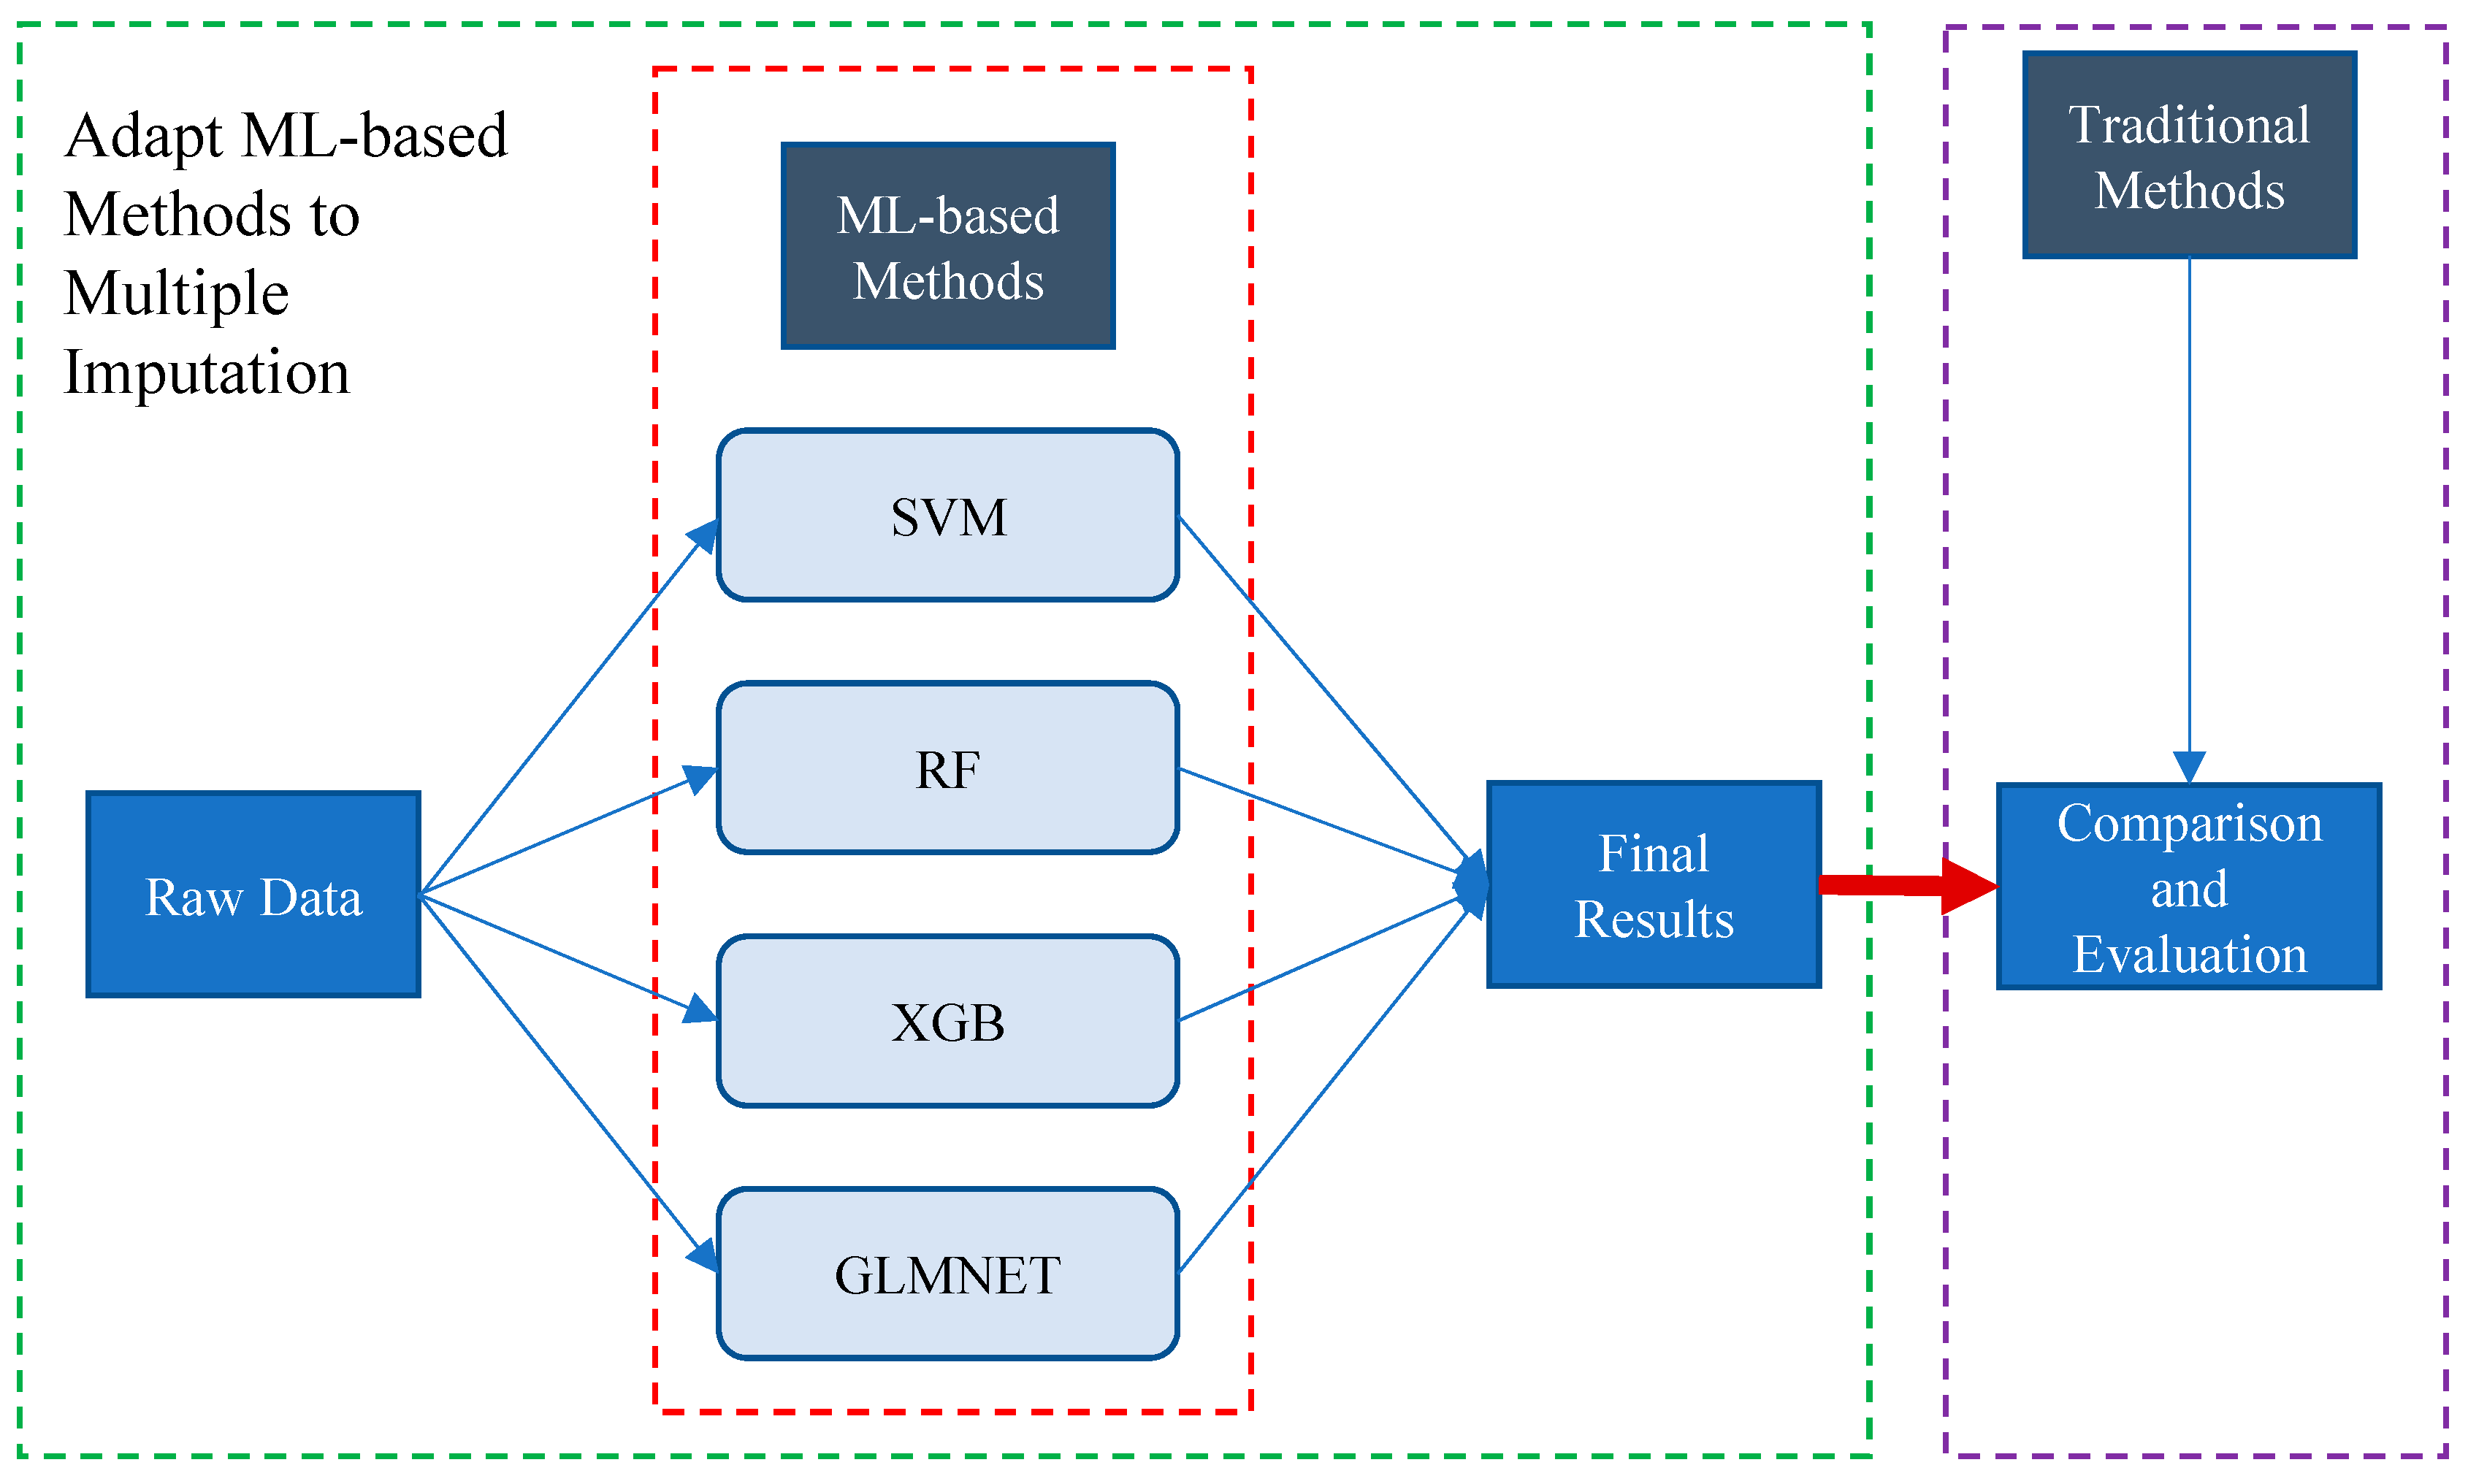
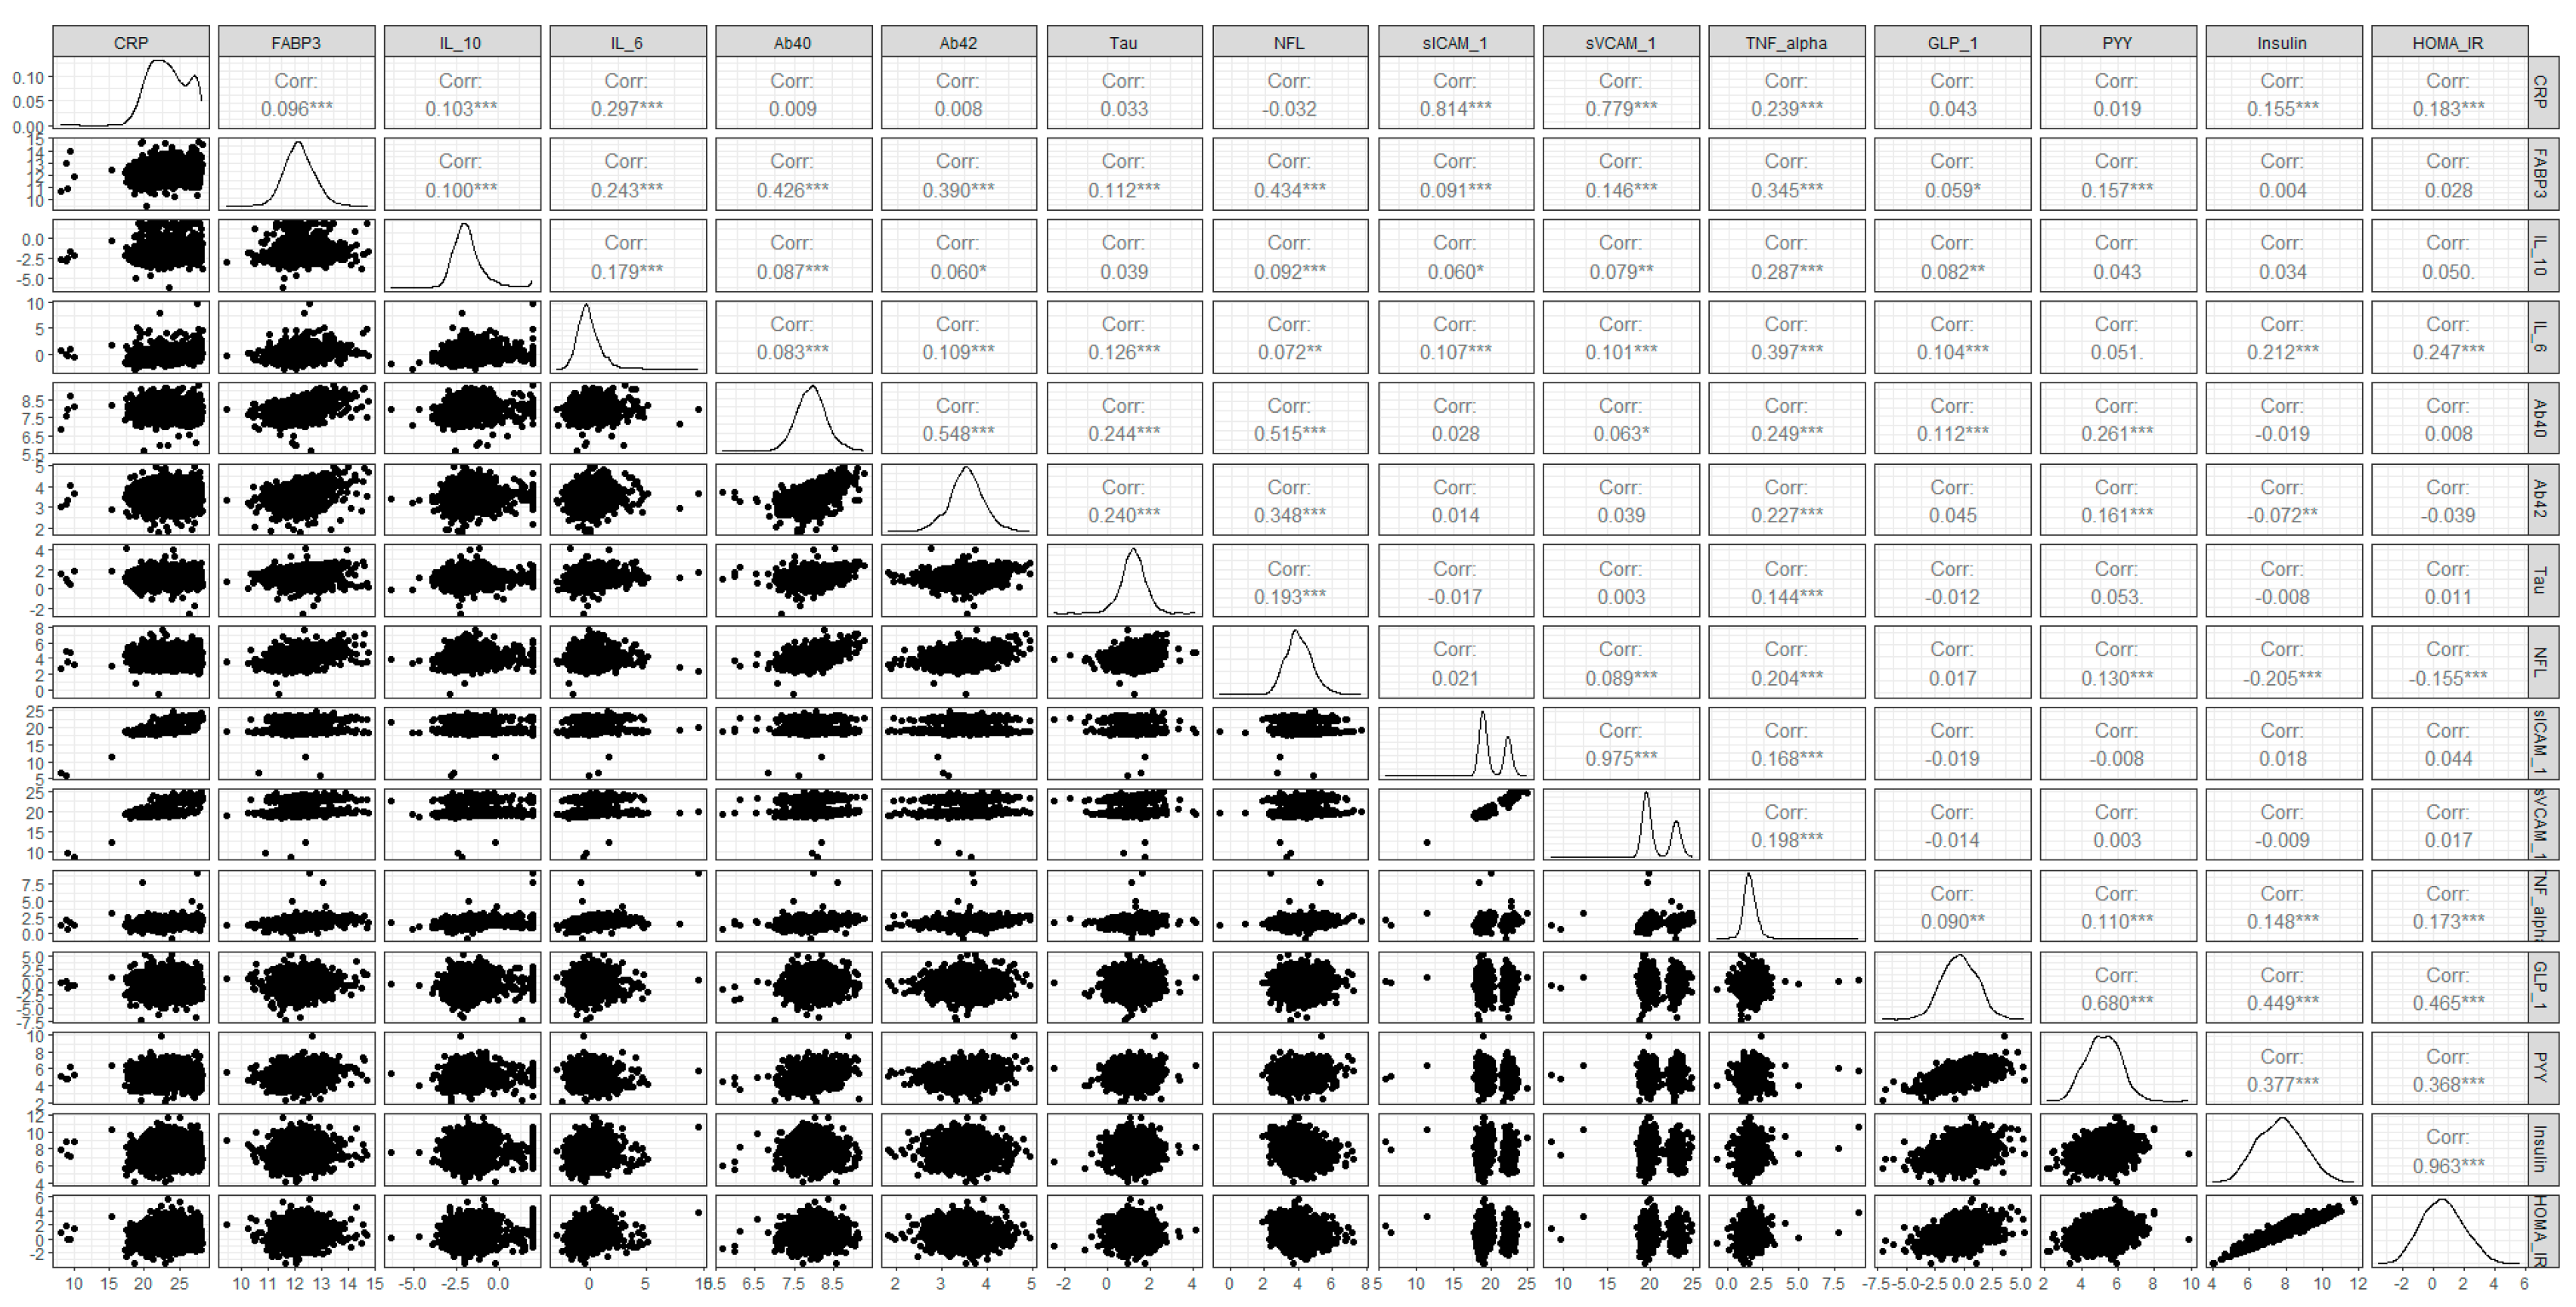
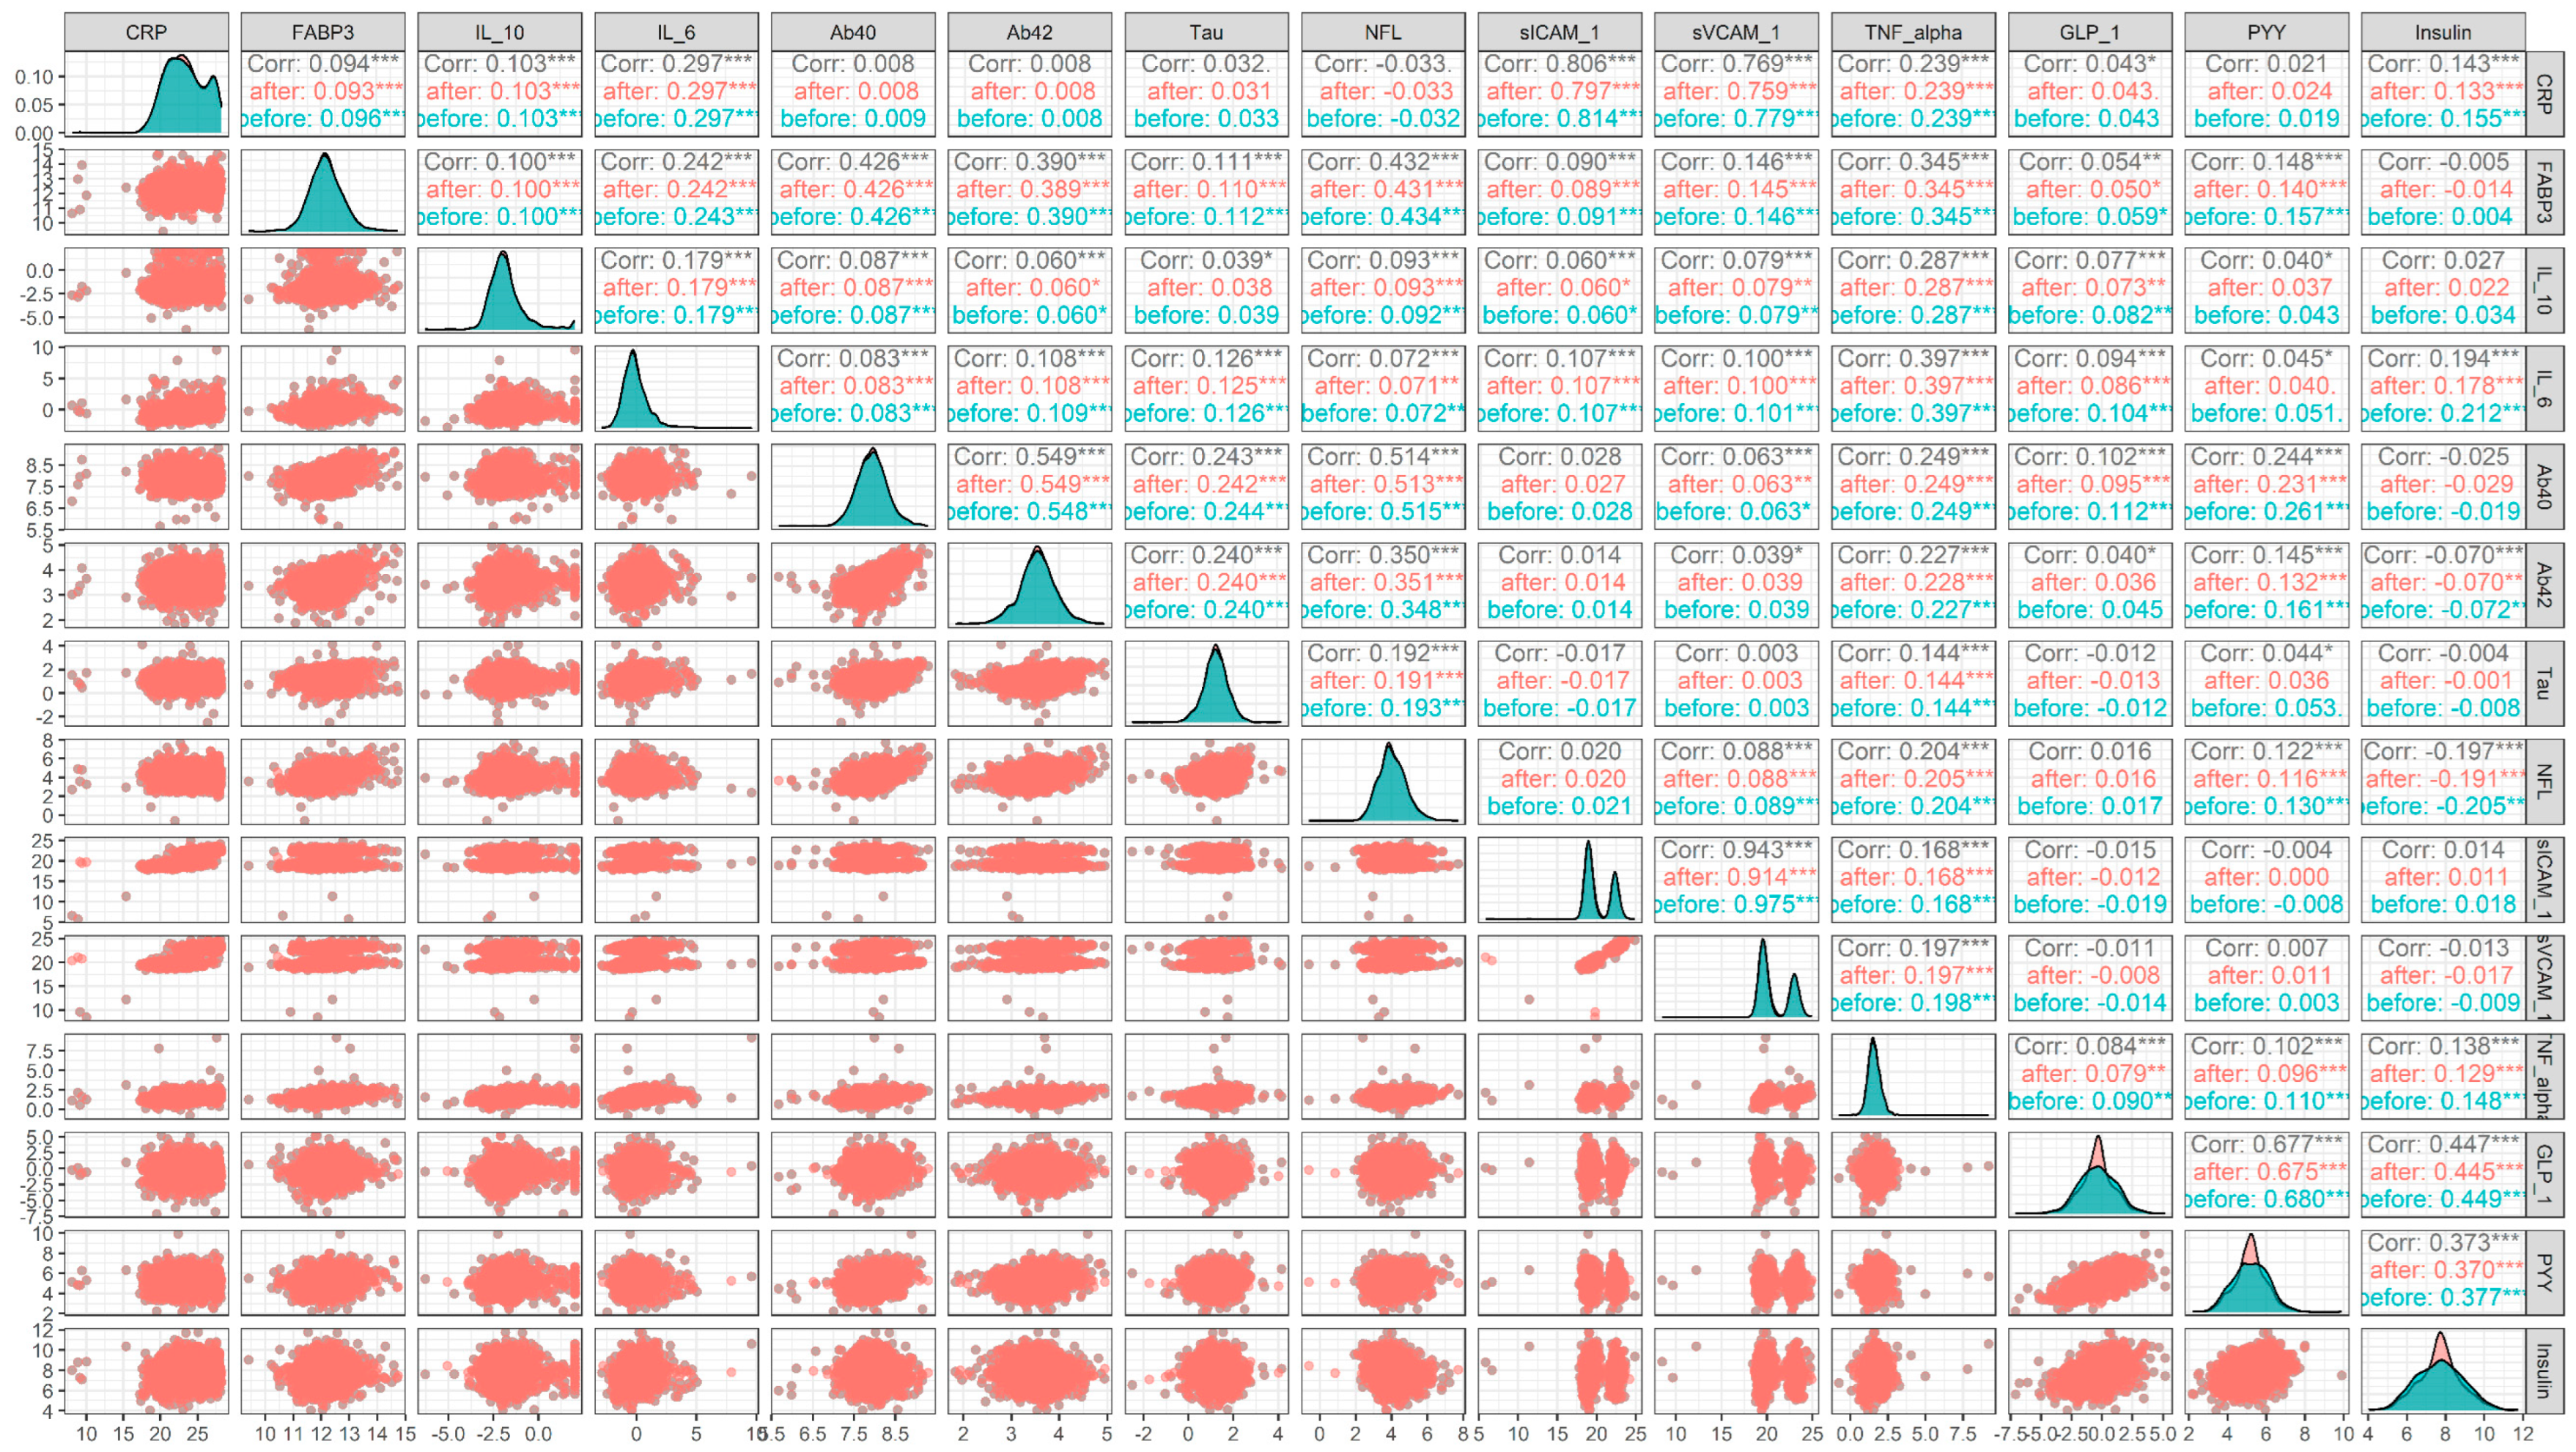
2.2. A Three-Step Workflow to Handle Missing Data in HABS–HD
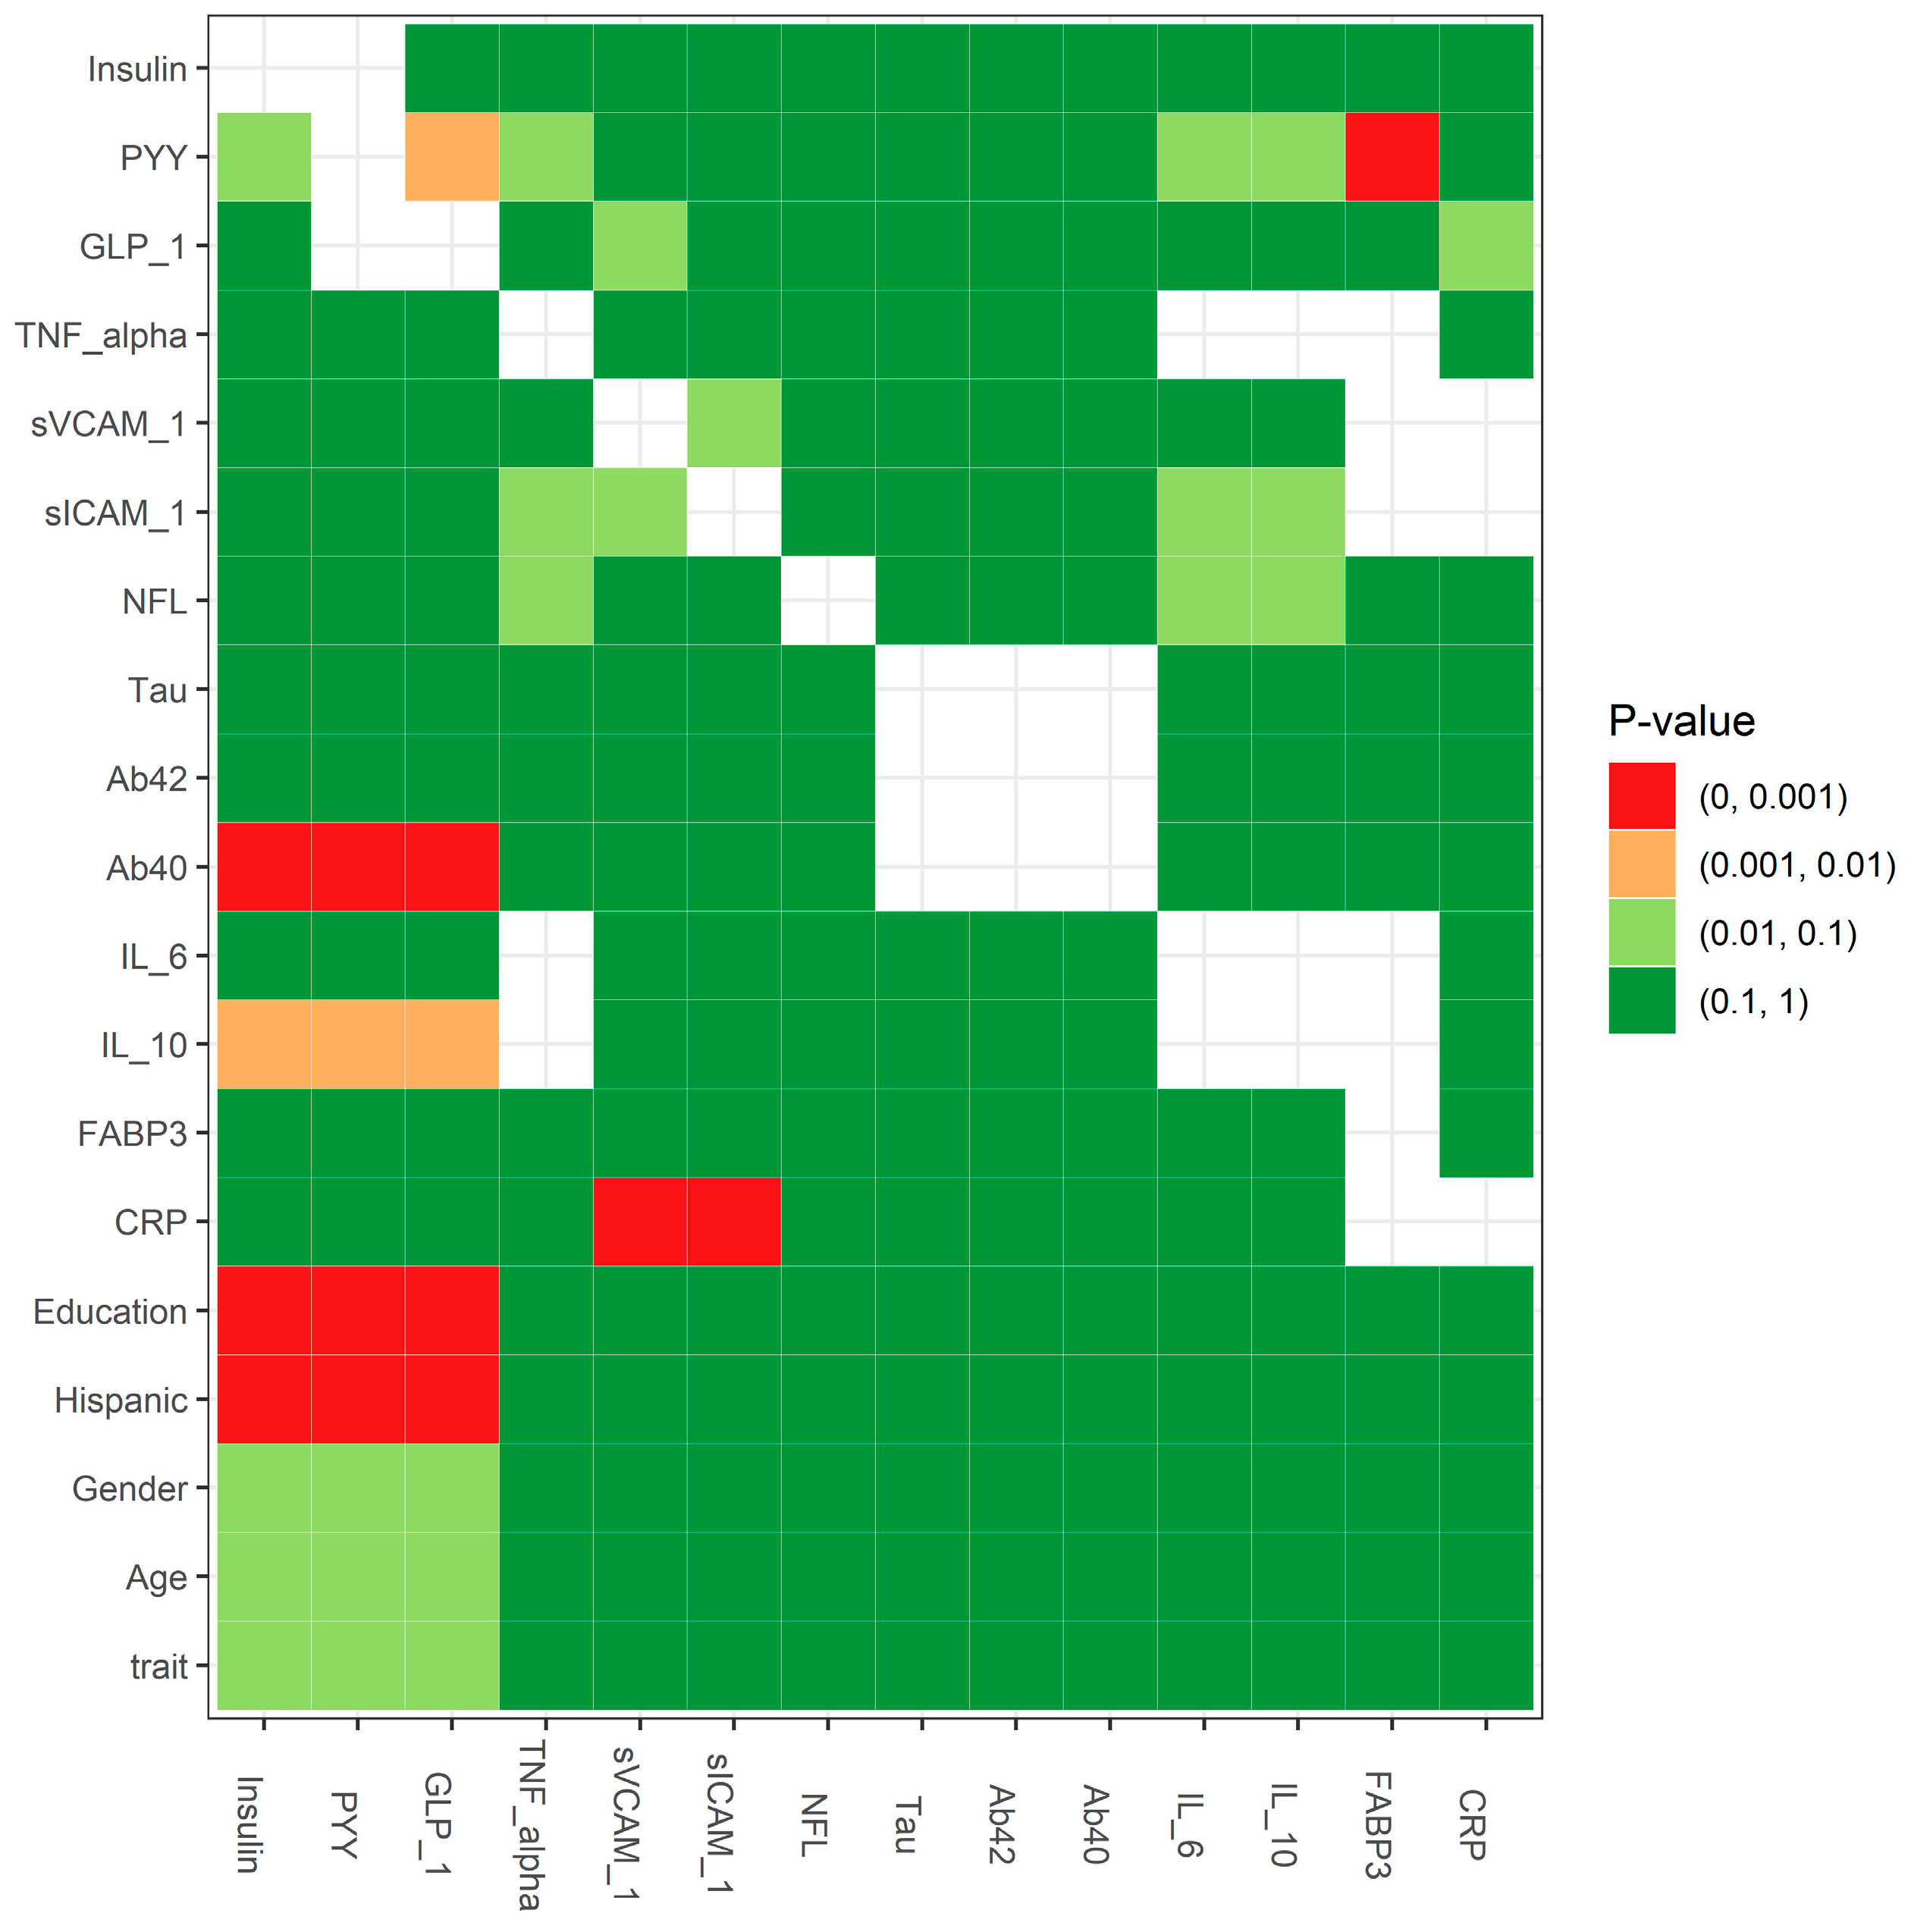
2.3. Statistical Testing for the Missing Mechanism: MCAR Testing
2.4. ML-Based Multiple Imputation (MLMI)
2.5. Performance Measurements
3. Results
4. Discussion
4.1. Reasons for Missing Data in HABS–HD
4.2. Missing Data Mechanisms: MAR, MCAR, and MNAR
4.3. Limitations
4.4. Practical Considerations and Future Improvement
5. Conclusions
Author Contributions
Funding
Institutional Review Board Statement
Informed Consent Statement
Data Availability Statement
Acknowledgments
Conflicts of Interest
References
- Alzheimer’s Association 2022 Alzheimer’s Disease Facts and Figures. Available online: https://www.alz.org/alzheimers-dementia/facts-figures (accessed on 13 February 2023).
- O’Bryant, S.E.; Zhang, F.; Petersen, M.; Hall, J.R.; Johnson, L.A.; Yaffe, K.; Braskie, M.; Vig, R.; Toga, A.W.; Rissman, R.A.; et al. Proteomic Profiles of Neurodegeneration Among Mexican Americans and Non-Hispanic Whites in the HABS-HD Study. J. Alzheimers Dis. 2022, 86, 1243–1254. [Google Scholar] [CrossRef] [PubMed]
- Graham, J.W. Missing data analysis: Making it work in the real world. Annu. Rev. Psychol. 2009, 60, 549–576. [Google Scholar] [CrossRef]
- Schafer, J.L.; Graham, J.W. Missing data: Our view of the state of the art. Psychol. Methods 2002, 7, 147–177. [Google Scholar] [CrossRef] [PubMed]
- Rubin, D.B. Inference and Missing Data. Biometrika 1976, 63, 581–592. [Google Scholar] [CrossRef]
- Enders, C.K. Applied Missing Data Analysis; Guilford Press: New York, NY, USA, 2022; Available online: https://www.guilford.com/books/Applied-Missing-Data-Analysis/Craig-Enders/9781462549863 (accessed on 8 October 2023).
- Little, R.J.A.; Rubin, D.B. Statistical Analysis with Missing Data; Wiley: Hoboken, NJ, USA, 2019. [Google Scholar]
- Rubin, D.B. Multiple Imputation After 18+ Years. J. Am. Stat. Assoc. 1996, 91, 473–489. [Google Scholar] [CrossRef]
- Rubin, D.B. Statistical Matching Using File Concatenation with Adjusted Weights and Multiple Imputations. J. Bus. Econ. Stat. 1986, 4, 87–94. [Google Scholar] [CrossRef]
- Roderick, J.A.L. Missing-Data Adjustments in Large Surveys. J. Bus. Econ. Stat. 1988, 6, 287–296. [Google Scholar] [CrossRef]
- Marshall, A.; Altman, D.G.; Holder, R.L. Comparison of imputation methods for handling missing covariate data when fitting a Cox proportional hazards model: A resampling study. BMC Med. Res. Methodol. 2010, 10, 112. [Google Scholar] [CrossRef]
- Marshall, A.; Altman, D.G.; Royston, P.; Holder, R.L. Comparison of techniques for handling missing covariate data within prognostic modelling studies: A simulation study. BMC Med. Res. Methodol. 2010, 10, 7. [Google Scholar] [CrossRef]
- Mirza, B.; Wang, W.; Wang, J.; Choi, H.; Chung, N.C.; Ping, P. Machine Learning and Integrative Analysis of Biomedical Big Data. Genes 2019, 10, 87. [Google Scholar] [CrossRef]
- Breiman, L.; Freidman, J.H.; Olshen, R.A.; Stone, C.J. CART: Classification and Regression Trees; Routledge: New York, NY, USA, 1984. [Google Scholar]
- Stekhoven, D.J.; Bühlmann, P. MissForest--non-parametric missing value imputation for mixed-type data. Bioinformatics 2012, 28, 112–118. [Google Scholar] [CrossRef] [PubMed]
- Guo, C.Y.; Yang, Y.C.; Chen, Y.H. The Optimal Machine Learning-Based Missing Data Imputation for the Cox Proportional Hazard Model. Front. Public. Health 2021, 9, 680054. [Google Scholar] [CrossRef] [PubMed]
- Wang, H.; Tang, J.; Wu, M.; Wang, X.; Zhang, T. Application of machine learning missing data imputation techniques in clinical decision making: Taking the discharge assessment of patients with spontaneous supratentorial intracerebral hemorrhage as an example. BMC Med. Inform. Decis. Mak. 2022, 22, 13. [Google Scholar] [CrossRef]
- McKhann, G.; Drachman, D.; Folstein, M.; Katzman, R.; Price, D.; Stadlan, E.M. Clinical diagnosis of Alzheimer’s disease: Report of the NINCDS-ADRDA Work Group under the auspices of Department of Health and Human Services Task Force on Alzheimer’s Disease. Neurology 1984, 34, 939–944. [Google Scholar] [CrossRef] [PubMed]
- Cummings, J. Alzheimer’s disease diagnostic criteria: Practical applications. Alzheimers Res. Ther. 2012, 4, 35. [Google Scholar] [CrossRef]
- Blacker, D.; Albert, M.S.; Bassett, S.S.; Go, R.C.; Harrell, L.E.; Folstein, M.F. Reliability and validity of NINCDS-ADRDA criteria for Alzheimer’s disease. The National Institute of Mental Health Genetics Initiative. Arch. Neurol. 1994, 51, 1198–1204. [Google Scholar] [CrossRef]
- O’Bryant, S.E.; Zhang, F.; Petersen, M.; Hall, J.R.; Johnson, L.A.; Yaffe, K.; Mason, D.; Braskie, M.; Barber, R.A.; Rissman, R.A.; et al. A blood screening tool for detecting mild cognitive impairment and Alzheimer’s disease among community-dwelling Mexican Americans and non-Hispanic Whites: A method for increasing representation of diverse populations in clinical research. Alzheimers Dement. 2022, 18, 77–87. [Google Scholar] [CrossRef]
- Zhang, F.; Petersen, M.; Johnson, L.; Hall, J.; O’Bryant, S.E. Combination of Serum and Plasma Biomarkers Could Improve Prediction Performance for Alzheimer’s Disease. Genes 2022, 13, 1738. [Google Scholar] [CrossRef] [PubMed]
- O’Bryant, S.E.; Xiao, G.; Zhang, F.; Edwards, M.; German, D.C.; Yin, X.; Como, T.; Reisch, J.; Huebinger, R.M.; Graff-Radford, N.; et al. Validation of a serum screen for Alzheimer’s disease across assay platforms, species, and tissues. J. Alzheimers Dis. 2014, 42, 1325–1335. [Google Scholar] [CrossRef]
- O’Bryant, S.E.; Edwards, M.; Johnson, L.; Hall, J.; Villarreal, A.E.; Britton, G.B.; Quiceno, M.; Cullum, C.M.; Graff-Radford, N.R. A blood screening test for Alzheimer’s disease. Alzheimers Dement. 2016, 3, 83–90. [Google Scholar] [CrossRef]
- Little, R.J.A. A Test of Missing Completely at Random for Multivariate Data with Missing Values. J. Am. Stat. Assoc. 1988, 83, 1198–1202. [Google Scholar] [CrossRef]
- Available online: https://github.com/microsat2018/figure1 (accessed on 2 October 2023).
- O’Bryant, S.E.; Petersen, M.; Hall, J.R.; Large, S.; Johnson, L.A.; Team, H.-H.S. Plasma Biomarkers of Alzheimer’s Disease Are Associated with Physical Functioning Outcomes Among Cognitively Normal Adults in the Multiethnic HABS-HD Cohort. J. Gerontol. A Biol. Sci. Med. Sci. 2023, 78, 9–15. [Google Scholar] [CrossRef] [PubMed]
- Venugopalan, J.; Tong, L.; Hassanzadeh, H.R.; Wang, M.D. Multimodal deep learning models for early detection of Alzheimer’s disease stage. Sci. Rep. 2021, 11, 3254. [Google Scholar] [CrossRef] [PubMed]


| Step | Action | Main Objective |
|---|---|---|
| 1 | Missing data evaluation | missingness of variables analysis data distribution and correlation analysis missing mechanism testing |
| 2 | Imputation | min, mean, predictive mean matching (PMM) in mice, classification and regression trees (CART) in mice, missForest, and ML-based multiple imputation (MLMI) |
| 3 | Imputation evaluation | performance comparison among different imputation methods comparative analysis for data distribution and simulation evaluation correlation before and after imputation |
| Characteristic | Overall | AD | MCI | NC | p-Value 2 |
|---|---|---|---|---|---|
| N | 1705 1 | 116 1 | 261 1 | 1328 1 | |
| Age | 66.47 (8.75) | 69.62 (9.58) | 66.93 (9.24) | 66.10 (8.51) | 0.002 |
| Gender | <0.001 | ||||
| F | 1034/1705 (61%) | 58/116 (50%) | 129/261 (49%) | 847/1328 (64%) | |
| M | 671/1705 (39%) | 58/116 (50%) | 132/261 (51%) | 481/1328 (36%) | |
| Hispanic | <0.001 | ||||
| Hispanic | 890/1705 (52%) | 67/116 (58%) | 164/261 (63%) | 659/1328 (50%) | |
| Not Hispanic | 815/1705 (48%) | 49/116 (42%) | 97/261 (37%) | 669/1328 (50%) | |
| Education | 12.34 (4.82) | 10.62 (5.35) | 11.41 (4.86) | 12.68 (4.71) | <0.001 |
| CRP | 42,875,365.58 (67,985,315.03) | 31,996,905.71 (60,624,287.52) | 43,972,990.63 (70,617,506.74) | 43,606,283.11 (68,035,930.76) | 0.043 |
| (Missing) | 52 | 4 | 10 | 38 | |
| FABP3 | 5079.65 (2543.46) | 5314.49 (2937.28) | 5465.57 (2902.67) | 4984.40 (2423.31) | 0.033 |
| (Missing) | 49 | 4 | 10 | 35 | |
| IL_10 | 0.43 (0.65) | 0.38 (0.55) | 0.47 (0.71) | 0.42 (0.64) | 0.13 |
| (Missing) | 51 | 5 | 10 | 36 | |
| IL_6 | 1.90 (19.94) | 1.48 (2.04) | 1.53 (2.25) | 2.01 (22.53) | <0.001 |
| (Missing) | 51 | 5 | 10 | 36 | |
| Ab40 | 252.71 (68.40) | 260.73 (83.08) | 258.92 (73.22) | 250.81 (65.93) | 0.38 |
| (Missing) | 73 | 6 | 13 | 54 | |
| Ab42 | 12.07 (3.36) | 11.98 (4.00) | 12.46 (3.57) | 12.00 (3.25) | 0.063 |
| (Missing) | 74 | 6 | 13 | 55 | |
| Tau | 2.48 (1.09) | 2.72 (1.24) | 2.58 (1.65) | 2.44 (0.93) | 0.15 |
| (Missing) | 73 | 6 | 13 | 54 | |
| NFL | 19.35 (13.85) | 28.30 (22.12) | 21.40 (18.39) | 18.18 (11.37) | <0.001 |
| (Missing) | 80 | 7 | 14 | 59 | |
| PPY | 645.76 (483.14) | 769.98 (418.28) | 653.65 (355.85) | 633.74 (507.65) | 0.003 |
| (Missing) | 650 | 46 | 103 | 501 | |
| sICAM_1 | 2,433,486.97 (2,772,190.70) | 2,252,975.50 (3,169,549.76) | 2,419,840.53 (3,191,712.63) | 2,451,832.39 (2,646,899.66) | 0.19 |
| (Missing) | 55 | 4 | 11 | 40 | |
| sVCAM_1 | 3,804,308.06 (4,382,426.22) | 3,692,440.22 (5,141,564.85) | 3,585,681.60 (4,284,327.03) | 3,856,260.88 (4,331,636.05) | 0.97 |
| (Missing) | 55 | 4 | 12 | 39 | |
| TNF_alpha | 3.66 (15.36) | 3.23 (0.99) | 3.33 (1.30) | 3.76 (17.37) | 0.007 |
| (Missing) | 51 | 5 | 10 | 36 | |
| GLP_1 | 1.39 (2.29) | 1.72 (4.21) | 1.36 (1.81) | 1.37 (2.17) | 0.68 |
| (Missing) | 401 | 38 | 67 | 296 | |
| Glucagon | 65.02 (49.68) | 62.22 (40.38) | 67.82 (47.71) | 64.69 (50.69) | 0.47 |
| (Missing) | 448 | 43 | 69 | 336 | |
| PYY | 44.92 (39.20) | 45.62 (31.21) | 42.21 (31.45) | 45.38 (41.03) | 0.41 |
| (Missing) | 399 | 37 | 67 | 295 | |
| Insulin | 300.07 (298.36) | 240.21 (213.12) | 315.04 (354.89) | 301.78 (291.93) | 0.12 |
| (Missing) | 401 | 38 | 67 | 296 | |
| HOMA_IR | 2.47 (3.14) | 1.95 (1.84) | 2.70 (4.44) | 2.46 (2.91) | 0.29 |
| (Missing) | 409 | 41 | 68 | 300 |
| Min | Mean | PMM | CART | missForest | MLMI | |||||||
|---|---|---|---|---|---|---|---|---|---|---|---|---|
| Predicted | AD | NC | AD | NC | AD | NC | AD | NC | AD | NC | AD | NC |
| AD | 14.436 | 79.304 | 14.296 | 76.884 | 15.052 | 77.668 | 14.54 | 76.124 | 14.628 | 79.644 | 15.028 | 74.92 |
| NC | 8.564 | 185.696 | 8.704 | 188.116 | 7.948 | 187.332 | 8.46 | 188.876 | 8.372 | 185.356 | 7.972 | 190.08 |
| Precision | 15.40% | 15.68% | 16.23% | 16.04% | 15.52% | 16.71% | ||||||
| Accuracy | 69.49% | 70.28% | 70.27% | 70.63% | 69.44% | 71.22% | ||||||
| Sensitivity | 62.77% | 62.16% | 65.44% | 63.22% | 63.60% | 65.34% | ||||||
| Specificity | 70.07% | 70.99% | 70.69% | 71.27% | 69.95% | 71.73% | ||||||
| NPV | 95.59% | 95.58% | 95.93% | 95.71% | 95.68% | 95.97% | ||||||
| AUC | 69.70% | 70.55% | 72.42% | 72.30% | 70.63% | 72.63% | ||||||
| PPV12 | 22.24% | 22.61% | 23.34% | 23.08% | 22.39% | 23.96% | ||||||
| NPV12 | 93.24% | 93.22% | 93.75% | 93.43% | 93.37% | 93.82% | ||||||
| Min | Mean | PMM | CART | missForest | MLMI | |||||||
|---|---|---|---|---|---|---|---|---|---|---|---|---|
| Predicted | MCI | NC | MCI | NC | MCI | NC | MCI | NC | MCI | NC | MCI | NC |
| MCI | 30.104 | 117.812 | 26.36 | 106.804 | 34.412 | 132.32 | 33.008 | 124.628 | 34.176 | 131.968 | 35.596 | 130.02 |
| NC | 21.896 | 147.188 | 25.64 | 158.196 | 17.588 | 132.68 | 18.992 | 140.372 | 17.824 | 133.032 | 16.404 | 134.98 |
| Precision | 20.35% | 19.80% | 20.64% | 20.94% | 20.57% | 21.49% | ||||||
| Accuracy | 55.93% | 58.22% | 52.71% | 54.69% | 52.75% | 53.81% | ||||||
| Sensitivity | 57.89% | 50.69% | 66.18% | 63.48% | 65.72% | 68.45% | ||||||
| Specificity | 55.54% | 59.70% | 50.07% | 52.97% | 50.20% | 50.94% | ||||||
| NPV | 87.05% | 86.05% | 88.30% | 88.08% | 88.18% | 89.16% | ||||||
| AUC | 60.12% | 58.55% | 61.84% | 61.38% | 61.66% | 63.39% | ||||||
| PPV12 | 15.08% | 14.64% | 15.31% | 15.54% | 15.25% | 15.98% | ||||||
| NPV12 | 90.63% | 89.88% | 91.57% | 91.41% | 91.48% | 92.21% | ||||||
Disclaimer/Publisher’s Note: The statements, opinions and data contained in all publications are solely those of the individual author(s) and contributor(s) and not of MDPI and/or the editor(s). MDPI and/or the editor(s) disclaim responsibility for any injury to people or property resulting from any ideas, methods, instructions or products referred to in the content. |
© 2023 by the authors. Licensee MDPI, Basel, Switzerland. This article is an open access article distributed under the terms and conditions of the Creative Commons Attribution (CC BY) license (https://creativecommons.org/licenses/by/4.0/).
Share and Cite
Zhang, F.; Petersen, M.; Johnson, L.; Hall, J.; Palmer, R.F.; O’Bryant, S.E.; on behalf of the Health and Aging Brain Study (HABS–HD) Study Team. A Machine Learning-Based Multiple Imputation Method for the Health and Aging Brain Study–Health Disparities. Informatics 2023, 10, 77. https://doi.org/10.3390/informatics10040077
Zhang F, Petersen M, Johnson L, Hall J, Palmer RF, O’Bryant SE, on behalf of the Health and Aging Brain Study (HABS–HD) Study Team. A Machine Learning-Based Multiple Imputation Method for the Health and Aging Brain Study–Health Disparities. Informatics. 2023; 10(4):77. https://doi.org/10.3390/informatics10040077
Chicago/Turabian StyleZhang, Fan, Melissa Petersen, Leigh Johnson, James Hall, Raymond F. Palmer, Sid E. O’Bryant, and on behalf of the Health and Aging Brain Study (HABS–HD) Study Team. 2023. "A Machine Learning-Based Multiple Imputation Method for the Health and Aging Brain Study–Health Disparities" Informatics 10, no. 4: 77. https://doi.org/10.3390/informatics10040077
APA StyleZhang, F., Petersen, M., Johnson, L., Hall, J., Palmer, R. F., O’Bryant, S. E., & on behalf of the Health and Aging Brain Study (HABS–HD) Study Team. (2023). A Machine Learning-Based Multiple Imputation Method for the Health and Aging Brain Study–Health Disparities. Informatics, 10(4), 77. https://doi.org/10.3390/informatics10040077


