Abstract
The exponential growth of data in the digital age has led to a significant demand for innovative approaches to assess data in a manner that is both effective and efficient. Machine Learning as a Service (MLaaS) is a category of services that offers considerable potential for organisations to extract valuable insights from their data while reducing the requirement for heavy technical expertise. This article explores the use of MLaaS within the realm of marketing applications. In this study, we provide a comprehensive analysis of MLaaS implementations and their benefits within the domain of marketing. Furthermore, we present a platform that possesses the capability to be customised and expanded to address marketing’s unique requirements. Three modules are introduced: Churn Prediction, One-2-One Product Recommendation, and Send Frequency Prediction. When applied to marketing, the proposed MLaaS system exhibits considerable promise for use in applications such as automated detection of client churn prior to its occurrence, individualised product recommendations, and send time optimisation. Our study revealed that AI-driven campaigns can improve both the Open Rate and Click Rate. This approach has the potential to enhance customer engagement and retention for businesses while enabling well-informed decisions by leveraging insights derived from consumer data. This work contributes to the existing body of research on MLaaS in marketing and offers practical insights for businesses seeking to utilise this approach to enhance their competitive edge in the contemporary data-oriented marketplace.
1. Introduction
The rapid growth of data [1] generated by customers and organisations in the digital era has resulted in a pressing demand for enterprises to proficiently analyse data in order to facilitate well-informed decision-making. Marketing is an essential field that aims to explore innovative methods of utilising data and analytics to gain a comprehensive understanding of consumer behaviour, preferences, and emotions.
Artificial Intelligence (AI) and Machine Learning (ML) have brought about a paradigm shift in the field of marketing, enabling organisations to effectively analyse customer data, obtain insights into consumer behaviour, and enhance their strategic approaches [2]. These tools enable marketers to extract useful insights, discern patterns, and formulate data-based decisions. Chatbots and virtual assistants, which are AI-driven, contribute to the improvement of the customer experience. Additionally, predictive analytics models are utilised to forecast consumer behaviour, demand patterns, and market dynamics. The ongoing advancements in AI and ML technologies are expected to drive innovation, enhance competitiveness, and foster a customer-centric approach in marketing tactics for the digital era.
The increasing expansion of cloud services has led to the rise in popularity of Machine Learning as a Service (MLaaS) across several domains [3,4]. However, its application in the field of marketing is still rather restricted [3,4]. In this study, we provide a pioneering MLaaS framework designed specifically for marketing professionals.
The objective of this study is to examine the utilisation of MLaaS within the field of marketing, with a specific focus on elucidating its advantages, obstacles, and potential prospects. The proposal offers enhanced scalability, adaptability, and customisation capabilities in the field of predictive analytics. Furthermore, this paper examines the potential implications of MLaaS on the marketing business and explores prospective avenues for future study in this domain.
The MLaaS Platform for Digital Marketing, as presented, offers several contributions:
- A framework for integrating autonomous machine learning modules.
- Empowers users to use ML techniques without significant financial commitments.
- Tailored to digital marketing, enabling precise predictive techniques in decision-making.
The machine learning modules that have been created add to the above contributions:
- One-2-One Product Recommendation: Creates customised recommendations based on individual consumption habits.
- Churn Prediction: Provides real-time predictions of abandonment using profile, behavioural, purchasing, and historical data.
- Send Frequency Prediction: Analyzes and determines optimal timing and frequency for real-time marketing communications.
The MLaaS solution that developed here showcases the viability of integrating these modules into a comprehensive platform that can effectively cater to the requirements of marketing professionals. Through the utilisation of ML techniques and automation, marketers can optimise their targeting strategies to augment customer interaction and yield enhanced campaign outcomes. The MLaaS platform enables marketers to make decisions based on data to enhance the accuracy of their campaigns, and offers the necessary scalability, flexibility, and customisation to succeed in the current marketing environment.
This paper highlights the significance of MLaaS in the field of marketing and introduces a full MLaaS system specifically tailored for marketing purposes. The modules within the system designed for individualised product suggestions, attrition prediction, and send frequency prediction possess the capacity to significantly transform marketing methodologies. Businesses can leverage a scalable and configurable MLaaS platform to effectively utilise ML capabilities. This enables them to make informed decisions by leveraging consumer insights, thereby enhancing marketing effectiveness and improving the customer experience.
This study investigates outcomes in terms of the Open Rate, Click Rate, and Average Ticket in campaigns that are built upon client-determined tactics and AI-guided message delivery time. Marketing campaigns that utilise AI-driven send timing exhibit improved Open and Click Rates, showcasing the capacity of MLaaS to increase the dynamics of customer contact.
The rest of this article is organised in the following manner. Section 2 presents an extensive literature analysis and examination of related studies that pertain to MLaaS and its potential applications. In Section 3, we introduce our MLaaS marketing system, comprising three modules: Churn Prediction, One-to-One Product Recommendation, and Send Frequency Prediction. A comprehensive description is provided for the input data, ML techniques, and output results of each module. Section 4 of this study provides a comprehensive examination of the results obtained from our experiments and a detailed analysis of the findings. Section 5 culminates by providing a concise overview of the contributions made in this study along with an assessment of the potential influence of our proposed MLaaS system on the field of marketing.
2. Literature Review and Related Work
Machine Learning algorithms are extensively employed in a wide range of domains due to their exceptional performance [5]. In recent decades, ML has emerged as a significant problem-solving methodology, finding applications in various domains including both research and everyday human activities. ML plays a pivotal role in numerous applications, including social media features, product recommendation systems, image recognition, sentiment analysis, automating employee access control mechanisms, healthcare efficiency and medical services, prediction of potential heart failure, language translation, and the banking sector [5]. Both the development and availability of on-demand Software-as-a-Service (SaaS) technologies, particularly cloud-based libraries for distributed machine learning, have been observed in the literature [6]. The rapid expansion of cloud services has led to advancements in MLaaS, specifically in the construction of training infrastructure capable of handling large datasets and complicated ML models [5].
Tafti [7] and Saldamli [3] emphasise the capabilities of MLaaS in the field of medical informatics and cloud computing, respectively. The need for accessible and efficient MLaaS platforms is underscored, with Saldamli [3] explicitly advocating for a comprehensive evaluation of various providers. The technological features of MLaaS are the primary emphasis of Loreti [8] and Assem [9]. Loreti [8] presents a distributed architecture that aims to parallelize ML systems, while Assem [9] introduces the TCDC technique, which focuses on picking the optimal ML model.
The sharing and allocation of computing resources on a platform with multiple users can lead to cost reductions by permitting demand-based resource usage [10]. According to [10], the establishment of a clearly defined interface enables users to conveniently access machine learning processes from any location and at any given moment. It is advisable for users to prioritise their focus on the data itself rather than being preoccupied with implementation and computational resources. Machine Learning applications have been successfully integrated into various systems, production models, and enterprises for this purpose. However, Machine Learning techniques necessitate access to data that often contains sensitive information, posing potential security and privacy hazards [5].
In accordance with the service component design, [10] introduced a revolutionary methodology for MLaaS that offers a platform as a service with scalability, flexibility, and non-blocking capabilities. This platform facilitates the advancement, verification, and implementation of machine learning models. By utilising service-oriented architecture, the methodology becomes highly scalable and flexible through the incorporation, elimination, alteration, and integration of any constituent element. Additionally, this enhances the system’s adaptability in order to effectively manage many data sources and concurrent diverse machine learning algorithms.
PredictionIO [11] was first introduced in 2013. This platform is an open-source framework that incorporates various machine learning methods into a horizontally scalable and distributed system based on the Hadoop architecture. In addition to its web Application Programming Interface (API)s and graphical user interface, PredictionIO offers access to its services.
In [12], a scalable platform was presented based on Hadoop. The implemented system demonstrates the ability to process a maximum of 30 queries concurrently while achieving a response time of less than one second.
The OpenCPU version 1.0 platform [13], which was established in 2014, is an open-source software that creates a web API for R, a widely used statistical analysis software environment. In light of its nature as a middleware for accessing R functions, this solution lacks consideration for several nonfunctional needs, including scalability and performance.
The PredictionIO, OpenCPU, and [12] platforms are all constructed on the basis of a particular analytical tool, and are limited by the restrictions imposed by that tool. The inclusion of additional machine learning algorithms, data storage, and deployment is hindered by this limitation, reducing adaptability. Although Hadoop and R are characterised as open-source initiatives, the process of integrating them into a novel technique is not a straightforward endeavor. This similarly holds true for industry participants and their proprietary solutions in cases when external developers encounter limitations in accessing the code to implement novel algorithms.
Within the industry, prominent companies such as Google, Microsoft, and Amazon have all introduced respective proprietary platforms. The year 2014 marked the debut of Google’s Prediction API. Furthermore, the release of Azure Machine Learning by Microsoft occurred in 2014. In 2015, Amazon introduced Amazon Web Services (AWS) Machine Learning, marking its initial foray into the field. These transactions serve as empirical evidence supporting the presence of demand. However, the design and implementation specifications of these products are not publicly accessible.
Machine Learning applications find utility in various domains such as healthcare, education, economics and finance, social networks, among others. The subsequent enumeration provides instances that utilise machine learning applications in each of the aforementioned domains.
According to [14], the utilisation of Watson, an artificial intelligence system developed by IBM, facilitated the successful transformation of IBM’s “Better Healthcare” application from outdated business models to innovative sources of revenue within the healthcare sector. In recent years, the deployment of Watson in many hospitals and medical institutions has been observed, mostly attributed to its remarkable capability to provide precise treatment recommendations for specific types of cancer. Watson’s potential in the retail and hospitality sectors have been highlighted as well, particularly in its capacity to function as a shopping assistant.
Machine Learning applications are widely employed in the field of education to enhance and individualise students’ learning experiences while facilitating faster and more precise grading for educators [15,16]. As technological advancements progress and computer capabilities continue to strengthen, there is a parallel optimisation of algorithm training, mirroring the process observed in human learning. Technology businesses utilise ML algorithms in the field of education to foster the creation of inventive and user-friendly educational approaches [15]. According to [16], Quizlet is widely recognised as a prominent software program utilised for educational endeavours. Functioning as an online study tool, Quizlet grants users access to a diverse range of extensive datasets. Employing statistical analysis and machine learning methodologies, Quizlet aims to enhance the efficacy of studying practices for students.
In the domains of economics and finance, ML applications have been adapted and refined. ML technology possesses the capability to adapt to many scenarios and sustain its learning process. ML is being widely applied across several sectors of the finance industry, encompassing diverse applications such as alternative credit reporting techniques and expedited underwriting processes. The accelerated implementation of ML to streamline arduous tasks in various industries is primarily motivated by enhanced economic prospects.
Machine Learning applications have been included in social interactions as well, enabling social media platforms to provide recommendations and assist in the selection of preferences to enhance personalised decision-making processes. One example of the actual application of ML can be observed on the Twitter social network, among other platforms. According to [17], Twitter has implemented a redesign of its timelines, employing machine learning techniques to determine the most pertinent tweets for individual users. These tweets are assigned a relevance score and positioned at the top of the user’s feed, thereby enhancing the probability of their visibility. Facebook is a widely recognised social networking platform that utilises machine learning algorithms by means of a multitude of chatbots. Software developers have the ability to create and then propose chatbots for integration into the Facebook Messenger application. According to [18], chatbots are designed to provide users with information and establish connections based on the input of keywords or selections from a multiple-choice menu. Furthermore, there are machine learning applications that possess the capability to effectively filter out malware and content of inferior quality.
Machine Learning has found extensive applications in various supplementary services such as speech recognition systems, autonomous vehicles, streaming platforms, and computer vision applications. Pindrop’s Deep Voice (https://www.pindrop.com/technologies/deep-voice/ (accessed on 15 January 2024)) biometric engine has successfully built a sophisticated deep neural network speaker identification system that operates covertly during each conversation, meticulously examining many callers with the purpose of verifying legitimate callers and detecting individuals engaged in fraudulent activities. The text-to-speech engine known as Deep Voice 2, developed by Baidu, has the ability to replicate a wide range of human dialects, numbering in the hundreds. The application uses a deep neural network architecture to produce human voices that exhibit a high degree of similarity to natural speech, rendering them virtually indistinguishable. According to [19], speech pattern recognition systems have the ability to acquire knowledge about distinct voice characteristics, such as subtleties, cadence, accent pronunciation, and intonation. This knowledge enables the network to generate faithful reproductions of speaker sounds.
Machine Learning techniques are also employed in the context of autonomous vehicles. According to [20], the vehicle collects data through its sensors, analyzes the information, and then makes decisions, leading to driving capabilities that are either on par with or surpass those of a human driver. A commercial example is Google’s self-driving car, Waymo (https://waymo.com/ (accessed on 15 January 2024)). Waymo uses ML techniques to effectively perceive and interpret its environment, thereby creating conditions that enable accident prevention. Consequently, this technology enables the development of an autonomous vehicle capable of driving safely and independently, without the need for human intervention.
Netflix is a subscription-based streaming platform that offers a wide range of movies, television shows, and other forms of visual entertainment. Netflix first presented personalised movie suggestions in the year 2000, and afterwards launched the Netflix Prize in 2006, which served as a competition focused on ML and data mining. Netflix employs ML algorithms to curate its collection of films and television shows, leveraging the ability to discern individual user preferences and interests. This enables the platform to provide personalised recommendations that align with the user’s specific tastes and preferences [21,22].
Computer vision is widely recognised as a highly impactful domain within the realm of Machine Learning as a Service. Computer vision is employed across various academic areas, with notable application in the field of agriculture. Blue River Technology (https://bluerivertechnology.com/ (accessed on 15 January 2024)) is a company that employs ML and computer vision extensively to bring about significant changes in agriculture. This is achieved through the implementation of intelligent machinery, the establishment of sustainable approaches for resource management, and the enhancement of agricultural productivity. According to [23], Blue River has recently devised algorithms that possess the ability to discern various plant species in open fields, enabling the differentiation of illicit plants from their legitimate counterparts.
Although MLaaS has gained considerable attention across different fields of expertise, its implementation within the marketing sector has been relatively restricted. In comparison to several other sectors such as healthcare, finance, and e-commerce, which have readily adopted MLaaS solutions, marketing practitioners have exhibited a slower pace in fully harnessing the potential of MLaaS. Numerous variables contribute to this. The marketing industry often has distinct and intricate obstacles, which may demand the development of machine learning models that are customised to meet specific business needs. Furthermore, the significance of data privacy and security issues in the field of marketing cannot be overstated. This has resulted in organisations exhibiting greater reluctance when it comes to entrusting their data and analytic processes to third-party providers of MLaaS.
Furthermore, marketers typically rely on their own expertise and tools to analyse data and make decisions within the field of marketing [24]. Notwithstanding these challenges, the dynamic nature of the marketing industry and the increasing need for data-driven analysis may engender a burgeoning fascination with MLaaS solutions tailored specifically for marketing purposes.
3. Proposed MLaaS System for Marketing
Machine Learning as a Service is a methodology that empowers enterprises to harness the potential of ML. Figure 1. depicts the architectural design of a Machine Learning as a Service (MLaaS) platform, which is organised into three distinct layers. Data sources are consolidated and stored at the fundamental level, serving as the foundation for ML activities. At the intermediate level, the ML environment contains components such as data processing, model training, and predictive analytics. These components utilise complex algorithms to extract valuable insights from the data. Ultimately, clients engage with the platform at the highest level in order to gain access to and make use of the predictive skills and insights produced by the ML environment.
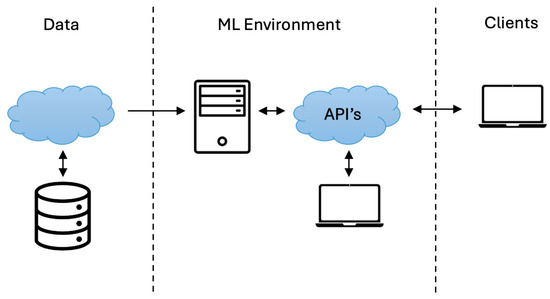
Figure 1.
MLaaS overview.
By drawing upon the principles of AI, ML, Intelligent Marketing, and One-to-One Marketing, we provide a proposal for a scalable MLaaS cloud platform that is tailored for marketing purposes and utilises MLaaS. This platform facilitates the seamless integration of relational marketing-oriented modules and encompassing various functionalities.
The One-2-One Product Recommendation, Churn Prediction, and Send Frequency Prediction features were built as separate modules.
This section provides a comprehensive overview of the proposed architecture for MLaaS, along with a description of each module. The discussion encompasses aspects such as input data, Machine Learning algorithms, and output results.
3.1. MLaaS System Architecture
The design of the system’s general architecture encompasses the integration between the MLaaS cloud platform and the various modules. The optimisation of the interaction between the MLaaS platform and the modules was conducted to ensure effective functioning in a wide range of challenging scenarios, aiming to fulfill all functional needs and exceed all nonfunctional criteria.
To guarantee platform scalability, the overall architecture was delineated. The generation of containers for models is facilitated by each module, resulting in the creation of Docker images [25]. Additionally, an external API has been built to serve as an intermediary between the user and the internal API operations. The construction and development strategy of the MLaaS cloud platform described in the application required modifications. It was determined that it was crucial to initiate preliminary developments of the different modules through pilot client proofs-of-concept.
Therefore, partnerships were established with pilot clients in the Retail and e-Commerce industries, and the necessary technological infrastructure was developed to facilitate the proof of concept being investigated. This infrastructure primarily focused on four key stages: data collection, data analysis, model development, and model deployment.
A framework was devised to facilitate the acquisition and analysis of data from a selected group of pilot clients. The framework encompassed a system of interlinked tables, methods for data adaption, and the incorporation of fundamental feature lists derived from the modules to be constructed. The Entity Diagram for the MLaaS cloud platform is depicted in Figure 2. To delineate the MLaaS cloud platform, seven entities were considered. The attributes associated with the user entity encompass the username, password, email, country, date of registration, and a soft delete field. However, it is feasible to include additional information and extend support for hard deletes. The user is required to provide datasets with a minimum of two essential attributes: a name and a corresponding file location. The representation of functionalities enabled by the cloud platform is significantly influenced by the concept of modules. In the context of this study, the modules encompass Churn Prediction, One-2-One Product Recommendation, and Send Frequency Prediction. Nevertheless, it is important to note that the suggested platform exhibits adaptability and versatility. The primary significance of this entity diagram proposal stems from the essential characteristics mandated for each module. These qualities establish the connection between the datasets and the modules as well as the need for storing the training data and the resulting models formed by the modules. The acquisition of these models represents the final purpose of this proposal. To facilitate the training of the modules and the generation of models, it is important to retain certain information within the ‘train’ entity. The trained models are stored within containers and are associated with an endpoint that indicates the location at which the trained model may be accessed for consumption.
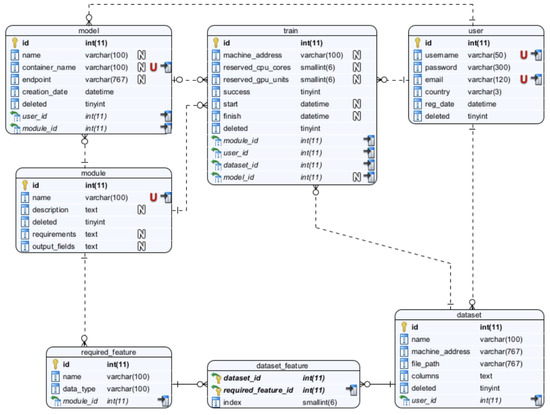
Figure 2.
MLaaS entities diagram.
The research team obtained and analysed structured data from the pilot client(s). To enhance this procedure, the development of data reports with interactive visuals was undertaken. Remedial actions were undertaken to address any discrepancies observed at the structural level. The implementation of core data analysis techniques was contingent on the specific module being addressed, with the aim of facilitating expedient and optimal examination of data pertaining to newly acquired users. Additional analysis was deemed necessary depending on the specific domain of operation.
The model development process was inspired by the CRoss Industry Standard Process for Data Mining (CRISP-DM) [26], which is a process model that serves as the base for a data science process. It has six sequential phases:
- Business Context by acquiring a thorough comprehension of the organisation’s goals and defining the problem to be solved.
- Data Exploration by examining and assessing the quality and relevance of available and required data.
- Data Preparation by processing and organising data for modeling purposes.
- Model Development by identifying and implementing suitable machine learning techniques or algorithms.
- Model Evaluation by comparing and assessing the performance of various models to identify the one that most closely aligns with business objectives.
- Model Deployment by ensuring that stakeholders are able to effectively access and utilise the insights generated by the selected model.
As depicted in Figure 3, the implementation of all modules adhered to a methodology that closely resembled CRISP-DM. The approach commenced by obtaining unprocessed data from multiple sources, including a wide range of forms and architectures. Following this, the gathered data underwent meticulous processing and cleansing methods, with the objectives of correcting anomalies, addressing missing values, and standardising formats.
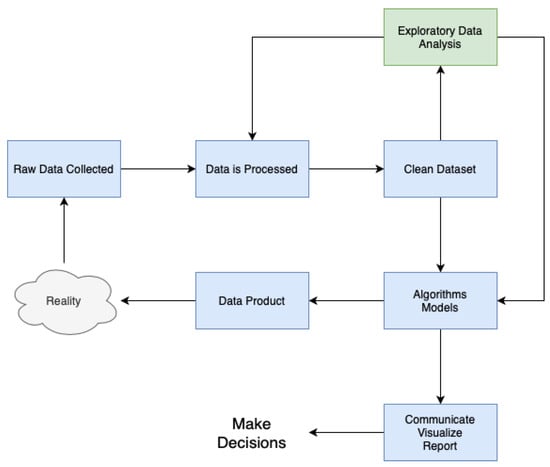
Figure 3.
Data science process for the modules.
After the completion of data preprocessing, a comprehensive exploratory data analysis (EDA) phase was initiated, which played a crucial role in improving the dataset’s quality and integrity. Throughout this stage, a range of statistical methodologies, visualisation software, and data mining algorithms were utilised to reveal patterns, detect trends, and identify possible correlations within the dataset. The knowledge obtained from this initial step of exploration guided our future modelling endeavours while enhancing our overall comprehension of the fundamental data attributes.
The utilisation of advanced modelling approaches, which included a wide range of machine learning algorithms and statistical methods, is a key aspect of our methodology. The models are trained using the dataset and utilising the knowledge acquired during the exploratory analysis stage. Through continuous improvement and verification, these models develop to accurately represent the fundamental patterns and connections present in the data.
The final outcome of our methodology is the development of practical data products which function as concrete representations of the analytical insights obtained from the modelling process. These data products enhance the ability to communicate, visualise, and report findings in a smooth manner, enabling stakeholders to make educated decisions based on empirical evidence.
Our methodology encompasses a comprehensive approach to making decisions based on data. This strategy involves the smooth integration of several stages, including data collection, preprocessing, exploratory analysis, modelling, and deployment. The ultimate goal is to provide actionable insights.
APIs have been designed to enhance development and optimise performance through the implementation of prediction gathering routines, retraining mechanisms, role-based access restriction mechanisms, and active API documentation. The architecture employed to enhance service availability and efficiency is based on the Open API Specification (https://spec.openapis.org/oas/v3.1.0 (accessed on 30 October 2023)).
The underlying architecture of the MLaaS cloud platform was intentionally built to be independent of any specific machine learning model. This facilitates the optimisation and efficacy of the system’s administration and improvement. Additionally, it facilitates the development of categorisation models that incorporate several hierarchical levels, enabling tailoring to specific business domains. In the context of recommendation systems, for instance, it is feasible to employ a conventional model known as collaborative filtering as well as more intricate models that offer enhanced capabilities for customisation and adaptation.
The proposed MLaaS platform prototype is structured into three separate layers, as illustrated in Figure 4. Each layer plays a vital role in ensuring the smooth operation and scalability of the system.
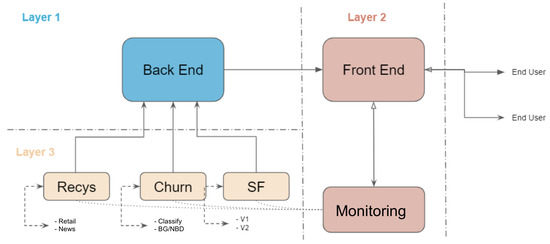
Figure 4.
MLaaS three-tiered diagram.
- Layer 1—Back-end: This layer forms the fundamental layer of the platform responsible for managing the complex message queuing systems that enable communication across various components of the system. The primary responsibilities of this layer are to effectively handle the management of connections to client databases, facilitate interaction with the specific machine learning models, and ensure smooth transmission of data and instructions across the platform’s entire system. The back-end plays a crucial role in ensuring the resilience and dependability of the fundamental architecture of the MLaaS platform by abstracting the difficulties associated with data management and model integration.
- Layer 2—Front-end: The front-end layer is situated at the interface between the end-users and the underlying MLaaS functionality. It comprises a wide range of configurations and functionalities that are focused on the user. By utilising user-friendly interfaces and interactive dashboards, end-users are provided with exceptional access to the performance indicators of specific modules. This enables them to make informed decisions based on facts. Moreover, the front-end makes it easy for users to choose modules, allowing them to easily switch between different features such as recommendation systems or churn prediction modules. The front-end layer plays a crucial role in facilitating the realisation of the transformative capabilities of MLaaS for a wide range of stakeholders by placing emphasis on user experience and accessibility.
- Layer 3—ML Modules: This layer contains the complex machinery of the machine learning models, and is specifically designed to meet various business needs and analytical problems. The purpose of this layer is to function as a storage and management system for a wide range of models that have been carefully designed to provide exceptional performance and precision. ML modules smoothly integrate into the broader MLaaS ecosystem following the communication requirements set by the back-end layer. This ensures interoperability and cohesiveness across different capabilities. Furthermore, the modular structure of Machine Learning modules allows for exceptional scalability and customizability, permitting organisations to adjust and develop their analytical capabilities in accordance with changing business requirements and technology trends.
The demarcation of these three strata highlights the architectural sophistication and versatility inherent in the proposed MLaaS platform, establishing the groundwork for revolutionary advancements and enduring expansion in the data-centric environment. By employing careful planning and precise implementation, every layer is seamlessly integrated to achieve the broader goal of making sophisticated analytics accessible to everyone and enabling organisations to fully utilise machine learning for a competitive edge.
Generating real-time outputs from a model, such as product recommendations poses challenges, and requires the presence of individual user databases. To mitigate the potential cost implications associated with acquiring data pertaining to the dataset to be predicted, a proposed solution involves training a model that generates predictions based on user-supplied data within the dataset. These predictions are subsequently stored in a centralised database until they are specifically requested by the relevant user. The reciprocal relationship between processing power and storage capacity contributes to the mitigation of this inherent system limitation. Figure 5 presents the components diagram, and Figure 6 depicts the suggested deployment of the project’s various components in light of this consideration.
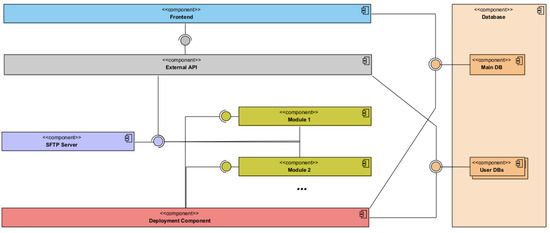
Figure 5.
MLaaS components diagram.
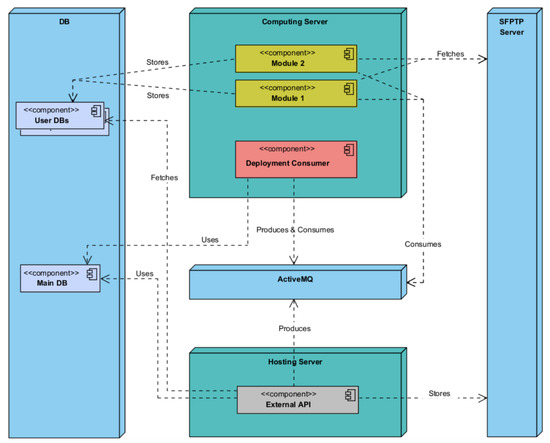
Figure 6.
MLaaS deployment diagram.
The External API component of the platform will be segregated on a separate server, establishing a security barrier between it and the other solution components. The training machine will then provide access to the modules and deployment/management component, as these components are heavily reliant on the server’s computing capacity. The optimal placement of the remaining components, including the DB, Secure File Transfer Protocol (SFTP) server, and ActiveMQ server, has not been specifically determined; however, it is recommended that the isolation of the External API on the hosting server be enhanced for maintenance and security purposes. Additionally, if feasible, deploying the DB on a separate server with dedicated disk access should be taken into account to further enhance security measures. The proposed system architecture exhibits modularity and decoupling, aligning with the software development concepts of Low Coupling and High Cohesion.
The following deployment diagrams show each of the main system nodes: Hosting Server (Figure 7), Computing Server (Figure 8), ActiveMQ (Figure 9), Management (Figure 10), SFTP Server (Figure 11), DB (Figure 12), Deployment Component (Figure 13), Training Component (Figure 14), and Module Deployment Component (Figure 15).

Figure 7.
Hosting Server deployment diagram.
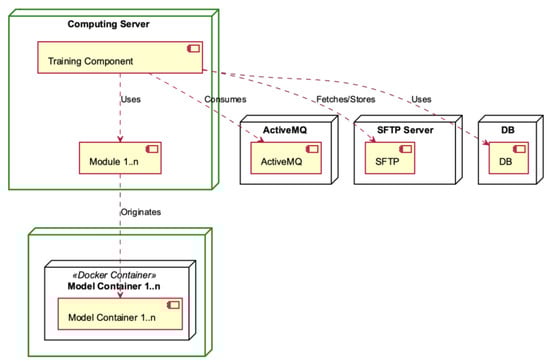
Figure 8.
Computing Server deployment diagram.
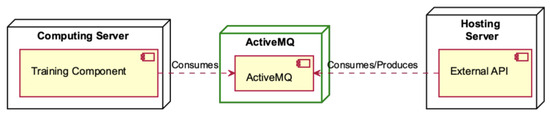
Figure 9.
ActiveMQ deployment diagram.
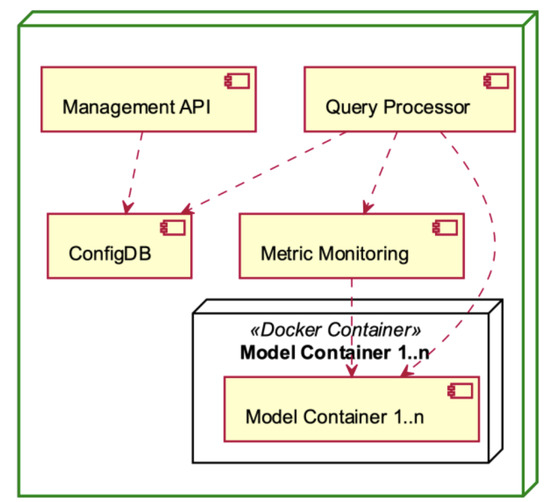
Figure 10.
Management Component deployment diagram.
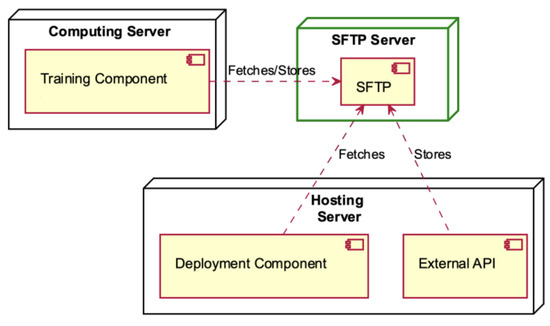
Figure 11.
SFTP Server deployment diagram.
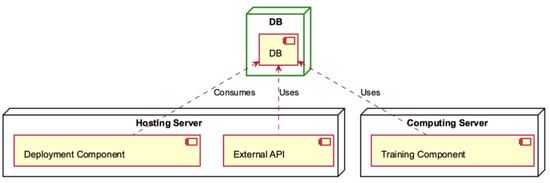
Figure 12.
DB deployment diagram.
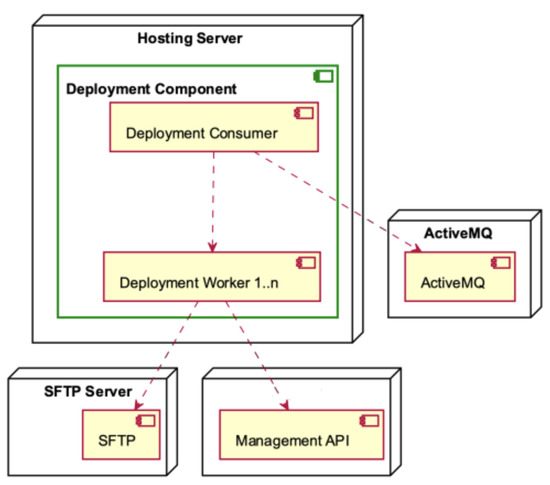
Figure 13.
Deployment Component deployment diagram.
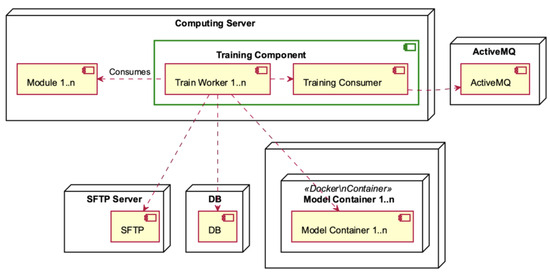
Figure 14.
Training Component deployment diagram.
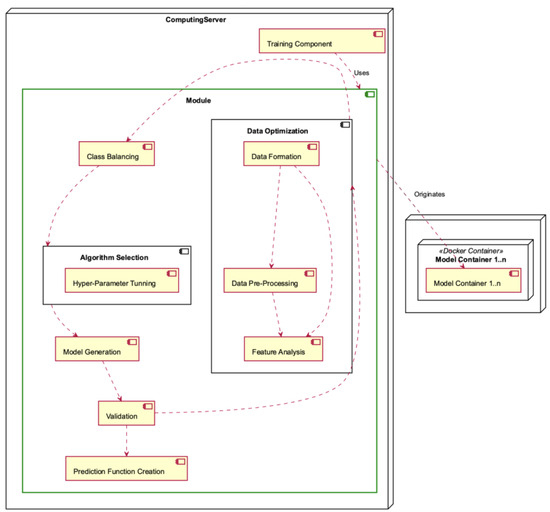
Figure 15.
Module deployment diagram.
The Hosting Server is comprised of two main components, namely, the Deployment Component and the External API (see Figure 7). In the initial setup, the Management API is employed to interface with the database and fetch data from the SFTP server. This integration streamlines data access operations, ensuring efficient retrieval processes within the system. The front-end client interacts with the External API, which relies on the Query Processor and the DB for data retrieval and storage. This interaction facilitates seamless communication between the front-end and the underlying data processing components, ensuring efficient handling of data within the system. Data are stored in the SFTP while being consumed and are produced through the utilisation of ActiveMQ, ensuring efficient data flow and management within the system.
The Computing Server consists of the Training Component, which utilises many different modules (see Figure 8). The Training Component assumes a crucial role by retrieving data from the ActiveMQ messaging system. Following this, it coordinates the transmission of this data to the SFTP Server for the purpose of secure storage, utilising the strong functionalities of a database for subsequent analysis. In the context of this framework, every module within the Training Component plays a role in producing one or more model containers. These containers include significant insights and predictive capabilities that are crucial for the system’s functionality and flexibility.
The Training Component, hosted within the Computing Server, interfaces with the ActiveMQ component for data consumption (refer to Figure 9). Simultaneously, the External API within the Hosting Server serves a dual role, both consuming and producing data through the ActiveMQ component, facilitating seamless data exchange within the system architecture.
The Management Components, depicted in Figure 10, serve as the operational backbone of the MLaaS platform. The Management API enables the delegation of external communication and control, while the Query Processor is responsible for executing data processing duties. Configuration settings are centralised in ConfigDB, while system performance is tracked in real time using Metric Monitoring. The Docker container encapsulates each model, providing both modularity and scalability. Collectively, these constituent elements facilitate effective functioning, resilient performance, and optimised resource allocation inside the MLaaS framework.
The SFTP Server establishes communication with the Computing and Hosting servers (see Figure 11). The Training Component, which is hosted by the Computing Server, retrieves data and stores it in the SFTP Server. Within the context of the Hosting Server, the deployment component is responsible for retrieving data from the SFTP, while the external API is tasked with storing information in the SFTP server.
The Deployment Component of the Hosting Server utilises the DB component (Figure 12), which is also used by the External API of the Hosting Server and the Training Component contained in the Computing Server.
The Deployment Component, as depicted in Figure 13, is hosted by the Hosting Server. It consists of the Deployment Consumer and many Deployment Workers. The Deployment Consumer engages in interactions with the ActiveMQ component and produces workers. The Deployment Workers engage in interactions with both the SFTP Server and the Management API.
The Training Component, depicted in Figure 14, is contained within the Computing Server. It consists of Training Workers and the Training Consumer who consumes the ActiveMQ. The Training Workers engage in the consumption of modules and interact with the SFTP server, the database, and the model containers.
The Module Deployment Component, depicted in Figure 15, is situated within the Computing Server and is characterised by its intricate nature, as it encompasses multiple operations. The Module consists of the Data Optimisation sub-module, which encompasses the responsibilities of Data Formation, Data Preprocessing, and Feature Analysis. The Module also includes class balancing, algorithm selection (including hyperparameter tuning), model generation, validation, and construction of the prediction function. Each module generates one or more model containers.
When evaluating the scalability of a microservices solution, it is crucial to take into account the trade-offs associated with transmitting requests and responses among different services, the expenses related to upgrading the infrastructure’s hardware, and the potential for parallelising processes to leverage hardware enhancements.
When designing prototypes for performance evaluation, it is customary to employ the following dimensions to assess the most favourable balance. Performance refers to the duration needed to finish a solitary transaction, while Throughput pertains to the quantity of transactions that a system can handle within a specified time frame. Capacity, on the other hand, represents the highest level of throughput that a system can maintain under a given workload while ensuring an acceptable response time for each individual request.
There are two options for making a system accessible: locally, sometimes known as on-premises, or remotely through the use of remote hosting services. When implementing a remote solution, it is imperative to take into account the geographical location of the data. Additionally, the choice of hosting architecture may vary based on the service provider. In a local solution, the responsibility for the physical architecture lies with the organisation, which can be comparable to certain resilient remote hosting options.
The logical accessibility of a system can be achieved through two means, namely, Plugins and Services. Plugins offer advantages such as the ability to decrease the size of the request payload; however, they present certain disadvantages as well, such as challenges associated with managing the different versions of plugins and the need to update several plugins simultaneously. One of the benefits associated with services is the streamlined administration of versions and updates. However, it is important to note that there are drawbacks, such as the increased payload of requests and responses. It is imperative to ascertain whether the solution employing recommendation services is hosted on the same platform as the recommendation system, as this can potentially result in latency issues during the data transfer process between the two systems. The most appropriate strategies may involve the implementation of a shared database between the two systems and the utilisation of APIs to facilitate the seamless transfer of information from the solution to the recommendation system.
3.2. Churn Prediction Module
The Churn Prediction module utilises customer behaviour data to forecast the likelihood of each customer discontinuing their engagement with the brand and ceasing interactions. The aim of this study is to forecast client attrition in a business or activity. There are two distinct forms of churn: explicit churn, which arises when a user chooses not to renew a contractual agreement within the specified timeframe, and implicit churn, which transpires when a consumer engages with a platform or service without being obligated by any contractual obligations.
In the context of implicit churn, the sole indicator of customer turnover is the absence of any engagement or activity on the respective platform or service. There are limited approaches that possess the capability to effectively handle the comprehensive nature of the implicit churn issue. This phenomenon can be attributed in part to the autonomy of each service in defining its own metrics and measures to establish a distinct perspective on consumer behaviour. Furthermore, certain services may lack comprehensive activity tracking systems for individual customers, relying solely on purchase data.
As a result of this concern and the subsequent need for the module to be applicable in a general context (i.e., for use with multiple clients), we decided to use a methodology focused on analysing the frequency of customer activities. In [27], the researchers employed the Beta-Geometric/Negative Binomial Distribution (BG/NBD) model for this aim. The BG/NBD model is a probabilistic model employed for the purpose of forecasting client behaviour, particularly with regard to future purchasing patterns. The model utilises a customer’s historical purchase data to make predictions on the quantity of transactions they are likely to engage in over a specified period. The present model is founded upon the Pareto distribution, although it exhibits notable enhancements in terms of both training and application speed compared to conventional Pareto models while maintaining a comparable level of performance.
The Churn Prediction module is centered on the dynamic examination of the frequency of a specific activity for an individual user or customer. The customer’s likelihood of discontinuing their use of the company’s products is deduced from their prior contacts and activities, which are indicated by a collection of predictors. To counteract the rise in costs and tackle the issue of insufficient supply in this area, the module facilitates the production of abandonment forecasts with a significant level of detail for each individual customer in real time.
Our investigation into churn prediction commenced with an initial exploratory examination. The initial methodology employed in a simulated setting involved an endeavor to expand the classification technique to a dataset associated with an implicit scenario that corresponds to a daily step. Emphasis was placed on identifying traits that might effectively distinguish between active consumers and those who had churned. Nevertheless, the results of all conducted experiments failed to demonstrate a satisfactory level of performance. The primary factor contributing to the subpar performance of the previously proposed approach was the consumption profile of individual users.
The machine learning methodology employed for churn prediction, as delineated in Figure 16, follows a structured process flow. Initially, consumer attributes and usage patterns are collected and partitioned into training and testing datasets. Subsequently, a model generation phase ensues in which machine learning algorithms are trained on the training data to develop predictive models.

Figure 16.
Churn prediction process.
After the completion of the training process, the model is subsequently deployed to a production environment, where it is then utilised for real-time churn prediction jobs. The deployed model undergoes testing using new data specifically sourced from production datasets in order to verify its effectiveness and performance. The purpose of this thorough testing phase is to evaluate the model’s precision and dependability in detecting possible instances of customer churn. This evaluation can provide valuable insights for making strategic decisions to improve customer retention.
An implicit churn problem approach was chosen for the module, as the intention was to maintain a high level of abstraction in the module’s context. As stated earlier, the selected model was BG/NBD, which utilises Pareto methodologies and has notable computational efficiency compared to conventional Pareto models. The primary emphasis of this approach lies in performing a dynamic analysis of the frequency at which a particular action occurs for a specific user or customer. Furthermore, this methodology may be generalised to accommodate various use cases and encompass several representative qualities of the activity.
The BG/NBD probabilistic model is employed to assess the anticipated quantity of forthcoming activities and their likelihood of being active. The approach considers the customer’s activity behaviour as a stochastic process, resembling a coin toss; two coins are employed to determine the likelihood of the customer engaging in an action and the likelihood of the customer discontinuing any further actions. The underlying assumptions of the model are as follows: first, it is assumed that the number of activities performed by the customer adheres to a Poisson process, as seen in Figure 17; second, the activity rate, which represents the expected number of activities within a specific time frame, is also considered; lastly, the model assumes that there is heterogeneity in the activity rate among customers, which is assumed to follow a Gamma distribution.
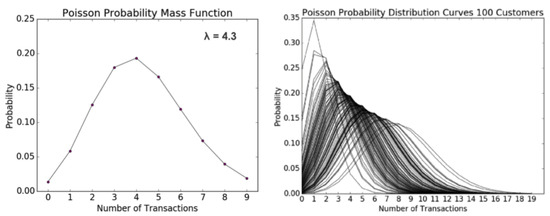
Figure 17.
Poisson probability mass function (left) and Poisson probability distribution curves for 100 customers (right).
The likelihood of a client transitioning into an inactive state following an activity is allocated among the activities in accordance with a geometric distribution. Following the completion of each activity, every consumer discards a second coin, symbolising their decision to abstain from participating in the activity again. The likelihood of being in a state of “being alive” is equivalent to the complement of the likelihood of being in a state of inactivity ().
As an illustration, if we consider a scenario where a customer has a 52% probability of becoming inactive (as shown in Figure 18), the likelihood of the client becoming inactive after the second activity is 25%, and the likelihood of their becoming inactive after the third activity is 12%. The heterogeneity in the variable p can be modeled using a Beta distribution. Each client possesses an individual currency, representing the probability of not engaging in a certain activity again. This currency is determined by the customer’s likelihood of being “alive” after a specific number of actions. As depicted in Figure 18, a simulation was conducted with a sample of ten clients. The probability parameter p in this simulation was modeled using a Beta distribution with alpha = 2 and beta = 3.

Figure 18.
Geometric probability mass function (left) and geometric probability for ten customers (right).
Upon utilisation of the aforementioned probability distributions to analyse the historical customer data, a full range of results becomes apparent for each individual customer. These outcomes comprise three crucial elements:
- Initially, the quantification of the probability of detecting various activities within a defined time interval is established. This analysis offers valuable insights into the probability of customers engaging in different behaviours over a period of time, enabling businesses to proactively predict and strategise for varying levels of customer activity.
- Furthermore, it becomes possible to determine the anticipated number of activities that are scheduled to take place during a specific period of time. Through the utilisation of distribution models, organisations have the ability to make estimations regarding the magnitude of client activities. This in turn facilitates the allocation of resources, management of inventories, and planning of operational operations.
- Finally, the distribution models additionally enable computation of the likelihood of customers migrating to an inactive state at a particular moment in time. This intelligence is highly important in the identification of possible churn clients, facilitating the implementation of proactive retention measures aimed at re-engaging consumers and mitigating attrition.
The utilisation of these probability distributions in analysing past client data provides firms with a comprehensive comprehension of the dynamics of customer behaviour. The utilisation of data-driven decision-making helps organisations to make informed choices, thereby optimising resource allocation and improving tactics for managing client relationships.
3.3. One-2-One Product Recommendation Module
The One-2-One Product Recommendation module is responsible for producing personalised recommendations to consumers based on their unique consumption profiles. To assure the proper functioning of the system, an evaluation was conducted to determine the key elements that influence the design of a product recommendation system. The most effective methodology employed in this study was collaborative filtering [28] with Alternating Least Squares as the optimisation technique [29]. The construction of precise consumer profiles and the development of tailored content for newsletters or other dissemination tools were achieved through the utilisation of historical data and algorithms possessing self-learning capabilities. The utilisation of offline measurements instilled a greater level of certainty in the capacity to attain accuracy while maintaining a balance in terms of the ability to make recommendations across the entirety of the customer’s catalog. Furthermore, this approach resulted in a higher median price per recommendation compared to basic baseline methods.
The One-2-One Product Recommendation module is structured around two primary meta-processes: the training of the model using client data, and the generation of results. The training step is comprised of three distinct sub-processes, namely, the acquisition of the client dataset, the creation of artifacts, and their subsequent upload. The initial stage involves computing the significance of each customer–product contact, taking into account factors such as price, quantity, and date. The hyperparameter optimisation for matrix factorisation is performed automatically for each individual application. Following the completion of training, many artifacts are produced to facilitate the prediction phase. These artifacts encompass the matrix of customer–product interactions, models, dictionaries, and a database containing historical purchases organised by customer. The process of generating results will consider both the customer ID and the model ID, then load the corresponding created artifacts and proceed to calculate the recommendations.
The approach we employ integrates model-based, memory-based, and content-based techniques inside a system that falls under the category of cascade–hybrid recommender systems. The name “cascade” is derived from the observation that each subsequent approach in a series progressively improves upon the predictions provided by the previous one. Our primary objective was to design an algorithm that possesses user-friendly features, adaptability, robustness, and ease of auditability, while minimising any potential performance drawbacks. The method is depicted in Figure 19, and further elaboration may be found in the work by [30].
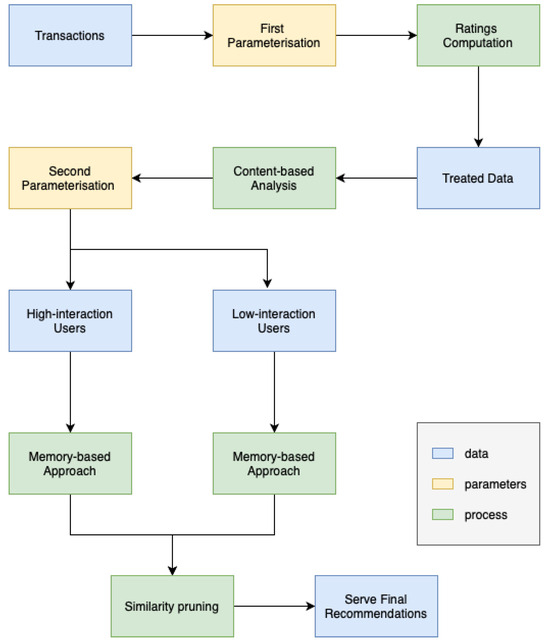
Figure 19.
Product recommendation architecture.
An essential element of this cascade approach which sets it apart is its utilisation of the “similarity pruning” methodology to refine precomputed recommendations from other approaches. This proves to be beneficial, not necessarily in reducing the inaccuracy, but in providing recommendations that are more contextually relevant and accurate.
The recommendations generated by the precomputed latent-model are refined using the content-based technique outlined in Algorithm 1. By employing precomputing with the latent-model, the quantity of products required in the final result is doubled or tripled. This approach provides sufficient diversity and serendipity in the recommendations. Additionally, the use of “similarity pruning” ensures that suboptimal suggestions, such as mixing recommendations for both girls and boys, were not included for clients who have only purchased boys’ clothes in the past.
Similar to the model-based method used to recommend for high interaction users, the precomputed Item-KNN recommendations for low-interaction users were likewise filtered using the content-based technique outlined in Algorithm 1. The technique employed in this situation was similar to the one used previously, which involves suggesting a quantity of products that is two or three times greater than what is actually needed and then narrowing down the selection based on similarity of content. This ensures that suboptimal proposals are eliminated while taking the business context into account.
| Algorithm 1 Get most similar items (adapted from [30]) |
|
To ensure a weekly repetition of suggestions, it is imperative to have a file that contains the updated history. This file must be guaranteed prior to each shipment; alternatively, automatic database access must be made available.
The system initiates its operations by autonomously computing the significance (evaluations) of previous transactions while taking into account meta-factors such as the date of purchase, quantity, and price. Subsequently, the system endeavours to ascertain the accurate significance of the items by leveraging the purchasing history. A clear differentiation exists between users, who are characterised by high and low levels of involvement. Users with low interaction tend to contribute less information, resulting in predictions that are accompanied by a significant degree of uncertainty. The current system is deemed incompatible with the existing business model, necessitating a requirement for customers to have engaged in a minimum of four purchases involving distinct products throughout the preceding six-month period.
Despite the inherent limitations associated with accurately evaluating these systems, significant endeavours have been undertaken to establish formal offline evaluation criteria. These metrics play a crucial role in enabling a more objective review of the internal performance of our model before its implementation. To assess the model’s performance, three measures were formally defined: novelty score, catalogue coverage, and median recommendation price. The formalisation of catalogue coverage, a vital component of recommendation systems, involves quantifying the percentage of goods that are recommended to at least one client.
A notable enhancement was observed in the performance of the procedure for optimising the ideal hyperparameter space, as depicted in Figure 20. The repetition of this essential step is necessary for accurate modelling of the problem across different cases.

Figure 20.
Hyperparameter tuning.
The determination of the significance of previous purchases (ratings) by considering meta-factors such as the date, number, and price of the items acquired is an essential component of the problem at hand. This augments the matrix with supplementary data, enabling its use beyond binary data. The relative significance of different product categories can be influenced by various factors, including the date. Initially, a factor was incorporated into the model to represent the annual cycle and account for the seasonal nature of purchases. This adjustment allows for a small emphasis on interactions occurring during periods of high activity. Next, a weighting factor was calculated, representing a concave function that reaches its highest point at 0 (indicating the same month) and its lowest points at −6 and +6 (representing different months). This mechanism aims to adjust the annual cycle based on the specific month being recommended, prioritising purchases made during months that are closer in proximity to the recommended month as opposed to those that are further away. For instance, if the calculation is conducted during the summer season, it will give preference to interactions that occurred during the previous summer, taking into account the seasonal patterns observed in various product categories. The rating is computed using (1), where is the weight of the interaction, is the weight assigned to the quantity purchased, and is the weight assigned to the unit price.
More details about the One-2-One Product Recommendation module can be found in [30].
3.4. Send Frequency Prediction Module
The architecture of the Send Frequency Prediction module is partitioned into six distinct phases, as illustrated in Figure 21. These phases encompass the following steps: (i) data extraction; (ii) data cleaning and feature engineering; (iii) training–testing split; (iv) model training; (v) testing and evaluation; and (vi) model deployment.
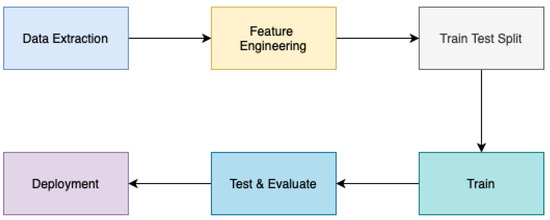
Figure 21.
Send frequency architecture.
The initial stage of data extraction from a database involved the creation of a system aimed at forecasting the most suitable timing for disseminating multichannel messages and campaigns tailored to the unique profiles of each subscribers. The dataset comprised historical data pertaining to subscriber behaviour, profile characteristics, and campaign information.
The second part of the architectural process encompassed the application of feature engineering techniques, which entailed the preprocessing or transformation of data. This required the identification of null values, conversion of categorical values into numerical representations, and generation of novel features. This step holds significance due to the retrieved data not being correctly prepared for modelling and/or training purposes, potentially impacting the performance of the models in relation to the input data.
The training–testing split stage involved partitioning the dataset into two distinct sets, with a distribution ratio of 80–20% (according to the Pareto principle), in order to mitigate any potential disparities within the data and achieve an impartial assessment of the predictive outcomes. The test sets were comprised of data that included predetermined values for the predicted attributes, facilitating the assessment of the accuracy of the predictions.
The training of models in the fourth phase of the design involved the utilisation of techniques such as Random Forest Regression, Linear Regression, K-Neighbours Regression, and Support Vector Regression. The necessity of assessing the individual performance of each proposed regression algorithm, along with the recognition of the no-free-lunch theorem, which posits that there is no universally superior learning algorithm for all problems, prompted the implementation and advancement of an ensemble method (see Figure 22).
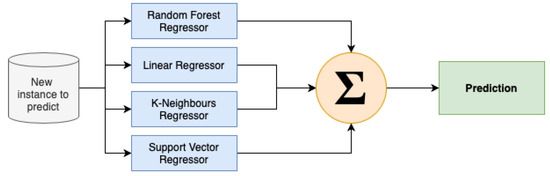
Figure 22.
Send frequency ensemble architecture.
To overcome the limits of simple averaging in terms of performance and prediction values, we designed a stacking parallel ensemble technique (Algorithm 2).
The final stages of the architectural process entailed the development of an optimal model for forecasting the most opportune moment to dispatch communications. Tests were devised to ascertain the congruity between the information originating from the campaigns and the information received by the ultimate model for the purpose of generating the final forecasts. A remote database was established for the purpose of storing the data required on a daily basis, while an API was designed to perform daily preprocessing and training of the newly acquired data. The ultimate forecasts derived from the training process, including the day and time of transmission, are saved within a local database and subsequently integrated into the API on a weekly basis.
| Algorithm 2 Stacking algorithm (adapted from in [31]) |
|
More details about the Send Frequency Prediction module can be found in [31].
4. Results and Discussion
In this section, we outline the outcomes of our experimental endeavours concerning the designed MLaaS system for marketing purposes. This system has three distinct modules: Churn Prediction, One-2-One Product Recommendation, and Send Frequency Prediction. The performance of each module is assessed through the utilisation of real-world data, and a comprehensive analysis of our discoveries is presented. Moreover, we examine the ramifications of our findings for the discipline of marketing and explore the potential utilisation of our suggested MLaaS framework to attain a competitive edge in the contemporary marketplace that heavily relies on data analysis.
4.1. Churn Prediction
In this section, we show the findings derived from our experimental analysis conducted on the Churn Prediction component within our designed MLaaS framework for marketing purposes. The performance of the module is assessed by the utilisation of real-world customer data, with a comprehensive analysis of the results presented afterwards.
The findings of the churn prediction module for three different versions of the system are presented in Table 1 and Figure 23. The initial column presents the numerical designation of the versions, whereas the subsequent columns display the proportion of anticipated churn instances corresponding to each respective version. The percentage of forecasts made prior to the occurrence of the actual churn event is presented in the third column.

Table 1.
Accuracy for predicted churn cases.

Figure 23.
Predicted churn cases.
In the first version, the accuracy for projected churn instances was 57.60%. This indicates that 57.60% of customers were correctly identified as likely to churn. Additionally, it is noteworthy that 86.6% of the predictions were generated prior to the actual churn occurrence, suggesting that the module successfully identified prospective churn instances.
In the second version, there was a notable rise in the proportion of successfully predicted churn cases, reaching 70.90%. This outcome indicates that enhancements were implemented to enhance the performance of the module. Nevertheless, there was a drop in the proportion of predictions made before to churn occurrences, which amounted to 75.80%.
In the third version, the accuracy rate for correctly predicting churn instances improved to 72.50%, while the rate of predicting churn events before they occurred grew to 78.80%. The findings suggest that Version 3 of the churn prediction module exhibited superior performance compared to the other two versions.
In summary, the findings presented herein showcase the inherent capabilities of our MLaaS framework to accurately forecast customer churn and effectively adopt preemptive strategies to enhance customer retention rates.
4.2. One-2-One Product Recommendation
In this section, we provide the findings of four campaign sendings conducted on the One-2-One Product Recommendation module of the MLaaS system designed for marketing purposes. The performance of the module was assessed using real-world customer data, with a comprehensive analysis of the results presented below.
The results of the campaigns, in which recommendations were selectively supplied to certain users, are presented in Table 2. The table compares the percentage of openings, the simple follow-through monetary value-to-click ratio, and the total income earned for each group. The initial column denotes the campaign number, while the subsequent column displays the number of email openings for two distinct groups (individuals who were provided with recommendations and individuals who were not). The simple follow-through monetary value-to-click ratio for each group is displayed in the third column, indicating the likelihood of a user making a purchase after clicking on the recommendation. The fourth column indicates the aggregate revenue generated for each group.
Table 2.
One-2-One product recommendation results.
The column labelled “#Openings” pertains to the proportion of recipients who accessed the email campaign in each given situation. As an illustration, in the second campaign the inclusion of recommendations resulted in an email open rate of 50.40% among recipients, but the absence of recommendations led to an email open rate of 49.60%. The proportion of email openings serves as a potential measure of the efficacy of the product recommendation system in capturing recipients’ interest and motivating their involvement with the marketing campaign.
Upon examination of the data presented in Figure 24, it is evident that there is no statistically significant disparity in the proportion of recipients who accessed the email, regardless of whether the campaign incorporated product recommendations or not. In campaigns 2, 3, and 4, the disparity in the proportion of openings between the “With Recommendations” and “Without Recommendations” conditions is found to be below 1.00%. Nevertheless, there is a growing inclination towards advertising that includes advice.
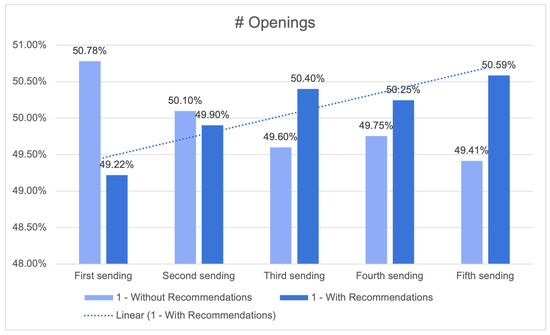
Figure 24.
Number of openings (closer look) with an increasing linear tendency for recommendations.
In general, although the disparity in the proportion of openings between the “With Recommendations” and “Without Recommendations” scenarios is minor, it is noteworthy that the inclusion of the product recommendation system did not significantly hinder the effectiveness of the email campaign.
In fact, it is plausible that the system may have yielded favourable outcomes in the majority of instances. Figure 25 illustrates the ratio between the monetary value obtained from customers who clicked on a product recommendation and subsequently completed a purchase on the one hand, and the monetary value obtained from customers who clicked on a product without a recommendation and completed a purchase.
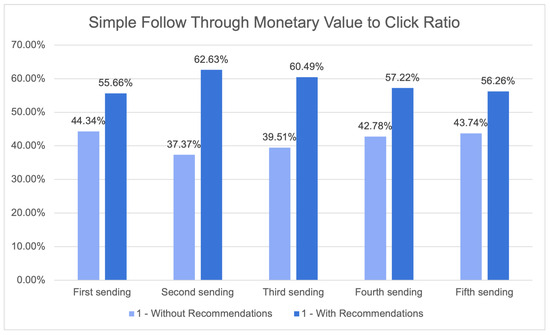
Figure 25.
Simple follow-through monetary value-to-click ratio.
Upon examining the findings, it becomes evident that the advertisements labelled as “With Recommendations” regularly exhibited superior performance compared to the campaigns labelled as “Without Recommendations” in relation to this specific ratio. Across all campaigns, the “With Recommendations” group exhibited a higher ratio, suggesting that customers who were provided with recommendations showed a greater propensity to engage in a transaction and/or make a purchase of higher monetary worth.
In the initial transmission, the proportion for the group receiving recommendations was 62.63%, while the proportion for the group without recommendations was merely 37.37%. This implies that the efficacy of the product recommendations was demonstrated in the augmentation of the monetary worth of purchases made by clients who interacted with them.
The One-2-One Product Recommendation module results table displays the total revenue (Figure 26), which represents the overall income generated by the individual campaigns. This revenue is further categorised based on whether or not recommendations were incorporated.

Figure 26.
Total revenue.
Upon analysing the outcomes, it becomes evident that marketing campaigns using recommendations regularly yielded higher income compared to those that did not include recommendations. In the first sending, the inclusion of suggestions resulted in a revenue of 64.88%, while the exclusion of recommendations led to a revenue of only 35.12%. This pattern remained constant throughout all four campaigns.
In Campaigns 2 to 4, the experimental group that was provided with recommendations exhibited a greater proportion in comparison to the control group that did not receive any suggestions. Furthermore, the campaigns that received recommendations exhibited higher values in terms of both simple follow-through monetary value-to-click ratio and total income earned.
Furthermore, it should be noted that the increase in revenue when incorporating recommendations did not consistently correlate with the corresponding increase in email openings. In Campaign 2, the inclusion of recommendations resulted in a marginal increase in revenue generation compared to when suggestions were not included (55.92% vs. 44.08%). This outcome occurred despite the significant rise in the number of openings accompanied by recommendations. This implies that the One-2-One Product Recommendation module demonstrates efficacy in augmenting revenue even in cases when the rise in sales is not substantial.
In general, these findings suggest that the One-2-One Product Recommendation module is efficacious in augmenting income for marketing campaigns through the provision of individualised product recommendations to clients. The data suggest that the implementation of the One-2-One Product Recommendation module has a favourable effect on the financial value generated per click on the email link. By offering individualised suggestions to recipients, the system is able to stimulate interest and involvement with the email content, leading to a greater rate of action and enhanced revenue for the organisation.
The findings of this study indicate that the provision of recommendations may enhance the probability of a user engaging with a product and subsequently result in increased revenue generating. Additional examination is necessary in order to ascertain the most effective approach for utilising One-2-One product recommendations as a means to enhance income in marketing efforts.
4.3. Send Frequency Prediction
In this section, we present the obtained results for the Send Frequency Prediction module. Similar to the previous modules, the efficacy of this module was evaluated using actual customer information.
The study involved the implementation of four carefully planned and executed email campaigns. Two distinct groups were selected for the purpose of conducting a thorough analysis.
The first group consisted of a specific segment that adhered to a send strategy defined by the client. The objective of this group was to investigate the existing patterns of engagement.
The second group was targeted and received the benefits of our module’s innovative approach. This approach involved dynamically determining the most suitable day and time to deliver emails to each individual customer. The review method involved a thorough assessment of key indicators, such as the open rate, click rate, and average ticket, across several time frames (7, 14, 21, and 28 days). The complete assessment conducted in this study facilitated a thorough comprehension of the campaign performance and the distinct contributions of various sending tactics. This analysis provided insights into the broader effects of customised delivery timing and strategic frequency of sending.
Figure 27 displays the results of the four campaigns for the open rate. The open rate is an important email marketing metric that measures the proportion of recipients who open an email. The results indicate that the open rate percentages for different campaigns vary.
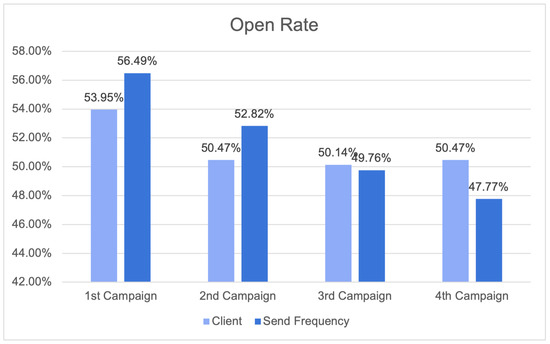
Figure 27.
Open rate results.
Comparing the open rate results across the four campaigns is insufficient to draw firm conclusions about client engagement and the efficacy of different send frequency strategies. Open rates of 56.49% and 52.82% for the Send Frequency module in the first and second campaigns, respectively, indicate consistent engagement. These examples illustrate the capacity of the Send Frequency module to increase engagement. However, the client’s third and fourth campaigns had marginally higher open rates. Overall, the send frequency campaigns outperformed the client’s campaigns by 3.28 percent.
Figure 28 presents the click rate results, providing a comprehensive view of the campaigns’ performance, with a particular emphasis on the impact of send frequency strategies. The campaigns were evaluated based on both client-specific outcomes and send frequency effects. In the first campaign, the client’s click rate was 10.79%, indicating strong client engagement. Intriguingly, when send frequency strategies were implemented, the click rate increased to 11.44%, highlighting the importance of send frequency in optimising click interactions. Similarly, the click rate for the second client campaign increased from 8.62% to 9.24% with the Send Frequency module. The click rate of 5.28% for the third campaign indicates consistent engagement, while the click rate of 5.09% for send frequency suggests that consistent strategies maintain their effectiveness. The client’s fourth campaign generated a click rate of 7.78%, which remained consistent at 7.73% with the Send Frequency module.
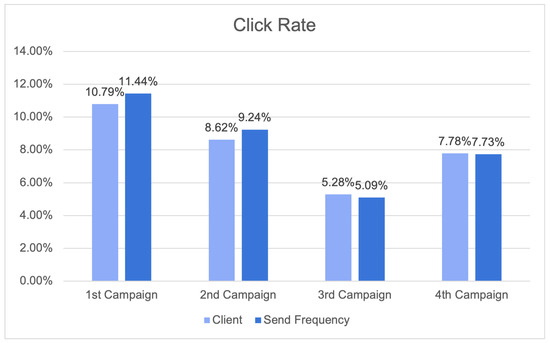
Figure 28.
Click rate results.
In general, the implementation of the send frequency campaigns resulted in an 8.89% increase in click rates when compared to the client’s own campaigns. The results of this study highlight the importance of send frequency in sustaining levels of engagement and optimising click rates in various campaigns.
The analysis of the seven-day average ticket is crucial to effectively determine the optimal time slot for delivering campaigns through the Send Frequency module. This examination is of paramount importance in order for businesses and organisations to acquire valuable insights regarding their revenue trends and client expenditure patterns within a designated time frame. This statistic offers a concise representation of the money generated during a week, allowing organisations to effectively track and analyse short-term revenue patterns. The provided information holds significant value in the assessment of marketing campaign efficacy. Examining the mean ticket value during a seven-day period can help to facilitate the identification of customer expenditure trends and inclinations.
Figure 29 illustrates the outcomes of the seven-day average ticket, providing insights into revenue patterns and the influence of send frequency tactics across various campaigns. The results relevant to each campaign are compared with the impact of send frequency, providing significant information.
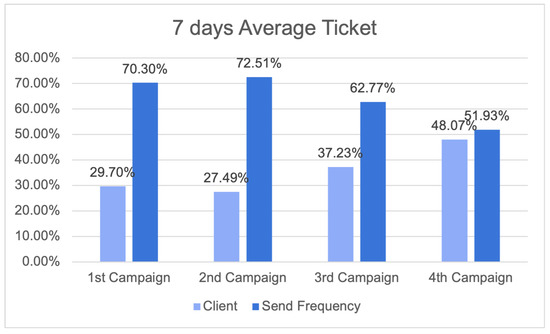
Figure 29.
Results for seven-day average ticket.
In the first campaign, clients contributed 29.70% of the average ticket value; however, the send frequency factor had a substantial impact, contributing to 70.30% of the outcomes. In the second campaign, it was seen that clients contributed 27.49% to the average ticket, while send frequency contributed 72.51%, demonstrating a comparable pattern. In the third campaign, there was a large rise in the client share, reaching 37.23%, while send frequency techniques continued to play a significant role, contributing 62.77% to the overall impact. In the fourth campaign, it was observed that clients accounted for 48.07% of the average ticket, while send frequency techniques contributed 51.93%.
These findings underscore the significant impact of send frequency on the average ticket over a seven-day period, underscoring the intricate relationship between revenue generated by clients and the tactics implemented to enhance revenue streams. These data highlight the importance of the send frequency in influencing revenue patterns and emphasise the necessity of organisations meticulously managing these strategies to achieve long-term growth and prosperity.
To obtain a more comprehensive understanding of the effects of Send Frequency campaigns, it is imperative to carry out an analysis of the average ticket outcomes over varying time periods, specifically spanning 7, 14, 21, and 28 days, which collectively represent the results for a one-month duration. Examining the mean value of tickets over the course of a month holds significant significance for enterprises, as it provides a succinct yet influential understanding of client expenditure patterns and income tendencies.
The average ticket results are shown in Table 3 and in Figure 30 and Figure 31. These results provide a thorough analysis of the average ticket over a one-month period, emphasising the impact of various durations and send frequency techniques on both client and send frequency campaigns.
Table 3.
Average ticket results.

Figure 30.
Average ticket results. In the left, the results obtained by the client. In the right, the results obtained by our approach.
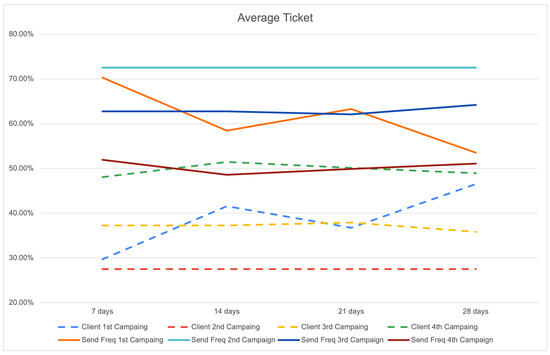
Figure 31.
Average ticket results for all the campaings.
In the initial campaign, the average ticket of the clients exhibits temporal variation, with percentages ranging from 29.70% to 46.49%. Significantly, send frequency techniques have a crucial impact, accounting for percentages ranging from 53.51% to 70.30%. The results of the second campaign indicate that customer donations remained consistently at 27.49% over all durations, while SF strategies consistently accounted for 72.51%.
During the third campaign, the campaigns made by clients exhibited variability, ranging from 35.82% to 37.91% across various durations. In contrast, the implementation of send frequency techniques consistently encompassed a range of 62.09% to 64.18%. The fourth campaign highlights several levels of client donations, ranging from 48.07% to 51.43%. Similarly, the send frequency techniques contribute percentages ranging from 48.57% to 51.93%.
These findings highlight the dynamic relationship between customer behaviour and send frequency techniques in various campaigns and time periods. The utilisation of send frequency techniques significantly influences revenue outcomes, as seen by the average ticket results provided above. The aforementioned data highlight the significance of modifying the temporal aspects of client interactions to achieve a substantial impact on their contribution to the average ticket.
By implementing strategic optimisation techniques for send frequency initiatives, organisations have the potential to improve their revenue streams, ensure ongoing engagement, and strike a harmonious balance between client-driven contributions and those resulting from timely communication. The utilisation of send frequency techniques has become a crucial method for customising interactions based on consumer preferences, optimising the allocation of resources, and eventually facilitating total revenue growth.
5. Conclusions
This study explores the use of MLaaS in marketing, highlighting its potential to transform customer engagement and decision-making in a data-driven era. The presented MLaaS system provides a flexible and scalable platform for predictive analytics, enabling marketers to make informed decisions that lead to effective campaigns and tailored interactions. This study examines Open Rate, Click Rate, and Average Ticket outcomes, focusing on campaigns based on client-determined tactics and AI-guided message delivery times. Campaigns with AI-driven send timing show better Open Rates and Click Rates, demonstrating the potential of MLaaS to enhance consumer interaction dynamics.
However, there are still limitations, such as the importance of send frequency techniques, which can significantly impact revenue patterns and customer expenditure patterns. The Churn Prediction module allows institutions to forecast customer loss and implement proactive retention strategies, while the One-2-One Product Recommendation module generates personalized product recommendations based on individual client data. Finally, the Send Frequency Prediction module shows the efficacy of strategically timed communication in fostering increased engagement and generating revenue expansion.
Future work should focus on client segmentation tactics, ethical MLaaS, data protection, transparency, and the incorporation of technologies such as natural language processing, large language models, and enhanced personalisation algorithms. The system’s implementation in various sectors presents opportunities for significant effects. The performance, throughput, and capacity metrics were not influenced by the results; however, further studies are needed. Overall, this article offers a significant addition to the MLaaS domain in marketing, emphasizing the revolutionary capacity of MLaaS to facilitate client engagement, enhance revenue generation, and influence data-driven marketing initiatives.
Author Contributions
Conceptualisation, I.P., D.C., M.Â.R. and C.A.; methodology, I.P., D.C., M.Â.R. and C.A.; software, D.C., M.Â.R. and C.A.; validation, A.M., N.B. and D.A.d.O.; formal analysis, I.P., A.M., N.B. and D.A.d.O.; investigation, I.P., D.C., M.Â.R. and C.A.; resources, D.C., M.Â.R., C.A. and D.A.d.O.; data curation, D.C., M.Â.R. and C.A.; writing—original draft preparation, I.P.; writing—review and editing, I.P., A.M., N.B., D.C., M.Â.R. and D.A.d.O.; visualisation, I.P., D.C., M.Â.R. and C.A.; supervision, I.P. and D.A.d.O.; project administration, I.P. and D.A.d.O.; funding acquisition, I.P. and D.A.d.O. All authors have read and agreed to the published version of the manuscript.
Funding
This article is a result of the project “Criação de um Núcleo de I&D para a geração de novo conhecimento nas áreas de Inteligência Artificial, Machine Learning, Intelligent Marketing e One-2-One Marketing”, handled by the Operational Programme for Competitiveness and Internationalisation (COMPETE 2020) through the European Regional Development Fund (ERDF) under the PORTUGAL 2020 Partnership Agreement.
Institutional Review Board Statement
Not applicable.
Informed Consent Statement
Not applicable.
Data Availability Statement
The data presented in this study are available on request from the corresponding author due to company’s ownership.
Acknowledgments
The authors gratefully acknowledge a Portuguese company, E-goi, for trusting us and allowing us to develop this project.
Conflicts of Interest
Authors Ivo Pereira, Duarte Coelho, Miguel Ângelo Rebelo, Carolina Araújo, and Daniel Alves de Oliveira are employed by the company E-goi. The remaining authors declare that the research was conducted in the absence of any commercial or financial relationships that could be construed as a potential conflict of interest.
Abbreviations
The following abbreviations are used in this manuscript:
| AI | Artificial Intelligence |
| API | Application Programming Interface |
| AWS | Amazon Web Services |
| BG/NBD | Beta-Geometric/Negative Binomial Distribution |
| CRISP-DM | Cross Industry Standard Process for Data Mining |
| DB | Database |
| ML | Machine Learning |
| MLaaS | Machine Learning as a Service |
| SaaS | Software as a Service |
| SFTP | Secure File Transfer Protocol |
References
- Statista. Volume of Data/Information Created, Captured, Copied, and Consumed Worldwide from 2010 to 2020, with Forecasts from 2021 to 2025. 2021. Available online: https://www.statista.com/statistics/871513/worldwide-data-created/ (accessed on 3 November 2023).
- Huang, M.H.; Rust, R.T. A strategic framework for artificial intelligence in marketing. J. Acad. Mark. Sci. 2021, 49, 30–50. [Google Scholar] [CrossRef]
- Saldamli, G.; Nishit, D.; Vishal, G.; Jainish, P.; Mihir, P.; Ertaul, L. Analysis of Machine Learning as a Service. In Proceedings of the 17th International Conference on Grid, Cloud, & Cluster Computing, GCC’21, Melbourne, Australia, 10–13 May 2021. [Google Scholar]
- Philipp, R.; Mladenow, A.; Strauss, C.; Völz, A. Machine learning as a service: Challenges in research and applications. In Proceedings of the 22nd International Conference on Information Integration and Web-Based Applications & Services, Chiang Mai, Thailand, 30 November–2 December 2020; pp. 396–406. [Google Scholar]
- Grigoriadis, I.; Vrochidou, E.; Tsiatsiou, I.; Papakostas, G.A. Machine Learning as a Service (MLaaS)—An Enterprise Perspective. In Proceedings of the International Conference on Data Science and Applications: ICDSA, Kolkata, India, 26–27 March 2022; Springer: Berlin/Heidelberg, Germany, 2023; Volume 2, pp. 261–273. [Google Scholar]
- Raghavan, R.S.; Jayasimha, K.R.; Nargundkar, R.V. Impact of software as a service (SaaS) on software acquisition process. J. Bus. Ind. Mark. 2020, 35, 757–770. [Google Scholar] [CrossRef]
- Tafti, A.P.; LaRose, E.; Badger, J.C.; Kleiman, R.; Peissig, P. Machine learning-as-a-service and its application to medical informatics. In Proceedings of the Machine Learning and Data Mining in Pattern Recognition: 13th International Conference, MLDM 2017, New York, NY, USA, 15–20 July 2017; Proceedings 13. Springer: Berlin/Heidelberg, Germany, 2017; pp. 206–219. [Google Scholar]
- Loreti, D.; Lippi, M.; Torroni, P. Parallelizing Machine Learning as a service for the end-user. Future Gener. Comput. Syst. 2020, 105, 275–286. [Google Scholar] [CrossRef]
- Assem, H.; Xu, L.; Buda, T.S.; O’Sullivan, D. Machine learning as a service for enabling Internet of Things and People. Pers. Ubiquitous Comput. 2016, 20, 899–914. [Google Scholar] [CrossRef]
- Ribeiro, M.; Grolinger, K.; Capretz, M.A. Mlaas: Machine learning as a service. In Proceedings of the 2015 IEEE 14th International Conference on Machine Learning and Applications (ICMLA), Miami, FL, USA, 9–11 December 2015; pp. 896–902. [Google Scholar]
- Chan, S.; Stone, T.; Szeto, K.P.; Chan, K.H. PredictionIO: A distributed machine learning server for practical software development. In Proceedings of the 22nd ACM international conference on Information & Knowledge Management, San Francisco, CA, USA, 27 October–1 November 2013; pp. 2493–2496. [Google Scholar]
- Baldominos, A.; Albacete, E.; Saez, Y.; Isasi, P. A scalable machine learning online service for big data real-time analysis. In Proceedings of the 2014 IEEE Symposium on Computational Intelligence in Big Data (CIBD), Orlando, FL, USA, 9–12 December 2014; pp. 1–8. [Google Scholar]
- Ooms, J. The OpenCPU system: Towards a universal interface for scientific computing through separation of concerns. arXiv 2014, arXiv:1406.4806. [Google Scholar]
- Strickland, E. IBM Watson, heal thyself: How IBM overpromised and underdelivered on AI health care. IEEE Spectr. 2019, 56, 24–31. [Google Scholar] [CrossRef]
- Villegas-Ch, W.; Román-Cañizares, M.; Palacios-Pacheco, X. Improvement of an online education model with the integration of machine learning and data analysis in an LMS. Appl. Sci. 2020, 10, 5371. [Google Scholar] [CrossRef]
- Carman, M.K. Using Quizlet to Enhance Learner Agency and Self-Efficacy in EFL. In Teacher Efficiacy, Learner Agency; JALT: Tokyo, Japan, 2019; pp. 516–525. [Google Scholar]
- Shekhawat, S.S.; Shringi, S.; Sharma, H. Twitter sentiment analysis using hybrid Spider Monkey optimization method. Evol. Intell. 2021, 14, 1307–1316. [Google Scholar] [CrossRef]
- Balasudarsun, N.; Sathish, M.; Gowtham, K. Optimal ways for companies to use Facebook Messenger Chatbot as a Marketing Communication Channel. Asian J. Bus. Res. 2018, 8, 1. [Google Scholar] [CrossRef]
- Zhang, R.; Chen, W.; Xu, M.; Yang, Y. Analysis and Design of Voice Assisted Learning System Based on Baidu AI. In Proceedings of the 2019 IEEE International Conference on Computer Science and Educational Informatization (CSEI), Kunming, China, 16–19 August 2019; pp. 334–336. [Google Scholar]
- Rao, Q.; Frtunikj, J. Deep learning for self-driving cars: Chances and challenges. In Proceedings of the 1st International Workshop on Software Engineering for AI in Autonomous Systems, Gothenburg Sweden, 28 May 2018; pp. 35–38. [Google Scholar]
- Gomez-Uribe, C.A.; Hunt, N. The netflix recommender system: Algorithms, business value, and innovation. ACM Trans. Manag. Inf. Syst. TMIS 2015, 6, 1–19. [Google Scholar] [CrossRef]
- Aggarwal, K.; Mijwil, M.M.; Al-Mistarehi, A.H.; Alomari, S.; Gök, M.; Alaabdin, A.M.Z.; Abdulrhman, S.H. Has the future started? The current growth of artificial intelligence, machine learning, and deep learning. Iraqi J. Comput. Sci. Math. 2022, 3, 115–123. [Google Scholar]
- Panpatte, S.; Ganeshkumar, C. Artificial intelligence in agriculture sector: Case study of blue river technology. In Proceedings of the Second International Conference on Information Management and Machine Intelligence: ICIMMI 2020, Jaipur, India, 24–25 July 2020; Springer: Berlin/Heidelberg, Germany, 2021; pp. 147–153. [Google Scholar]
- Haleem, A.; Javaid, M.; Qadri, M.A.; Singh, R.P.; Suman, R. Artificial intelligence (AI) applications for marketing: A literature-based study. Int. J. Intell. Netw. 2022, 3, 119–132. [Google Scholar] [CrossRef]
- Merkel, D. Docker: Lightweight linux containers for consistent development and deployment. Linux J. 2014, 239, 2. [Google Scholar]
- Shearer, C. The CRISP-DM model: The new blueprint for data mining. J. Data Warehous. 2000, 5, 13–22. [Google Scholar]
- Fader, P.S.; Hardie, B.G.S.; Lee, K.L. Counting Your Customers the Easy Way: An Alternative to the Pareto/NBD Model. Mark. Sci. 2005, 24, 275–284. [Google Scholar] [CrossRef]
- Sarwar, B.; Karypis, G.; Konstan, J.; Riedl, J. Item-based collaborative filtering recommendation algorithms. In Proceedings of the 10th International Conference on World Wide Web, ACM, Hong Kong, 1–5 May 2001; pp. 285–295. [Google Scholar] [CrossRef]
- Zhou, Y.; Wilkinson, D.; Schreiber, R.; Pan, R. Large-scale parallel collaborative filtering for the Netflix prize. In Proceedings of the Algorithmic Aspects in Information and Management: 4th International Conference, AAIM 2008, Shanghai, China, 23–25 June 2008; Proceedings 4. Springer: Berlin/Heidelberg, Germany, 2008; pp. 337–348. [Google Scholar] [CrossRef]
- Rebelo, M.Â.; Coelho, D.; Pereira, I.; Fernandes, F. A New Cascade-Hybrid Recommender System Approach for the Retail Market. In Proceedings of the Innovations in Bio-Inspired Computing and Applications; Abraham, A., Madureira, A.M., Kaklauskas, A., Gandhi, N., Bajaj, A., Muda, A.K., Kriksciuniene, D., Ferreira, J.C., Eds.; Springer: Cham, Switzerland, 2022; pp. 371–380. [Google Scholar]
- Araújo, C.; Soares, C.; Pereira, I.; Coelho, D.; Rebelo, M.Â.; Madureira, A. A Novel Approach for Send Time Prediction on Email Marketing. Appl. Sci. 2022, 12, 8310. [Google Scholar] [CrossRef]


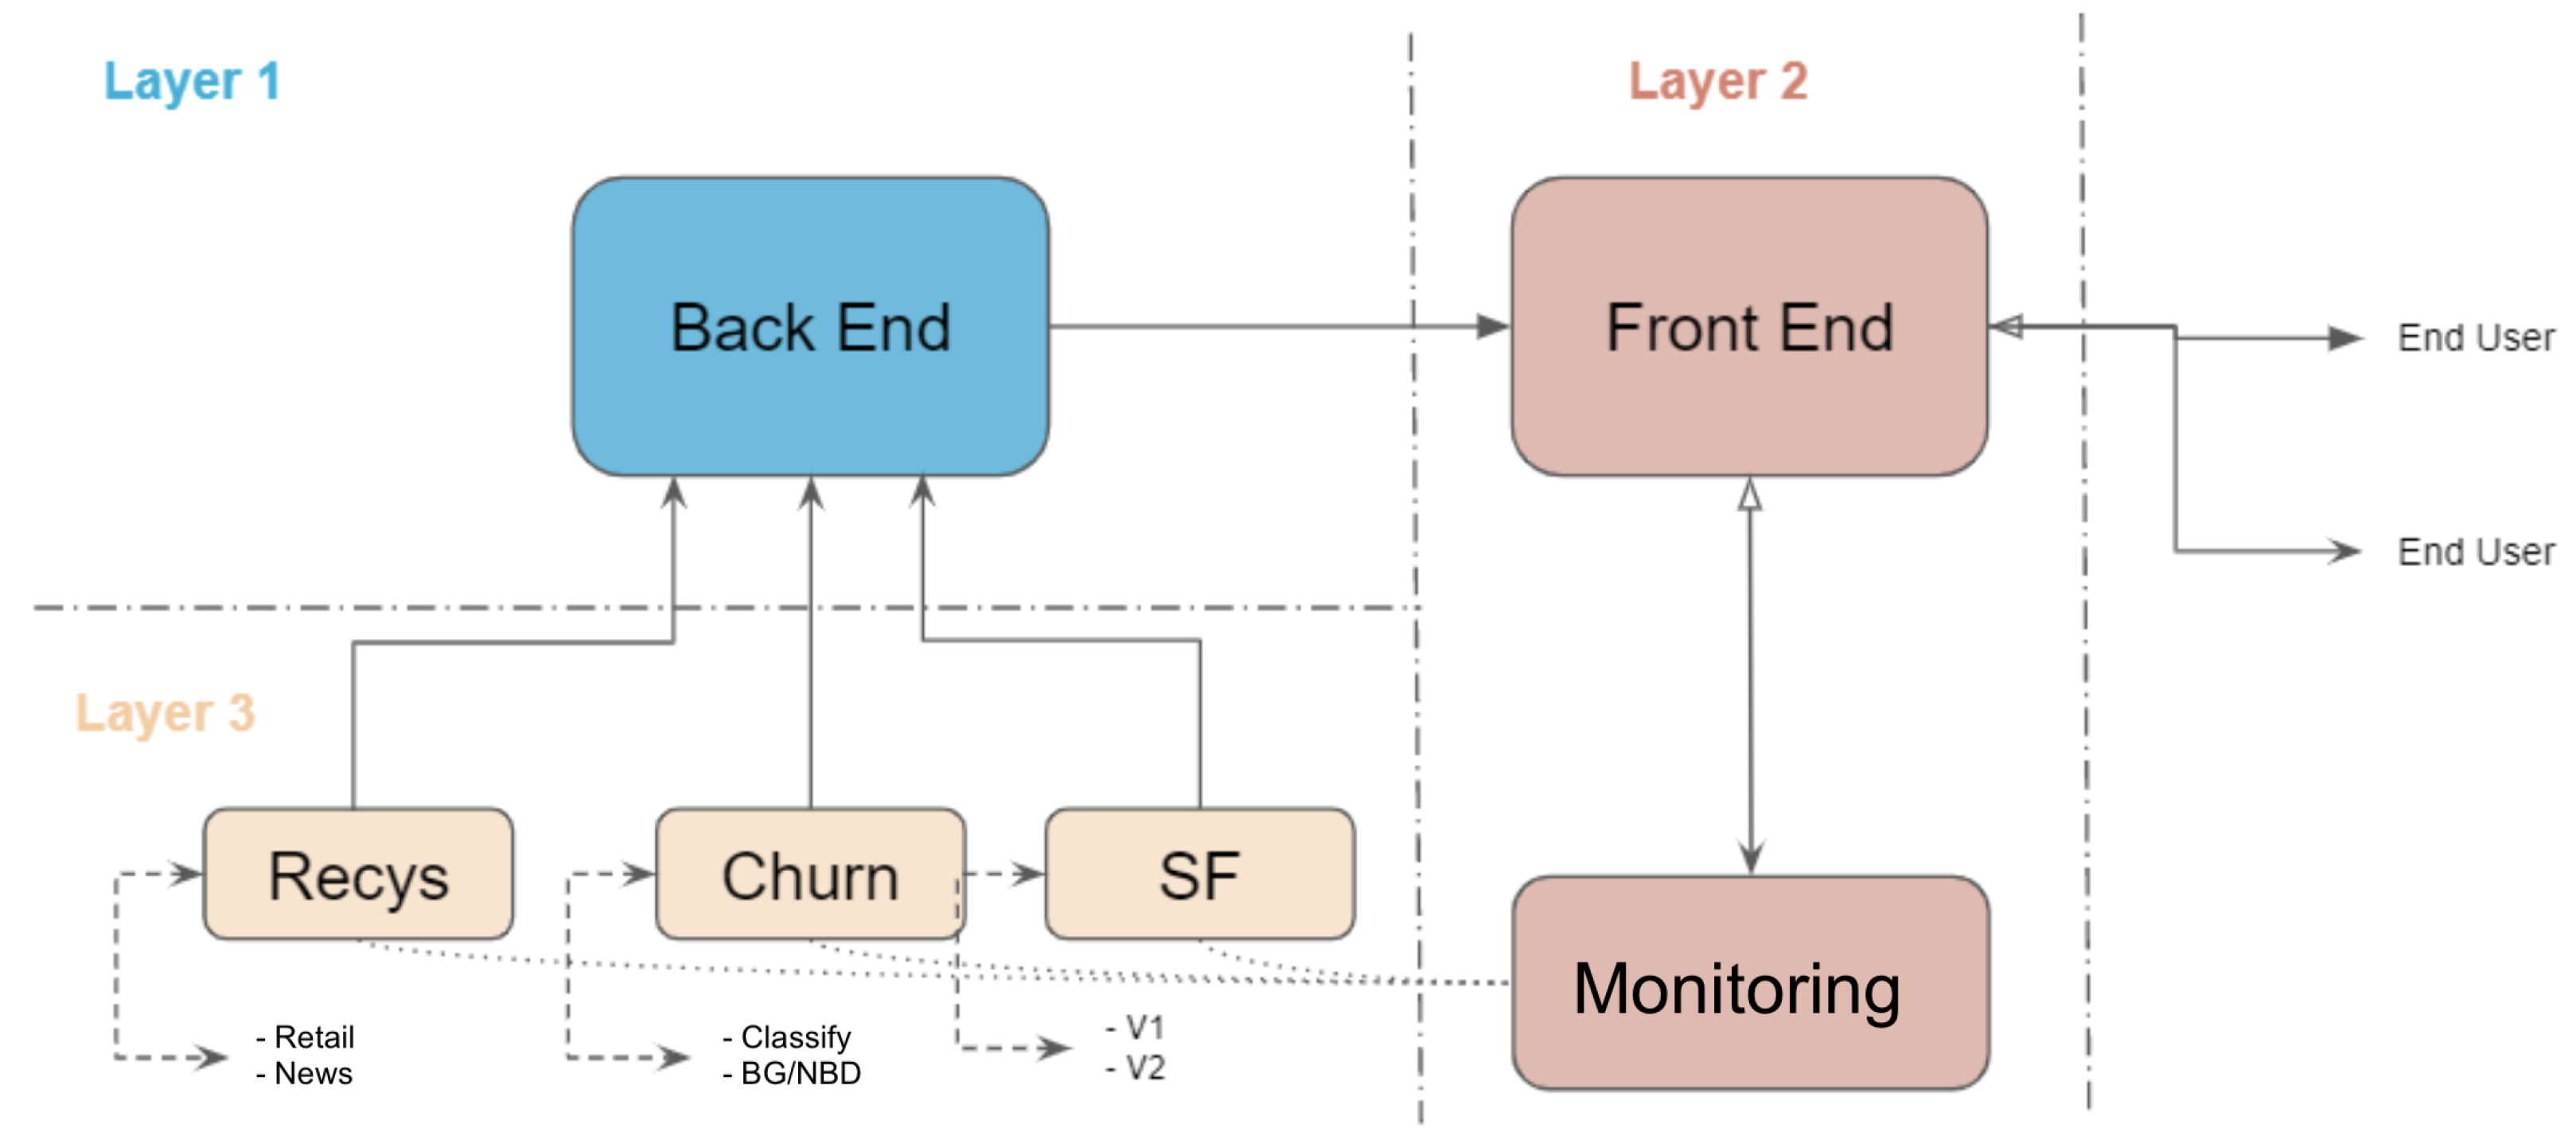


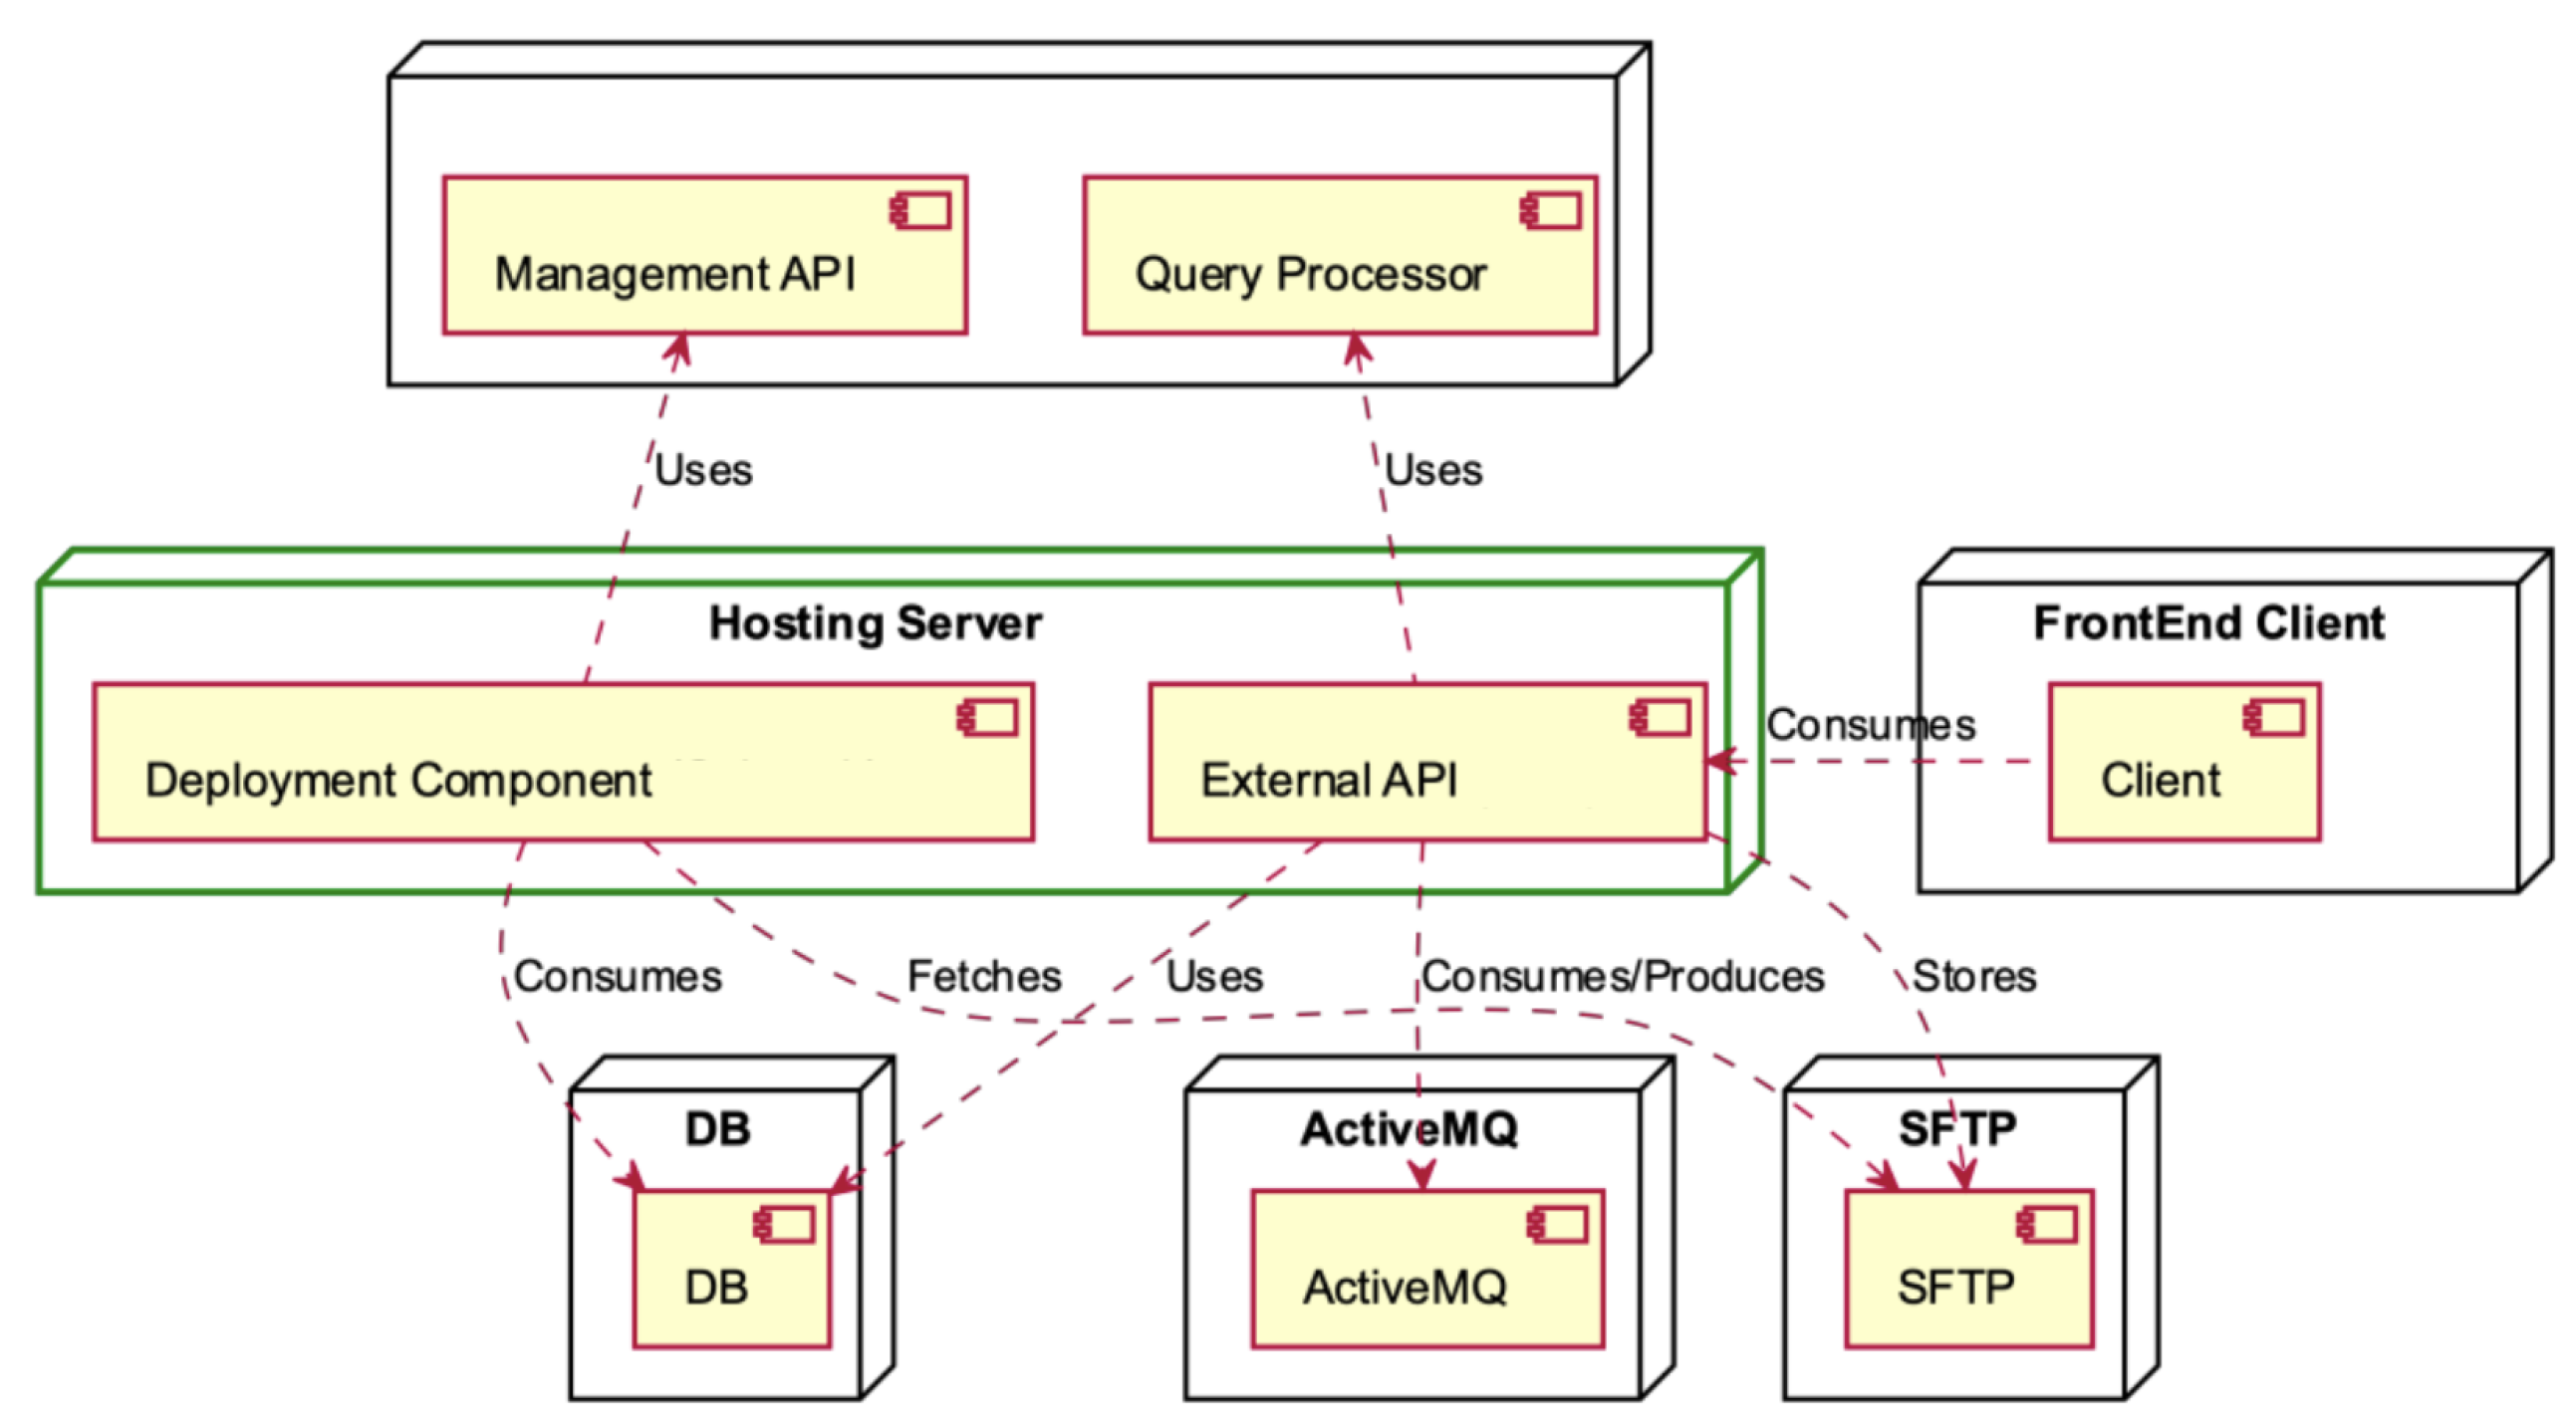
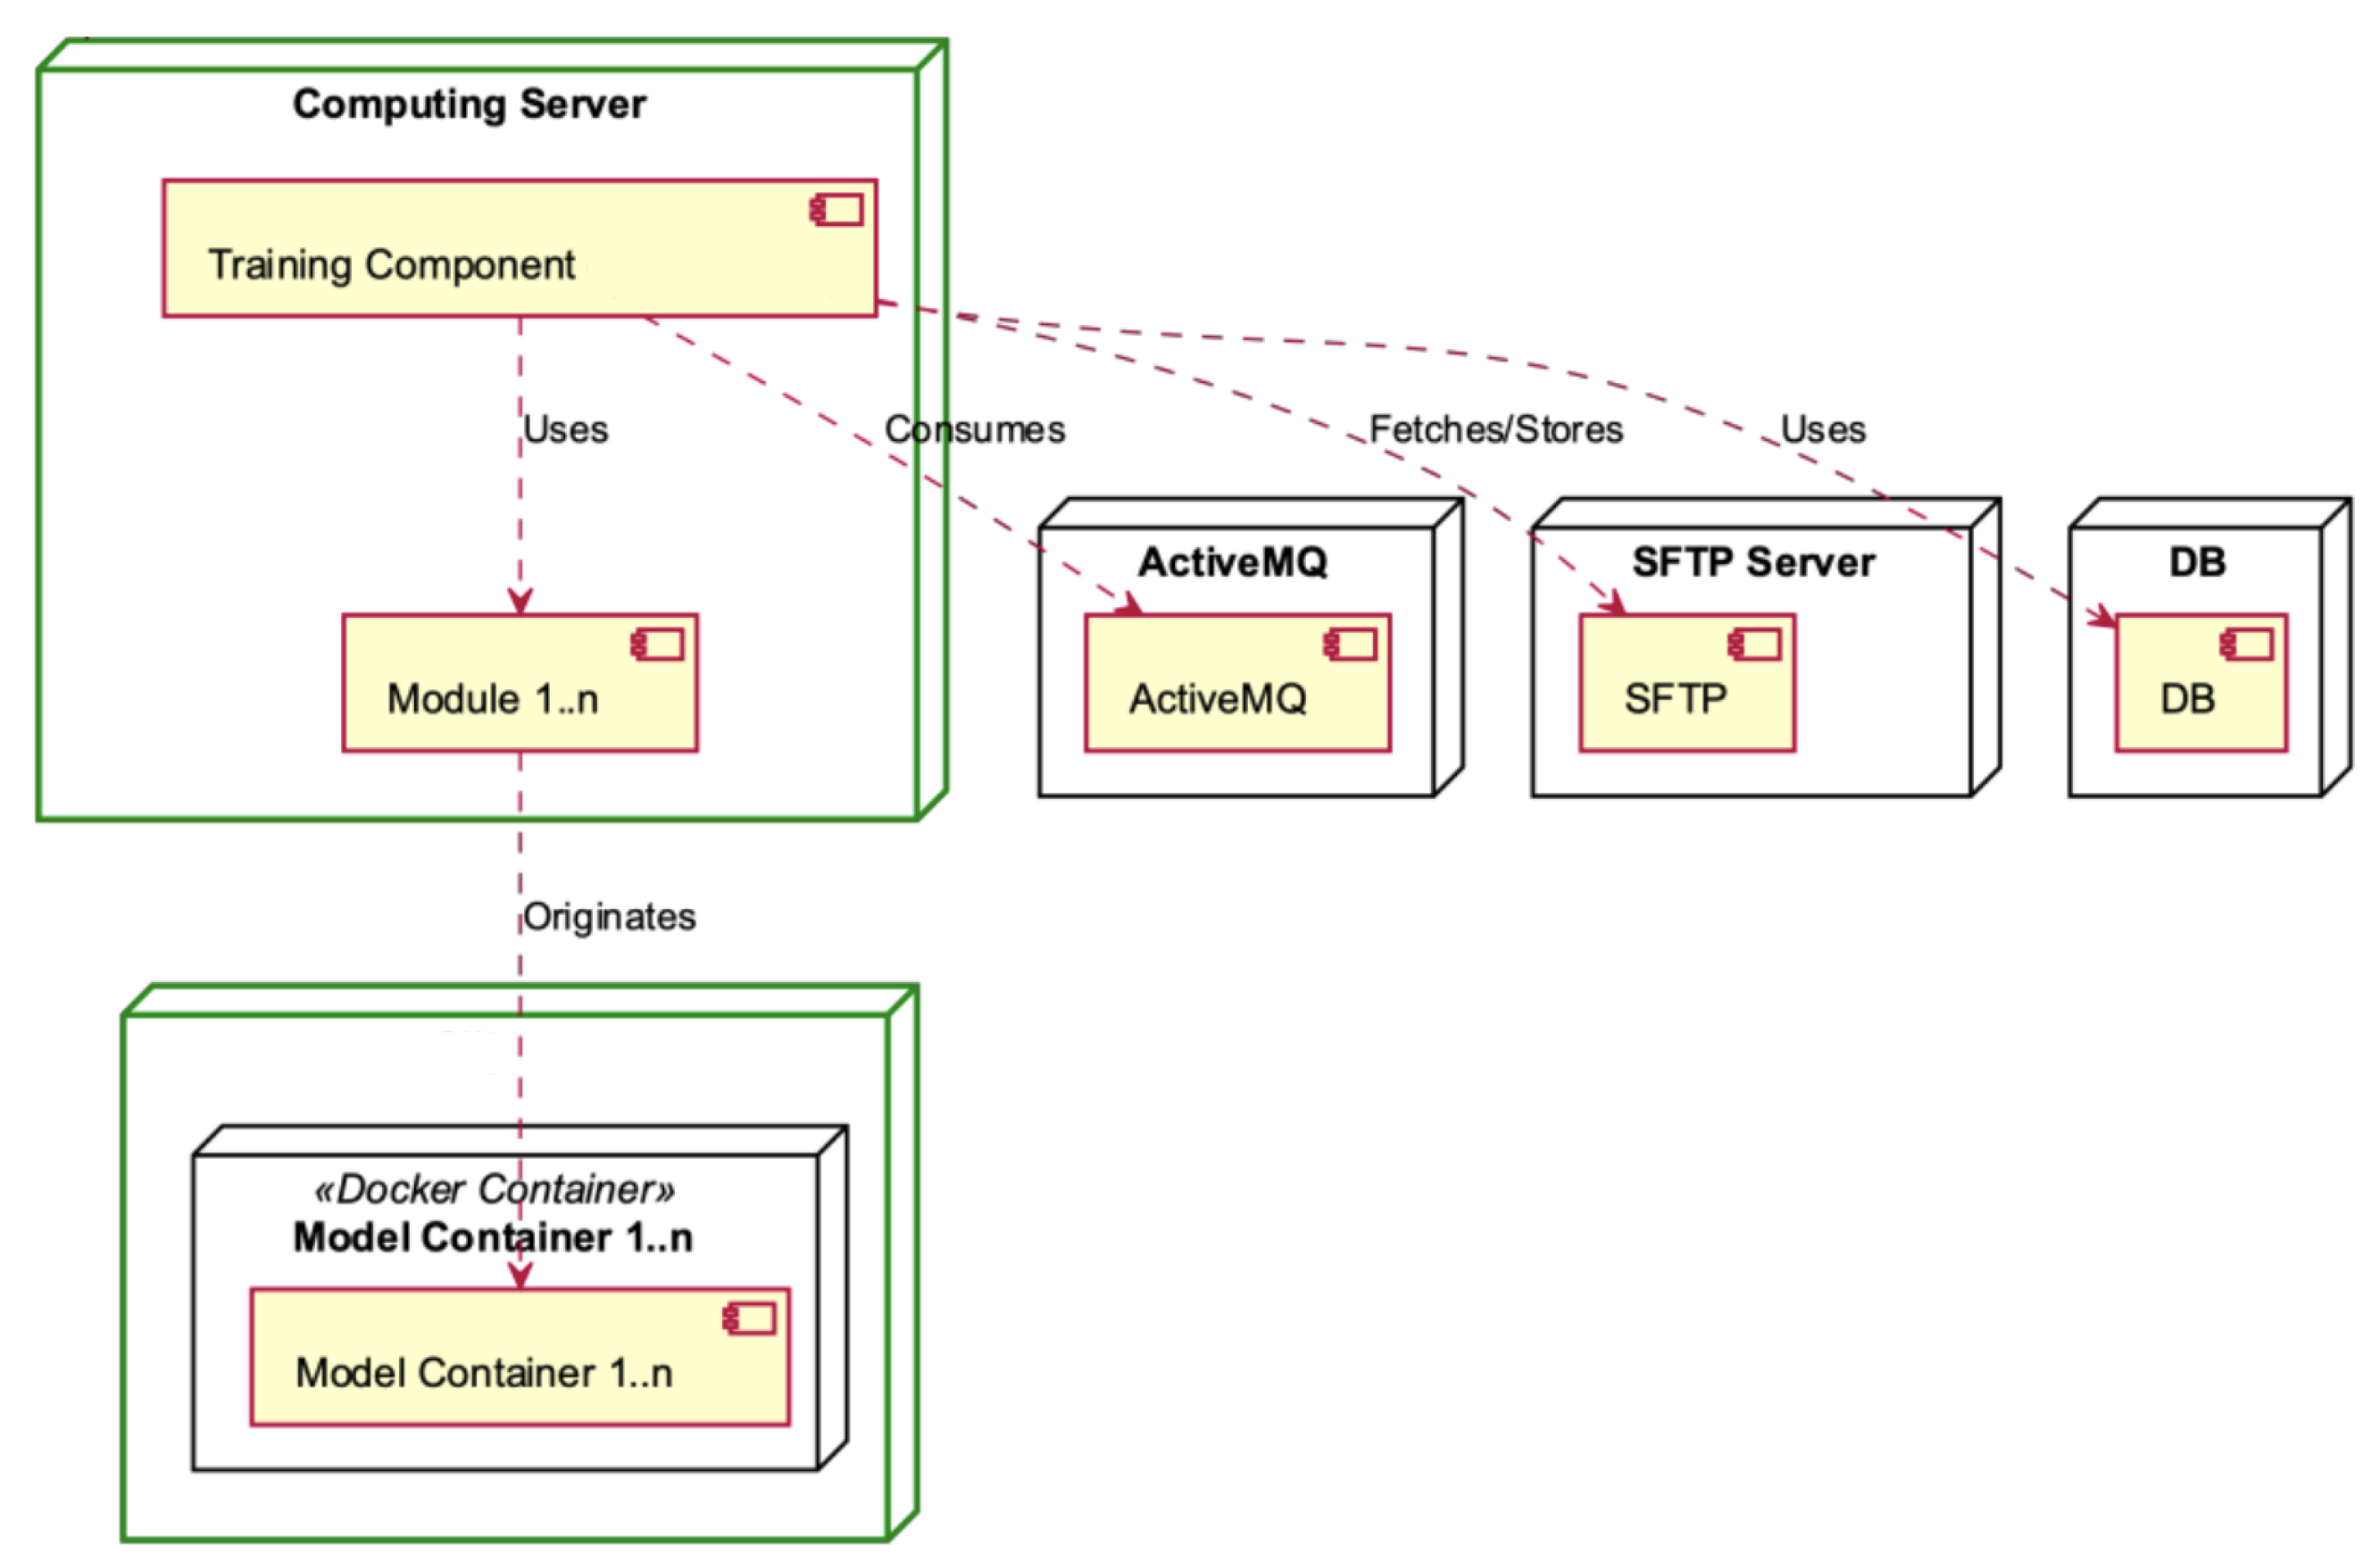
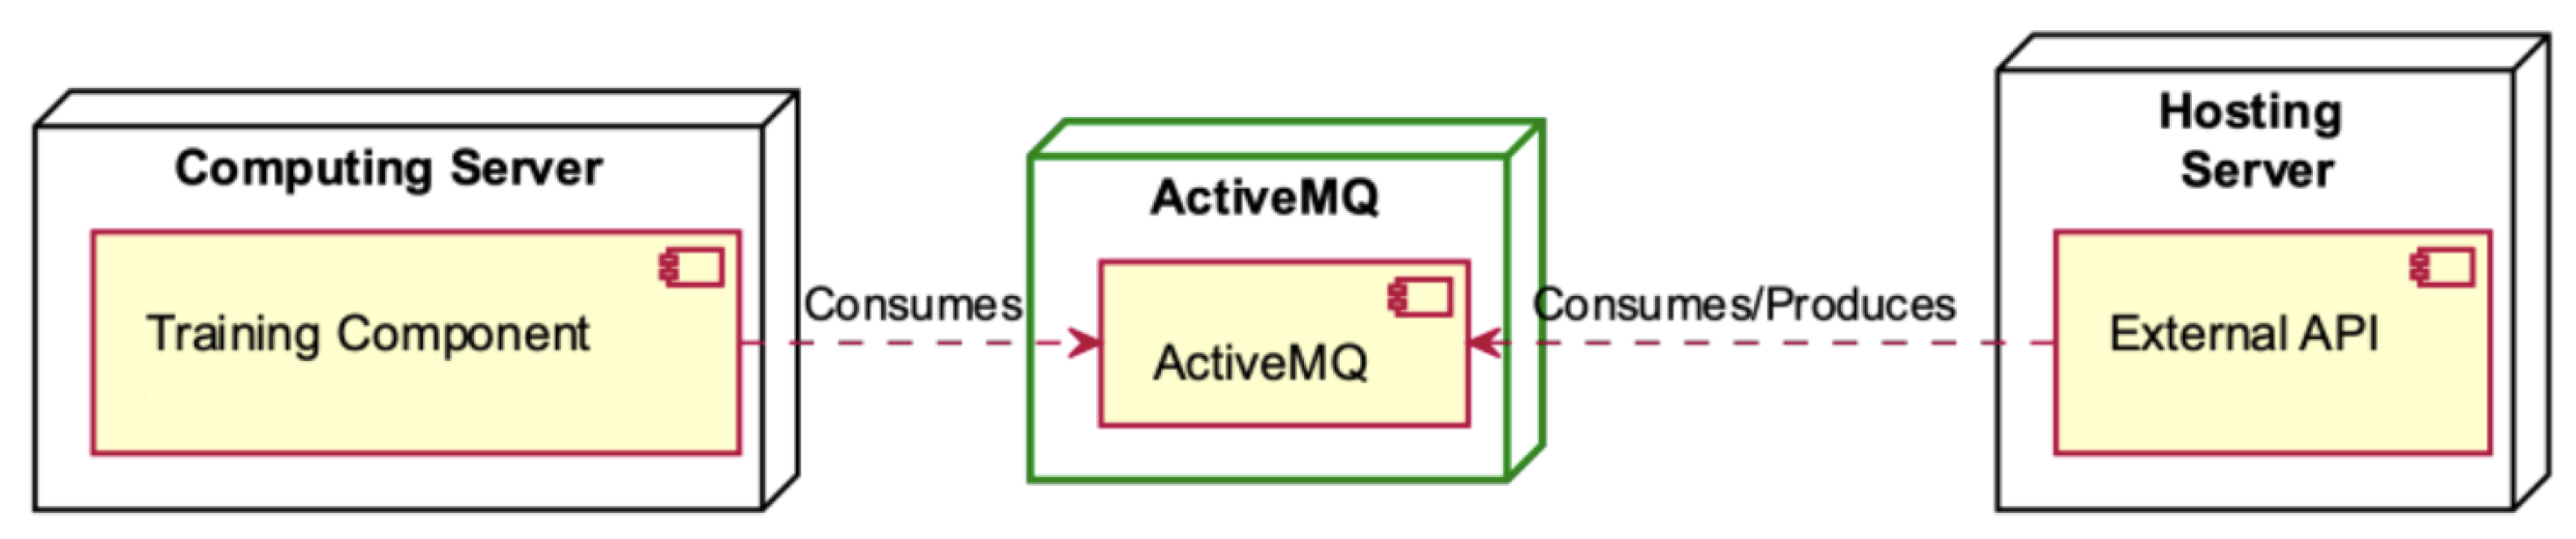


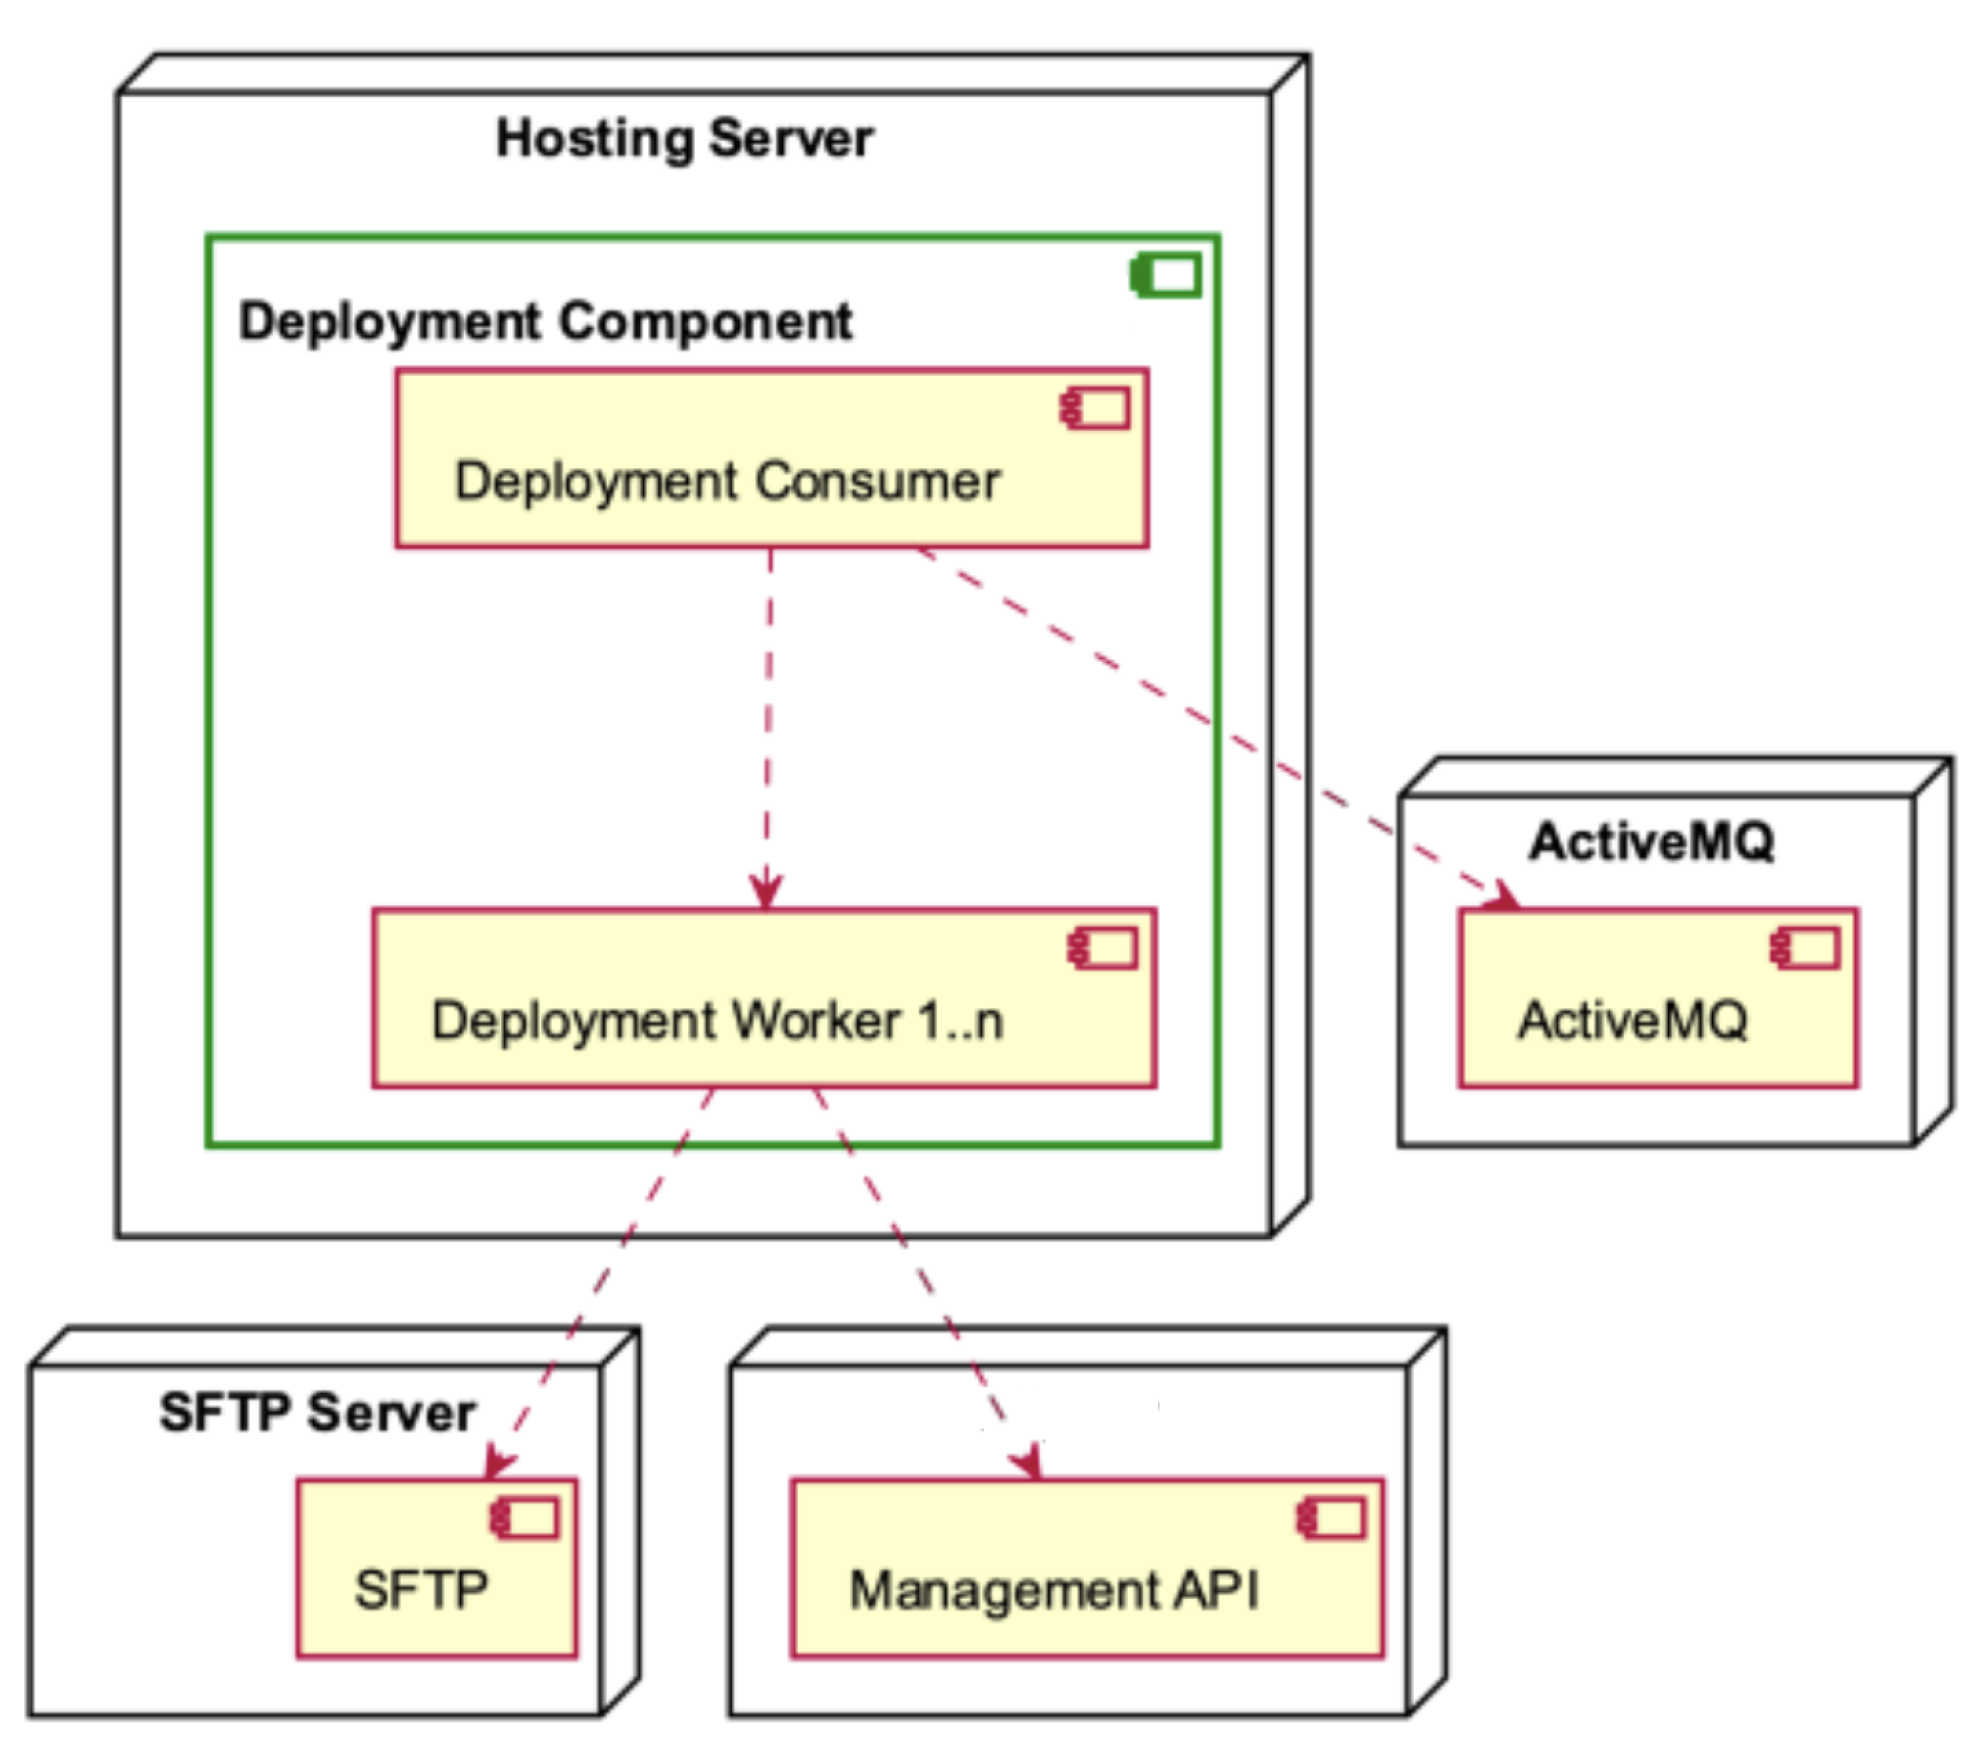
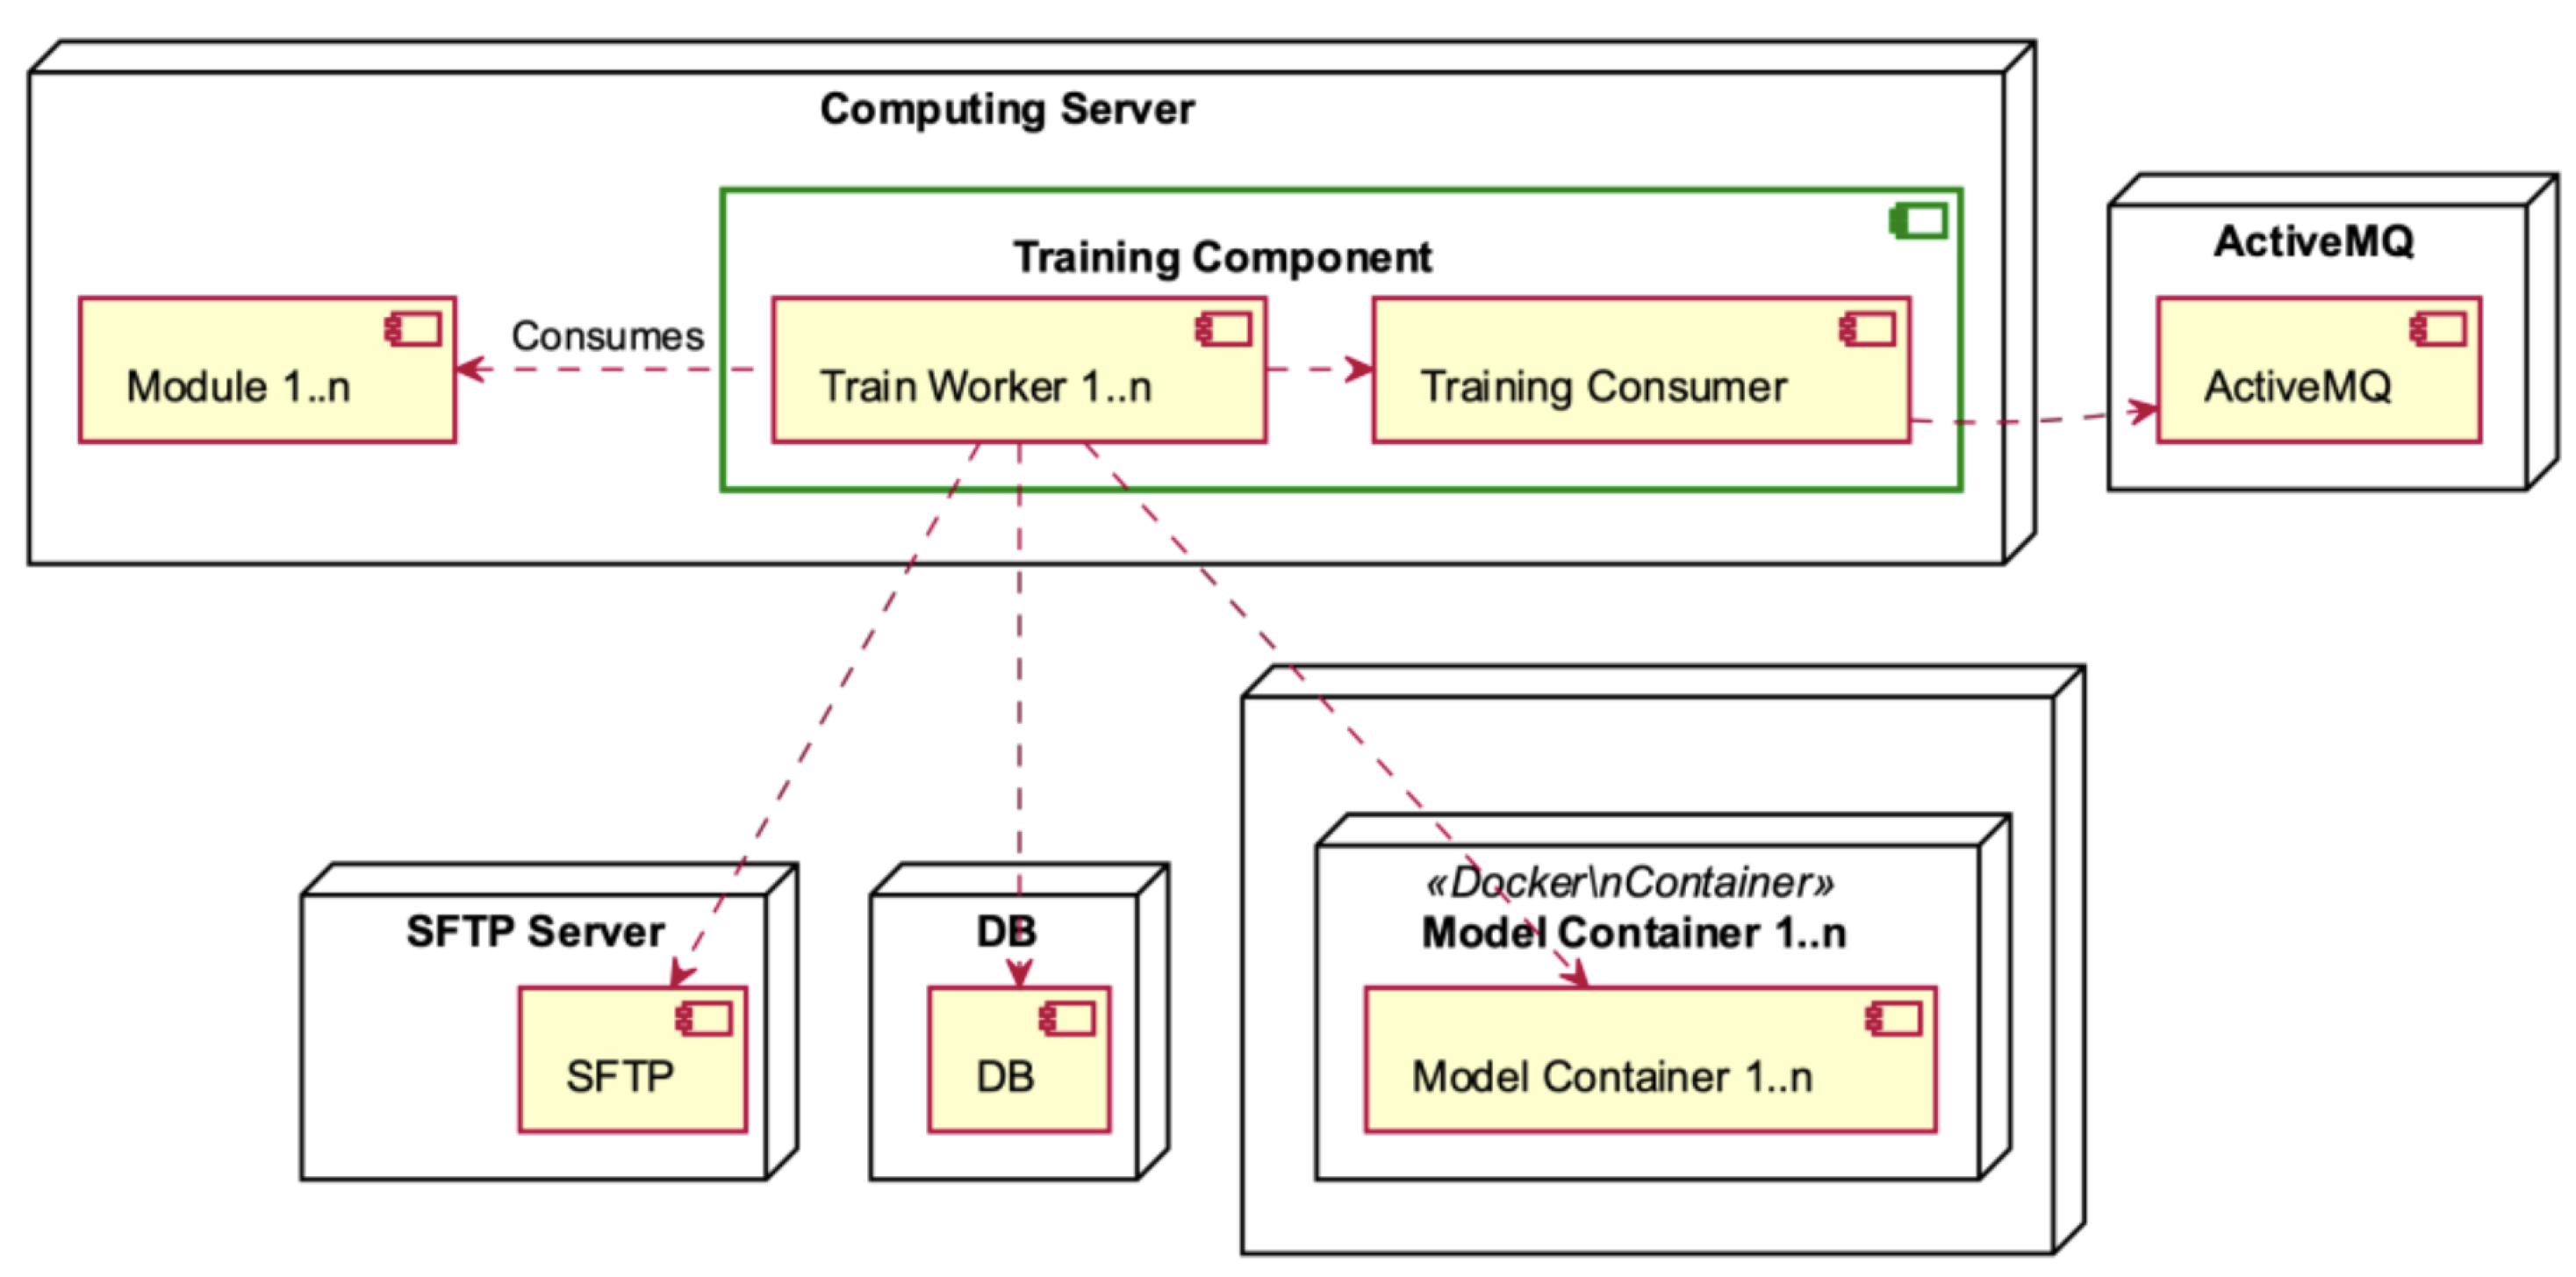
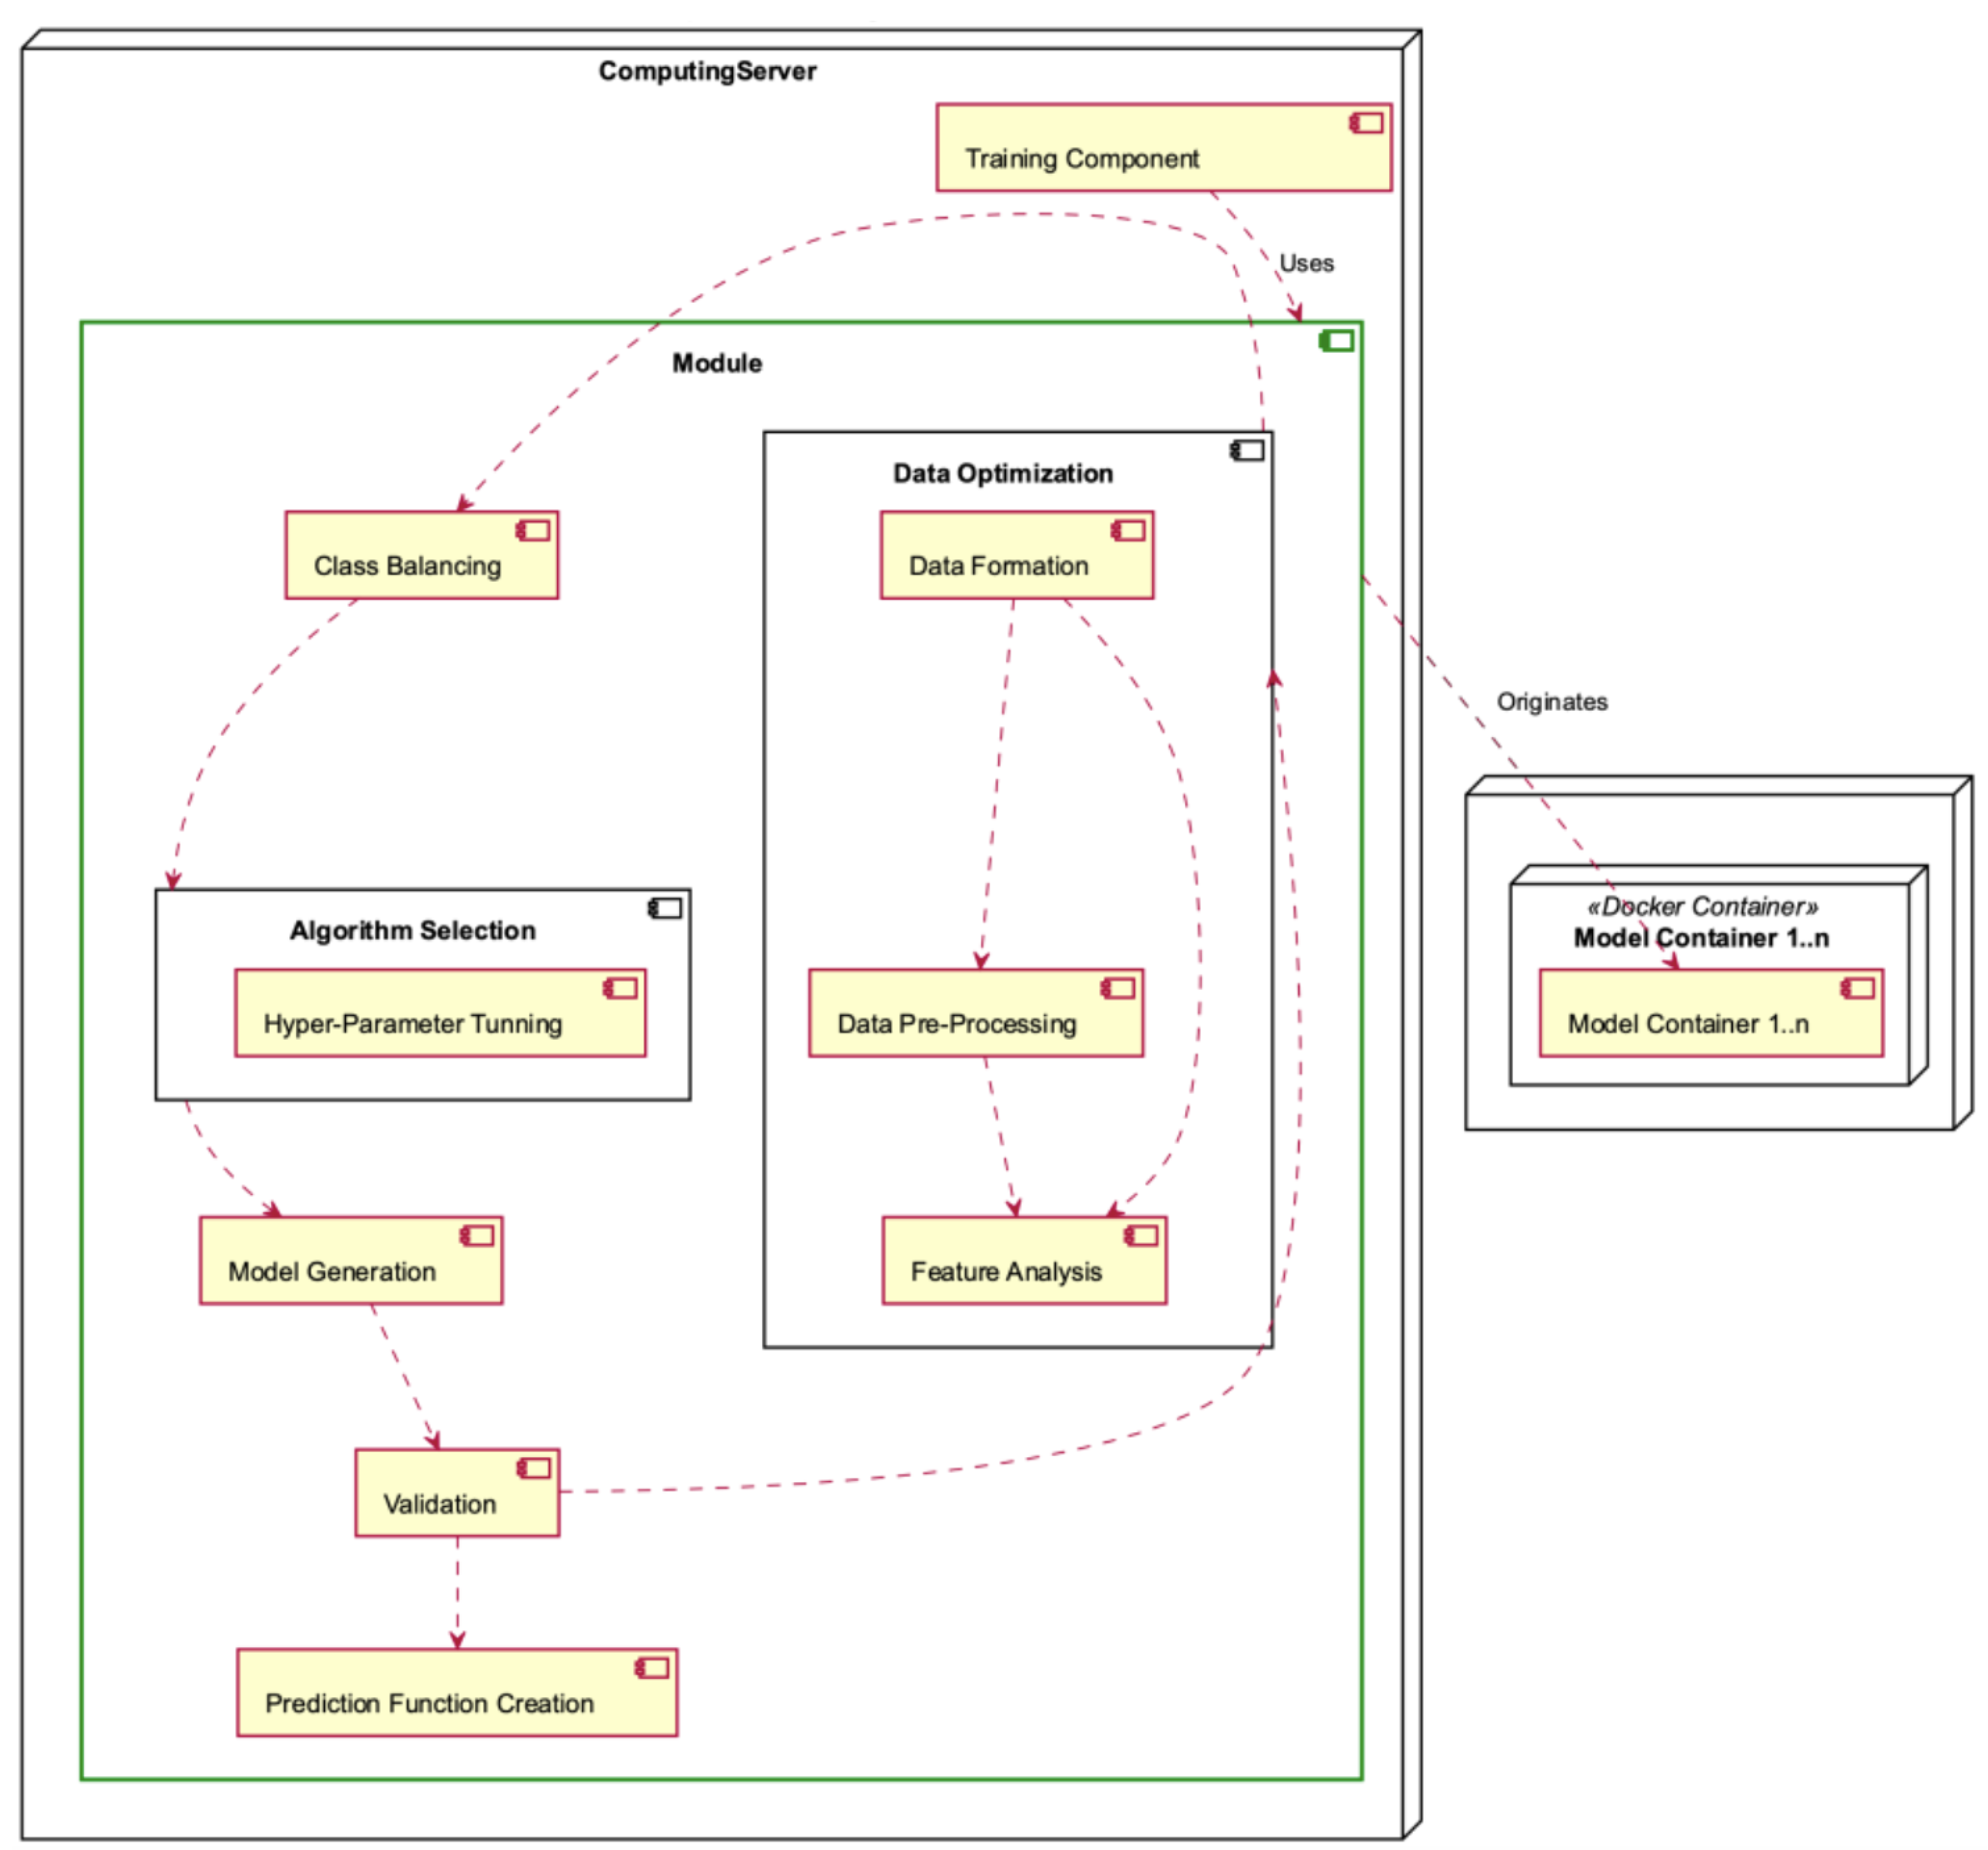
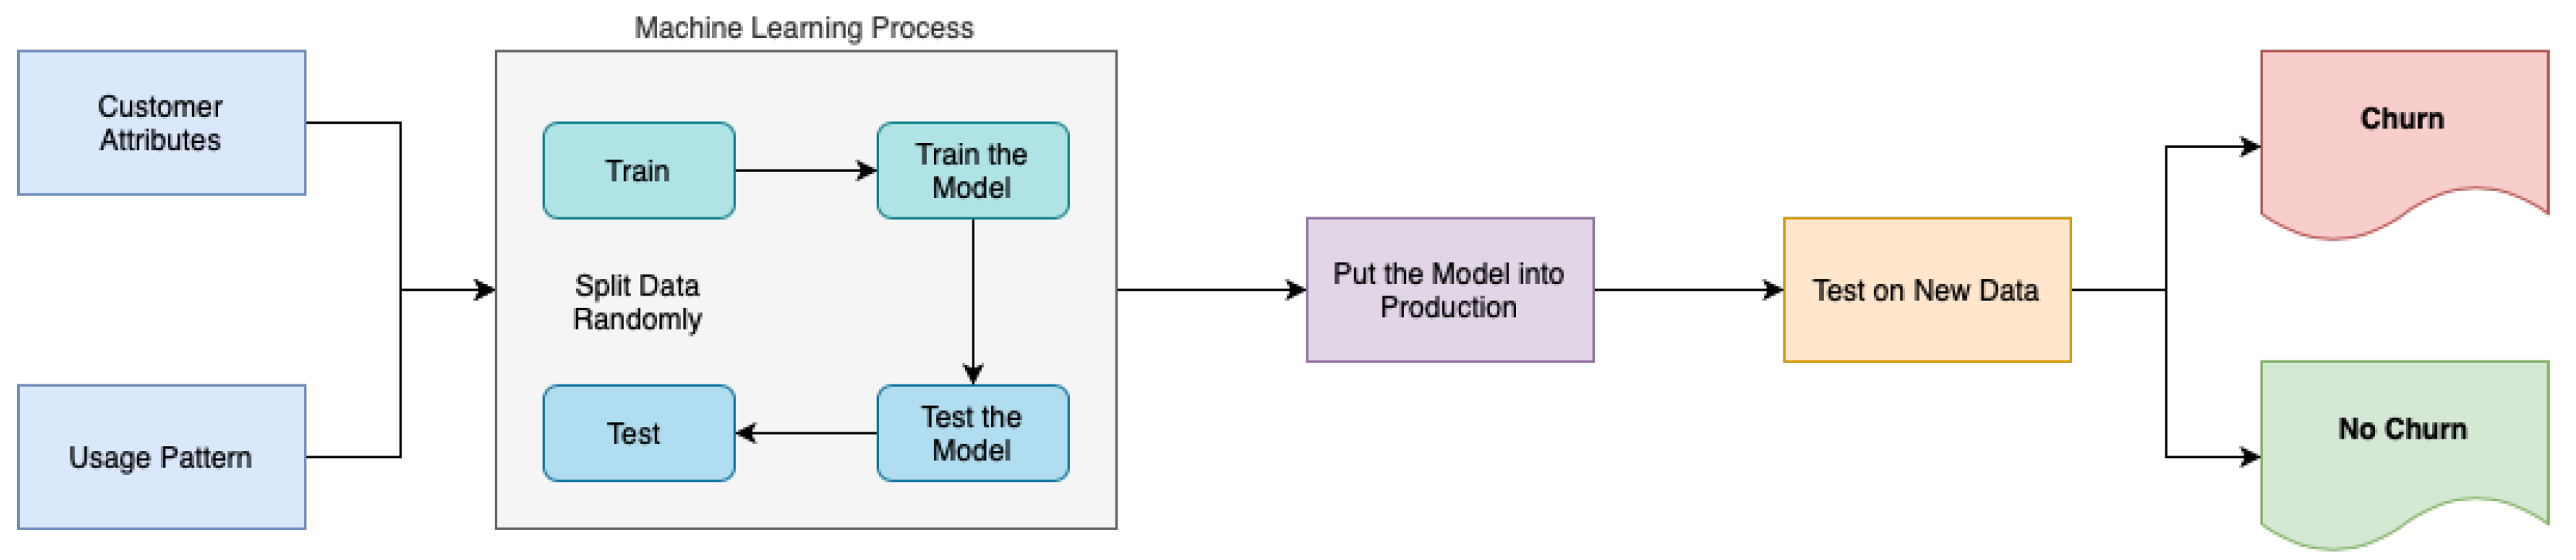

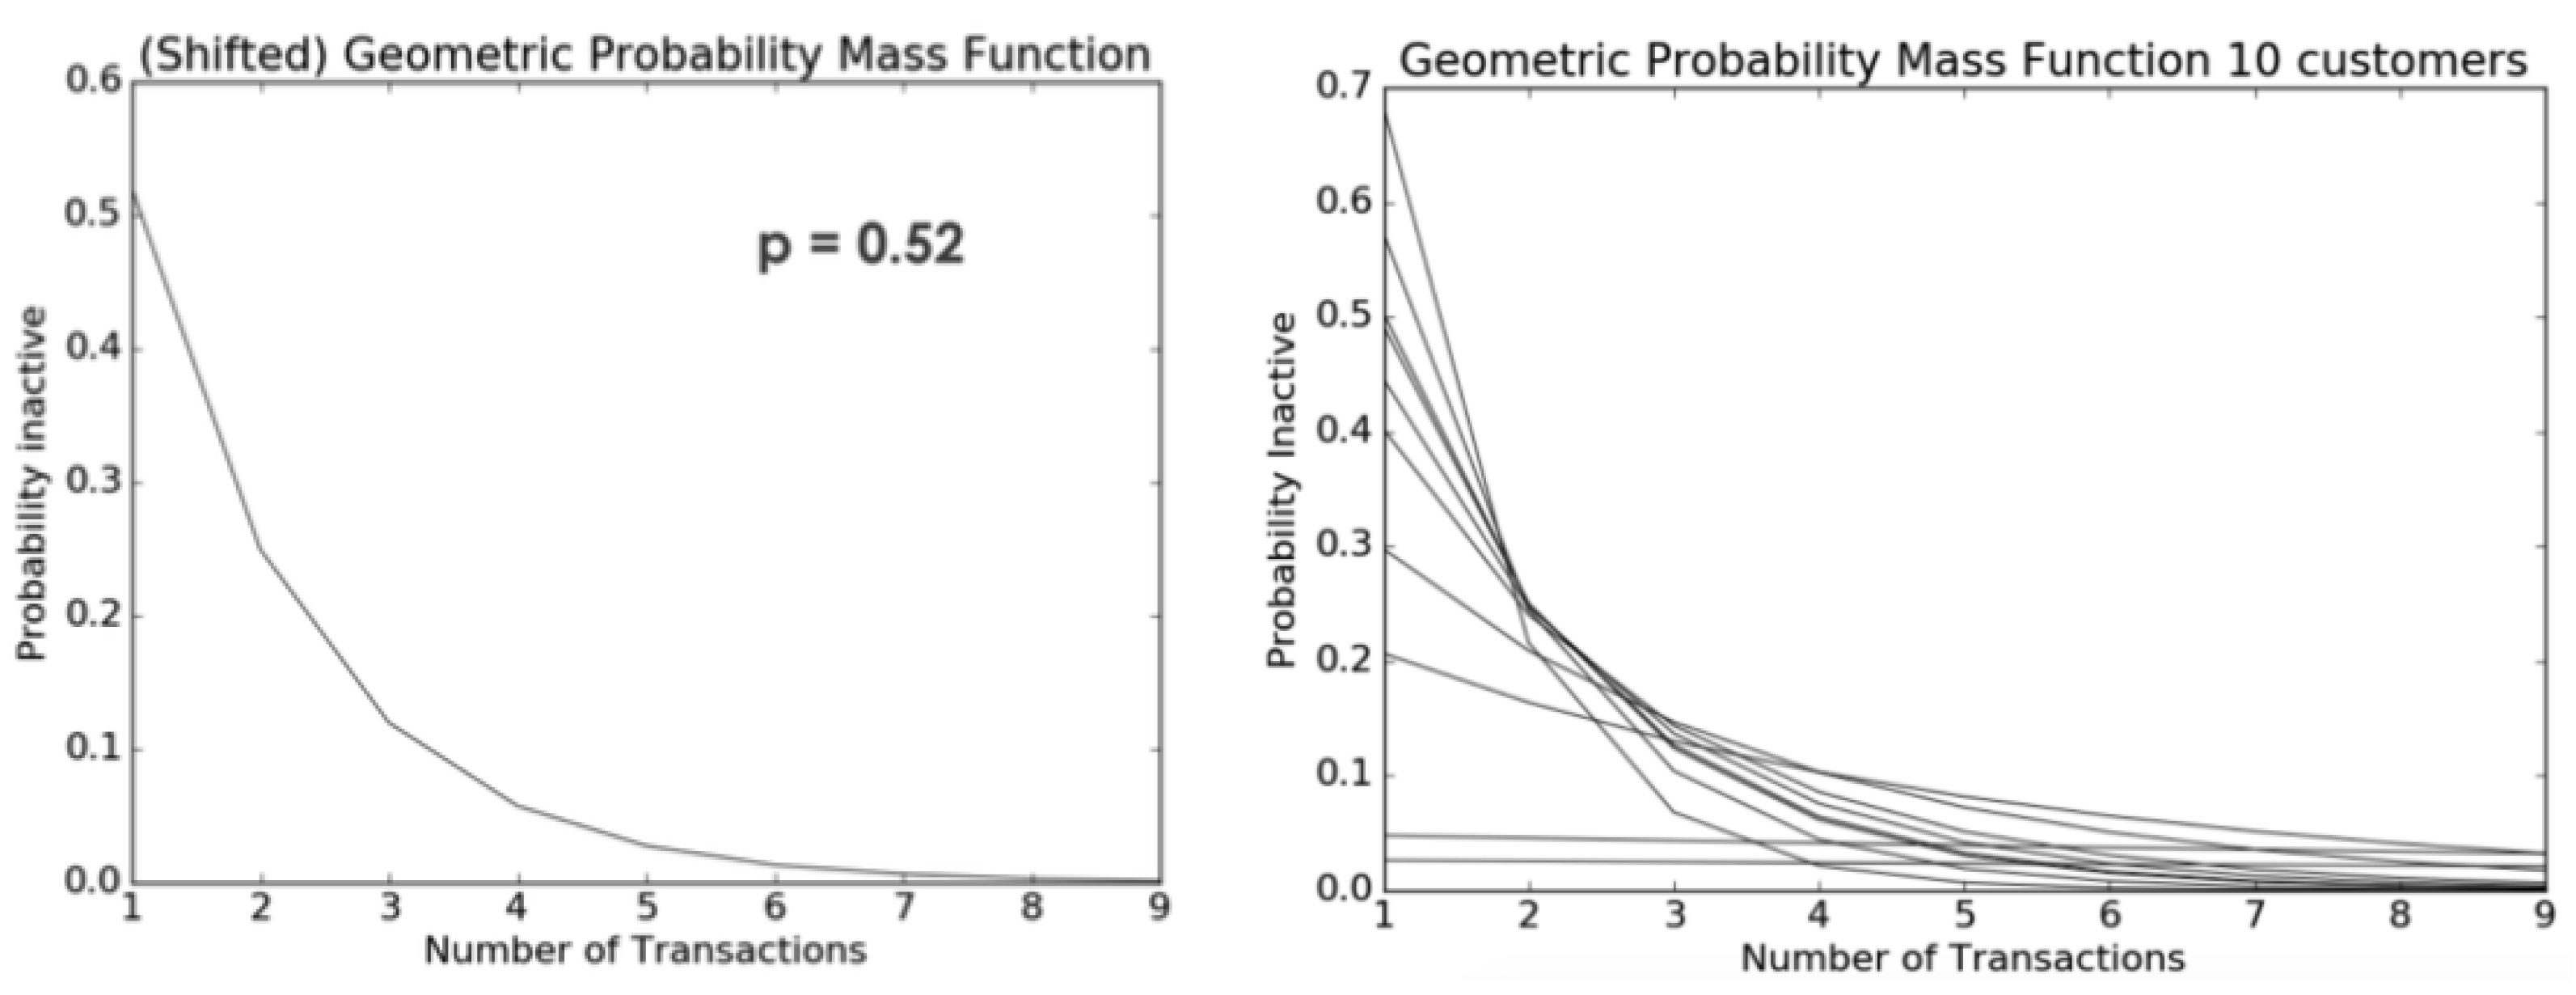
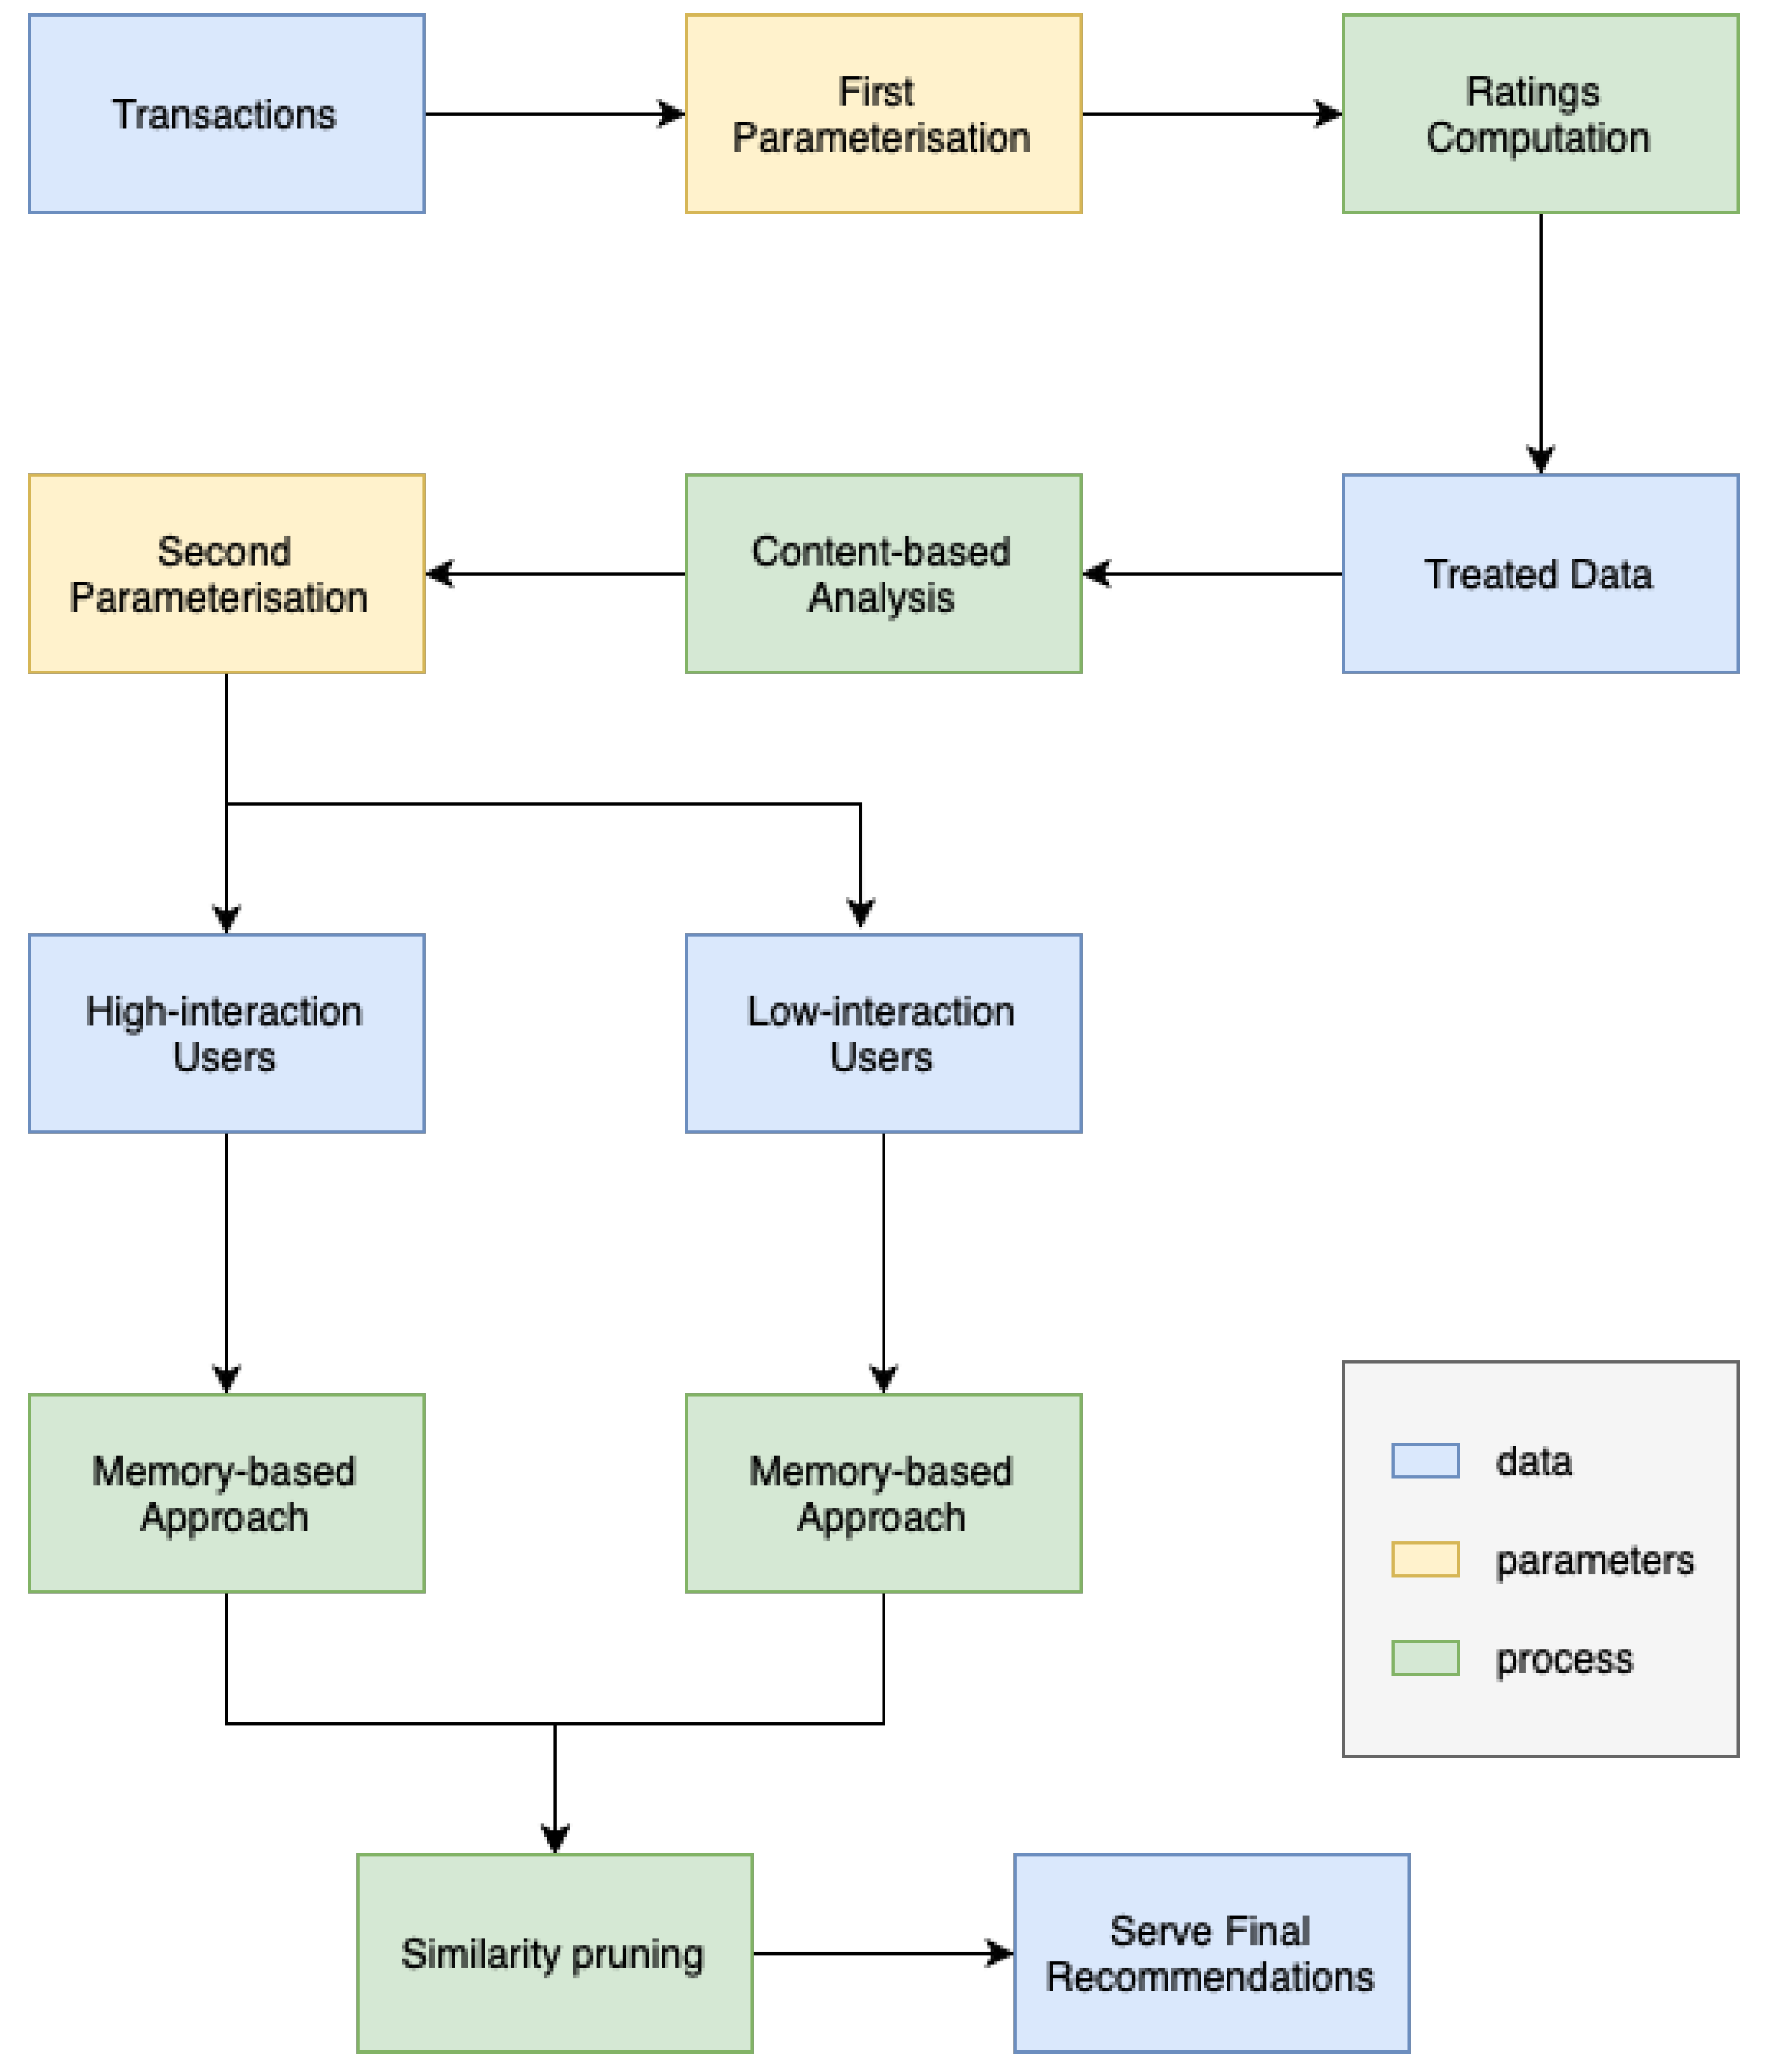
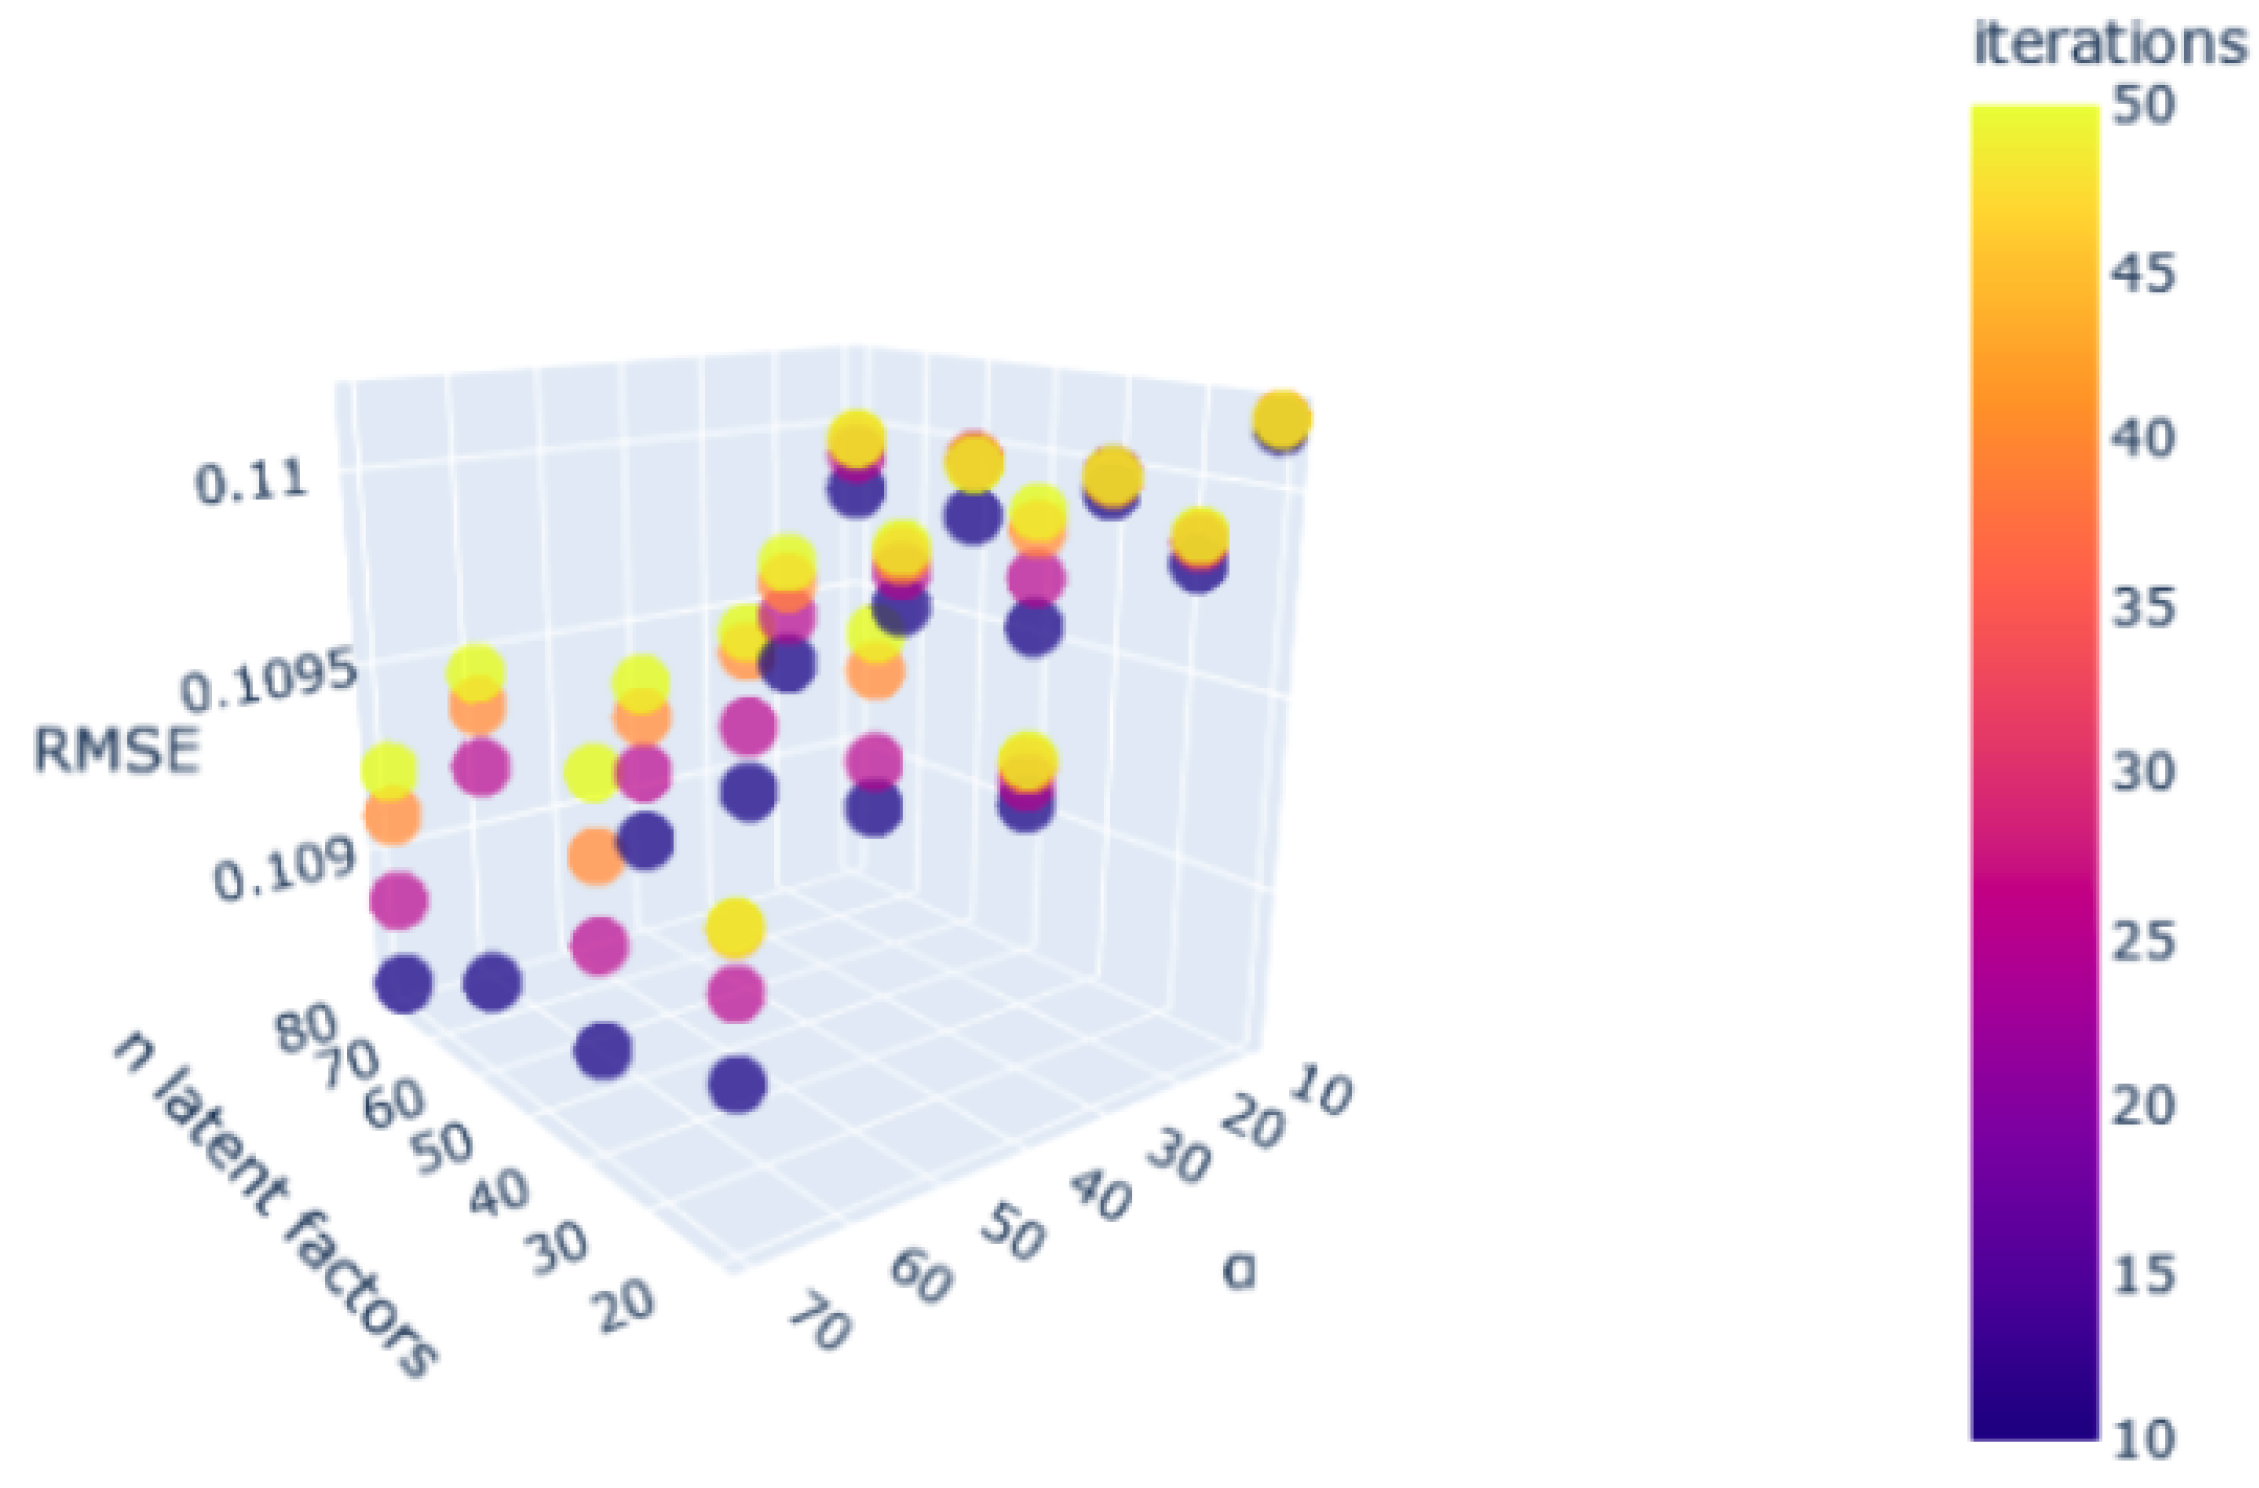

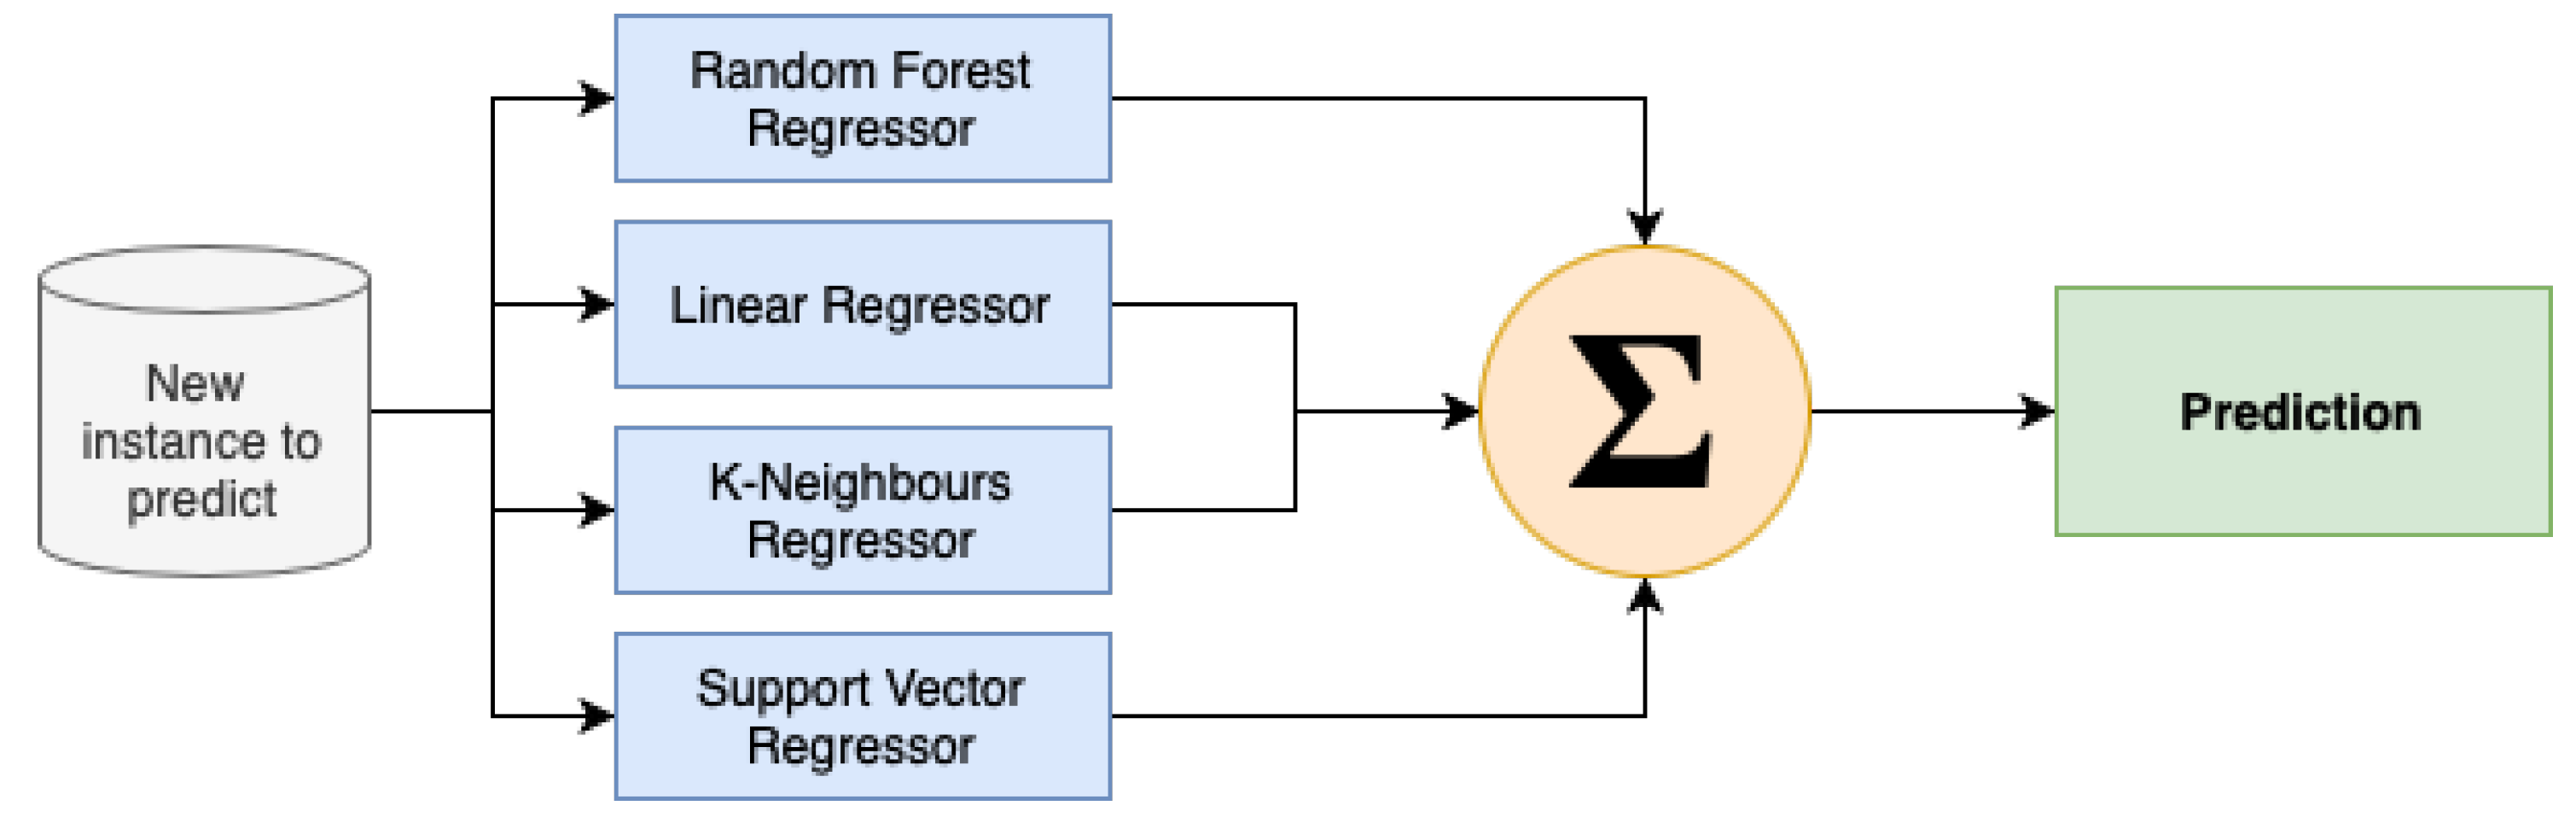
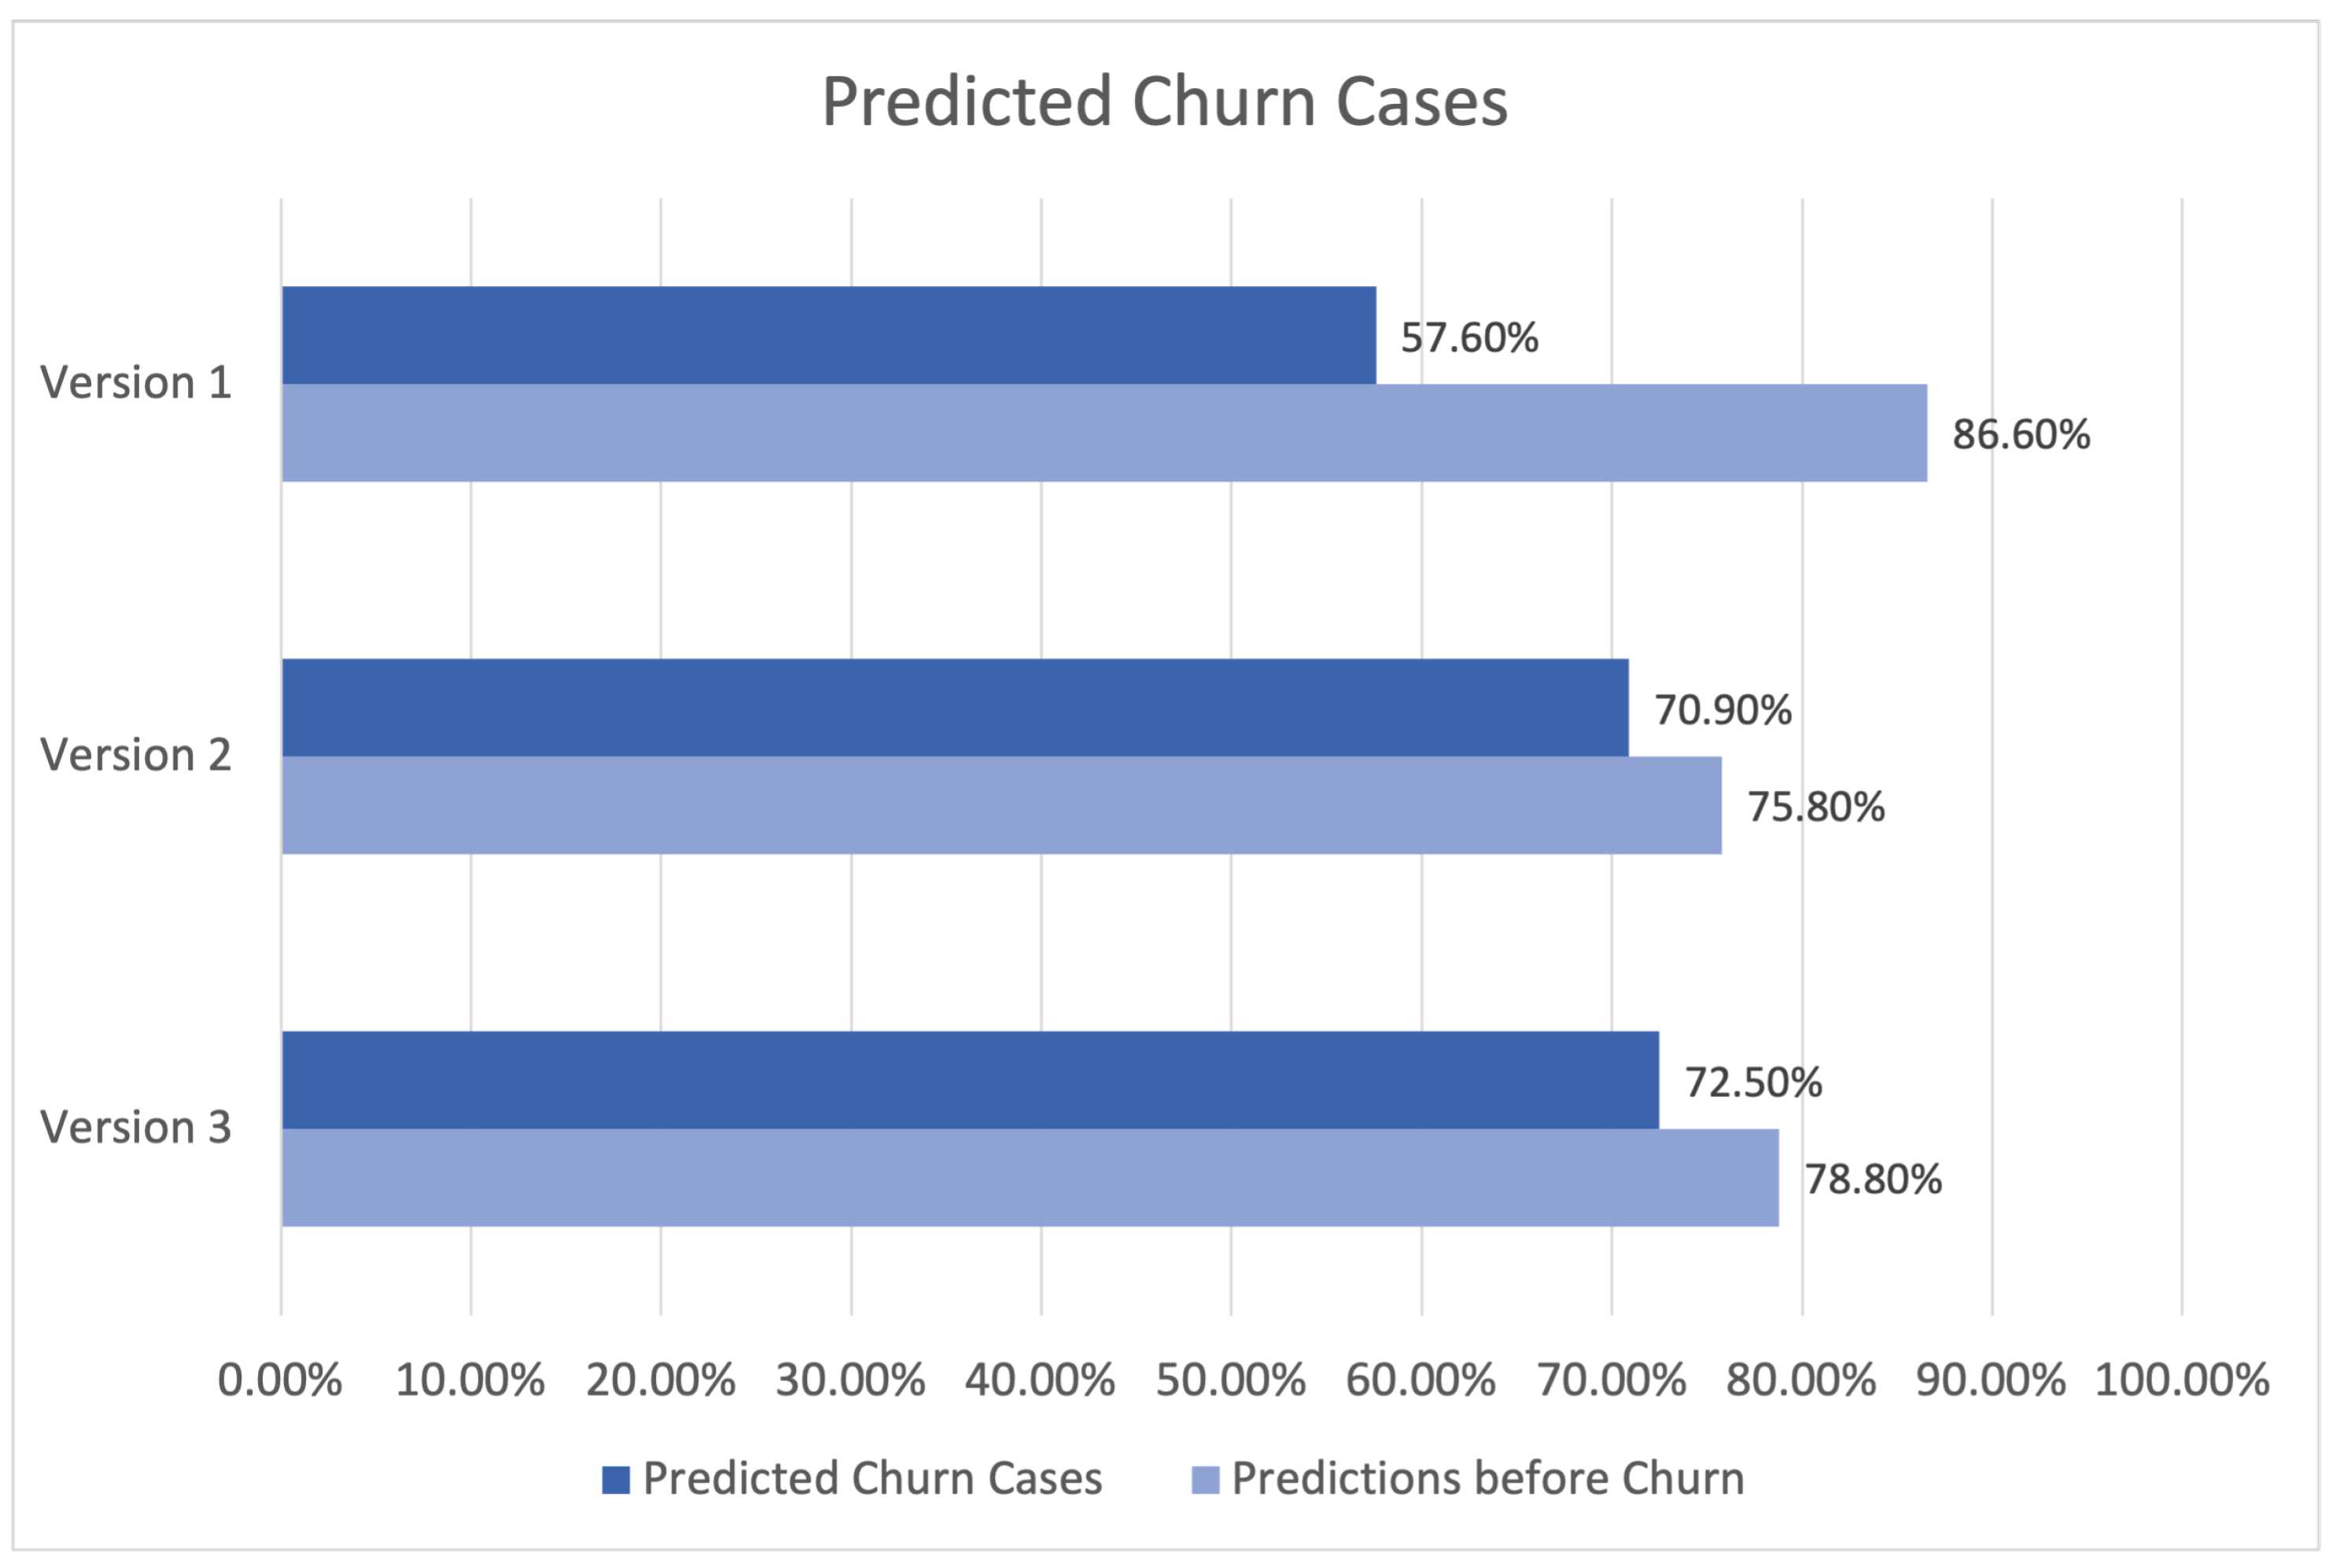
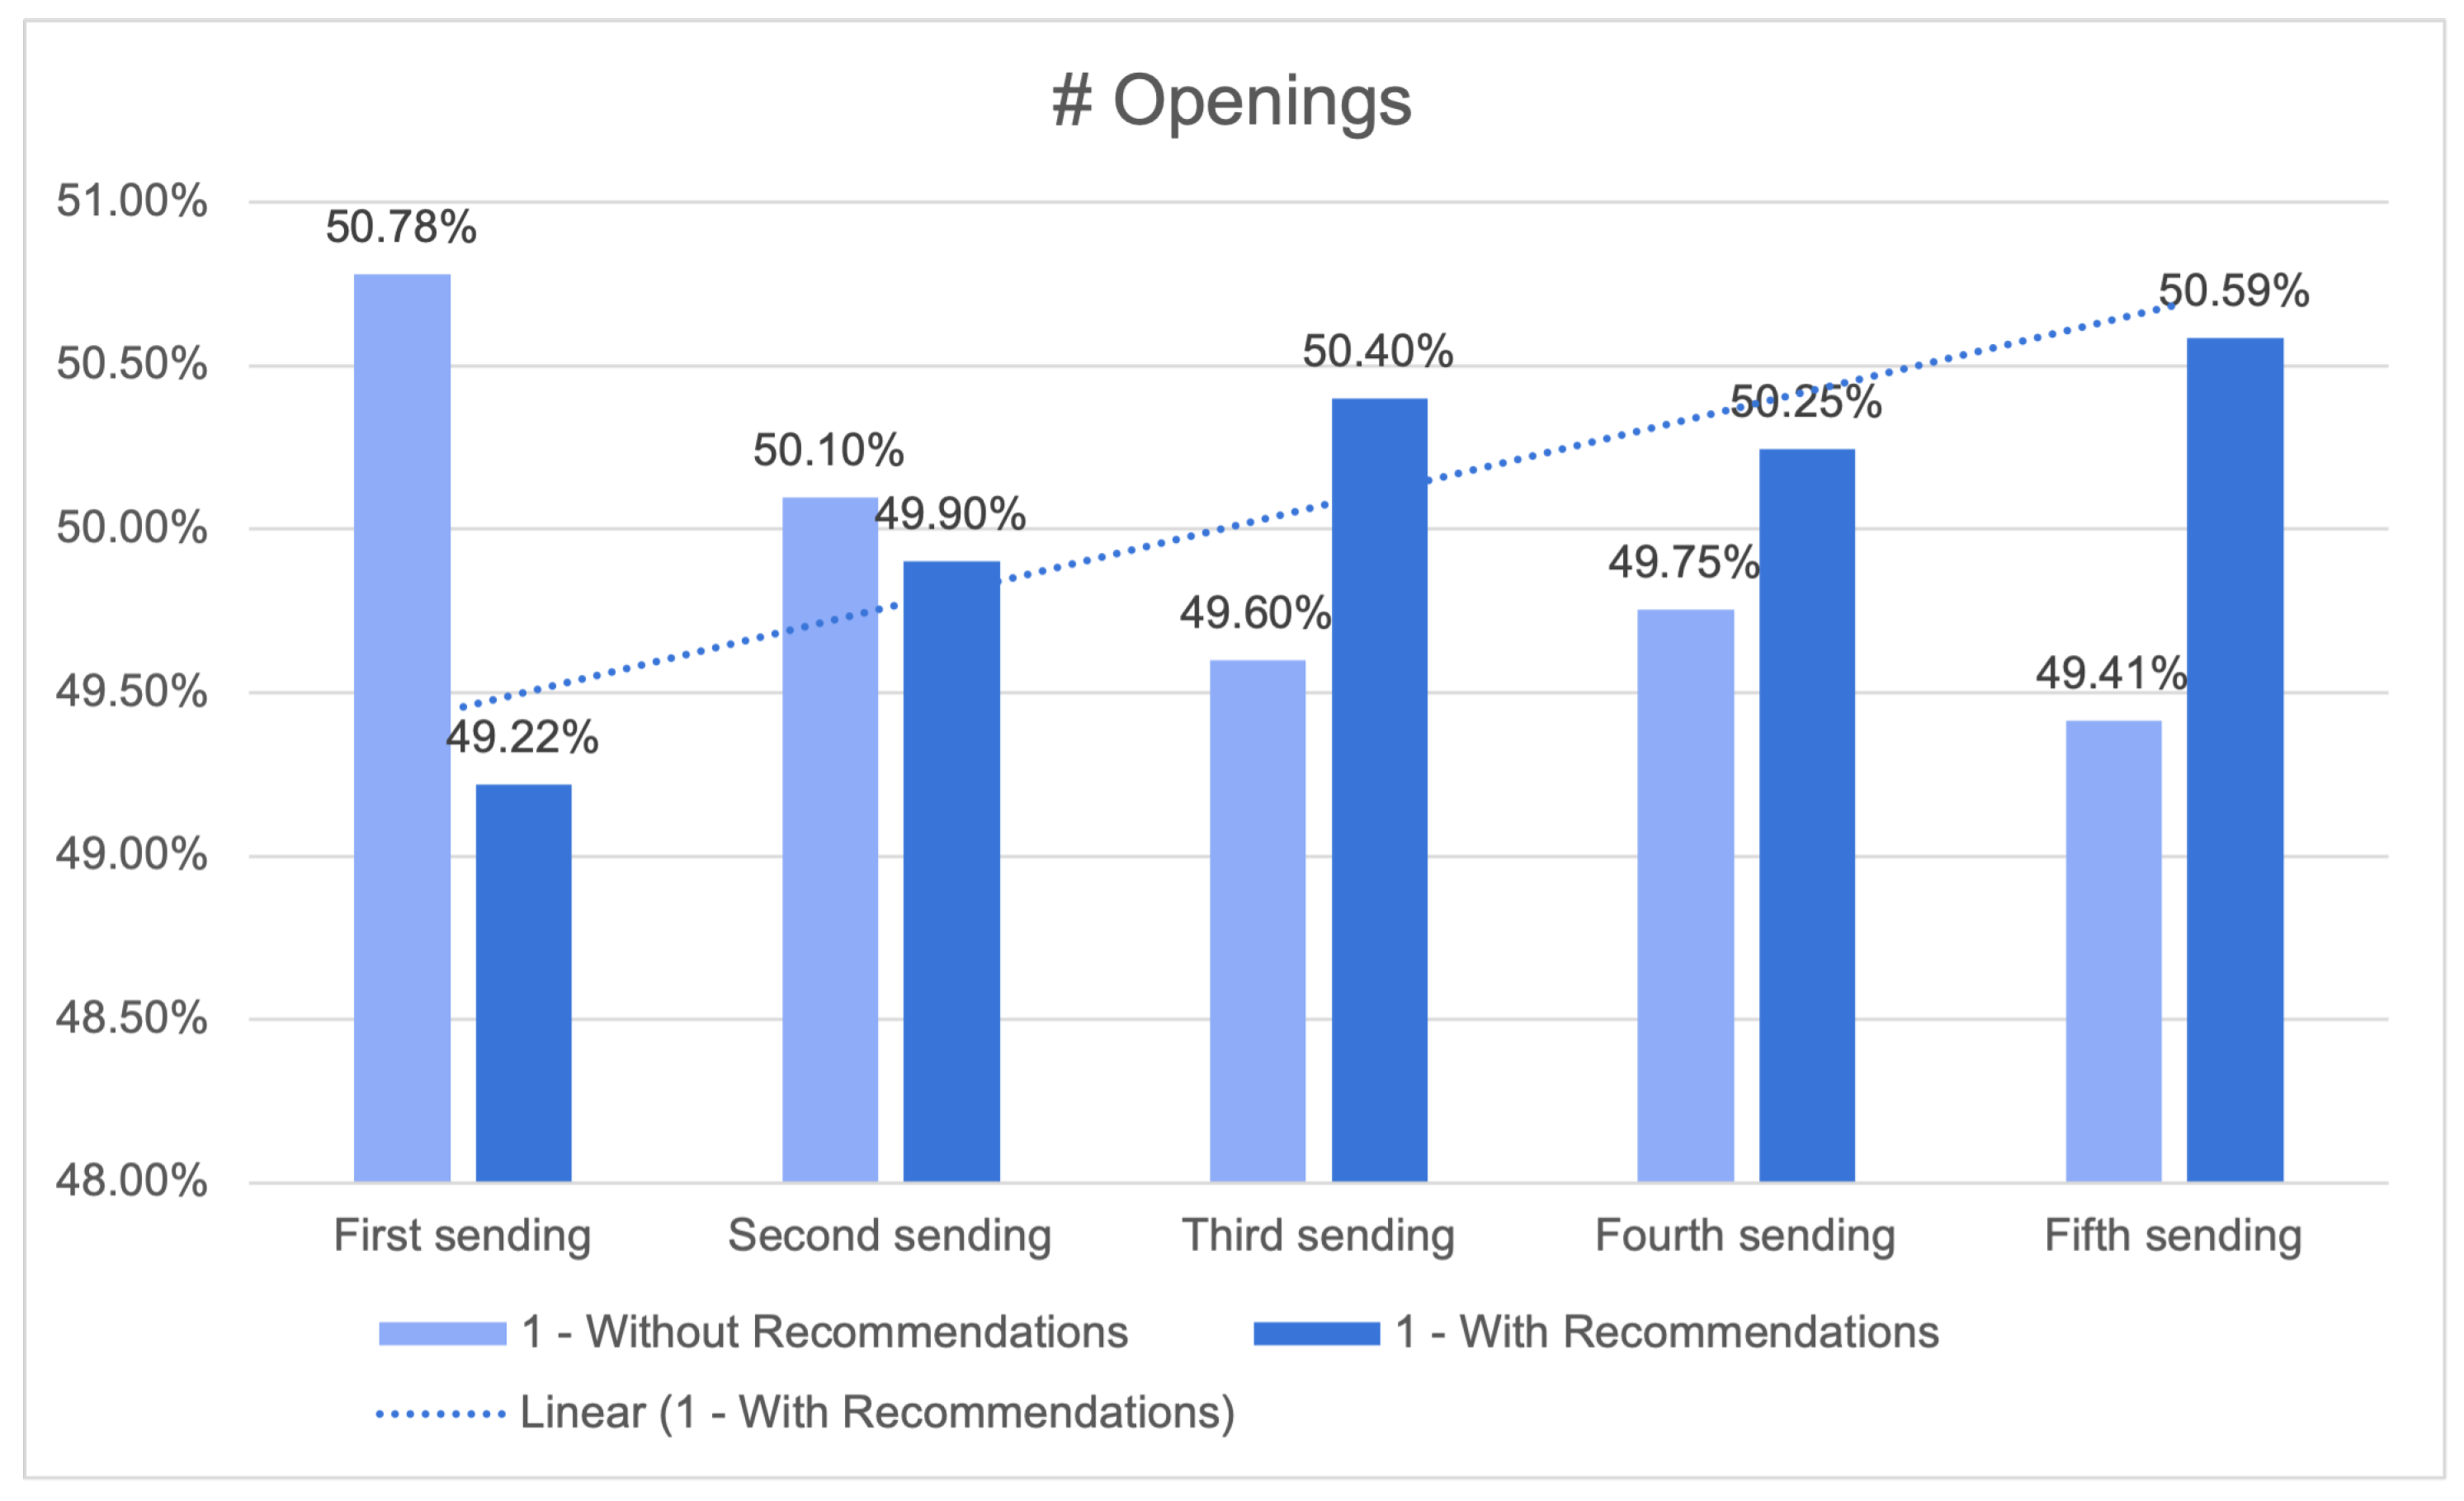
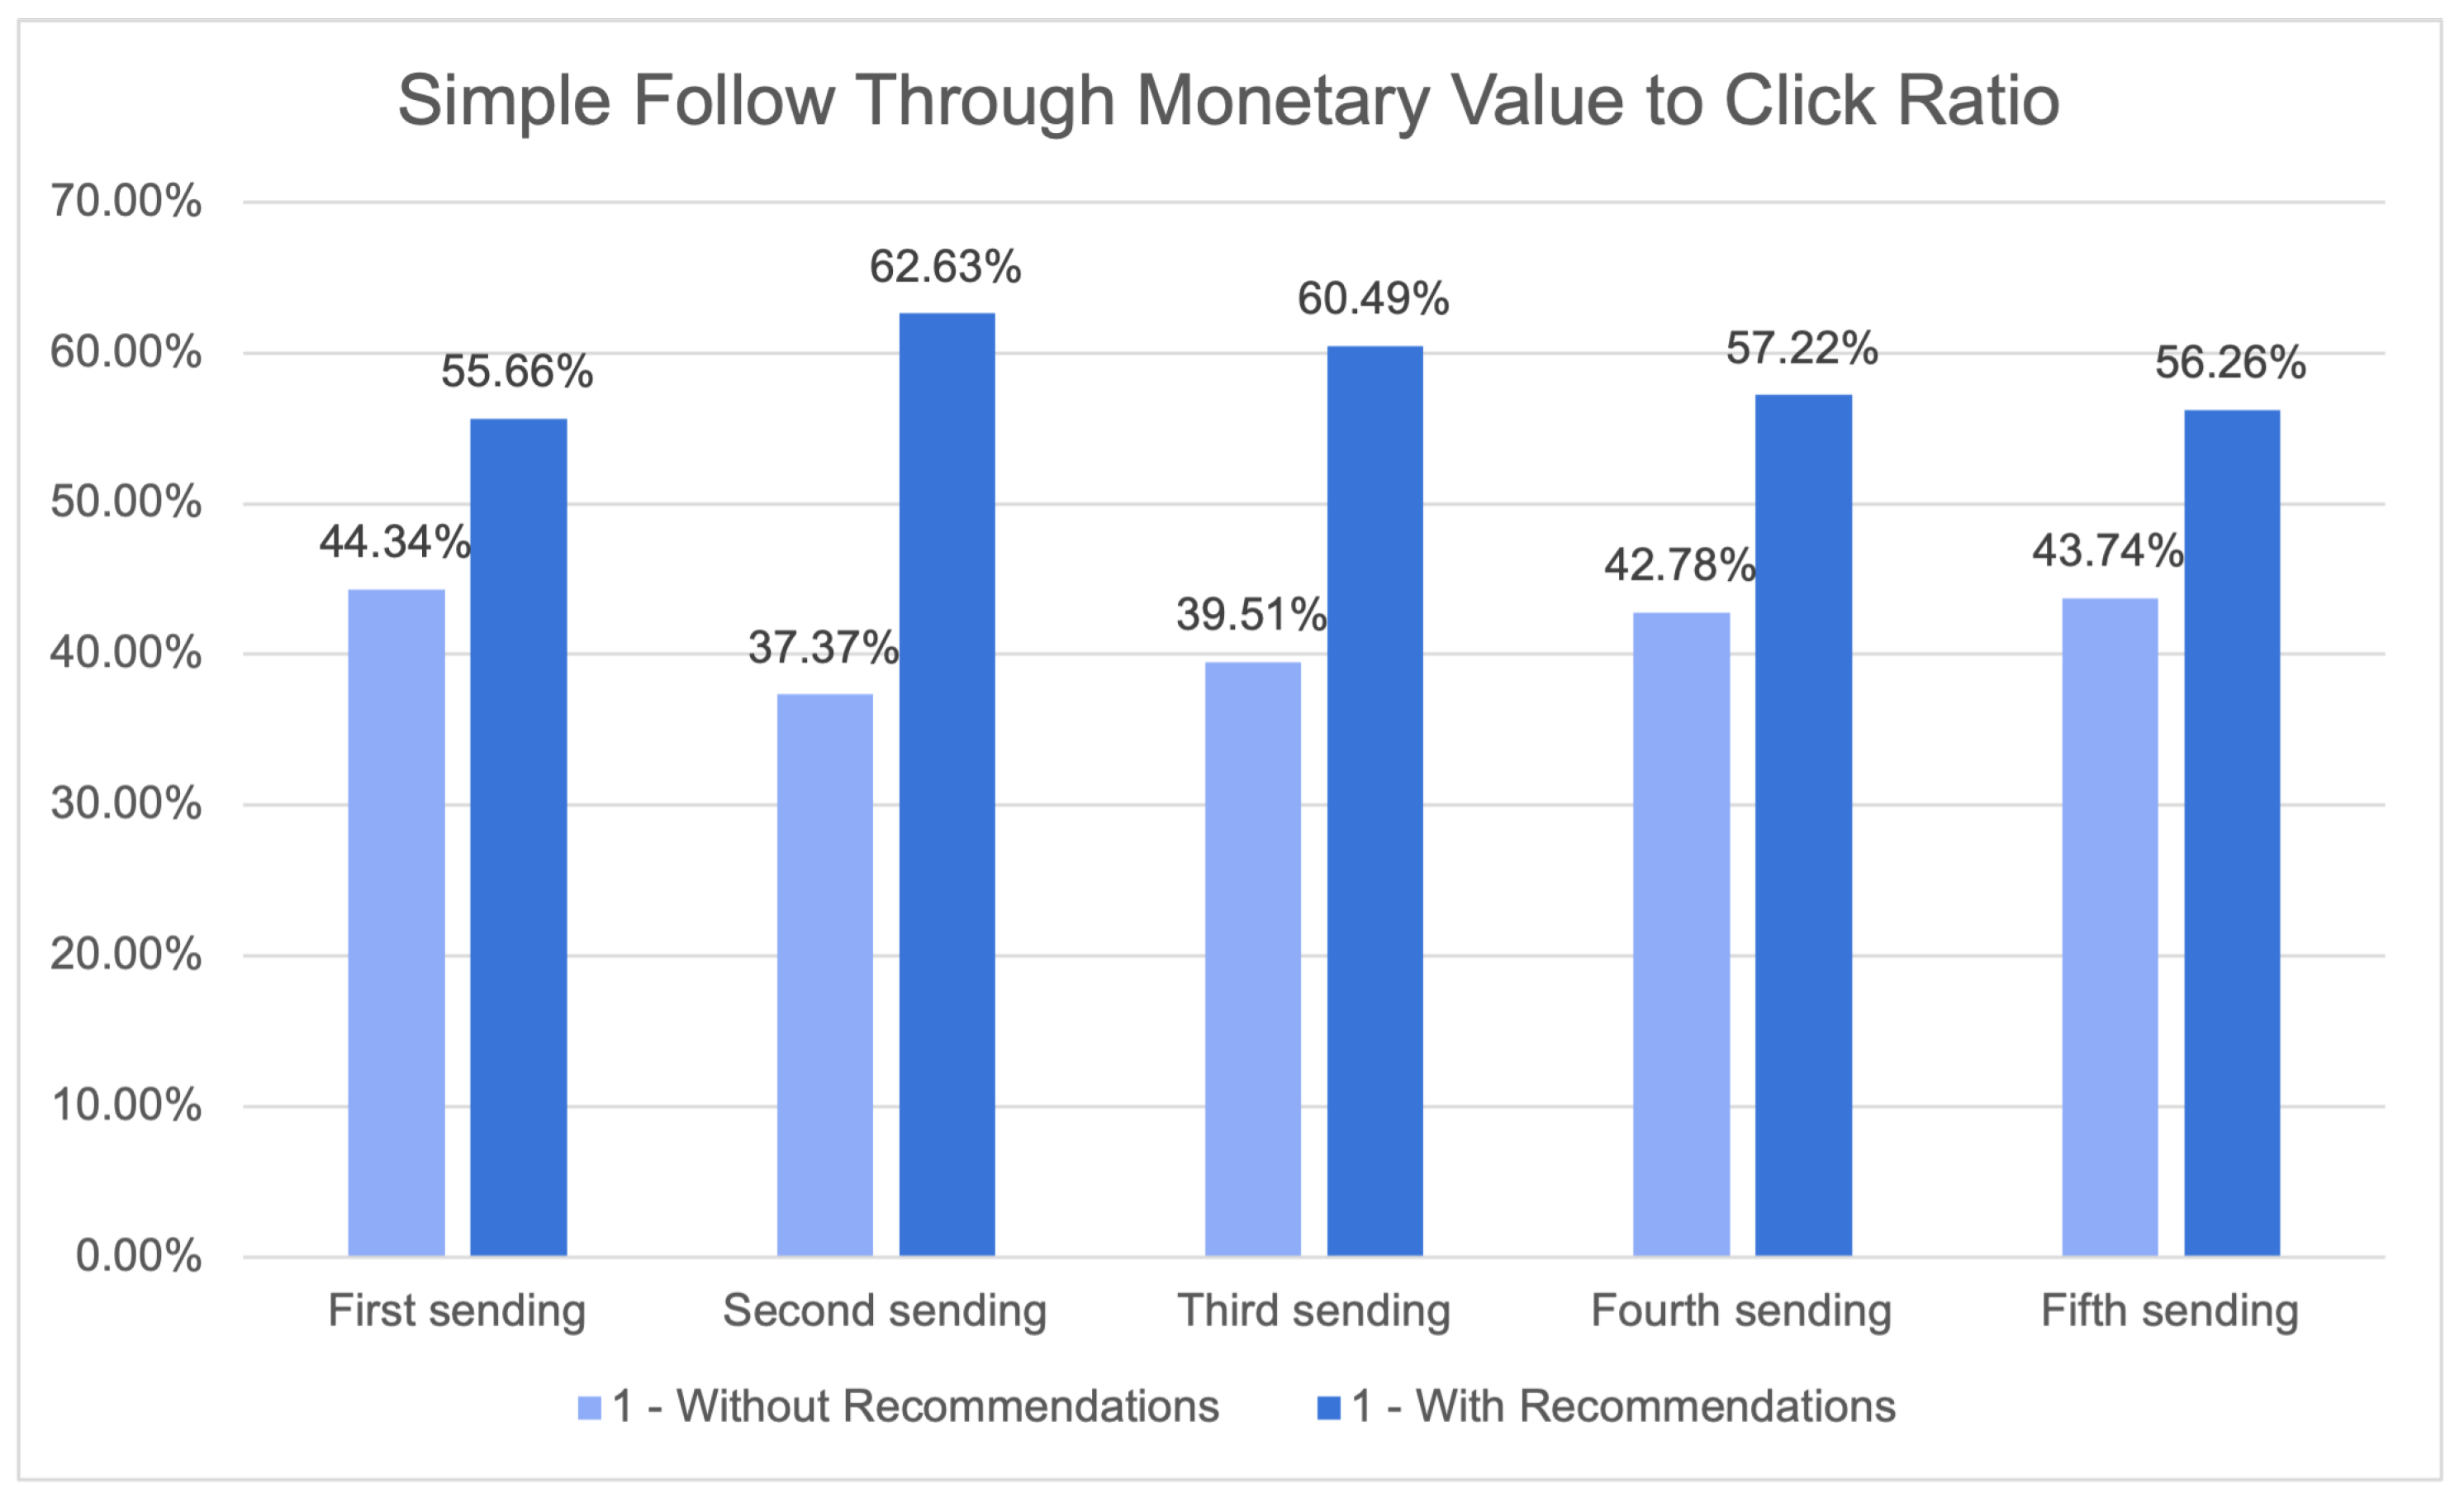
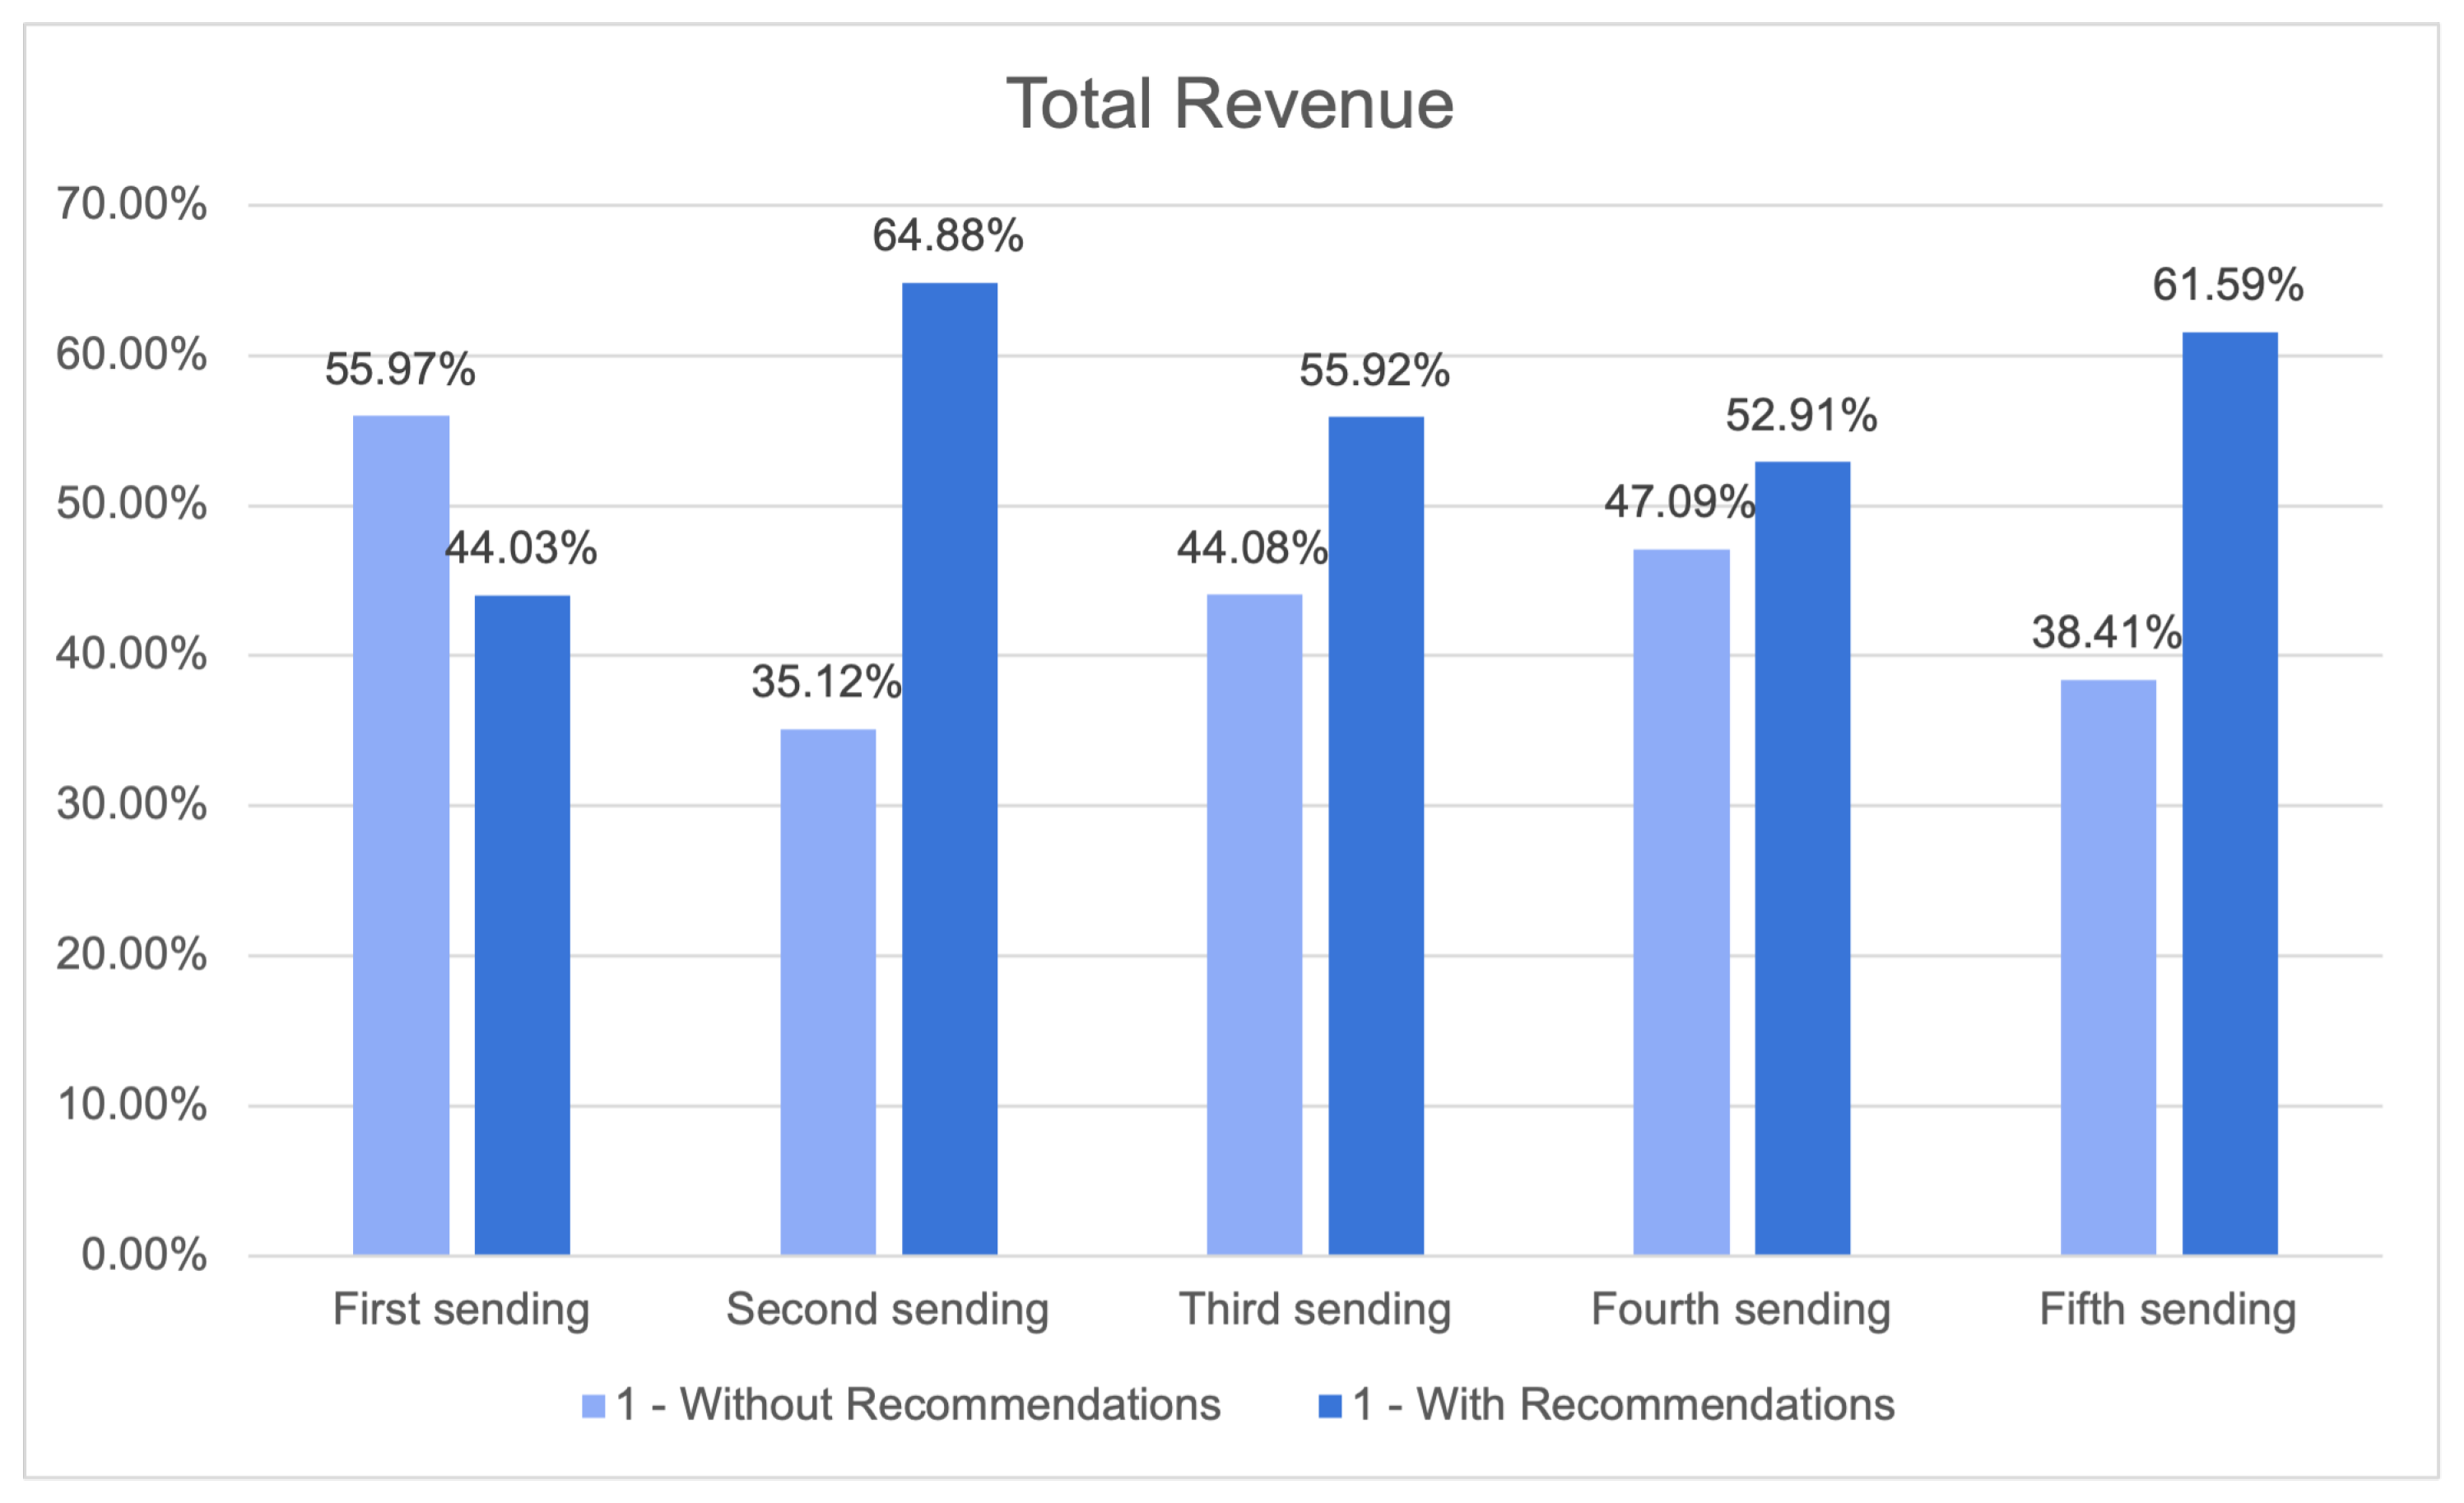


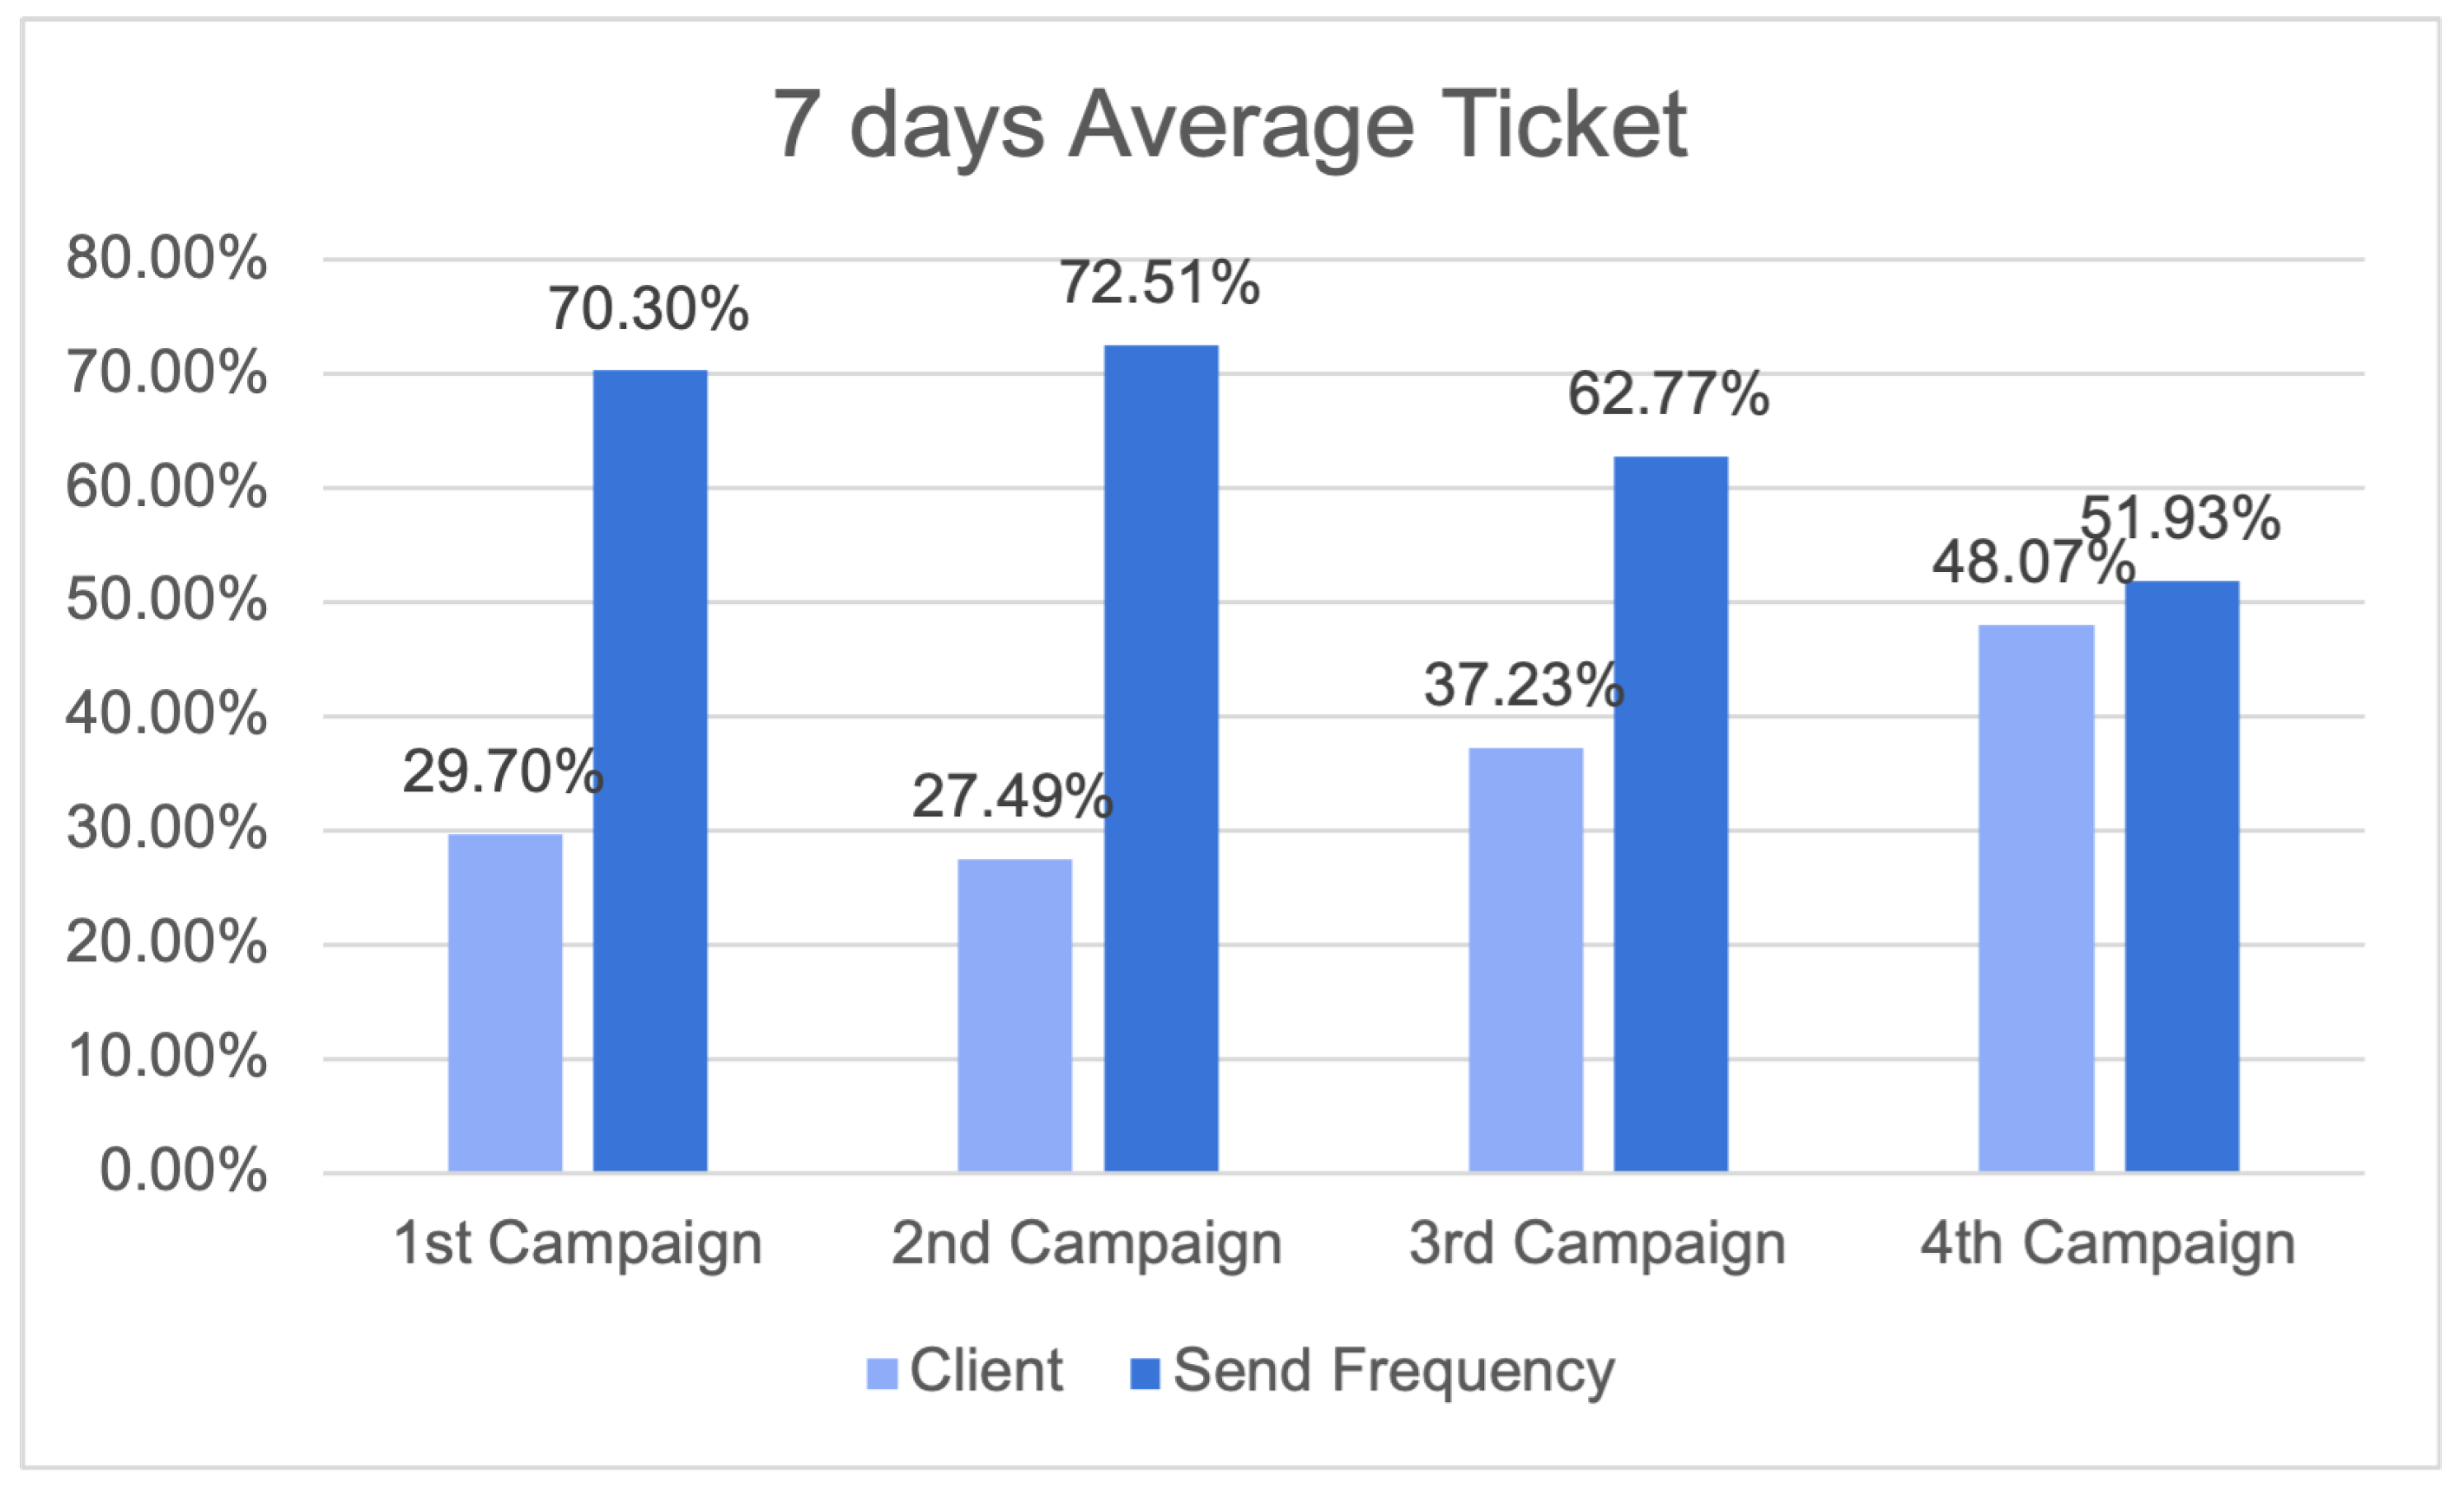
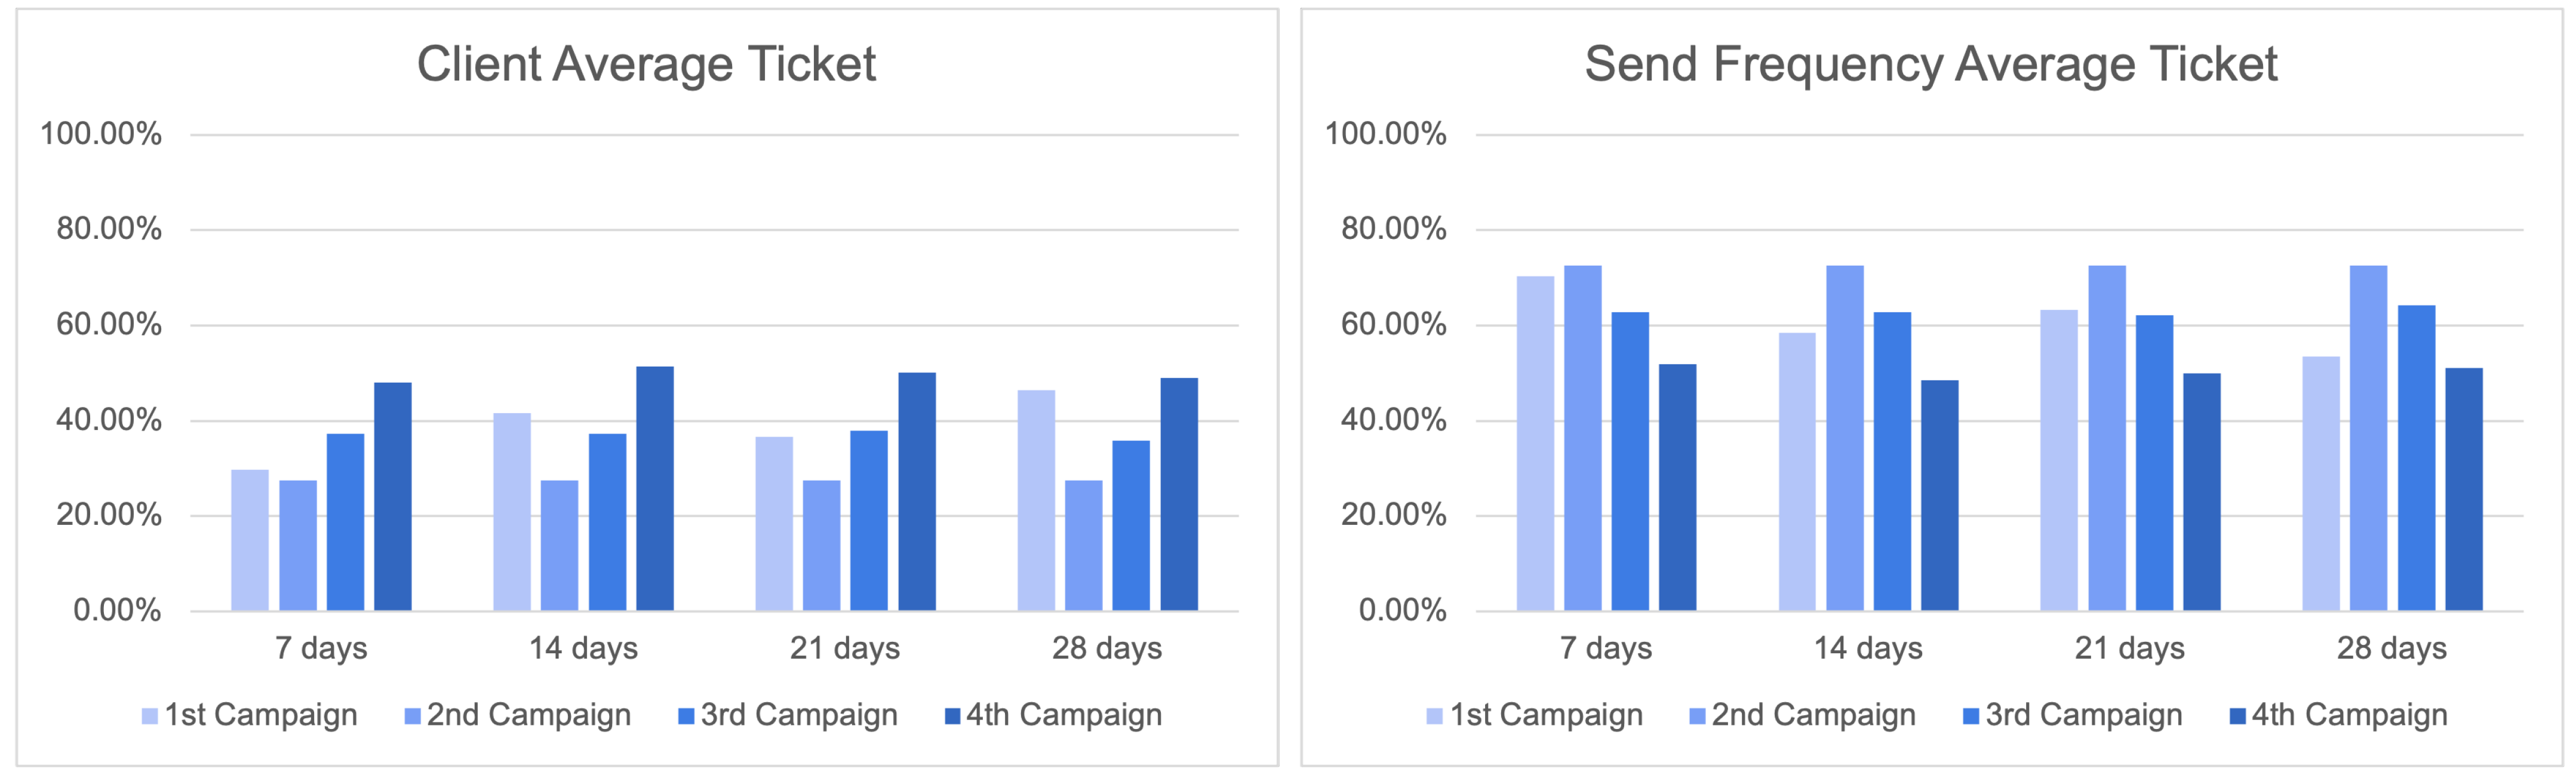
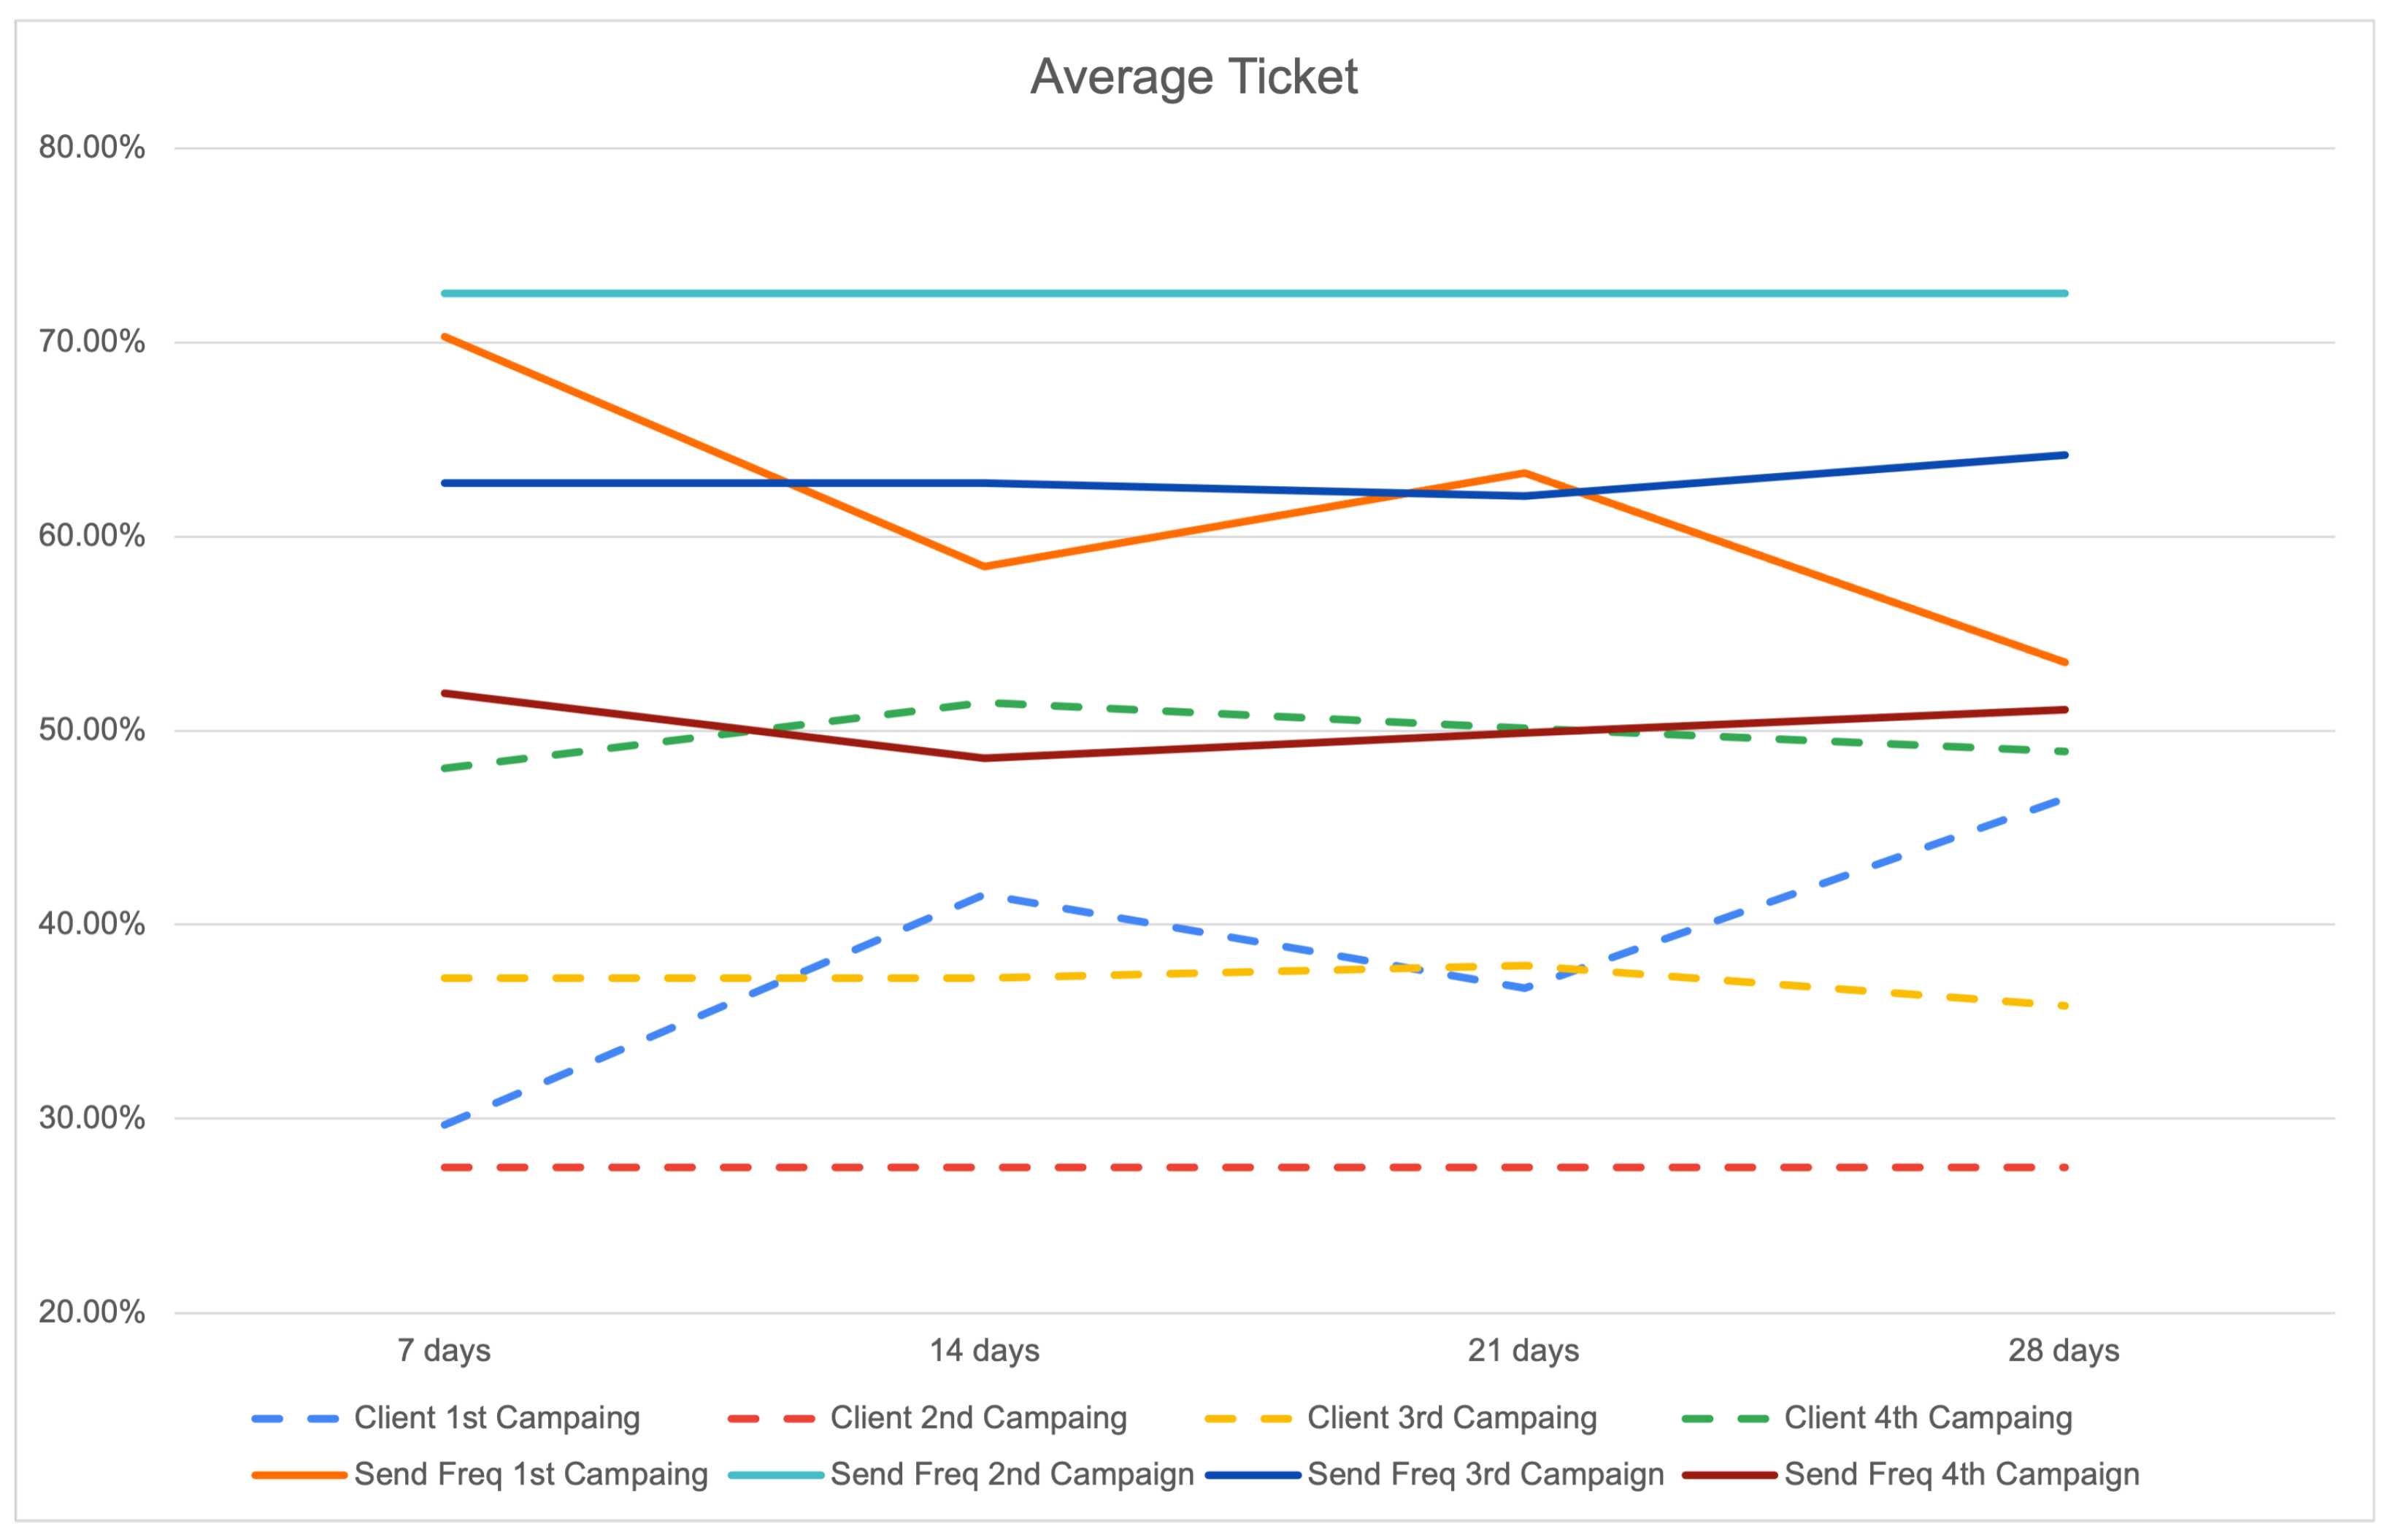
Disclaimer/Publisher’s Note: The statements, opinions and data contained in all publications are solely those of the individual author(s) and contributor(s) and not of MDPI and/or the editor(s). MDPI and/or the editor(s) disclaim responsibility for any injury to people or property resulting from any ideas, methods, instructions or products referred to in the content. |
© 2024 by the authors. Licensee MDPI, Basel, Switzerland. This article is an open access article distributed under the terms and conditions of the Creative Commons Attribution (CC BY) license (https://creativecommons.org/licenses/by/4.0/).